Measuring and Improving the Reliability of Wide …papers.…Measuring and Improving the Reliability...
10
Measuring and Improving the Reliability of Wide-Area Cloud Paths Osama Haq, Mamoon Raja, and Fahad R. Dogar Tufts University Abstract Many popular cloud applications use inter-data center paths; yet, little is known about the characteristics of these “cloud paths”. Over an eighteen month period, we measure the inter-continental cloud paths of three providers (Amazon, Google, and Microsoft) using client side (VM-to-VM) measurements. We find that cloud paths are more predictable compared to public Internet paths, with an order of magnitude lower loss rate and jitter at the tail (95th percentile and beyond) compared to public Internet paths. We also investigate the nature of packet losses on these paths (e.g., random vs. bursty) and potential reasons why these paths may be better in quality. Based on our insights, we consider how we can further improve the quality of these paths with the help of existing loss mitigation techniques. We demonstrate that using the cloud path in conjunction with a detour path can mask most of the cloud losses, resulting in up to five 9’s of network availability for applications. 1. INTRODUCTION To meet the performance and regulatory needs of customers, major cloud providers host data centers all around the world. Many cloud applications involve communication between these data centers; this include applications like wide area data analytics [44], distributed storage [45, 42], and user facing applications like search and video conferencing [16, 46]. Despite the active use of these inter-data center (cloud) paths, little is known about the characteristics of these cloud paths. For example, are these cloud paths similar to the public Internet paths, or different? Also, are there differences between cloud providers, and which provider should an application choose depending on its requirements? To help answer these questions, we conduct a measurement study of cloud paths belonging to three major cloud providers: Google, Microsoft, and Amazon. All of our measurements are done between virtual machines (VM) located in different continents – it captures the expected performance received by a tenant who is running a geo-distributed cloud service. Our study spans a period of eighteen months and includes both a longitudinal analysis of important cloud path properties (e.g., loss rate, latency, etc) as well as an in-depth analysis of the nature of losses on these paths (bursty vs. random). We also compare cloud path characteristics with properties of public Internet paths, using inter-continental paths between PlanetLab [8] and Pinger [7] nodes. ©2017 International World Wide Web Conference Committee (IW3C2), published under Creative Commons CC BY 4.0 License. WWW 2017, April 3–7, 2017, Perth, Australia. ACM 978-1-4503-4913-0/17/04. DOI: http://dx.doi.org/10.1145/3038912.3052560 We find that in terms of cloud providers there is no clear winner – each cloud provider outperforms others on some metric (e.g., low loss rates on some paths but not on all paths). However, we do find that cloud path performance is more predictable compared to the public Internet paths. We find that: • Cloud paths experience lower packet loss than an average Internet path; their loss rates are between 0.01% - 0.1% as compared to average public Internet loss rates of 0.1% - 1% [24, 18, 10, 38, 14, 41, 33]. The main difference arises because of the tail: even the worst cloud path has a loss rate lower than 0.07% whereas more than 5% of the public Internet paths had a loss rate of more than 2%. • Cloud paths have lower tail jitter compared to Internet paths. We observed that latency on the cloud paths is quite predictable and the variation is mostly within 30% while Internet paths can have high jitter (>65%). • Cloud paths have high inter-VM bandwidth, with high perfor- mance VMs of some providers getting up to 9Gbps bandwidth across their inter-continental paths. This performance is an order of magnitude higher than typical throughput achieved over the wide area public Internet paths [24, 1]. We also analyze the reasons behind these differences. Our autonomous system (AS) level path analysis confirms anecdotal evidence that cloud providers have “dedicated” paths between their data centers. Specifically, all cloud paths of Google and Microsoft, and most paths of Amazon, span only their own ASes. These dedicated cloud paths are therefore more likely to be well provisioned and better engineered than typical wide area paths, with cloud providers possibly using a logically centralized controller (e.g., B4 [31], SWAN [28]) for traffic engineering and reliability. To illustrate the broader implications of our findings, we conduct a case study in which we investigate the following question: can we further improve the availability of cloud paths, so they can offer near zero loss rate for wide area communication? A positive answer to this question can improve the quality of today’s interactive applications (e.g., video conferencing, online gaming), facilitate the widespread use of emerging applications like tele-presence and remote surgery, and potentially be the driving force behind future, yet-to-be-known, real time applications. Our results show that it is possible to offer such a WAN service that improves reliability of cloud paths. This observation is based on our finding that cloud paths experience two types of losses: random, isolated packet losses; and degradation periods that can last for several minutes, where most, if not all, packets are lost. Fortunately, both issues can be resolved using existing techniques. We show that forward error correction (FEC) can effectively mask random losses without incurring too much overhead, resulting in significant improvement for some cloud paths. More importantly, we show that one-hop detour routing [25] can avoid most degradation periods, 253
Transcript of Measuring and Improving the Reliability of Wide …papers.…Measuring and Improving the Reliability...

Measuring and Improving theReliability of Wide-Area Cloud Paths
Osama Haq, Mamoon Raja, and Fahad R. DogarTufts University
Abstract
Many popular cloud applications use inter-data center paths; yet,
little is known about the characteristics of these “cloud paths”. Over
an eighteen month period, we measure the inter-continental cloud
paths of three providers (Amazon, Google, and Microsoft) using
client side (VM-to-VM) measurements. We find that cloud paths are
more predictable compared to public Internet paths, with an order of
magnitude lower loss rate and jitter at the tail (95th percentile and
beyond) compared to public Internet paths. We also investigate the
nature of packet losses on these paths (e.g., random vs. bursty) and
potential reasons why these paths may be better in quality. Based on
our insights, we consider how we can further improve the quality of
these paths with the help of existing loss mitigation techniques. We
demonstrate that using the cloud path in conjunction with a detour
path can mask most of the cloud losses, resulting in up to five 9’s of
network availability for applications.
1. INTRODUCTION
To meet the performance and regulatory needs of customers, major
cloud providers host data centers all around the world. Many cloud
applications involve communication between these data centers; this
include applications like wide area data analytics [44], distributed
storage [45, 42], and user facing applications like search and video
conferencing [16, 46]. Despite the active use of these inter-data
center (cloud) paths, little is known about the characteristics of these
cloud paths. For example, are these cloud paths similar to the public
Internet paths, or different? Also, are there differences between
cloud providers, and which provider should an application choose
depending on its requirements?
To help answer these questions, we conduct a measurement study
of cloud paths belonging to three major cloud providers: Google,
Microsoft, and Amazon. All of our measurements are done between
virtual machines (VM) located in different continents – it captures
the expected performance received by a tenant who is running a
geo-distributed cloud service. Our study spans a period of eighteen
months and includes both a longitudinal analysis of important cloud
path properties (e.g., loss rate, latency, etc) as well as an in-depth
analysis of the nature of losses on these paths (bursty vs. random).
We also compare cloud path characteristics with properties of public
Internet paths, using inter-continental paths between PlanetLab [8]
and Pinger [7] nodes.
©2017 International World Wide Web Conference Committee
(IW3C2), published under Creative Commons CC BY 4.0 License.
WWW 2017, April 3–7, 2017, Perth, Australia.
ACM 978-1-4503-4913-0/17/04.
DOI: http://dx.doi.org/10.1145/3038912.3052560
We find that in terms of cloud providers there is no clear winner –
each cloud provider outperforms others on some metric (e.g., low loss
rates on some paths but not on all paths). However, we do find that
cloud path performance is more predictable compared to the public
Internet paths. We find that:
• Cloud paths experience lower packet loss than an average Internet
path; their loss rates are between 0.01% - 0.1% as compared to
average public Internet loss rates of 0.1% - 1% [24, 18, 10, 38,
14, 41, 33]. The main difference arises because of the tail: even
the worst cloud path has a loss rate lower than 0.07% whereas
more than 5% of the public Internet paths had a loss rate of more
than 2%.
• Cloud paths have lower tail jitter compared to Internet paths.
We observed that latency on the cloud paths is quite predictable
and the variation is mostly within 30% while Internet paths can
have high jitter (>65%).
• Cloud paths have high inter-VM bandwidth, with high perfor-
mance VMs of some providers getting up to 9Gbps bandwidth
across their inter-continental paths. This performance is an order
of magnitude higher than typical throughput achieved over the
wide area public Internet paths [24, 1].
We also analyze the reasons behind these differences. Our autonomous
system (AS) level path analysis confirms anecdotal evidence that
cloud providers have “dedicated” paths between their data centers.
Specifically, all cloud paths of Google and Microsoft, and most paths
of Amazon, span only their own ASes. These dedicated cloud paths
are therefore more likely to be well provisioned and better engineered
than typical wide area paths, with cloud providers possibly using a
logically centralized controller (e.g., B4 [31], SWAN [28]) for traffic
engineering and reliability.
To illustrate the broader implications of our findings, we conduct a
case study in which we investigate the following question: can we
further improve the availability of cloud paths, so they can offer near
zero loss rate for wide area communication? A positive answer to this
question can improve the quality of today’s interactive applications
(e.g., video conferencing, online gaming), facilitate the widespread
use of emerging applications like tele-presence and remote surgery,
and potentially be the driving force behind future, yet-to-be-known,
real time applications.
Our results show that it is possible to offer such a WAN service
that improves reliability of cloud paths. This observation is based on
our finding that cloud paths experience two types of losses: random,
isolated packet losses; and degradation periods that can last for
several minutes, where most, if not all, packets are lost. Fortunately,
both issues can be resolved using existing techniques. We show
that forward error correction (FEC) can effectively mask random
losses without incurring too much overhead, resulting in significant
improvement for some cloud paths. More importantly, we show
that one-hop detour routing [25] can avoid most degradation periods,
253

DC1 DC2
DC3
a) Cloud-Cloud Communication
Wide Area Data Analytics
datadata
processingUser
Back-end DC
b) User-Cloud Communication
User Facing Web Services
Front-end DC
User
DC2
c) User-User Communication
Interactive Applications
DC1
User
User
Figure 1: Different applications using the inter-data center (DC) paths (cloud paths)
resulting in very low loss rates for most cloud paths. We show that
detour routing is more effective for cloud paths as compared to typical
wide area Internet paths.
Overall, we make the following contributions in this paper:
• A longitudinal measurement study spanning one and a half years
which investigates cloud path properties of three major cloud
providers.
• An in-depth analysis of the nature of packet losses observed on
the cloud paths (i.e. loss characterization).
• Evaluation of the benefits of using existing loss mitigation
schemes (i.e., FEC, detour routing) to further improve the
availability of cloud paths.
We believe that the cloud paths are increasingly becoming an integral
part of the Internet ecosystem. Our findings are a first step towards un-
derstanding their path properties and their implications on application
performance.1
2. BACKGROUND
We highlight scenarios that use cloud paths, and then contextualize
our work in relation to prior measurement studies and other relevant
proposals.
2.1 Application Scenarios
We categorize applications that use cloud paths into three categories,
based on the underlying nature of their communication.
Fig 1a shows cloud-cloud communication, which includes appli-
cations like wide area data analytics [44, 43]. These applications
typically only use the network of the cloud provider (both intra and
inter data center network). Factors such as cost, throughput, and
latency are important for these applications.
A wide range of online services (e.g., search, online social network-
ing, geo-replicated cloud storage [45, 42], etc) fall in the category of
user-cloud communication (Fig 1b). The typical use case for such
applications is the following: client connects to a nearby front-end
data center, which may need to retrieve data from a back-end data
center, and the communication between the data centers uses the
cloud path. This type of communication can benefit from the typical
benefits of a split-transport approach [37, 23, 20, 22, 19], such as
shorter RTTs, local retransmissions, customized transport for cloud
paths, etc.
Finally, another growing use case of cloud paths is the user-user
communication (Fig 1c), which includes traditional P2P applications,
such as VoIP and online gaming. For example, in Google Hangout,
1 To facilitate reproducibility, we have made available summarized results of our
measurement study [5].
each end-point communicates with a relay server (typically hosted
in a nearby data center), and the relay servers communicate with
each other using the cloud path [46]. Such cloud enabled end-to-
end communication potentially provides several benefits, including
deployment of in-network services (inside the cloud) [36, 26] and the
benefits of a split-connection approach as discussed above.
2.2 Related Work
There is a large body of work that is relevant to the above scenarios.
Here we focus on the measurement studies and proposals that are
most relevant to our goal of understanding the characteristics of cloud
paths.
Cloud Measurements. Several measurement studies have analyzed
different networking aspects of cloud-based systems(e.g., [9, 24, 13,
34, 16, 45]). The studies have either focused on the intra-data center
networks (e.g., [9]) or the performance between the users and the
cloud (or content delivery network) (e.g., [16, 17, 15, 40, 45]). The
few studies that include inter-data center measurements [34, 47] have
mainly focused on inter-data center bandwidth whereas we conduct a
detailed analysis of path characteristics, such as loss, latency variation,
and packet reordering.
Internet based measurements. Our work is inspired by, and benefits
from, a large body of measurement work on Internet path characteris-
tics. This includes seminal studies by Bolot [14] and Paxson [38], and
insights by measurement based systems (e.g., RON [10], iplane [35],
etc). Throughout the paper, we refer to the insights provided by these
studies, and identify similarities and differences between Internet and
cloud path characteristics.
Inter Data Center Proposals. Recently, there is growing interest
in issues related to inter-data center networking. This includes
application of software defined networking (SDN) (e.g., SWAN [28],
B4 [28]) in such environments, techniques for specific workload
needs (e.g., application deadlines [47, 32]), and performing geo-
distributed analytics [43, 44]). While these systems offer valuable
insights regarding workloads and topologies, they do not focus on
path characteristics of cloud paths.
Overcoming network outages. Many techniques have been pro-
posed in the context of recovering against network outages or packet
losses. This include use of overlay networks, in the form of careful
path selection (e.g., RON [10], Akamai CDN [39]) or one-hop detour
routing [25], straggler mitigation techniques for cloud systems [30],
and restoration routing in the context of MPLS networks [21, 11].
FEC is a standard technique to recover against packet losses and
is typically used by real time applications as well as WAN middle-
boxes [12]. Our work leverages these known techniques – we evaluate
their effectiveness in recovering against packet losses and degradation
periods observed on the cloud paths.
254
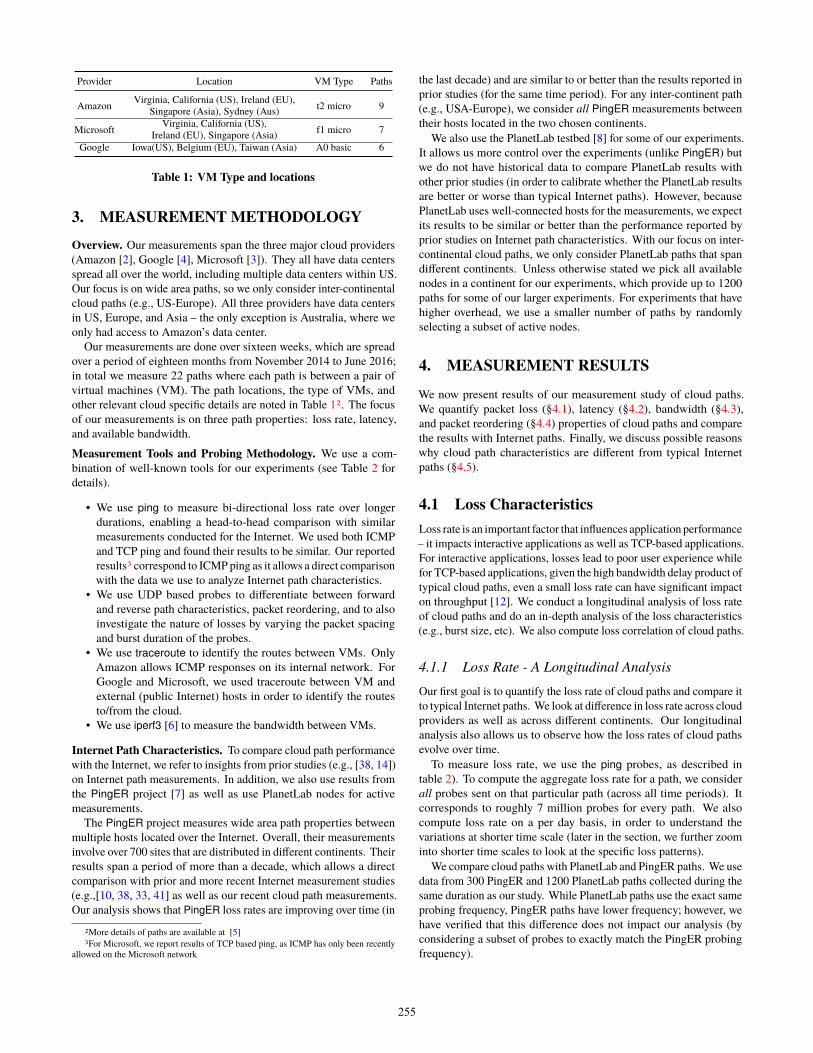
Provider Location VM Type Paths
AmazonVirginia, California (US), Ireland (EU),
Singapore (Asia), Sydney (Aus)t2 micro 9
MicrosoftVirginia, California (US),
Ireland (EU), Singapore (Asia)f1 micro 7
Google Iowa(US), Belgium (EU), Taiwan (Asia) A0 basic 6
Table 1: VM Type and locations
3. MEASUREMENT METHODOLOGY
Overview. Our measurements span the three major cloud providers
(Amazon [2], Google [4], Microsoft [3]). They all have data centers
spread all over the world, including multiple data centers within US.
Our focus is on wide area paths, so we only consider inter-continental
cloud paths (e.g., US-Europe). All three providers have data centers
in US, Europe, and Asia – the only exception is Australia, where we
only had access to Amazon’s data center.
Our measurements are done over sixteen weeks, which are spread
over a period of eighteen months from November 2014 to June 2016;
in total we measure 22 paths where each path is between a pair of
virtual machines (VM). The path locations, the type of VMs, and
other relevant cloud specific details are noted in Table 12. The focus
of our measurements is on three path properties: loss rate, latency,
and available bandwidth.
Measurement Tools and Probing Methodology. We use a com-
bination of well-known tools for our experiments (see Table 2 for
details).
• We use ping to measure bi-directional loss rate over longer
durations, enabling a head-to-head comparison with similar
measurements conducted for the Internet. We used both ICMP
and TCP ping and found their results to be similar. Our reported
results3 correspond to ICMP ping as it allows a direct comparison
with the data we use to analyze Internet path characteristics.
• We use UDP based probes to differentiate between forward
and reverse path characteristics, packet reordering, and to also
investigate the nature of losses by varying the packet spacing
and burst duration of the probes.
• We use traceroute to identify the routes between VMs. Only
Amazon allows ICMP responses on its internal network. For
Google and Microsoft, we used traceroute between VM and
external (public Internet) hosts in order to identify the routes
to/from the cloud.
• We use iperf3 [6] to measure the bandwidth between VMs.
Internet Path Characteristics. To compare cloud path performance
with the Internet, we refer to insights from prior studies (e.g., [38, 14])
on Internet path measurements. In addition, we also use results from
the PingER project [7] as well as use PlanetLab nodes for active
measurements.
The PingER project measures wide area path properties between
multiple hosts located over the Internet. Overall, their measurements
involve over 700 sites that are distributed in different continents. Their
results span a period of more than a decade, which allows a direct
comparison with prior and more recent Internet measurement studies
(e.g.,[10, 38, 33, 41] as well as our recent cloud path measurements.
Our analysis shows that PingER loss rates are improving over time (in
2More details of paths are available at [5]
3For Microsoft, we report results of TCP based ping, as ICMP has only been recently
allowed on the Microsoft network
the last decade) and are similar to or better than the results reported in
prior studies (for the same time period). For any inter-continent path
(e.g., USA-Europe), we consider all PingER measurements between
their hosts located in the two chosen continents.
We also use the PlanetLab testbed [8] for some of our experiments.
It allows us more control over the experiments (unlike PingER) but
we do not have historical data to compare PlanetLab results with
other prior studies (in order to calibrate whether the PlanetLab results
are better or worse than typical Internet paths). However, because
PlanetLab uses well-connected hosts for the measurements, we expect
its results to be similar or better than the performance reported by
prior studies on Internet path characteristics. With our focus on inter-
continental cloud paths, we only consider PlanetLab paths that span
different continents. Unless otherwise stated we pick all available
nodes in a continent for our experiments, which provide up to 1200
paths for some of our larger experiments. For experiments that have
higher overhead, we use a smaller number of paths by randomly
selecting a subset of active nodes.
4. MEASUREMENT RESULTS
We now present results of our measurement study of cloud paths.
We quantify packet loss (§4.1), latency (§4.2), bandwidth (§4.3),
and packet reordering (§4.4) properties of cloud paths and compare
the results with Internet paths. Finally, we discuss possible reasons
why cloud path characteristics are different from typical Internet
paths (§4.5).
4.1 Loss Characteristics
Loss rate is an important factor that influences application performance
– it impacts interactive applications as well as TCP-based applications.
For interactive applications, losses lead to poor user experience while
for TCP-based applications, given the high bandwidth delay product of
typical cloud paths, even a small loss rate can have significant impact
on throughput [12]. We conduct a longitudinal analysis of loss rate
of cloud paths and do an in-depth analysis of the loss characteristics
(e.g., burst size, etc). We also compute loss correlation of cloud paths.
4.1.1 Loss Rate - A Longitudinal Analysis
Our first goal is to quantify the loss rate of cloud paths and compare it
to typical Internet paths. We look at difference in loss rate across cloud
providers as well as across different continents. Our longitudinal
analysis also allows us to observe how the loss rates of cloud paths
evolve over time.
To measure loss rate, we use the ping probes, as described in
table 2). To compute the aggregate loss rate for a path, we consider
all probes sent on that particular path (across all time periods). It
corresponds to roughly 7 million probes for every path. We also
compute loss rate on a per day basis, in order to understand the
variations at shorter time scale (later in the section, we further zoom
into shorter time scales to look at the specific loss patterns).
We compare cloud paths with PlanetLab and PingER paths. We use
data from 300 PingER and 1200 PlanetLab paths collected during the
same duration as our study. While PlanetLab paths use the exact same
probing frequency, PingER paths have lower frequency; however, we
have verified that this difference does not impact our analysis (by
considering a subset of probes to exactly match the PingER probing
frequency).
255

Probe Type Probes/minute Inter-probe gap Probes/Path Probe size Analysis
ICMP, TCP ping 60 1s 7.14M 64 Bytes Loss rate (§4.1.1)
UDP60 1s 2.6M 44 Bytes Loss Correlation (§4.1.3), Latency (§4.2)
15 10ms 800K44 Bytes Reordering (§4.4), Burst nature (§4.1.2)
500 10ms 9M
iPerf 100 (Flows) 4GB(file size) 5(runs)
High VM (8 Core, 16G Mem),Moderate VM (4 Core, 8GB Mem),
Low VM (0.5 Core, 0.5G Mem)Bandwidth (§4.3)
Table 2: Probing methods and their use throughout the study
0
0.1
0.2
0.3
0.4
0.5
0.6
0.7
0.8
0.9
1
0.001 0.01 0.1 1 10 100
CD
F
Loss rate
CloudPingER
PlanetLab
(a) Aggregate Loss Rate
0
0.1
0.2
0.3
0.4
0.5
0.6
0.7
0.8
0.9
1
0.001 0.01 0.1 1 10 100C
DF
Loss rate
CloudPingER
PlanetLab
(b) 95th Percentile (Per-Day)
0
0.1
0.2
0.3
0.4
0.5
0.6
0.7
0.8
0.9
1
0.001 0.01 0.1 1 10 100
CD
F
Loss rate
CloudPingER
PlanetLab
(c) 99th Percentile (Per-Day)
Figure 2: Loss rates of cloud paths (based on ping probes) and Internet paths (PlanetLab & PingER results). (95th & 99th Percentiles
are based on daily path loss rates. Note the log scale for the x-axis for all three graphs. Results show Internet paths have longer tail
compared to cloud paths.
Path US-EU (%) US-Asia (%) EU-Asia (%) Agg (%)
Amazon 0.015 0.016 0.065 0.028
Google 0.063 0.071 0.021 0.052
Microsoft 0.024 0.032 0.022 0.026
Table 3: Loss rate comparison of cloud providers – overall as well
as for specific regions (shaded cells highlight lowest loss rate)
Cloud path have lower loss rate than typical Internet paths. Fig-
ure 2(a) shows the CDF of all cloud paths (across all providers) and
PlanetLab and PingER paths, as a function of the aggregate loss rate.
We observe that the best paths in all three settings are comparable,
with loss rates less than 0.02%. However, if we look at the median
and high percentiles, cloud paths have lower loss rates compared to
the public Internet paths, i.e., the Internet paths have a much longer
tail compared to cloud paths. Specifically, all of the cloud paths have
a loss rate of less than than 0.08% whereas roughly 5% paths of
PlanetLab and PingER have a loss rate of more than 2% (these public
Internet path loss number numbers lie in the same region as reported
by prior studies [24, 18, 10, 38, 14, 41, 33].
To further understand the tail, we look at the daily loss rates
for all paths (cloud and Internet) and compute their 95th and 99th
percentile loss rate – these correspond to the “bad days” for each path.
Figure 2(b) shows the CDF of all paths as a function of their 95th
percentile loss rate. We see that even on the “bad days”, the cloud
loss rate remains below 0.8% whereas for PingER and PlanetLab, at
least 30% of paths have loss rates greater than 1%. Figure 2(c) shows
the same trend for the 99th percentile daily loss rate. The results show
that cloud path performance (in terms of loss rate) is more predictable
compared to an average Internet path.
No clear winner among cloud providers. We now zoom into indi-
vidual providers and compare their loss rates, both at an aggregate
level as well as for specific regions. Table 3 shows the average loss
rate for all cloud providers – both at an aggregate level as for specific
regions. Accounting for the variations, we conclude that all cloud
providers have similar performance and there is no clear winner. For
example, Amazon has lower loss rates on US-EU and US-Asia paths
but it performs slightly worse on EU-Asia path as compared to other
providers. Note that the similarity observation is based on the overall
loss rates – as we show later, the underlying loss characteristics (e.g.,
burstiness) of these paths differ across providers.
4.1.2 Loss Characterization
To better understand how losses may impact application performance,
we do an in-depth characterization of losses observed on the cloud
paths. For this analysis, we use the UDP based probes – we send
a burst of UDP packets for 5 seconds, after every one minute and
divide each burst in to buckets of 15 packets each; this corresponds to
packets sent over a period of 150 milliseconds, which is on the order
of a round-trip-time for most of our cloud paths. We are interested in
buckets that have at least one packet loss – we call this a loss episode.
For each loss episode, we quantify the number of packets lost and
categorize the nature of losses as: i) random: if only 1 packet is lost;
2) multi: if between 2 to 14 packets are lost; and 3) outage: if all 15
packets are lost.
All cloud providers experience random loss episodes. Fig 3(a)
shows the breakup of different types of loss episodes for all three
cloud providers. It shows that all cloud providers experience at least
35% random loss episodes (i.e., episodes with just one packet loss).
For Amazon and Microsoft, these episodes are more than 50% of
the total episodes. While we do not know the reason for such high
number of random losses, we believe this could be due to random loss
in fiber optic based long distance links [12]. Such loss episodes are
amenable to FEC style recovery without incurring too much overhead.
For example, for a burst of 15 packets, a single FEC packet, with
an overhead of less than 10%, can recover all random losses. We
quantify the benefits of using FEC for each provider as part of our
case study (§5.2).
256

0
10
20
30
40
50
60
70
80
90
100
Amazon Google Microsoft
Perc
enta
ge o
f lo
sses Random
MultiOutage
(a) Loss episodes characteristics
0
0.1
0.2
0.3
0.4
0.5
0.6
0.7
0.8
0.9
1
10 100 1000 10000 100000 1x10⁶
CD
F
Degradation Period (ms)
AmazonGoogle
Microsoft
(b) Degradation period duration
0
0.1
0.2
0.3
0.4
0.5
0.6
0.7
0.8
0.9
1
10 30 960 1 60 3600 216000
CD
F
Burst Interarrival time (min)
AmazonGoogle
Microsoft
(c) Inter-arrival time
Figure 3: Loss burst nature of cloud paths. a) Breakup of loss episodes for cloud paths.Three types of losses within a burst of 15
packets are shown : random (1 packet loss); multi (2-14 packet drops), and outage (all 15 packets get lost). b) Duration of degradation
periods for the three cloud providers c) Inter-arrival time between degradation periods for the three cloud providers
Multi packet losses and outages are also common. The contribu-
tion of the other two types (multi packet and outages) varies from
one provider to another. For example, Amazon experiences more
outages than multi packet losses whereas it is the opposite for Google.
Overall, both these loss types contribute a significant fraction of the
outages experienced by each provider because these two types contain
most of the packet losses (our experiments in Section 5.1 validate
this observation). We call loss episodes that have either multi packet
losses or outages (but not random losses) as a degraded period. Next,
we analyze degraded periods observed on cloud paths in more detail.
Degraded periods can last up to minutes. Fig 3(b) shows the CDF
of the duration of degraded periods. For this analysis, we combine
degraded periods that span consecutive bursts, so we can look at the
total duration of the degraded periods. The graph shows that degraded
periods can last up to minutes, but most degraded periods (around
70%) last for less than a second. Amazon experiences degradation
periods of longer duration compared to the other providers. Our
conjecture is that this is because Amazon experiences more outages
(Fig 3(a)) and outages are likely to last longer than bursty losses.
Inter-arrival time between degraded periods is typically low with
a long tail. We also analyze the inter-arrival time between degraded
periods. Fig 3(c) shows that for almost half of the degraded periods,
the inter-arrival time is less than 2 hours. This is even lower for
Microsoft where 70% of the degraded periods have an inter-arrival
time of 10 minutes or less. All paths have a relatively long tail (note
the log scale on the x-axis). These results show that inter-arrival time
between degraded period is non-uniform, making it difficult to predict
when a degraded period will occur.
In summary, the results show that degraded periods are long and
can contribute significantly to the downtime of the cloud path.
4.1.3 Loss Correlation
Next, we turn our attention to analyzing loss correlation on the cloud
paths. This is important for understanding the possible techniques to
avoid or recover packet losses. For example, an application may use
multiple cloud providers for increased availability, but this may not
prove useful, if the cloud providers have shared paths (i.e., experience
losses at the same time).
For all our results, we use the UDP uni-directional probes to
compute losses on a per-minute granularity. We compute the pearson
correlation coefficient to compare losses on any two paths. Our
analysis of different types of cloud paths shows that losses on these
paths are independent, i.e., they have a low correlation coefficient.
Specifically, our results show that:
• Losses on the forward and reverse paths (for the same provider)
are independent. For example, correlation between US-EU and
EU-US paths for Amazon is 0.015.
• Losses across paths of the same cloud provider (even with
the same source/destination) are independent. For example,
correlation between US-Asia and US-EU paths for Microsoft is
0.0061.
• Losses on paths of different cloud providers (even across the same
regions) are independent. For example, correlation between
Amazon and Microsoft for US-EU path is 0.001.
4.2 Latency
Data centers host many user facing applications with tight latency
requirements (e.g., geo-distributed database). It is therefore important
to analyze the latency and its variation on the cloud paths. Typically,
it is the variation (i.e., jitter) which turns out to be difficult to control;
it also translates into high tail latency for applications. Jitter is also
important for interactive applications (e.g., voice) as well as transport
protocols like TCP that use round trip times for retransmissions and
timeouts.
Because absolute latency depends on the location of the nodes
(which differ based on providers), we focus our analysis on the latency
variation (jitter) in round-trip-time (RTT) of cloud paths using ping
probes and compare them against the jitter observed on PlanetLab
and PingER paths. We define jitter as the percentage difference
between 95th percentile RTT and the median RTT observed on a
particular path. We also analyze the difference in latency between the
forward and reverse direction of cloud paths, using uni-directional
UDP probes4.
Cloud paths have lower jitter (at the tail) compared to Internet
paths. Figure 4(a) shows the CDF of the jitter for all cloud, PingER
and PlanetLab paths in our study. We observe that for most paths
jitter is similar and within 30% but both PingER and PlanetLab paths
suffer from long tail. Specifically, the worst 1% of the public Internet
paths have more than 100% jitter. This means that latency on cloud
paths is more predictable as compared to public Internet paths. We
also compute jitter for uni-directional UDP probes on cloud paths
and find that it is less than 15% on all cloud paths. Figure 4(b) shows
the jitter for individual providers across different regions. We can see
4We synchronized the clocks at the sender and receiver VMs.
257

0
0.1
0.2
0.3
0.4
0.5
0.6
0.7
0.8
0.9
1
0 50 100 150 200 250
CD
F
Jitter(%)
CloudPingER
PlanetLab
(a) Jitter comparison with Internet paths
0
5
10
15
20
25
30
35
40
US-EU US-Asia EU-Asia
Jitt
er
(%)
AmazonGoogle
Microsoft
(b) Jitter across providers
0
0.1
0.2
0.3
0.4
0.5
0.6
0.7
0.8
0.9
1
10-1 100 101 102 103 104 105 106
CD
F
Percentage Increase in loss at 50% RTT
CloudPlanetLab
(c) Increase in loss rate due to jitter
Figure 4: Jitter properties of cloud paths. a) Jitter, calculated using ICMP probes, observed on cloud, PingER and PlanetLab paths.
b) Jitter observed in different regions for cloud providers. c) Increase in loss rate due to jitter. We consider all packets which are
delayed by more than 0.5RTT as lost packets (i.e., they miss their deadline.
that except one of the Amazon paths (which we investigate in §4.5,
all cloud paths have a jitter for less than 20%.
Lower jitter translates into more packets meeting their “dead-
lines”. High jitter means that more packets arrive at the destination
after their deadline [47] and thus increase the effective packet loss rate.
To quantify the benefits of lower jitter on the cloud paths, we compute
the increase in packet loss rate caused by jitter. We compare cloud
paths with PlanetLab paths because we have access to per-packet
latency for PlanetLab probes (unlike PingER). We set a threshold
of 0.5RTT for the jitter – all packets that are delayed by an extra
0.5RTT are included in the packet loss calculation. For PlanetLab,
we randomly pick 20 wide area paths for our analysis.
Fig. 4(c) shows the CDF of the percentage increase in loss rate
experienced by the different paths. In case of the cloud, the loss
rate at most doubles, whereas most PlanetLab paths observe a 10x
increase in loss rate. This shows that if we include jitter, the potential
improvement in loss rate for cloud paths over Internet paths is even
greater.
Latency of forward and reverse paths are similar. We observe
that average latency in forward and reverse directions for most of
the cloud paths is similar and within 7% of each other. The only
exception is the EU-Asia path of Amazon where the difference in
average latency varies up to 60%. The reverse path latency on this path
is 100ms and forward path latency varies between 100-160ms. Our
traceroute analysis showed that this was the only path that was using
external service providers, and used different paths in the forward
and reverse direction (more details in §4.5). Overall, the results show
fairly similar latency in both directions.
4.3 Bandwidth
We now shift our focus on available bandwidth between VMs across
the cloud paths. We note that it is well known that cloud operators
do VM level rate limiting, with a prior study also quantifying its
impact on inter-DC paths [47]. Our experiments reconfirm some of
the earlier findings and also shed new insights on available bandwidth
on the cloud paths.
To measure the available bandwidth (throughput), we use iperf3 [6]
to send data from one VM to another. Our iperf3 sender uses 100
TCP flows and transfers 4GB amount of data in each run. We pick
two different VM types – High and Moderate – with their details
mentioned in Table 2. For each path, we make five transfers and use
the throughput reported by iperf3 for our results. We note that we
have also conducted longer running experiments (over multiple days)
0
2000
4000
6000
8000
Amazon Google Microsoft
Thro
ughput
(Mbps) High
Moderate
(a) Bandwidth across machine types
0
2000
4000
6000
8000
10000
US-EU US-Asia
Thro
ughput
(Mbps) Amazon
GoogleMicrosoft
(b) Bandwidth across regions
Figure 5: Average bandwidth variation on cloud paths (error bar
shows the deviation). a) Bandwidth varies across VM types for
each provider on the US-Asia path. b) Bandwidth varies across
regions for each provider (high performance machine).
on a subset of paths, and the results are quantitatively similar, with
no extra variation due to time of day impact.
Available Bandwidth is high and varies across providers and
VM types. Figure 5(a) shows the average bandwidth for all cloud
providers with different VM types. Our results confirm previous
findings that the available bandwidth varies depending on the VM
type [47]. However, our results highlight two new aspects. First, the
available bandwidth could be higher than 1Gbps (earlier results show
a maximum of 1Gbps [47]) with up to 9Gbps achievable in some
scenarios (see next result). Second, available bandwidth varies across
providers, with Google being the clear winner across both types of
VMs.
Available Bandwidth varies across regions. Figure 5(b) shows the
throughput of different cloud provider paths for different regions. We
observe that all providers have lower throughput on their US-Asia
paths compared to their US-EU paths. On all these individual paths,
Google still provides the highest throughput touching a high of 9Gbps
on the US-EU path.
4.4 Reordering
Packet reordering is relevant for distributed applications that require
consistency. It is also important for transport protocols like TCP,
which needs to distinguish between an out-of-order packet and a loss.
We analyze the amount of packet reordering on the cloud paths. We
use Paxson’s [38] definition of packet reordering, which counts late
arrivals rather than early arrivals. For example, if packet 4 arrives
before packets 1-3, the number of out-of-order packets will be three
258

Google DC PlanetLab Node AS Path (hop count) RTT to the 2nd AS
IowaUniversity of Leuven,BE Google (16) - AMX(1) - BELNET (3) 120ms
Nagoya Institute of Technology -JP Google (16) - JPIX(1) - SINET (5) 126ms
BelgiumUniversity of Minnesota,MN,USA Google (11) - Level3 (4) - NMLR (1) 200msNagoya Institute of Technology, JP Google (16) - JPIX(1) - SINET (4) 225ms
TaiwanUniversity of Leuven, BE Google (19) - AMX(1) - BELNET (3) 265ms
University of Minnesota, MN, USA Google (15) - Level3(4) - NMLR (1) 300ms
Table 4: Google traceroute to PlanetLab nodes. The last column shows the RTT between the source and the next AS (after Google) –
the high values indicate that Google uses its own infrastructure on the wide area before forwarding the traffic to an external AS.
rather than one. In general, counting late arrivals result in higher
amount of reordering than counting early packets [38].
We use UDP probes to measure reordering in both directions of the
cloud path and observe negligible reordering for all providers. Also,
our analysis of reordering on PlanetLab paths show roughly the same
level of reordering as observed on the cloud paths.
Packet reordering is low. Overall, we observe that the amount
of packet reordering is low: we observe negligible reordering on
Microsoft and Amazon paths, and a small amount of reordering on
Google paths. The amount of reordering on Google paths range from
0.01% to 0.02%. The use of multi-path, as suggested in B4 [31], may
explain the reordering on Google paths. However, we do not know
whether Google is using B4 (or a similar system) for their public
cloud.
We note that the reordering observed on the Internet has also been
decreasing, with older studies citing a single digit (1%-3%) [38]
reordering while the more recent ones citing lower reordering [29].
Our analysis of reordering on PlanetLab paths show roughly the same
level of reordering as observed on the cloud paths.
4.5 Why are Cloud Paths better?
Results in the previous sections show that cloud paths are better than
typical Internet paths, in terms of loss rate and jitter. An obvious
question is: what is the reason why cloud paths are better?
Our hypothesis is that a wide area backbone which is under full
control of the cloud provider is likely to be better managed – both in
terms of resource provisioning as well as traffic engineering. While
we do not have inside visibility into the cloud paths, we conduct
an autonomous system (AS) level path analysis to get a high level
topological view of the cloud backbone. We use traceroute for our
analysis. For our analysis, we conduct multiple traceroute probes to
also observe any changes over time. Note that only Amazon allows
ICMP on its internal network whereas Microsoft and Google partially
or fully block ICMP. For Amazon paths, we use traceroutes between
two VMs, whereas for Microsoft and Google, we conduct traceroutes
to/from PlanetLab nodes (in other continents) to the cloud VMs.
Our AS-level path analysis for Amazon shows that on all paths
(except one) only the Amazon ASes were observed, i.e., no other
service provider was involved (at the network layer). The only
exception is the path between EU (Ireland) and Asia (Singapore). We
investigate this path in more detail as it is also the only case where we
observed a significant difference in forward and reverse path latency.
Figure 6(a) shows the path from Ireland to Singapore. The hops
at the edges belong to Amazon (each vertex contains the number of
hops), but other service providers are used in the middle, including
Level 3, Telina.net, and NTT. However, on the reverse side (Singapore
to Ireland) a different set of service providers are used (see Figure 6(b))
– while NTT is still being used, there are two difference: it is getting
the traffic from TATA (rather than directly getting it from Amazon)
(a) Forward Path (b) Reverse Path
Figure 6: Amazon Ireland to Singapore path
Figure 7: Microsoft traceroute from US to Europe, hop numbers
shown inside the node.
and it is directly sending the traffic to Amazon (instead of through
some other ISPs). This difference in routing also explains the latency
difference in forward and reverse directions that we observed earlier.
For Google, we conduct traceroutes from a Google data center
to multiple PlanetLab nodes in a different continent. This allows
us to infer whether Google uses its own paths to reach the other
continent (which are likely to be used for inter-DC communication as
well). Table 4 shows the results for multiple source DCs and different
vantage points. In all cases, we observe that Google uses its own
network to reach the other continent after which it forwards the traffic
to an external service provider (in order to reach PlanetLab nodes).
This is indicated by the last column which shows that most of the
RTT is spent within the Google network. These results suggest that
Google has a dedicated wide area backbone for its cloud paths and is
likely using it for its inter data center communication as well.
Finally, we observe the same routing behavior for Microsoft as
well, i.e., Microsoft uses its own wide area backbone for traffic
to/from its VMs to different continents. Fig. 7 shows one specific
case for illustration, focusing on traceroutes from PlanetLab nodes to
a Microsoft VM in a different continent. As we can see, the traffic
moves to the Microsoft network close to the source and uses its own
backbone to reach the destination, suggesting that, just like Google,
Microsoft also uses its own wide area backbone for communication
between data centers.
Discussion. The above analysis, as well as anecdotal evidence, sup-
ports the case that cloud operators have dedicated wide area infras-
tructure to support communication between their data centers. We
believe that the traffic volume, application requirements, and future
growth expectations, all push the cloud operators towards building a
well-provisioned infrastructure. Additional gains come from having
full control over the infrastructure, such as traffic engineering and
improved fault recovery. For example, Microsoft and Google show
259

how they use software-defined networking to better manage their wide
area networks [31, 28]. We believe that the above factors possibly
explain why cloud paths are better than the typical Internet paths.
5. CASE STUDY
In this case study, we consider the following question: how much more
reliable can we make the cloud paths, if we apply known loss mitigation
and avoidance techniques, like FEC and one-hop detour routing [25].
We ask this question with an eye towards the future, where emerging
applications in health-care (e.g., remote surgery) or emergency relief,
may require a highly resilient Internet, which must offer reliability
similar to what today’s telephony network provides. Our preliminary
evaluation shows the promise of the cloud infrastructure (with extra
smarts) in providing such a resilient service.
5.1 Detour Routing
Detour routing [25, 10] uses a detour point to send packets between a
source and destination. It improves reliability in scenarios where the
problem is in the “middle” of the end-to-end path. A problem at the
edges (source or destination) impacts the detour path as well. Prior
studies show that a randomly chosen detour point can recover from
almost 56% of failures observed in an Internet environment [25].
To evaluate the benefits of detour routing for cloud paths, we
conduct an experiment over a two weeks period. We enhance our
UDP probe mechanism to send a duplicate probe through a detour
path. A packet is successfully marked as received if it reaches the
destination through either the direct path or the detour path. A packet
loss indicates that the packet was lost on both the direct and detour
paths. Our analysis considers all loss episodes as well as isolates
those scenarios where the losses happened in a burst (defined as more
than 4 consecutive packet losses).
For cloud paths, we use a PlanetLab node (located in Europe) as
the detour point. We use VMs in Microsoft and Google DCs located
in US, Asia and EU, and Amazon DCs located in US, Asia, EU
and Oceania. We also evaluate how well detour routing works for
PlanetLab paths. We use 15 PlanetLab nodes in three regions (5
nodes each in Asia, Europe and US East Coast) – we run an all-to-all
experiment between nodes in different regions (with US nodes only
acting as destinations; Europe nodes only acting as sources; and
Asia nodes acting as both sources and destinations). Again we use a
PlanetLab node in Europe as the detour point in all cases.
Detour Routing is highly effective for Cloud Paths. Fig 8(a) shows
the comparison of loss recovery using detour routing for cloud paths
and Internet paths. We can see that detour routing works better for
cloud paths – we can recover the lost packet, with the help of the
detour path, in around 87% of the cases. However for public Internet
paths we can see only 46% recovery. If we consider bursty losses, the
recovery effectiveness decreases, as the bursty losses are more likely
to impact both the original and duplicate packets (as they are sent
back-to-back) compared to an isolated single, packet loss.
Effectiveness of detour routing varies across providers. Fig 8(b)
shows the loss rate recovery across cloud providers. We can see
that in case of Microsoft, we can recover more than 95% of the
packets using the detour path. Google’s performance is the worst in
this context, as it recover 74% of packets, although it is still better
compared to the recovery effectiveness of the public Internet paths.
To further understand these differences, we zoom into all the bursty
loss episodes and divide the recovery into three cases: when we
can recover all packets in a bursty loss episode, recover some of
the packets, or recover nothing. Fig 8(c) shows that Microsoft and
Amazon rarely see a scenario where all packets in a burst cannot be
recovered. However, the corresponding number is higher for Google
(it loses all the packets in a burst 20% of times), which explains why
Google has lower recovery rates compared to the other providers.
Discussion. The above results show that detour routing is highly
effective for cloud paths, with some cloud providers able to effectively
“hide" most of their losses with the help of the detour. For example,
for Microsoft, we can reach five 9’s of reliability (1 - loss-rate) with
the help of detour routing. These results suggest that cloud providers
have well-provisioned edges, and most of their packet loss happens in
the middle, which can be avoided through the use of a detour point.
Note that our focus here was on the potential of using detour
routing, so we used the detour path simultaneously with the direct
path. Of course, it is up to the application to decide how it wants to
benefit from detour routing. Applications that can afford to pay extra
may use the paths simultaneously while other applications may use
the detour path in a reactive fashion, i.e., only after encountering a
degraded period. We believe that intelligently using the detour path,
while minimizing the cost of using the cloud path, is an interesting
direction for future work.
5.2 FEC
We consider packet level FEC, which adds certain number of redundant
packets to every burst. We do a what-if analysis on the UDP probes
to analyze the potential benefits of applying various levels of FEC.
For a burst of 15 packets, we consider 4 different FEC levels: one,
two, four, and eight FEC packets for every burst.
Fig 9a shows the impact of applying various levels of FEC on loss
episodes along with the case when FEC is not used. We can observe
that a single FEC packet provides considerable gains in availability (1
- loss-rate) because it is able to recover all random loss events. Thus,
even with a low FEC overhead of less than 10%, we see considerable
gains that raise the availability to close to 99.99% in some cases.
For high levels of FEC, we do not observe any significant change
for Amazon and Microsoft because most of their losses are either
random or constitute outages. Fig 9b zooms into all the paths for
Amazon and show similar observations.
One interesting aspect of the above results is the performance of
Google cloud paths. Recall that Google had considerable bursty
losses; this explains why it observes most gains as we increase the
level of FEC. In fact, it is able to achieve five 9’s of reliability with
an FEC level of eight (which corresponds to roughly 50% overhead).
The above analysis only considers the potential benefits of FEC.
There are practical challenges with realizing FEC – we believe
that tuning FEC based on application requirements and cloud path
conditions is another interesting avenue for future work.
6. DISCUSSION
We believe that our findings have important implications on the use
and design of cloud-based applications and systems. We discuss two
such examples.
Performance vs. Cost Tradeoff. Cloud applications typically have
multiple options – in terms of cloud providers as well as data
center locations within a provider. Several recent systems (e.g.,
SPANStore [45]) try to optimize how applications make use of the
cloud, keeping in view the application service level objectives as well
260

(a) Cloud vs. Internet paths. (b) Across cloud providers (c) Bursty losses and their recovery.
Figure 8: Overview of benefits of using Detour Routing. a) shows that cloud paths benefit more from detour routing compared to
Internet paths. b) shows that the recovery effectiveness varies across cloud providers while c) focuses on bursty losses (more than 4
consecutive packet losses) and how each provider is able to recover them.
99.98
99.985
99.99
99.995
100
AmazonGoogleMicrosoft
No-FEC1-Packet2-Packet4-Packet8-Packet
(a) Aggregated results for all providers
99.99
99.992
99.994
99.996
99.998
100
US-EU US-Asia EU-Asia
No-FEC1-Packet2-Packet4-Packet8-Packet
(b) Amazon results
Figure 9: Availability of cloud paths after applying different
levels of FEC. (Note different scales of y-axis)
as the cost. Information about cloud path characteristics can further
enhance the effectiveness of such systems by enabling them to choose
suitable data centers for replication. For example, the primary data
center may choose a far-away data center with good path conditions
over a closer data center which is experiencing a degraded period.
Similarly, we can account for cost differentials while using different
data centers. For example, the egress bandwidth charges at non-US
data centers is typically higher, so applications may decide to use
a far-away data centers (to reduce its cost) as long as it meets the
performance (and other) requirements of the application.
Our insights also add an interesting dimension for those applications
that have an option to use either the cloud or the Internet paths (e.g.,
user-user application and user-cloud applications – Figure 1). Given
that cloud paths are more reliable, applications would always like
to use them; however, cloud paths are much more expensive to use.
Thus, applications would want to use them in a judicious manner. For
example, an application can use cloud paths when Internet paths are
down, or use them in an intelligent fashion to send more important
data (e.g., an I-frame in video streaming) while using Internet paths
for less important data. On such example is ReWAN [27], which uses
the cloud overlay to only send coded packets across the cloud path
to a data center close to the receiver. These coded packets are used
only in case of a loss on the direct Internet path. This technique saves
on the cloud WAN bandwidth costs while still leveraging the highly
reliable cloud paths.
Cloud Transport. Our findings have important implications for
WAN communication mechanisms (e.g., transport and traffic engineer-
ing mechanisms [47, 31], WAN middleboxes and accelerators [12],
etc). Given the high bandwidth delay product on these paths, proto-
cols like TCP can experience high drop in throughout even with small
loss rates [12]. Many of our findings can be leveraged to improve reli-
ability and performance of these protocols. For example, predictable
latency and little or no reordering can motivate a faster recovery
mechanism (e.g., using fewer than three duplicate acks) compared
to existing Internet based mechanisms used in TCP. Similarly, as we
show in the case study, real time applications can leverage standard
techniques, like FEC and detour routing, to significantly improve their
availability.
7. CONCLUSIONS
A wide range of applications use the inter-data center paths of
cloud providers. Our study of the inter-continental cloud paths of
Amazon, Microsoft, and Google sheds important insights regarding
the characteristics of these cloud paths in comparison with traditional
wide area Internet paths. We also demonstrate a powerful result i.e.,
we can achieve almost five 9’s of network reliability for wide area
communication by using existing techniques (e.g., detour routing) to
mask losses on these cloud paths. We believe our insights will prove
useful for practitioners and researchers of cloud systems.
Acknowledgments
We thank the anonymous reviewers for their feedback on this work,
and Shawn Doughty for helping with PlanetLab access. This work
was partially supported by NSF (CNS Award Number: 1618321) and
a Tufts University FRAC grant.
References
[1] Aryaka. http://www.aryaka.com/.
[2] Amazon AWS. http://aws.amazon.com.
[3] Microsoft Azure. http://azure.microsoft.com/.
[4] Google Cloud. https://cloud.google.com/.
[5] Cloud measurement study data. https://github.com/mamoonraja/Cloud_Measurements.
[6] Iperf3. http://software.es.net/iperf/.
[7] PingER Worldwide History Reports.http://tinyurl.com/pinger-reports.
[8] PlanetLab. https://www.planet-lab.org/.
261

[9] M. Alizadeh, A. Greenberg, D. A. Maltz, J. Padhye, P. Patel,B. Prabhakar, S. Sengupta, and M. Sridharan. Data center tcp (dctcp).In Proc. ACM SIGCOMM, 2010.
[10] D. G. Andersen, H. Balakrishnan, M. F. Kaashoek, and R. Morris.Resilient Overlay Networks. In Proc. SOSP, 2001.
[11] F. Aslam, S. Raza, F. R. Dogar, I. U. Ahmad, and Z. A. Uzmi. Npp: Afacility based computation framework for restoration routing usingaggregate link usage information. In International workshop on quality
of service in multiservice IP networks, 2004.
[12] M. Balakrishnan, T. Marian, K. Birman, H. Weatherspoon, andE. Vollset. Maelstrom: Transparent Error Correction for LambdaNetworks. In Proc. Usenix NSDI, 2008.
[13] T. Benson, A. Akella, and D. A. Maltz. Network traffic characteristicsof data centers in the wild. In Proc. ACM IMC, 2010.
[14] J.-C. Bolot. End-to-end packet delay and loss behavior in the internet.In Proc. ACM SIGCOMM, 1993.
[15] M. Calder, X. Fan, Z. Hu, E. Katz-Bassett, J. Heidemann, andR. Govindan. Mapping the expansion of google’s serving infrastructure.In Proc. ACM IMC, 2013.
[16] Y. Chen, R. Mahajan, B. Sridharan, and Z.-L. Zhang. A provider-sideview of web search response time. 2013.
[17] Y.-C. Chiu, B. Schlinker, A. B. Radhakrishnan, E. Katz-Bassett, andR. Govindan. Are we one hop away from a better internet? In Proc.
ACM IMC, 2015.
[18] M. Dahlin, B. B. V. Chandra, L. Gao, and A. Nayate. End-to-end wanservice availability. IEEE/ACM Transactions on Networking (TON), 11(2):300–313, 2003.
[19] F. R. Dogar and P. Steenkiste. M2: Using Visible Middleboxes to ServePro-active Mobile-Hosts. In Proc. ACM SIGCOMM MobiArch, 2008.
[20] F. R. Dogar and P. Steenkiste. Architecting for Edge Diversity:Supporting Rich Services Over an Unbundled Transport. In Proc. ACM
CoNext, 2012.
[21] F. R. Dogar, Z. A. Uzmi, and S. M. Baqai. Caip: a restoration routingarchitecture for diffserv aware mpls traffic engineering. In Proc. IEEE
DRCN 2005, 2005.
[22] F. R. Dogar, A. Phanishayee, H. Pucha, O. Ruwase, and D. G. Andersen.Ditto: a system for opportunistic caching in multi-hop wirelessnetworks. In ACM MobiCom, 2008.
[23] F. R. Dogar, P. Steenkiste, and K. Papagiannaki. Catnap: Exploitinghigh bandwidth wireless interfaces to save energy for mobile devices. InProc. ACM MobiSys, 2010.
[24] T. Flach, N. Dukkipati, A. Terzis, B. Raghavan, N. Cardwell, Y. Cheng,A. Jain, S. Hao, E. Katz-Bassett, and R. Govindan. Reducing weblatency: the virtue of gentle aggression. In Proc. ACM SIGCOMM,2013.
[25] P. K. Gummadi, H. V. Madhyastha, S. D. Gribble, H. M. Levy,D. Wetherall, et al. Improving the Reliability of Internet Paths withOne-hop Source Routing. In Proc. Usenix OSDI, 2004.
[26] D. Han, A. Anand, F. R. Dogar, B. Li, H. Lim, M. Machado,A. Mukundan, W. Wu, A. Akella, D. G. Andersen, et al. XIA: EfficientSupport for Evolvable Internetworking. In Proc. Usenix NSDI, 2012.
[27] O. Haq and F. R. Dogar. Leveraging the Power of the Cloud for ReliableWide Area Communication. In Proc. ACM Hotnets, 2015.
[28] C.-Y. Hong, S. Kandula, R. Mahajan, M. Zhang, V. Gill, M. Nanduri,and R. Wattenhofer. Achieving high utilization with software-drivenWAN. In Proc. SIGCOMM, 2013.
[29] P. Hurtig, W. John, and A. Brunström. Recent trends in tcp packet-levelcharacteristics. In Proc. ICNS, 2011.
[30] A. M. Iftikhar, F. Dogar, and I. A. Qazi. Towards a redundancy-awarenetwork stack for data centers. In Proc. HotNets, 2016.
[31] S. Jain, A. Kumar, S. Mandal, J. Ong, L. Poutievski, A. Singh,S. Venkata, J. Wanderer, J. Zhou, M. Zhu, et al. B4: Experience with aglobally-deployed software defined WAN. In Proc. SIGCOMM, 2013.
[32] S. Kandula, I. Menache, R. Schwartz, and S. R. Babbula. Calendaringfor wide area networks. 2014.
[33] S. Khattak, D. Fifield, S. Afroz, M. Javed, S. Sundaresan, V. Paxson,S. J. Murdoch, and D. McCoy. Do You See What I See? DifferentialTreatment of Anonymous Users. In Proc. NDSS, 2016.
[34] A. Li, X. Yang, S. Kandula, and M. Zhang. Cloudcmp: comparingpublic cloud providers. In Proc. ACM IMC, 2010.
[35] H. V. Madhyastha, E. Katz-Bassett, T. E. Anderson, A. Krishnamurthy,and A. Venkataramani. iplane nano: Path prediction for peer-to-peerapplications. In Proc. Usenix NSDI, 2009.
[36] E. Nordstrom, D. Shue, P. Gopalan, R. Kiefer, M. Arye, S. Ko,J. Rexford, and M. J. Freedman. Serval: An end-host stack forservice-centric networking. In Proc. 9th USENIX NSDI, San Jose, CA,April 2012.
[37] A. Pathak, Y. A. Wang, C. Huang, A. Greenberg, Y. C. Hu, R. Kern,J. Li, and K. W. Ross. Measuring and evaluating TCP splitting for cloudservices. In Proc. of PAM, 2010.
[38] V. Paxson. End-to-end internet packet dynamics. In Proc. ACM
SIGCOMM, 1997.
[39] R. K. Sitaraman, M. Kasbekar, W. Lichtenstein, and M. Jain. Overlaynetworks: An akamai perspective. In Advanced Content Delivery,
Streaming, and Cloud Services. John Wiley & Sons, 2014.
[40] A.-J. Su, D. R. Choffnes, A. Kuzmanovic, and F. E. Bustamante.Drafting behind akamai (travelocity-based detouring). In Proc. ACM
SIGCOMM, 2006.
[41] S. Sundaresan, W. de Donato, N. Feamster, R. Teixeira, S. Crawford,and A. Pescapè. Broadband internet performance: A view from thegateway. In Proc. ACM SIGCOMM, 2011.
[42] D. B. Terry, V. Prabhakaran, R. Kotla, M. Balakrishnan, M. K. Aguilera,and H. Abu-Libdeh. Consistency-based service level agreements forcloud storage. In Proc. ACM SOSP, 2013.
[43] R. Viswanathan, G. Ananthanarayanan, and A. Akella. Clarinet:Wan-aware optimization for analytics queries. In Proc. OSDI, 2016.
[44] A. Vulimiri, C. Curino, B. Godfrey, J. Padhye, and G. Varghese. Globalanalytics in the face of bandwidth and regulatory constraints. In Proc.
Usenix NSDI, 2015.
[45] Z. Wu, M. Butkiewicz, D. Perkins, E. Katz-Bassett, and H. V.Madhyastha. Spanstore: Cost-effective geo-replicated storage spanningmultiple cloud services. In Proc. ACM SOSP, 2013.
[46] Y. Xu, C. Yu, J. Li, and Y. Liu. Video telephony for end-consumers:measurement study of Google+, iChat, and Skype. In Proc. ACM IMC,2012.
[47] H. Zhang, K. Chen, W. Bai, D. Han, C. Tian, H. Wang, H. Guan, andM. Zhang. Guaranteeing deadlines for inter-datacenter transfers. InProc. EuroSys, 2015.
262