Study on Field-based Programmatic Measures to Protect Education ...

Measures to Protect the Environment and Conserve Energy
Taken by the United States and Japan: Review of
Quantitative Analysis
Toshi H. Arimura ∗† Kazuyuki Iwata‡
Abstract
This paper reviews policy measures to deal with the environmental problems andenergy conservation in Japan and the United States. First, we examine Japan’spolicy toward air pollution. Second, we discuss the effects of energy conservationpolicies in the consumer sector in Japan and the United States. Third, we reviewthe voluntary approach to ameliorating environmental problems that have recentlygarnered attention. By reviewing the studies evaluating these policies, we find thatthe policies have been mostly successful in both countries. We conclude the paperby discussing the necessity for the future research in applying these policies to localcities in Asian countries.
1 Introduction
While cities in Asia have achieved rapid economic growth, they suffer from a variety of
environmental problems. On the local level, Asian cities are plagued with serious air
pollution and on the global level they face the consequences of global warming. At the
same time, in light of expanded demand for oil and possible depletion of oil reserves in the
future, Asian metropolises are expected to pay closer attention to energy security. Urban
areas are thus required to promote energy conservation both to retard global warming
and to contribute to energy security.
This paper reviews measures taken by Japan and the United States to tackle these is-
sues. We pay special attention to policies that can be implemented by local governments.
∗I appreciate editorial work and comments by Mr. Frank Baldwin. I am grateful to the FinancialSupport from Global Research Fund, Ministry of Environment, Japan.
†Director for the Center for the Environment and Trade Research, Department of Economics, SophiaUniversity, Tokyo, 7-1 Kioicho, Chiyoda-ku, Tokyo 102-8554, Japan. E-mail: [email protected] Tel:03-3238-3203
‡Tokyo Institute of Technology, Japan Society for the Promotion of Science E-mail: [email protected]
������������������� ���� �� �� ��� ������ �������� ������ ����������� �����
����������� ����������� ����!"#"�� ���$����������� �������%� ���������$������
������ �����

We start with recent Japan’s policy toward air pollution. Second, we highlight energy
conservation policies in the consumer sector in Japan and the United States. Thirdly, it
is followed by the voluntary approach to ameliorating environmental problems that have
recently garnered attention. Finally, we conclude the paper by discussing the necessity
for the future research in applying these policies to local cities in Asian countries.
2 Japanese Countermeasures against Air Pollution
During the period of rapid economic growth from the mid-1960s, Japan had extremely
serious air pollution. During the 1970s in particular a number of well-known law suits
were filed by pollution victims. With the introduction of various regulations, however,
Japan succeeded in improving air quality.
2.1 Regulations on Fixed Emission Sources (Factories)
2.1.1 Regulatory Measures
The causes of air pollution can be roughly divided into two categories: fixed emission
sources such as factories and mobile emission sources such as automobiles. Historically,
regulations on the former preceded those on the latter in both Japan and the United
States. The first fixed emission source to be regulated was sulfur oxide (SOx).
Sulfur oxide has been dealt with by a regulation applied to specific facilities called the
k-value control and by the total pollutant load controls imposed on factories in 24 regions
designated by the government. Introduced in 1968, k-value control regulates the height
of exhaust. Total pollutant load controls have been applied since 1974 to areas where
emission sources are concentrated, such as industrial complexes, where it is difficult to
fulfill environmental quality standards with the k-value control and other controls on
individual facilities. For each of these areas, the estimated pollutant concentration is
calculated by air diffusion simulation, which provides a baseline for permissible emission
within environmental quality standards. This amount is applied to every factory in the
region1. In these regions, total pollutant load control standards and fuel usage standards
are determined from the total emission reduction plans prepared by local governments.
1See EIC net: http://www.eic.or.jp/
��������������� ����
��

For factories that are too small for an across-the-board regulation, a limitation is imposed
on the sulfur content of the fuel.
2.1.2 Economic Measures: Levy on Sulfur Oxide
Particularly noteworthy about Japan’s air pollution regulations on fixed emission sources
is the levy on sulfur oxide. As the result of a series of landmark pollution law suits,
factories in the areas with serious air pollution in Tokyo, Nagoya, and Osaka are now
obliged to compensate air pollution victims for damage done to their health. To finance
this compensation, a levy is imposed on the emission of sulfur oxide from local factories.
It is a de facto environmental tax though it is not hence called that and legally it may
not be categorized as such. An economic penalty can be an effective regulatory tool
(Committee on Japan’s Experience in the Battle against Air Pollution, 1997)2.
Figure 1: Changes in the Number of Desulfurizers Installed
The levy system has promoted the installation of the exhaust gas desulfurizer. Ac-
cording to a survey on the enforcement status of the Air Pollution Control Act3, both the
number of exhaust gas desulfurizers installed and their total capacity rapidly increased
in the first half of the 1970s (see Figure 1).
2The committee was set up on the Pollution-Related Health Damage Compensation and PreventionAssociation. The association was restructured into Environmental Restoration and Conservation Agencyof Japan in 2004.
3In 1968, this law was legislated to conserve citizen’s life and environment. The latest revise on thelaw which introduced regulation on volatile organic compound was enacted in 2004.
������������������� ���� �� �� ��� ������ �������� ������ ����������� �����
��
200
o
50
150
100
Million Nm3/h250
.......Total Number A.oo
---Total Capacities
JI"..:/
/I~
500
o
1500
1000
2000
Units2500
oill

2.1.3 Effects of Regulations
Regulations of factories enormously reduced air pollution from sulfur oxide. The con-
centration of sulfur oxide in the air had decreased greatly by the mid-1980s (see Figure
2).
Figure 2: Average Concentration of Sulfur Oxide
2.2 Regulations on Automobiles
2.2.1 Vehicle Unit Regulations
Vehicle unit regulation, the centerpiece of laws on automobiles in Japan, sets the upper
limit to the amount of chemicals emitted by an automobile over a one-kilometer drive
(called “emission intensity”). Japan adopted the emission gas standard on CO in 1966;
NOx and HC were added in 1973 and PM (particulate matter) in 1993;and the standard
was tightened every year thereafter. The changes are shown by type of vehicle in Figure
3 below.
2.2.2 Automobile NOx-PM Law: Vehicle Type Regulation
Despite vehicle unit regulations, the achievement rate of environmental standards for
NOx and PM in metropolitan areas remained low. Continued and enhanced efforts not
��������������� ����
��
0.05
O.M
0.03
0.02
0.01
o
IAmbient Air Quality Sl:Ir>d3rd: 0.041'1""
_General Emission MonilOfing Sl:Iliofls
--Automobile Emission Mooiloring Sl:IIions

Figure 3: Changes in Automobile Emission Standards on NOx
withstanding, the improvement in NOx concentration at roadside air pollution monitoring
stations remained limited (see Figure 4). In fact, only 43 percent of monitoring stations
in the metropolitan areas met the national ambient air quality standard for NOx in 1998.
Achievement of the environmental standard for PM was even worse at 36 percent.
In order to improve the situation, the Automobile NOx-PM Law was enacted in 2001.
This law prohibits registration of a vehicle with a high polluting level (which is synony-
mous with setting the terminal year for the use of such vehicles). The law is intended to
improve NOx concentration by shortening the life span of older vehicles, thereby induc-
ing a switch to newer, less polluting vehicles. Because the law sets the limit by vehicle
type, it is called “vehicle-type regulation.” This law applies in 276 municipalities in three
metropolitan areas (designated“ specified areas”). For the terminal year of each type
of vehicle, see Table 1.
The law applies to all vehicles currently in use except gasoline passenger/special
purpose vehicles. Vehicles that met the 2005 Emission Gas Standard, the newest vehicle
unit regulation standard adopted after enactment of this law in 2001, were exempt.
Since all vehicles marketed after 2002 met this 2005 Emission Gas Standard, they were
������������������� ���� �� �� ��� ������ �������� ������ ����������� �����
��
1972 Emission
Inlllnslty=lDO
'00
00
00
m
00
00
"00
"",
_Gasoline Passenger Car
__Dies.. Passenger C'"
-Gasoline Truck
_Dies.. Truck

Table 1: Terminal Years for Vehicle Registration Stipulated by Vehicle Type Regulationof the Automobile NOx-PM Law
automatically exempt from the Automobile NOx-PM Law (Ministry of Environment,
2005)4.
Vehicle type regulation was the first attempt in Japan to reduce the impact on the
environment caused by older vehicles. No other country has a similar regulation on
vehicles in use. Arimura and Iwata (2008a) and Iwata and Arimura (2009) demonstrate
that this regulation greatly reduced NOx and PM emissions and is highly cost effective.
2.2.3 Measures Taken by Local Governments: Driving Restriction
Under the Automobile NOx-PM Law, local governments not only encourage the preven-
tion of air pollution but are also supposed to take action themselves. In addition to the
vehicle type regulation implemented by the national government, some local governments,
in order to lower PM concentration levels, have adopted a “driving restriction” that pro-
hibits the use of older vehicles. Ten municipalities regulate automobile emissions: Tokyo,
Chiba, Kanagawa, Saitama, Osaka, and Hyogo Prefectures as well as Chiba, Saitama,
Kawasaki, and Yokohama. (The eight around Tokyo are hereinafter referred to as the
“eight municipalities”).
These eight municipalities ban old diesel trucks, buses, and special motor vehicles that
do not meet the 1999 Emission Gas Standard. In order to drive these vehicles owners
4Due to the 2005 Emission Gas Standard set forth in 2001, manufacturers were prohibited frommarketing vehicles that did not meet this standard after 2002.
��������������� ����
��
- ,"_.. ._. -- - ~~ - ._. - ~_. -_.- - ~. •• ~ -<-,- -.- ~- ~-,_..- ~ ~ - ~ ~ ~ ~ ~ - -,- ~ ~ - - - - ~ ~ - -,- - ~ - - - - - - - -,., - - ~ - - - - - - -,m - - ~ - - - - - - -,., - - ~ ~ ~ ~ - - - -,- ~ - - ~ ~ ~ ~ ~ - -,., ~ - - - - - - - - -,- - - ~ - - - - - - -,m - - ." - - - - - - -,- - - ." ~ - - - - - -,- - - ." ." ." ." - - - -- ." - ." ." ." ." ." ." 2010 ."~, ." 2010 ." ." .., ." ." ." 2011 ."~ ." 2011 ." 'B .., 'B ." .., '"12 ."

are required to install designated PM removal equipments. Owners are given a certain
grace period–seven years after the initial registration year across the board–before they
must install the device. While the vehicle type regulation implemented by the national
government is targeted at vehicles that do not meet the 2005 Emission Gas Standard,
municipal regulations apply only to vehicles that do not meet the 1999 Standard.
2.2.4 Effectiveness of Regulations
As the result of these national and local government measures, about 91 percent and 93
percent of roadside air pollution monitoring stations achieved the environmental standard
for NOx and PM, respectively (Ministry of Environment, 2008). Regarding concentration
of NOx (Figure 4) and PM (Figure 5), while the maximum value of PM rose in 2001,
both emissions declined steadily after 2001. This improvement is mostly attributable
to vehicle type regulation by the national government and driving restrictions by local
governments.
Figure 4: Changes in Annual Average Concentration of NOx
������������������� ���� �� �� ��� ������ �������� ������ ����������� �����
��
0.15
o
-Genef:ll Emission Moni1o<ing Sl:Ilioos
_Automobile Emission Mooilofing Slatioos, -•IAmbient AX Quality Sl:Indard 0-.1 ~
""'-

Figure 5: Changes in Annual Average Concentration of PM and Hourly Data of theHighest Concentration
Note: GEMS: General Emission Monitoring Stations, AEMS: Automobile Emission Monitoring Stations
3 Energy Conservation Policies in Japan and in the UnitedStates
Main sources of greenhouse gas are the industrial, (residential and commercial) consumer,
and transport sectors. Emission amounts vary greatly by sector. In Japan, while green-
house gas emission tends to be under control in the industrial sector, the amount of
emission in the consumer and transport sectors has increased greatly compared to that
in 1990. In contrast to the transport sector, whose CO2 emission has been declining since
the peak year of 2001, greenhouse gas emission in the consumer sector has continued to
increase (Figure 6).
The consumer sector emits about 40 percent of the total greenhouse gas in the United
States and the amount has been rising rapidly. Energy consumption and greenhouse gas
emission in the consumer sector will also increase in rapid growing Asian cities; energy
conservation in this sector will have a significant impact on the overall fight against global
warming.
��������������� ����
��
0.7
0.6
0.5
<") 0.4E
"E 0.3
0.2
0.1
-+- Annual Average (GEMS)
1'1 , _Annual Average(AEMS)
\\ /\ -.- Hourly data of the highest concentration (GEMS)
\AI\ """'*""" Hourly data of the highest concentration (AEMS)
~~--x-~~"
IAmbient Air Quality Stndard (Hourly) O.2mg/m3 1 ~"-/,
1'\ IAmbient Air Quality StndardCAverage) O.lmg/ m3 1
~
I~- -o~~ ~fo ~'O r.o~ ro'1; ~ f./:)fo f.b'b
,~ ,~ ,~ ,~ ,0:) ,O:i ,t?i ,O:i?l'0 ?l"- RIb< ?lfo RICO ...(\<:::l ...(\')., -"to.
,~ ,~ ,~ ,O:i ,O:i '\.'J' ').,IJ"' ",IJ"'
Year

Figure 6: Annual CO2 emission by sector (Constructed from data by National Institutefor Environmental Studies)
Note: the 2008 values are quick estimations
3.1 The Energy Saving Law: A Successful Case in Japan
An example of energy conservation in Japan’s consumer sector is the Energy Saving Law
(ESL), the popular name for the Law Concerning the Rational Use of Energy, which was
enacted in 1979 to enhance energy use after the oil crisis of 1973-1974. One of ESL’s
important provisions is the so-called top runner regulations.
Energy management under ESL aims to reduce energy use in designated establish-
ments by 1 percent per basic unit5. Although the target is less energy use (heat/electricity)
and not greenhouse gas, lowering heat and electricity use entails decreasing consumption
of fossil fuel and contributes to the reduction of greenhouse gas emissions. In recent years,
the ESL has been categorized as a countermeasure against global warming6. ESL is ex-
plicitly cited in the Kyoto Protocol target achievement plan and is expected to contribute
to the 3-million-ton reduction of greenhouse gas in the consumer sector7.
5“Basic unit” can be measured with output in manufacturing sectors. In the case of hotel industry,the size of floor space was a popular measure.
6Kyoto Protocol Target Achievement Plan, 2005.7See Attached Table 1: List of Measures and Policies Concerning Energy-
originated Carbon Dioxide, Kyoto Protocol Target Achievement Plan, available athttp://www.kantei.go.jp/foreign/policy/kyoto/050428plan e.pdf
������������������� ���� �� �� ��� ������ �������� ������ ����������� �����
��
""

3.1.1 Energy Management in ESL
ESL divides fuel into “heat” and “electricity” and encourages fuel conservation in estab-
lishments that exceed the designated amount of either. Under the amended ESL of 2003,
a factory that uses more than 3,000 kl (oil equivalent) of fossil fuel per year is classified as
a Type 1 designated heat management factory and a factory that uses more than 1,500
kl per year is classified as Type 2. In terms of electricity use, a factory that consumes
more than 12 million kwh per year is classified as a Type 1 designated electricity man-
agement factory, while a factory that uses more than 6 million kwh per year is classified
as a Type 2. Establishments subject to ESL must designate energy management spe-
cialists, including qualified heat and electricity managers, and keep records on heat and
electricity usage. These factories must periodically report the amount of electricity and
heat consumption, the amount of production, and the energy use per units of production.
They also report their own energy saving measures.
Obligations and sanctions differ for Type 1 and the Type 2 facilities. The former are
required to prepare and submit a mid- to long-term plan on energy conservation. The
latter are supposed to improve their operations if their energy saving efforts are found to
be unsatisfactory. Type 1 factories must prepare and implement a rationalization plan.
Their owners are requested to exercise more stringent control on its operation, which is
expected to provide an incentive to conserve energy. How is the“ thorough management
of energy”stipulated by ESL actually implemented?
The relevant administrative authority conducts on-site inspections of factories to en-
courage compliance. At the self-inspection conducted at each factory on the occasion
of an on-site inspection, managers must rate on a scale from zero to two such elements
as the control standard, compliance with the standards, and the measuring, recording,
conservation, and inspections for each main facility. If the total score is less than 50
points, the factory’s energy use rationalization efforts are rated unsatisfactory and it is
subject to on-the-spot inspections and factory staff are instructed in the rationalization
plan (The Energy Conservation Center, Japan, 2005).
��������������� ����
��

3.1.2 Effects of the Energy Saving Law
Arimura and Iwata (2008b) examined the effect of ESL on inns and hotel industry subject
to the law and found that greenhouse gas emission was reduced by 3.2 percent from heat
use and 1 percent from electricity use between 2002 and 2004 (see Table 2). The effect
was particularly significant in establishments designated as Type 1 facilities, qualitatively
endorsing energy management under ESL as a countermeasure against global warming.
Table 2:Effect of the Energy Saving Law on Inns and Hotels (2002-2004)
3.2 Energy Conservation Drive in the U.S. Consumer Sector
In the United States, an energy saving standard is applied to electric appliances and to
buildings as a part of energy saving measures in the consumer sector.
3.2.1 (Mandatory) Appliance Standard
The system of (mandatory) appliance standards to conserve energy was first introduced
in California in 1977 and targeted refrigerators and freezers. The state government
expanded the list to include fluorescent lights, various air conditioning devices, air-
conditioning equipment for entire buildings, furnaces, boilers, water heaters, and shower
heads. Other states, including New York, followed suit. The federal government enacted
the National Appliance Energy Conservation Act (hereinafter NAECA) in 1987. The
NAECA imposes energy conservation standards on fifteen home appliance products (re-
frigerator, freezer, washing machine, clothes dryer, dish washer, cooking range, electric
oven, air conditioner, electric heater, water heater, etc.) (Arimura et al. 2007).
The initial standards have been raised several times. In the Energy Policy Act of 1992,
������������������� ���� �� �� ��� ������ �������� ������ ����������� �����
��
Heat Electricity
Amount of energy saved 3.20% 1.00%
Amount of C02 reduced 22,650 tons 7,436 tons

standards were set on such products as induction motors, various kinds of light bulbs,
and air conditioners for commercial use and these were updated in 1997, 2000, and 2001
to reflect technological advances. Sixteen products were added to the list in the Energy
Policy Act of 2005. Between 2008-2011, fluorescent lights, dehumidifiers, and clothes
dryers will come under the standard. The New Energy Act enacted by the 110th Congress
imposes more stringent rules on light bulbs. The incandescent light bulb developed by
Thomas Edison will disappear from the market in a few years, replaced by compact
fluorescent lights and light-emitting diodes. The original NAECA stipulated that federal
standards take precedence over state standards, but it allowed state governments to set
their own standards on products not covered by federal law. The Department of Energy
failed to update within the time limit standards on 20 products designated by the 1992
federal act, enabling states to set their own efficiency standards on those products. In
California, for instance, efficiency standards were added in 2004 on 17 products, including
incandescent light bulbs and swimming pool pumps.
3.3 Energy Saving Building Code
Building promote energy saving by setting the minimum energy efficiency standard on
such items as the floor, wall, ceiling, and window of residential and commercial buildings.
State governments have also taken various independent measures in this field. The
first building code regarding energy was adopted by California in 1977, followed by
Florida, New York, Minnesota, Oregon, and Washington in the 1980s. Also in the 1980s,
the Council of American Building Officials established a model energy standard that
was renamed the International Energy Conservation Code (IECC) in the 1990s with the
purpose of integrating measures taken independently by various states. Standards for
commercial buildings are set by the American Society of Heating, Refrigerating, and Air-
Conditioning Engineers (ASRHAE) and other related organizations. As of December
2006, a building code for energy conservation had been adopted by 39 states and Wash-
ington, D.C. Figure 7 illustrates the stringency of residential building codes by state.
It should be noted, however, that these building codes are not without problems. The
framework for ensuring compliance may be inadequate and there is a great discrepancy
in the degree of compliance among states. (ACEEE).
��������������� ����
��
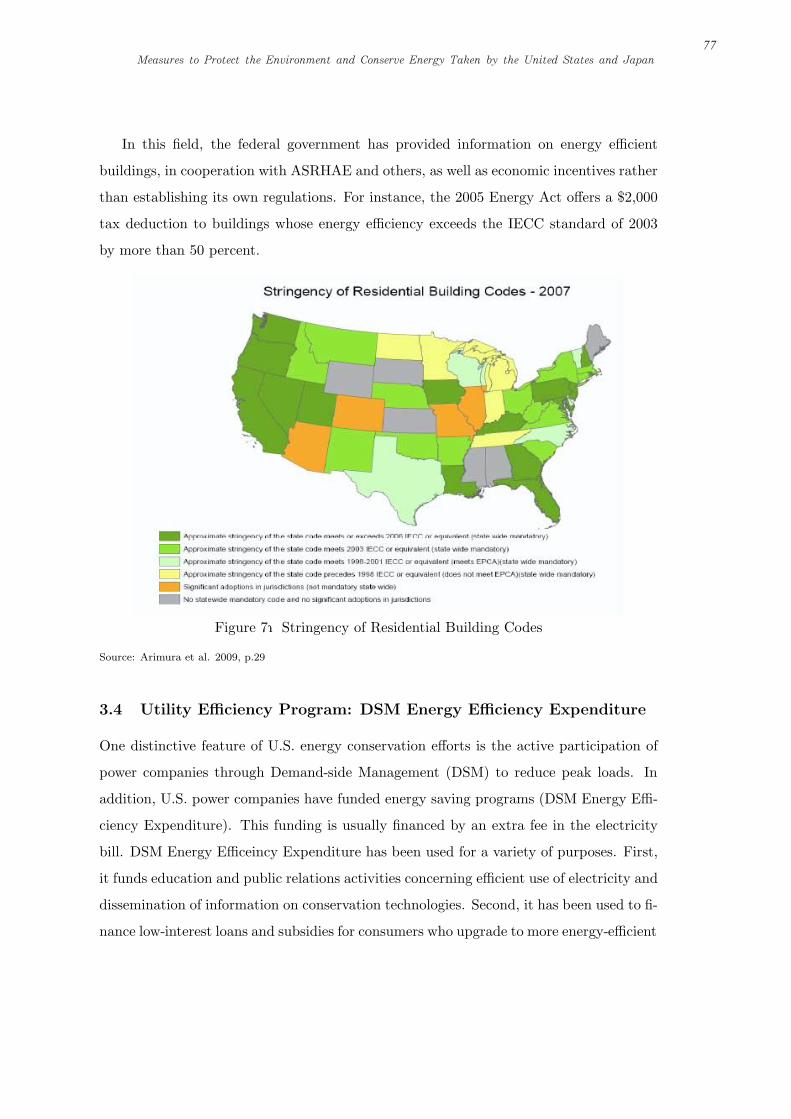
In this field, the federal government has provided information on energy efficient
buildings, in cooperation with ASRHAE and others, as well as economic incentives rather
than establishing its own regulations. For instance, the 2005 Energy Act offers a $2,000
tax deduction to buildings whose energy efficiency exceeds the IECC standard of 2003
by more than 50 percent.
Figure 7:Stringency of Residential Building Codes
Source: Arimura et al. 2009, p.29
3.4 Utility Efficiency Program: DSM Energy Efficiency Expenditure
One distinctive feature of U.S. energy conservation efforts is the active participation of
power companies through Demand-side Management (DSM) to reduce peak loads. In
addition, U.S. power companies have funded energy saving programs (DSM Energy Effi-
ciency Expenditure). This funding is usually financed by an extra fee in the electricity
bill. DSM Energy Efficeincy Expenditure has been used for a variety of purposes. First,
it funds education and public relations activities concerning efficient use of electricity and
dissemination of information on conservation technologies. Second, it has been used to fi-
nance low-interest loans and subsidies for consumers who upgrade to more energy-efficient
������������������� ���� �� �� ��� ������ �������� ������ ����������� �����
��
Stringency of Residential Building Codes - 2007
_ .,....._ -v-ry ... Oh. _ ~.. _ .....---.."..., OF"" ~...,._,.,... -.. -........._ _*_.."._,_.-,...,I<CC"'''''''''_{ •O _*_.."·_""".-,__"',, ..CC"'__••PCA'.....__'
0 -*_"",_""",,""'" , cc " ......_'_ ... ..--EPCO.'. _----,-,,-{ ......-.., .-,.,_._-"""'-"' ....-....~..--..

equipment. The figure below depicts the changes in the energy saving expenditures of
U.S. power companies. After peaking in 1993 at $1.6 billion, they shrank rapidly as
deregulation progressed. The incremental upward trend has returned since 1998 due to
the greater attention paid to global warming and energy security, except for temporary
drops in 2003. In 2006, expenditures reached $1.25 billion.
Figure 8:Changes in Energy Saving Expenditure
Note: Constructed by the author on EIA86
In recent years the effectiveness of these energy saving expenditures has been widely
debated. According to reports and studies by U.S. power companies, the cost to save
1kwh of electricity varies between $0.008 and $0.2298.
3.4.1 Effects of Energy Saving Policy: The Case of California
What impact have these energy saving standards had so far? In California they have
restrained power consumption. National per capita average power consumption increased
by 50 percent in the 25 years after 1975. In contrast, per capita consumption in California
hardly rose. This accomplishment is credited to the efficiency standards for electrical
appliances and the energy conservation standards for buildings, as well as to energy
saving programs carried out by power companies. Figure 9 below shows the contribution
each made to energy conservation (control of power consumption) in California.
8Gillingham et al.(2006)
��������������� ����
��
US'1 million
"--", '"
r
"- ./ ""./~

Figure 9: Components of Energy Conservation Efforts in California
Source: Rosenfeld , 2007
4 Voluntary Measures
Economic measures such as the environmental tax and carbon emission trading are im-
portant and have been adopted. Because reaching a consensus to adopt them often takes
a long time, however, a system to facilitate voluntary measures by private corporations
has drawn attention in Japan and the United States9.
4.1 What is a Voluntary Approach?
The voluntary approach has several variations. One form is an emission reduction goal
set through negotiations between the government and several private corporations. An
example of this type is Japan’s Pollution Control Agreement (Welch and Hibiki, 2002).
Local governments try to use this format with corporations operating in their areas to
reduce the concentration of emissions below the official standard. These agreements are
only binding on corporations and offices that sign up. There are cases where private cor-
porations voluntarily participate in a program implemented by the government and/or a
9For example, Morgenstern and Pizer (2007) verified the effects of voluntary approaches in variouscountries.
������������������� ���� �� �� ��� ������ �������� ������ ����������� �����
��
·5,000 , ---,
-15% of Annual Electricity Use in California in 2003 -..~,-t------===-=-==========-=71
35,000 t_----------------------""--
~,-t_----------------/"~
1"'-i 2ll,000 t_---------/--
15,000 t_---------,./
Utility EtTiciencyPJogr ...... at. coat of
-1'10 of "leclric bill
Buildinou SlafIda,,-ds
In,ooo tI~::::~~~~~~~::~:::~;;:~~~:=:::======~::::::~~J,- t_---7/ AppIiM>CfI Staodardl
•

a public authority to reducedamage to the environment10. For instance, the United States
has a voluntary program to reduce toxic chemical compounds (33/50 Program) and one to
cut energy consumption by private corporations (Green Light Program). Participating
companies pledge to achieve a specific goal. Since the names of the corporations are
announced, they gain a reputation as friendly to the environment among consumers and
investors. Failure to achieve the stated goal, however, is not penalized.
4.2 A Voluntary Approach in Japan: ISO1400 Certification
4.2.1 4.2.1 What is ISO14001?
In recent years, environmental management has become increasingly important for pri-
vate corporations. Many have embraced ISO14001, a standard adopted in 1996 by the
International Organization for Standardization to create an intra-corporation/office man-
agement system to reduce environmental damage. Because it is up to the discretion of
each corporation/office whether to obtain ISO certification, ISO14001 is a voluntary ap-
proach. Corporations/offices that want certification establish a“ PDCA”management
cycle, i.e.,“plan, do, check, and act” for the reduction of emissions of toxic substances.
The “act” refers to reviewing the plan after checking its achievements. Certification is
valid for three years; participants are subject to regular outside audits. Those who wish
to renew the certification must undergo an inspection. Enrolled organizations that are
found unsatisfactory in terms of PDCA criteria in an outside audit or renewal inspection
lose ISO certification or are denied renewal. According to the International Organization
for Standardization (2007), 129,199 corporations in 140 countries had obtained certifica-
tion as of December 2006. Compared to 5,585 in the United States and 5,415 in Germany,
22,593 corporations/offices in Japan are certified, giving Japan by far the largest number
of ISO certifications.
The effect of environmental management in general on the reduction of environmental
damage has been studied by Anton et al. (2004). Even ISO certification alone has been
proven effective in reducing corporate emissions. For example, Potoski and Prakash
10There also is a case of the voluntary approach in which business organizations take the initiative insetting the emission reduction goal and request member corporations to comply with this goal, includingthe Federation of Economic Organization’s“Keidanren Voluntary Action Plan.”It is discussed in detailin Wakabayashi and Sugiyama (2007), but it is beyond the scope of the present paper.
��������������� ����
��

(2005), using data from U.S. companies, demonstrated that ISO certification can lead to
the reduction of chemical substances. Arimura et al. (2008), using data from Japanese
manufacturers, showed that ISO certification has reduced resource use and emission of
solid waste.
4.2.2 Encouragement of a Voluntary Approach by Local Governments
Environmental management via ISO14001 is typically a voluntary measure taken by
private corporations. Local governments have also implemented various measures to
facilitate these voluntary steps, as shown below (Hibiki and Arimura, 2004).
(a) Reduce the frequency of regulatory inspections
(b) Expedite environmental permits
(c) Consolidate environmental permits
(d) Waive environmental regulations
(e) Reduce stringency of regulatory thresholds
(f) Offer technical assistance
(g) Provide financial support
(h) Give special recognition or awards
(i) Implement preferences for public procurement (“Green Purchasing”)
(j) Disseminate information about the value of environmental management
Arimura et al. (2008) reveals that, thanks to these measures, the number of corpo-
rations obtaining ISO14001 in Japan has increased by 13.5 percent, proving that local
governments can facilitate voluntary measures in the private sector.
4.3 Example of the Voluntary Approach in the United States: “EnergyStar”
To improve the energy efficiency of corporations and individuals, the U.S. government
has implemented a voluntary program called “Energy Star” that covers five major areas11
(a) Products
(b) Home Improvement
(c) New Homes
11http://www.energystar.gov/
������������������� ���� �� �� ��� ������ �������� ������ ����������� �����
��

(d) Commercial Buildings and Plants
(e) Partner Resources
The program is well known for endorsing qualified products with an “Energy Star”
label and has set its own efficiency standards for more than 50 products. Products
that meet the standard receive the label of energy star, which is believed to influence
consumers to purchase energy-efficient goods. While the mandatory appliance standards
apply to conventional products such as washing machines and refrigerators, The Energy
Star program encompasses relatively newer products such as computers. In July 2007,
for instance, the labeling policy for computers was amended and 649 models from 35
manufacturers were recognized as Energy Star products. New buildings are also eligible
under the program, including the construction of energy-efficient new houses and a $1,000
tax credit for buildings that meet a certain standard. The program covers existing
buildings too, for instance, through technical assistance to enhance the efficiency of air-
conditioning.
Energy Star also helps to improve energy efficiency in existing commercial buildings
and industrial plants through energy management. Buildings and factories that meet
the standard can call themselves “Partners of Energy Star.” The Energy Management
Guideline, for offices advocates seven actions:
Step1:Make a Commitment
Step2:Assess Performance
Step3: Set Goals
Step4:Create Action Plan
Step5: Implement Action Plan
Step6:Evaluate Progress
Step7:Recognize Achievements
Step1 has three stages: (a) designate the personnel in charge of energy management;
(b) form an energy team in the office, and (c) create the energy plan. In Japan, too,
��������������� ����
��

designation of personnel at the office level is mandatory under the Energy Conservation
Law. In Japan, however, energy consumption is divided into heat and electricity and
offices are required to have both certified heat managers and certified electricity managers.
Both Energy Star and Japan’s Energy Conservation Law stress the importance of on-site
energy managers. The steps above are illustrated in Figure 9. The circle indicates that
steps four through seven are repeated over and over. The arrow-tipped line indicates
all six steps (excluding the first) are repeated through Re-Assess. In that sense, this
guideline is similar to ISO14001, which repeats the PDCA (Plan, Do, Check, Action).
Figure 10: Energy Management under Energy Star
Source: http://www.energystar.gov/index.cfm?c=guidelines.guidelines index
This program is available on the Energy Star website. Those who accomplish the
following steps qualify as a “Partner of Energy Star”:
(a) Measure energy performance and set the benchmark
(b) Make a plan to improve energy performance by adopting the strategy recom-
mended by Energy Star
(c) Inform colleagues and the public that they are a“ Partner of Energy Star”and
what that means
������������������� ���� �� �� ��� ������ �������� ������ ����������� �����
��
r

This kind of affirmative labeling is also applicable to buildings. Energy Star certi-
fication, like ISO14001, announces that the building manager is taking actions that are
environmentally friendly.
How does this method conserve energy? One way is efficient utilization of existing
facilities, in other words, refraining from wasteful practices. Another is investment in new
conservation methods. The Environmental Protection Agency (EPA) expects that build-
ing managers will not only pursue efficient energy use in existing facilities but also become
aware of hitherto unnoticed opportunities for conservation, investment, and technology.
4.3.1 Effects of Energy Management
According to EPA (2006), some 15,000 organizations have participated in the Energy
Star management program12. This is equivalent to 16 percent of the total space in U.S,
commercial buildings. Given that 18 percent of the total emission of CO2 in the United
States comes from commercial buildings, this is not a negligible number13.
How effective has energy management been in energy conservation? EPA (2003)
estimates that it improved energy efficiency by 20 percent to 30 percent. Although that
does not mean total energy consumption was reduced by 20 percent, nevertheless it is a
significant impact. EPA’s provisional calculation of the effect of energy management in
absolute terms, based on the estimate of Horowitz (2001), suggests that more than 47.5
billion kwh was conserved14.
5 Conclusions
This paper summarized air pollution policies, energy conservation policies and voluntary
measures to tackle environmental issues in Japan and the United States. We reviewed
studies evaluating the effectiveness of these policies. Most of the studies find that these
policies have been successful in both countries. The experiences of the environmental
policies and energy conservation policies reviewed in this paper may give valuable lessons
to local governments in Asia.
12Climate Protection Partnerships Division, U.S. Environmental Protection Agency. (2003).13http://www.energystar.gov/index.cfm?c=business.bus protect environment14Table 3 in Climate Protection Partnerships Division, U.S. Environmental Protection (EPA, 2003).
��������������� ����
��

It is not clear, however, whether these policies can be successfully applicable to cities
in Asia. For example, the success of energy conservation policy in Japan may depend on
the unique relationship between the regulators and private sectors. Thus, some caution
or modification may be needed before they are introduced to Asian cities. Future research
is needed to examine the conditions for the applicability of the reviewed policies to Asian
cities.
References
Anton, W. R. Q., Deltas, G. and Khanna, M., 2004. Incentives for Environmental Self-
regulation and Implications for Environmental Performance, Journal of Environmental
Economics and Management, 48, 632-654.
Arimura, T. H., Hibiki, A. and Katayama, H., 2008. Is a Voluntary Approach an Effective
Environmental Policy Instrument? A Case for Environmental Management Systems,
Journal of Environmental Economics and Management 55(3), 281-295.
Arimura, T. H., Burtraw, D., Krupnick, A. and Palmer, K., 2007. US Climate Pol-
icy Developments, Resources for the Future Discussion Paper No.07-45. Available at
http://www.rff.org/RFF/Documents/RFF-DP-07-45.pdf
Arimura, T. H. and Iwata, K., 2008a. NOx・PM-Ho ni Okeru Shashu Kisei no Keizai
Bunseki: Teiryo-teki Seisaku Hyoka (Economic Analysis on Motor-Vehicle Type Reg-
ulation: Policy Evaluation of NOx-PM Law), Kankyo Kagaku Kaishi (Environmental
Science), 21(2), 103-114. (in Japanese).
Arimura, T. H. and Iwata, K., 2008b. Ondanka Taisaku to Shiteno‘ Sho Enerugi Ho
ni yoru Enerugi Kanri no Tettei’no Hyoka: Ryokan・Hoteru-gyo wo Taisho to Shite
(The CO2 emission reduction under the Law Concerning the Rational Use of Energy:
An empirical study of energy management in the Japanese hotel industry), Kankyo
Keizai-Seisaku Kenkyu (Review of Environmental Economics and Policy studies) (1),
79-89. (in Japanese) .
Arimura, T. H., Newell, R. G. and Palmer, K. L., 2009 Cost-Effectiveness of Elec-
������������������� ���� �� �� ��� ������ �������� ������ ����������� �����
��

tricity Energy Efficiency Programs, RFF Discussion Paper, 09-48. Available at
http://www.rff.org/RFF/Documents/RFF-DP-09-48.pdf
Climate Protection Partnerships Division, U.S. Environmental Protection Agency, 2006.
ENERGY STARR and Other Climate Protection Partnerships. 2005 Annual Report.
Climate Protection Partnerships Division, U.S. Environmental Protection Agency, 2003.
Change for the Better, ENERGY STAR and Other Voluntary Programs. 2002 Annual
Report.
Committee on Japan’s Experience in the Battle against Air Pollution, 1997. Nihon no
Taiki Osen Keiken?Jizoku Kano na Kaihatsu eno Chosen (Japan’s Experience in the
Battle against Air Pollution), The Pollution-Related Health Damage Compensation
and Prevention Association. (in Japanese).
Gillingham, K., Newell, R. and Palmer, K., 2006. Energy Efficiency Policies: A Retro-
spective Examination. Annual Review of Environment and Resources, 31, 161-192.
Hibiki, A. and Arimura, T. H., 2004. Environmental Policy Tools and Firm-Level Man-
agement in Japan. Available at http://www.oecd.org/dataoecd/22/29/31650143.pdf.
Horowitz, M. J., 2001. Economic Indicators of Market Transformation: Energy Efficient
Lighting and EPA ’s Green Lights. The Energy Journal, 2(4), 95-122.
International Organization for Standardization, 2007. The ISO Survey of Certifications
2006. Available at http://www.iso.org/iso/survey2006.pdf.
Iwata, K. and Arimura, T. H., 2009. Economic Analysis of Japanese Air Pollution Regu-
lation: An Optimal Retirement Problem under Vehicle Type Regulation in the NOx-
Particulate Matter Law. Transportation Research Part D, 21(3), 157-167.
Morgenstern, R. D. and Pizer, W. A., 2007. Reality Check: the nature and performance
of voluntary environmental programs in the United States, Europe, and Japan. Wash-
ington, D.C.: RFF Press.
��������������� ����
��

Potoski, M. and Prakash, A., 2005. Covenants with Weak Swords: ISO14001 and Fa-
cilities’ Environmental Performance. Journal of Policy Analysis and Management, 24,
745-769.
Rosenfeld, A. H., 2007. Energy Efficiency for California, the US, the World No. 1 in the
California “Loading Order”.
Wakabayashi, M. and Sugiyama, T., 2007. Japan’s Keidanren Voluntary Action Plan on
the Environment: R. D. Morgenstern, W. A. Pizer, eds. Reality Check: the nature and
performance of voluntary environmental programs in the United States, Europe, and
Japan, Washington, D.C.: RFF Press, 43-63.
Welch, E. W. and Hibiki, A., 2002. Japanese Voluntary Environmental Agreements:
Bargaining Power and Reciprocity as Contributors to Effectiveness. Policy Science,
35(4), 401-424.
Ministry of Environment, 2005. Jidosha NOx・PM-Ho no Shashu Kisei ni Tu-
ite (On Vehicle Type Regulations of NOx-PM Law). (in Japanese) Available at
http://www.env.go.jp/air/car/pamph/all.pdf.
Ministry of Environment, 2008. Heisei 20-nen Kankyo Junkangata Shakai Hakusho. 2008
Annual Report on the Environment and the Sound Material-Cycle Society in Japan,
Tokyo. (in Japanese)
The Energy Conservation Center, Japan, 2005. Heisei 16-nendo Shin Energi to Donyu
Sokushin Kiso Chosa. Kojo Handan Kijun Junshu Jokyo Kiso Chosa (2004 Basic Survey
on Promotion of Introduction of New Energy Sources: Basic Survey on Compliance of
Criterion Standards in Factories). (in Japanese)
������������������� ���� �� �� ��� ������ �������� ������ ����������� �����
��