MM 323 MAN SYS 2012 FALL 3 Manufacturing Performance Measures
Business Management Dynamics Vol.2, No.11, May 2013, pp.07-19
©Society for Business and Management Dynamics
Measures of Flexibility and Advanced Manufacturing Technologies: About the Significant Correlations and the Logic of the Measurements
Cosmo Severiano Filho1, Walter Fernando Araújo De Moraes2 and Adriano David Monteiro Barros3 Abstract The central issue examined in this article is related to measures of flexibility adopted by industrial companies that use AMT's in their production systems. It has as objective to describe costs components associated with evaluation metrics of flexibility, its significant correlations with the technologies used, as well as the contributions that derive from the survey conducted among the 500 largest companies in the Brazilian industrial sector. Among this population, 21 companies that participated in the random sample responded to an electronic form of the survey. For these metrics, the inferential analysis indicated negative correlations of moderate significance, strong and very high with 12 types of AMT's. The negative correlations of moderate significance were between the IA and the CAE, CIM, CAM, FMC, FMS, PFA and TPM technologies; between TO and CIM, EAV and EDI technologies; between TS and the CAD, CAE and CAM technologies; between TP and ABC, PFA and TQC technologies; between IR and CAM and PFA technologies; and between TF and CAE, CAM and PFA technologies. Considering that the significant correlations for these measures are of a negative nature (moderate), has been the confirmation of the hypothesis that many components of flexibility have no validity or use with the AMT's plants investigated. The cost components used in the preparation of flexibility metrics are considered unconventional and are used to measure the production system flexibility in different dimensions 04: (i) product flexibility, as measured by the costs of absenteeism and set-up; (ii) process flexibility, designated by shutdowns costs and lead time; (iii) flexibility of the machine, determined by idleness and under-utilization costs; and (iv) flexibility in demand, measured by stock rotation costs. Research conclusions point to the inference that a system of flexibility measures must be configured by metrics that are bound to the dimensions of flexibility it is intended to measure and assess, because the scope is a function of the measurement flexibility measures required for the production system. Both partial measurements as the metrics of aggregate nature should be promoted by pre-established assessment criteria provided the measure of flexibility as part of the evaluation of organizational performance.
Key words: Advanced Manufacturing Technology; Flexibility Metrics; Flexibility Costs.
Available online www.bmdynamics.com
ISSN: 2047-7031
THE PROBLEM AND ITS THEORETICAL PERSPECTIVE Among production strategies, operational flexibility has been singled out as one of the competitive priorities in companies with significant impacts in reducing waiting times, the manufacturing lead time and delivery deadlines. In the scope of industrial production, the design and implementing strategy requires the absorption of innovated technological features, formatting a configuration able to lead the organization to advanced manufacturing status (MA). The modular configuration of an MA plant involves tangible resources and equipment (hardware, robotics and mechatronics) as well as intangible assets (software, rules, standards and methods) that are designed (originally) and which remain active under the impact of technological innovation and, therefore, able to respond to issues of organizational performance and competitiveness of their structures. In this sense, control and alignment of resources are the focus of industrial management, demanding
1 Federal University of Paraíba - UFPB – Brazil, Post-Graduate Program in Production Engineering [email protected] 2 Federal University of Pernambuco - UFPE – Brazil, Post-Graduate Program in Administration [email protected] 3 Federal University of Paraíba – UFPB, Post-Graduate Program in Production Engineering [email protected]
Business Management Dynamics Vol.2, No.11, May 2013, pp.07-19
©Society for Business and Management Dynamics
monitoring activities, measurement, tweaks and updates (KRAJEWSKY et al., 2009). Industrial
intelligence is formatted to track system performance and model evaluation and improvement solutions, focused on previously programmed results. Organizational assessment focus has been valuating performance purposes that go beyond manufacturing operations tangible nature, including vectors associated with human capital, organization, technology and knowledge, which are not quite sufficient in appropriate methodologies for identification, tracing and metrification. According to strategic models, productivity measures are relevant analysis information, and can be used both in intra and extra-enterprise environments evaluation phase as in competitive strategies formulation, and could be allocated, respectively, in the company external and internal environment analysis and definition of goals and targets (KOTLER and KELLER, 2006). In a broader perspective of organizational performance, there is the approach of the vector as a marker of productivity evaluation in addition to production assets, including intangible resources. From that viewpoint, it is possible to identify costs that link not only to physical resources consumption (labor, materials, machinery etc.), but also to non-physical resources (skills, multifunctionality, artificial intelligence etc.). A large part of intangibility costs, also called complex or hidden costs, binds the flexibility built into the production system, and can be reflected in various dimensions, such as: machine flexibility, product, process, manufacturing route job etc. Those flexibility dimensions, in turn, reflect in organizational performance and require measurement and evaluation compositions (CORRÊA and CORRÊA, 2012). Recent studies show that it is necessary to give equal attention to instrumental and behavioral dimensions in a performance management system. An appropriate combination of those dimensions allows for better benchmarking of competitive performance (WAAL, 2010). Therefore, the evaluation of organizational performance linked to competitive organizational strategies can reflect more effectively the achieved results, besides contributing to the creation of an organizational culture based on successful results. Many considerations have been raised by the authors, almost always to set the benchmarks in assessing the performance of an advanced production system. Theoretical trace on the edge of this proposition, the available literature records three major evaluation dimensions assigned to those systems: the dimensions of productivity, quality and flexibility (RICHARDSON and GORDON, 1980). Performance measurement is understood as the process of quantifying the action, where measurement is the process of quantification of action that leads to performance (Neely, 2005). According to Corrêa and Corrêa (2012), is possible qualify competitive strategic priorities of an operation in five general groups, namely: cost, quality, flexibility, speed and reliability. Specialized literature has aroused an important discussion on company’s management and production strategies, pointing out such instruments as significant factors for productivity performance. According to Severiano Filho (1995), the emerging concepts of this new strategic order, translated by trade-offs of high relevance in productivity, quality and flexibility are the main features of the so-called Advanced Manufacturing Technologies-AMT's. The organizational performance of an MA environment should reflect the intrinsic characteristics of the configured technologies so that a measure for its measurement involves productivity, quality and flexibility parameters. Such parameters are almost always absent in classical performance evaluation methodologies, because they involve tangible and intangible aspects of the new settings. In this regard, qualitative models for measuring organizational performance involving human capital and intangible assets have contributed greatly to a more accurate assessment and fine performance of the company as a whole (KAPLAN and NORTON, 1992; EDVISSON and MALONE, 1998; SVEIBY, 2000; PROBST, RAUB and RONHARDT, 2002). Trends of research in the field of organizational performance metrification pointed out the integrated assessment modeling of various capital involved in the production (human, organizational, physical and technological), as well as the joints of these competitive strategies adopted by companies. According to Pereira (2003), competitiveness and performance are related to intrinsically because performance
Business Management Dynamics Vol.2, No.11, May 2013, pp.07-19
©Society for Business and Management Dynamics
evaluation is the manner in which the organization verifies effectiveness of their strategic decisions, which in turn influence competitiveness of organizations or systems. In this sense, the problem examined in this article is related to measures of flexibility adopted by industrial companies that use AMT's in their production systems. Its target is to describe the costs components associated with evaluation metrics of flexibility, their significant correlations with the technologies used, as well as the contributions that derive from the accomplished research. MATERIAL AND RESEARCH METHOD Theoretically, the survey is based on concepts of organizational performance, advanced manufacturing and competitive strategy. It was accomplished in 05 (five) operating procedures, organized according to the nature of the study and in conformity with methodological principles of scientific research process, so as to grant the achievement of the proposed objectives. The procedures were as follows: (i) update of theoretical research frameworks; (ii) data collection search form modeling; (iii) pre validation tests and methodological adjustments; (iv) application and remote monitoring of the form; and (v) statistical processing and quantitative and qualitative data analysis. The investigated population was set based on an appointment held by 1000 Value Magazine (published in Valor Econômico newspaper, November 2011. The referred publication identified the 500 largest manufacturers in Brazil, listed in order of net revenues. Of this universe, we used a random type sample and probabilistic, recorded by 165 companies from different activity sectors. The research variables were converted into items and these into data, composing a survey questionnaire (electronic and manual version), formulated with 101 items, arranged in 04 classes of variables: deployed technology programs; organizational and technological components of the productive process; process performance metrics; company's competitive strategy. The pilot tests were performed on 03 big manufactures (Indaiá, Ceramics Elizabeth and GSM), not included in the sample. Taking as basis the conducted pilot tests, a new form was then prepared, which was tested by two academics from the manufacturing area, an industrial consultant and one academic of research methodology area. The electronic form was forwarded to research subjects (Executive Manager), previously identified and accredited (via website-contact us resource) to join the research. Afterwards the manual version of the form was sent, via mail merge, in the same order of submission of the respondents stated. Data collection process, in both ways, resulted in a composition of 21 questionnaires answered, being 13 by electronic and direct mail for 08. The respondent composition, here called "laboratory etnocases", corresponded to various activity branches, including metallurgy and steelmaking, oil and gas, sugar and alcohol, textile, chemical, food and beverage, construction and engineering, fertilizers and cellulose. Completed forms were stored in a database (EC2M Data System-postdoctoral research), getting a statistical
analysis (descriptive and inferential) from SPSS software – Version 20.0. The test was the Spearman correlation, with analyses based on the methodology proposed by Bryman and Cramer (2003). To study the possible relationship between the variables studied (AMT's and flexibility metrics), it was determined the Pearson correlation coefficient between them. According to Figueiredo Filho and Silva Junior (2009), the correlation measures the direction and the degree of linear relationship between two quantitative variables and the Pearson correlation coefficient (r) is a measure of linear association between variables. The formula for Pearson's coeficiente is given by:
The Pearson correlation coefficient ranges from -1 to +1. Still according to the authors, the sign indicates positive or negative direction of the relationship and the value suggests the strength of the relationship between the variables. A perfect correlation ( -1 or +1) indicates that the score of a variable can be determined exactly when you know the score. On the other hand, a correlation of zero value indicates that there is no linear relationship between the variables. For the purposes of analysis of the results, we used the scale proposed by Bryman and Cramer (2003), according to which the values between 0.10 and 0.39 are considered weak; values between 0.40 and 0.69 can be considered as moderate; values between 0.70 and 0.89 are treated as strong and the values between
Business Management Dynamics Vol.2, No.11, May 2013, pp.07-19
©Society for Business and Management Dynamics
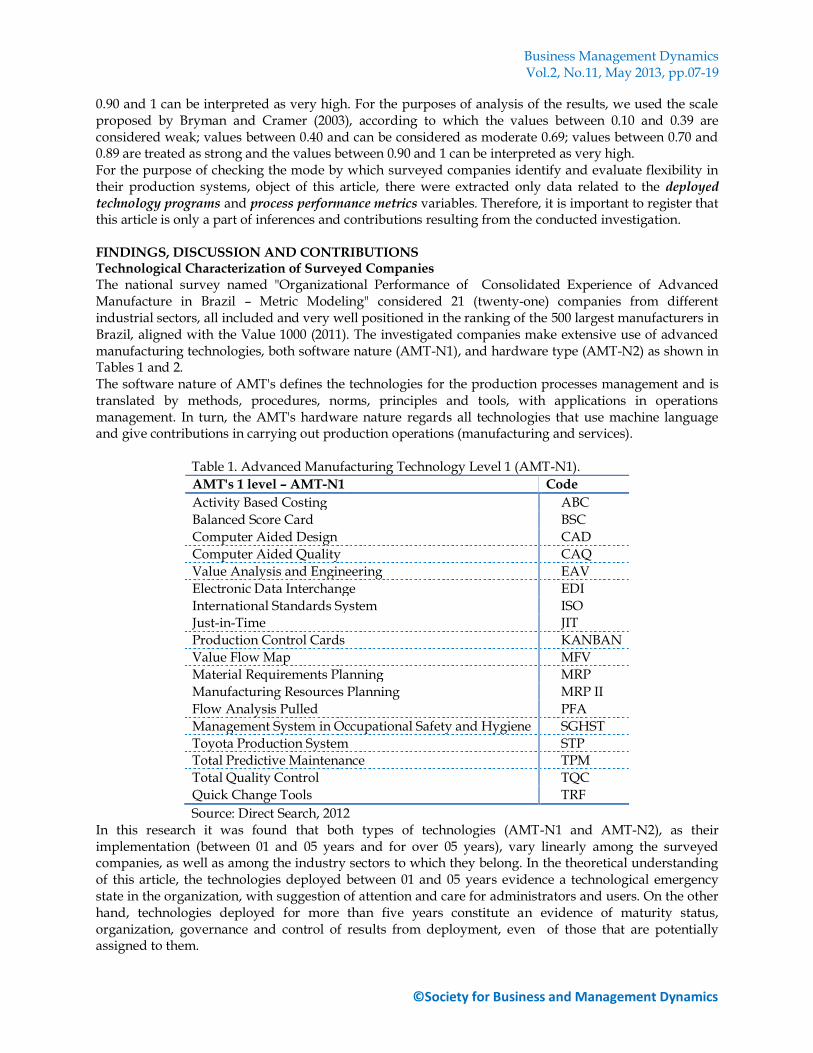
0.90 and 1 can be interpreted as very high. For the purposes of analysis of the results, we used the scale proposed by Bryman and Cramer (2003), according to which the values between 0.10 and 0.39 are considered weak; values between 0.40 and can be considered as moderate 0.69; values between 0.70 and 0.89 are treated as strong and the values between 0.90 and 1 can be interpreted as very high. For the purpose of checking the mode by which surveyed companies identify and evaluate flexibility in their production systems, object of this article, there were extracted only data related to the deployed technology programs and process performance metrics variables. Therefore, it is important to register that this article is only a part of inferences and contributions resulting from the conducted investigation. FINDINGS, DISCUSSION AND CONTRIBUTIONS Technological Characterization of Surveyed Companies The national survey named "Organizational Performance of Consolidated Experience of Advanced Manufacture in Brazil – Metric Modeling" considered 21 (twenty-one) companies from different industrial sectors, all included and very well positioned in the ranking of the 500 largest manufacturers in Brazil, aligned with the Value 1000 (2011). The investigated companies make extensive use of advanced manufacturing technologies, both software nature (AMT-N1), and hardware type (AMT-N2) as shown in Tables 1 and 2. The software nature of AMT's defines the technologies for the production processes management and is translated by methods, procedures, norms, principles and tools, with applications in operations management. In turn, the AMT's hardware nature regards all technologies that use machine language and give contributions in carrying out production operations (manufacturing and services).
Table 1. Advanced Manufacturing Technology Level 1 (AMT-N1).
AMT's 1 level – AMT-N1 Code
Activity Based Costing ABC
Balanced Score Card BSC
Computer Aided Design CAD
Computer Aided Quality CAQ
Value Analysis and Engineering EAV
Electronic Data Interchange EDI
International Standards System ISO
Just-in-Time JIT
Production Control Cards KANBAN
Value Flow Map MFV
Material Requirements Planning MRP
Manufacturing Resources Planning MRP II
Flow Analysis Pulled PFA
Management System in Occupational Safety and Hygiene SGHST
Toyota Production System STP
Total Predictive Maintenance TPM
Total Quality Control TQC
Quick Change Tools TRF
Source: Direct Search, 2012 In this research it was found that both types of technologies (AMT-N1 and AMT-N2), as their implementation (between 01 and 05 years and for over 05 years), vary linearly among the surveyed companies, as well as among the industry sectors to which they belong. In the theoretical understanding of this article, the technologies deployed between 01 and 05 years evidence a technological emergency state in the organization, with suggestion of attention and care for administrators and users. On the other hand, technologies deployed for more than five years constitute an evidence of maturity status, organization, governance and control of results from deployment, even of those that are potentially assigned to them.
Business Management Dynamics Vol.2, No.11, May 2013, pp.07-19
©Society for Business and Management Dynamics
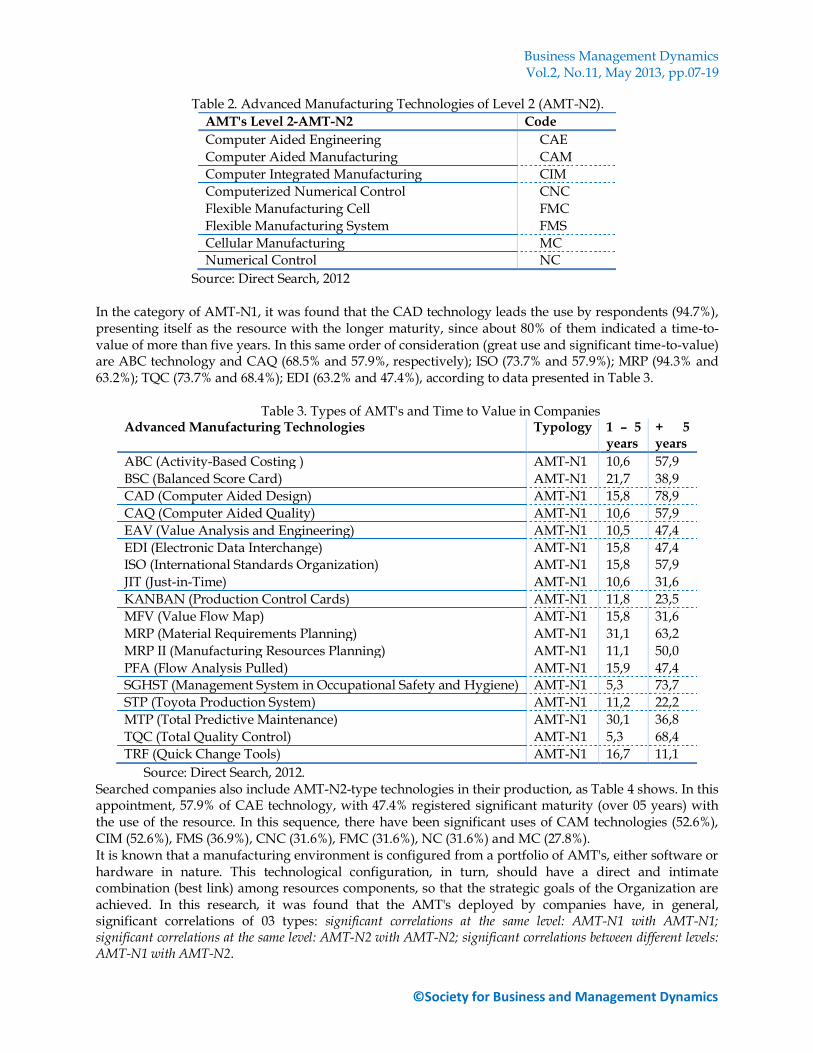
Table 2. Advanced Manufacturing Technologies of Level 2 (AMT-N2).
AMT's Level 2-AMT-N2 Code
Computer Aided Engineering CAE
Computer Aided Manufacturing CAM
Computer Integrated Manufacturing CIM
Computerized Numerical Control CNC
Flexible Manufacturing Cell FMC
Flexible Manufacturing System FMS
Cellular Manufacturing MC
Numerical Control NC
Source: Direct Search, 2012 In the category of AMT-N1, it was found that the CAD technology leads the use by respondents (94.7%), presenting itself as the resource with the longer maturity, since about 80% of them indicated a time-to-value of more than five years. In this same order of consideration (great use and significant time-to-value) are ABC technology and CAQ (68.5% and 57.9%, respectively); ISO (73.7% and 57.9%); MRP (94.3% and 63.2%); TQC (73.7% and 68.4%); EDI (63.2% and 47.4%), according to data presented in Table 3.
Table 3. Types of AMT's and Time to Value in Companies Advanced Manufacturing Technologies Typology 1 – 5
years + 5 years
ABC (Activity-Based Costing ) AMT-N1 10,6 57,9
BSC (Balanced Score Card) AMT-N1 21,7 38,9
CAD (Computer Aided Design) AMT-N1 15,8 78,9
CAQ (Computer Aided Quality) AMT-N1 10,6 57,9
EAV (Value Analysis and Engineering) AMT-N1 10,5 47,4
EDI (Electronic Data Interchange) AMT-N1 15,8 47,4
ISO (International Standards Organization) AMT-N1 15,8 57,9
JIT (Just-in-Time) AMT-N1 10,6 31,6
KANBAN (Production Control Cards) AMT-N1 11,8 23,5
MFV (Value Flow Map) AMT-N1 15,8 31,6
MRP (Material Requirements Planning) AMT-N1 31,1 63,2
MRP II (Manufacturing Resources Planning) AMT-N1 11,1 50,0
PFA (Flow Analysis Pulled) AMT-N1 15,9 47,4
SGHST (Management System in Occupational Safety and Hygiene) AMT-N1 5,3 73,7
STP (Toyota Production System) AMT-N1 11,2 22,2
MTP (Total Predictive Maintenance) AMT-N1 30,1 36,8
TQC (Total Quality Control) AMT-N1 5,3 68,4
TRF (Quick Change Tools) AMT-N1 16,7 11,1
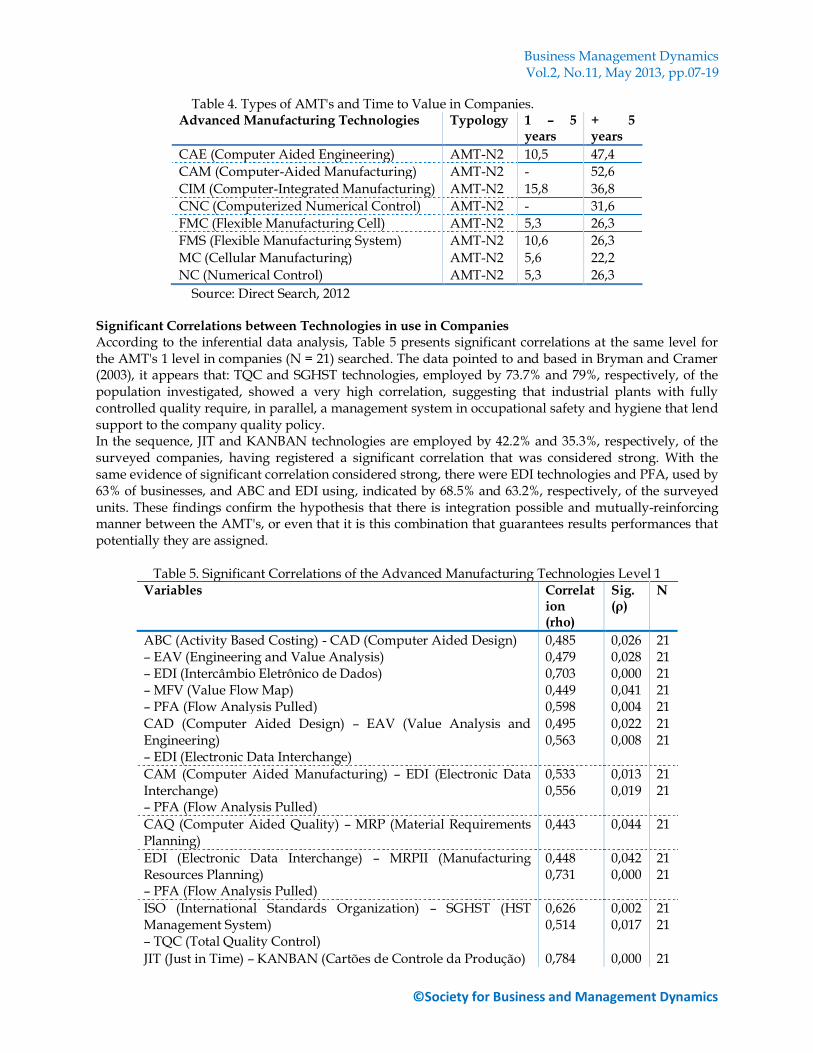
Source: Direct Search, 2012. Searched companies also include AMT-N2-type technologies in their production, as Table 4 shows. In this appointment, 57.9% of CAE technology, with 47.4% registered significant maturity (over 05 years) with the use of the resource. In this sequence, there have been significant uses of CAM technologies (52.6%), CIM (52.6%), FMS (36.9%), CNC (31.6%), FMC (31.6%), NC (31.6%) and MC (27.8%). It is known that a manufacturing environment is configured from a portfolio of AMT's, either software or hardware in nature. This technological configuration, in turn, should have a direct and intimate combination (best link) among resources components, so that the strategic goals of the Organization are achieved. In this research, it was found that the AMT's deployed by companies have, in general, significant correlations of 03 types: significant correlations at the same level: AMT-N1 with AMT-N1; significant correlations at the same level: AMT-N2 with AMT-N2; significant correlations between different levels: AMT-N1 with AMT-N2.
Business Management Dynamics Vol.2, No.11, May 2013, pp.07-19
©Society for Business and Management Dynamics
Table 4. Types of AMT's and Time to Value in Companies. Advanced Manufacturing Technologies Typology 1 – 5
years + 5 years
CAE (Computer Aided Engineering) AMT-N2 10,5 47,4
CAM (Computer-Aided Manufacturing) AMT-N2 - 52,6
CIM (Computer-Integrated Manufacturing) AMT-N2 15,8 36,8
CNC (Computerized Numerical Control) AMT-N2 - 31,6
FMC (Flexible Manufacturing Cell) AMT-N2 5,3 26,3
FMS (Flexible Manufacturing System) AMT-N2 10,6 26,3
MC (Cellular Manufacturing) AMT-N2 5,6 22,2
NC (Numerical Control) AMT-N2 5,3 26,3
Source: Direct Search, 2012 Significant Correlations between Technologies in use in Companies According to the inferential data analysis, Table 5 presents significant correlations at the same level for the AMT's 1 level in companies (N = 21) searched. The data pointed to and based in Bryman and Cramer (2003), it appears that: TQC and SGHST technologies, employed by 73.7% and 79%, respectively, of the population investigated, showed a very high correlation, suggesting that industrial plants with fully controlled quality require, in parallel, a management system in occupational safety and hygiene that lend support to the company quality policy. In the sequence, JIT and KANBAN technologies are employed by 42.2% and 35.3%, respectively, of the surveyed companies, having registered a significant correlation that was considered strong. With the same evidence of significant correlation considered strong, there were EDI technologies and PFA, used by 63% of businesses, and ABC and EDI using, indicated by 68.5% and 63.2%, respectively, of the surveyed units. These findings confirm the hypothesis that there is integration possible and mutually-reinforcing manner between the AMT's, or even that it is this combination that guarantees results performances that potentially they are assigned.
Table 5. Significant Correlations of the Advanced Manufacturing Technologies Level 1 Variables Correlat
ion (rho)
Sig. (ρ)
N
ABC (Activity Based Costing) - CAD (Computer Aided Design) – EAV (Engineering and Value Analysis) – EDI (Intercâmbio Eletrônico de Dados) – MFV (Value Flow Map) – PFA (Flow Analysis Pulled)
0,485 0,479 0,703 0,449 0,598
0,026 0,028 0,000 0,041 0,004
21 21 21 21 21
CAD (Computer Aided Design) – EAV (Value Analysis and Engineering) – EDI (Electronic Data Interchange)
0,495 0,563
0,022 0,008
21 21
CAM (Computer Aided Manufacturing) – EDI (Electronic Data Interchange) – PFA (Flow Analysis Pulled)
0,533 0,556
0,013 0,019
21 21
CAQ (Computer Aided Quality) – MRP (Material Requirements Planning)
0,443 0,044 21
EDI (Electronic Data Interchange) – MRPII (Manufacturing Resources Planning) – PFA (Flow Analysis Pulled)
0,448 0,731
0,042 0,000
21 21
ISO (International Standards Organization) – SGHST (HST Management System) – TQC (Total Quality Control)
0,626 0,514
0,002 0,017
21 21
JIT (Just in Time) – KANBAN (Cartões de Controle da Produção) 0,784 0,000 21
Business Management Dynamics Vol.2, No.11, May 2013, pp.07-19
©Society for Business and Management Dynamics
– MFV (Value Flow Map) – PFA (Flow Analysis Pulled) – STP (Toyota Production System)
0,649 0,548 0,677
0,001 0,010 0,001
21 21 21
KANBAN (Production Control Cards) – MFV (Value Stream Map) – STP (Toyota Production System) – TPM (Total Predictive Maintenance) – TRF (Quick Change Tools)
0,673 0,615 0,448 0,606
0,001 0,003 0,042 0,004
21 21 21 21
MFV (Value Stream Map) – PFA (Flow Analysis Pulled) –TRF (Quick Change Tools)
0,510 0,571
0,018 0,007
21 21
MRP (Material Requirements Planning) – MRP II (Manufacturing Resources Planning)
0,460 0,036 21
MRP II (Manufacturing Resources Planning) – PFA (Flow Analysis Pulled) – STP (Toyota Production System)
0,506 0,443
0,019 0,044
21 21
PFA (Flow Analysis Pulled) – TPM (Total Predictive Maintenance) – TQC (Total Quality Control) – TRF (Quick-Change Tool)
0,572 0,503 0,476
0,079 0,020 0,029
21 21 21
STP (Toyota Production System)– TRF (Quick-Change Tool) 0,444 0,044 21
TQC (Total Quality Control) – SGHST (HST Management System)
0,873 0,000 21
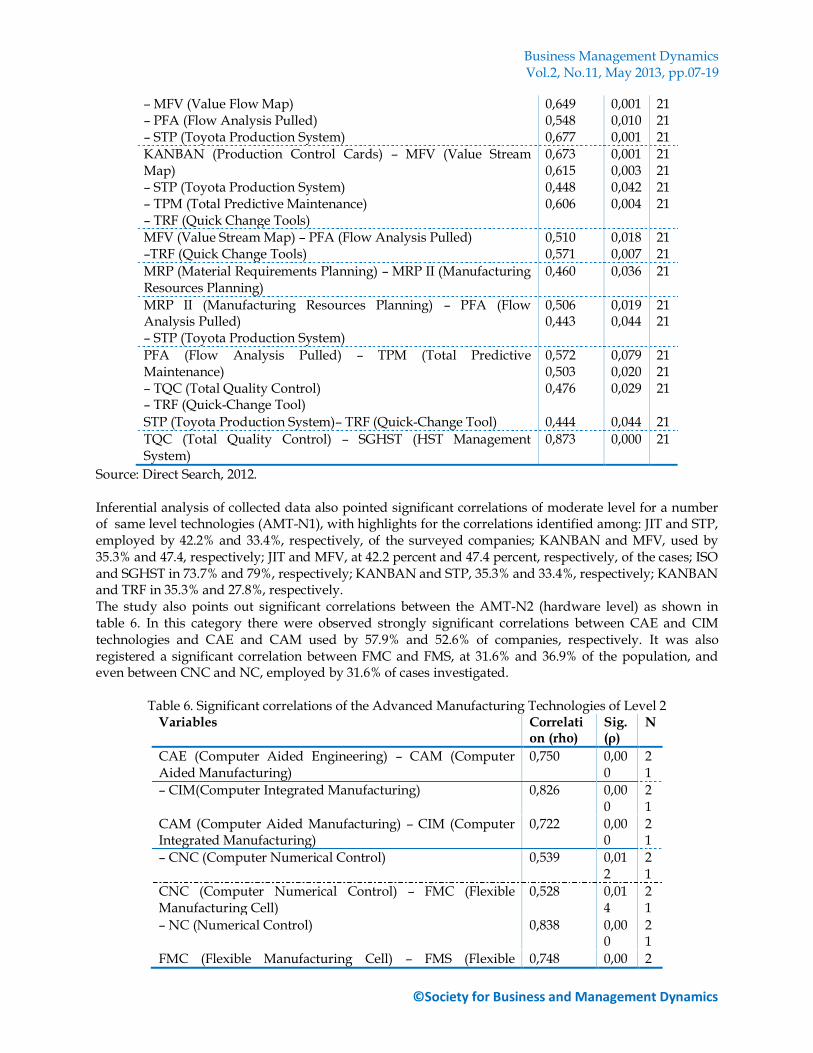
Source: Direct Search, 2012. Inferential analysis of collected data also pointed significant correlations of moderate level for a number of same level technologies (AMT-N1), with highlights for the correlations identified among: JIT and STP, employed by 42.2% and 33.4%, respectively, of the surveyed companies; KANBAN and MFV, used by 35.3% and 47.4, respectively; JIT and MFV, at 42.2 percent and 47.4 percent, respectively, of the cases; ISO and SGHST in 73.7% and 79%, respectively; KANBAN and STP, 35.3% and 33.4%, respectively; KANBAN and TRF in 35.3% and 27.8%, respectively. The study also points out significant correlations between the AMT-N2 (hardware level) as shown in table 6. In this category there were observed strongly significant correlations between CAE and CIM technologies and CAE and CAM used by 57.9% and 52.6% of companies, respectively. It was also registered a significant correlation between FMC and FMS, at 31.6% and 36.9% of the population, and even between CNC and NC, employed by 31.6% of cases investigated.
Table 6. Significant correlations of the Advanced Manufacturing Technologies of Level 2 Variables Correlati
on (rho) Sig. (ρ)
N
CAE (Computer Aided Engineering) – CAM (Computer Aided Manufacturing)
0,750 0,000
21
– CIM(Computer Integrated Manufacturing) 0,826 0,000
21
CAM (Computer Aided Manufacturing) – CIM (Computer Integrated Manufacturing)
0,722 0,000
21
– CNC (Computer Numerical Control) 0,539 0,012
21
CNC (Computer Numerical Control) – FMC (Flexible Manufacturing Cell)
0,528 0,014
21
– NC (Numerical Control) 0,838 0,000
21
FMC (Flexible Manufacturing Cell) – FMS (Flexible 0,748 0,00 2
Business Management Dynamics Vol.2, No.11, May 2013, pp.07-19
©Society for Business and Management Dynamics
Manufacturing System) 0 1
– MC (Cellular Manufacturing) 0,596 0,004
21
– NC (Numerical Control) 0,574 0,007
21
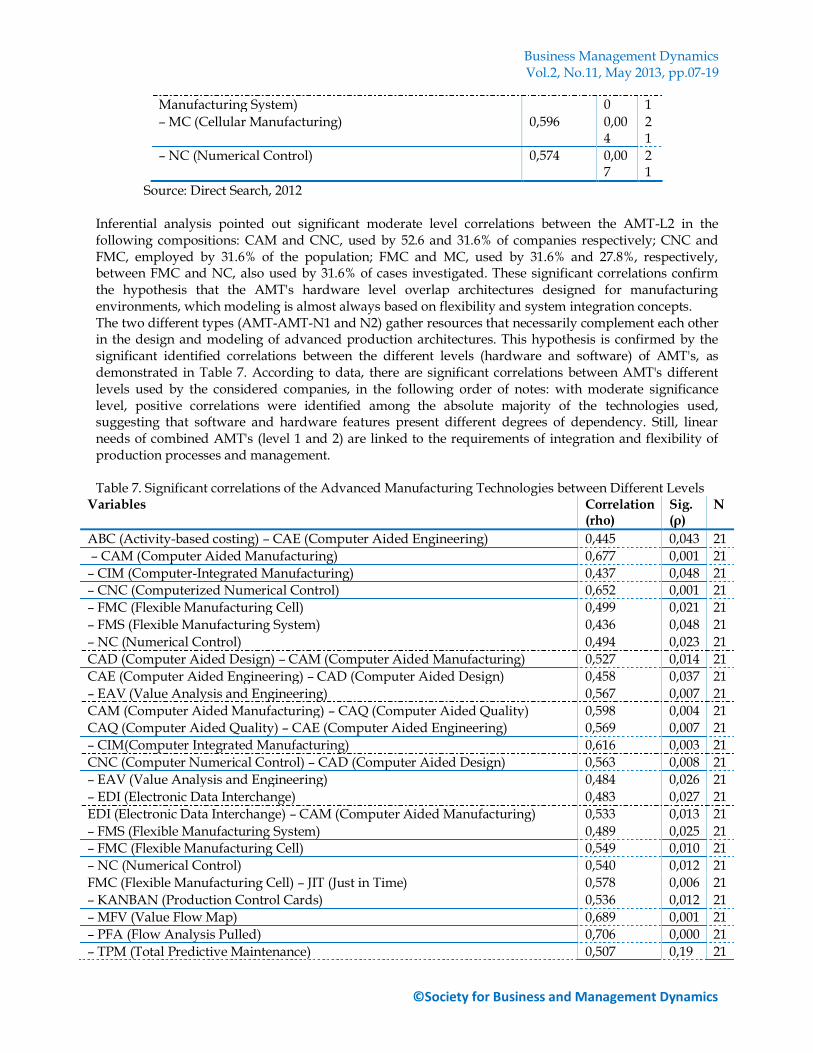
Source: Direct Search, 2012 Inferential analysis pointed out significant moderate level correlations between the AMT-L2 in the following compositions: CAM and CNC, used by 52.6 and 31.6% of companies respectively; CNC and FMC, employed by 31.6% of the population; FMC and MC, used by 31.6% and 27.8%, respectively, between FMC and NC, also used by 31.6% of cases investigated. These significant correlations confirm the hypothesis that the AMT's hardware level overlap architectures designed for manufacturing environments, which modeling is almost always based on flexibility and system integration concepts. The two different types (AMT-AMT-N1 and N2) gather resources that necessarily complement each other in the design and modeling of advanced production architectures. This hypothesis is confirmed by the significant identified correlations between the different levels (hardware and software) of AMT's, as demonstrated in Table 7. According to data, there are significant correlations between AMT's different levels used by the considered companies, in the following order of notes: with moderate significance level, positive correlations were identified among the absolute majority of the technologies used, suggesting that software and hardware features present different degrees of dependency. Still, linear needs of combined AMT's (level 1 and 2) are linked to the requirements of integration and flexibility of production processes and management. Table 7. Significant correlations of the Advanced Manufacturing Technologies between Different Levels
Variables Correlation (rho)
Sig. (ρ)
N
ABC (Activity-based costing) – CAE (Computer Aided Engineering) 0,445 0,043 21
– CAM (Computer Aided Manufacturing) 0,677 0,001 21
– CIM (Computer-Integrated Manufacturing) 0,437 0,048 21
– CNC (Computerized Numerical Control) 0,652 0,001 21
– FMC (Flexible Manufacturing Cell) 0,499 0,021 21
– FMS (Flexible Manufacturing System) 0,436 0,048 21
– NC (Numerical Control) 0,494 0,023 21
CAD (Computer Aided Design) – CAM (Computer Aided Manufacturing) 0,527 0,014 21
CAE (Computer Aided Engineering) – CAD (Computer Aided Design) 0,458 0,037 21
– EAV (Value Analysis and Engineering) 0,567 0,007 21
CAM (Computer Aided Manufacturing) – CAQ (Computer Aided Quality) 0,598 0,004 21
CAQ (Computer Aided Quality) – CAE (Computer Aided Engineering) 0,569 0,007 21
– CIM(Computer Integrated Manufacturing) 0,616 0,003 21
CNC (Computer Numerical Control) – CAD (Computer Aided Design) 0,563 0,008 21
– EAV (Value Analysis and Engineering) 0,484 0,026 21
– EDI (Electronic Data Interchange) 0,483 0,027 21
EDI (Electronic Data Interchange) – CAM (Computer Aided Manufacturing) 0,533 0,013 21
– FMS (Flexible Manufacturing System) 0,489 0,025 21
– FMC (Flexible Manufacturing Cell) 0,549 0,010 21
– NC (Numerical Control) 0,540 0,012 21
FMC (Flexible Manufacturing Cell) – JIT (Just in Time) 0,578 0,006 21
– KANBAN (Production Control Cards) 0,536 0,012 21
– MFV (Value Flow Map) 0,689 0,001 21
– PFA (Flow Analysis Pulled) 0,706 0,000 21
– TPM (Total Predictive Maintenance) 0,507 0,19 21
Business Management Dynamics Vol.2, No.11, May 2013, pp.07-19
©Society for Business and Management Dynamics
– TRF (Quick Change Tool) 0,542 0,011 21
FMS (Flexible Manufacturing System) – JIT (Just in Time) 0,538 0,012 21
– KANBAN (Production Control Cards) 0,504 0,020 21
– MFV (Value Flow Map) 0,641 0,002 21
– PFA (Flow Analysis Pulled) 0,641 0,002 21
– TPM (Total Predictive Maintenance) 0,579 0,006 21
– TRF (Quick Change Tool) 0,692 0,001 21
JIT (Just in Time) – MC (Cellular Manufacturing) 0,527 0,014 21
KANBAN (Production Control Cards) – MC (Cellular Manufacturing) 0,699 0,000 21
MC (Cellular Manufacturing) – MFV (Value Flow Map) 0,434 0,049 21
– STP (Toyota Production System) 0,544 0,011 21
– TPM (Total Predictive Maintenance) 0,440 0,046 21
– TRF (Quick |Change Tools) 0,659 0,001 21
NC (Numerical Control) – PFA (Flow Analysis Pulled) 0,547 0,010 21
– STP (Toyota Production System) 0,434 0,049 21
– TQC (Total Quality Control) 0,439 0,046 21
TPM (Total Predictive Maintenance) – CIM (Computer-Integrated Manufacturing) 0,524 0,015 21
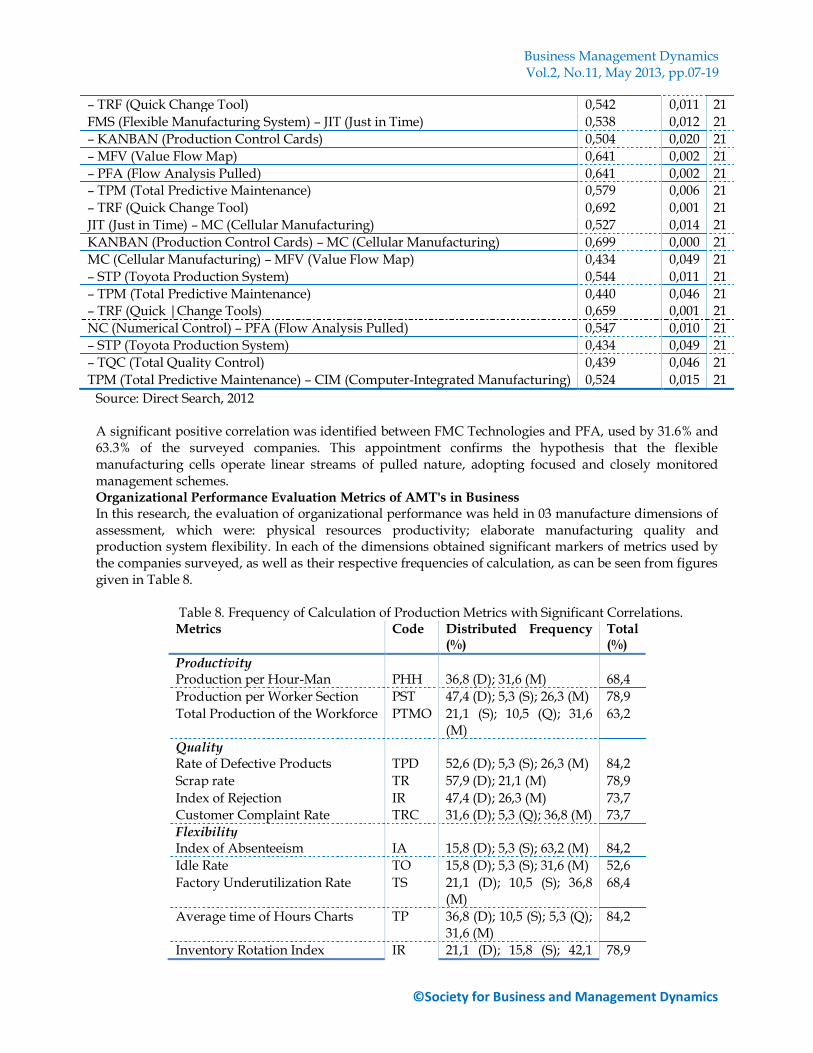
Source: Direct Search, 2012 A significant positive correlation was identified between FMC Technologies and PFA, used by 31.6% and 63.3% of the surveyed companies. This appointment confirms the hypothesis that the flexible manufacturing cells operate linear streams of pulled nature, adopting focused and closely monitored management schemes. Organizational Performance Evaluation Metrics of AMT's in Business In this research, the evaluation of organizational performance was held in 03 manufacture dimensions of assessment, which were: physical resources productivity; elaborate manufacturing quality and production system flexibility. In each of the dimensions obtained significant markers of metrics used by the companies surveyed, as well as their respective frequencies of calculation, as can be seen from figures given in Table 8.
Table 8. Frequency of Calculation of Production Metrics with Significant Correlations. Metrics Code Distributed Frequency
(%) Total (%)
Productivity Production per Hour-Man PHH 36,8 (D); 31,6 (M) 68,4
Production per Worker Section PST 47,4 (D); 5,3 (S); 26,3 (M) 78,9
Total Production of the Workforce PTMO 21,1 (S); 10,5 (Q); 31,6 (M)
63,2
Quality Rate of Defective Products TPD 52,6 (D); 5,3 (S); 26,3 (M) 84,2
Scrap rate TR 57,9 (D); 21,1 (M) 78,9
Index of Rejection IR 47,4 (D); 26,3 (M) 73,7
Customer Complaint Rate TRC 31,6 (D); 5,3 (Q); 36,8 (M) 73,7
Flexibility Index of Absenteeism IA 15,8 (D); 5,3 (S); 63,2 (M) 84,2
Idle Rate TO 15,8 (D); 5,3 (S); 31,6 (M) 52,6
Factory Underutilization Rate TS 21,1 (D); 10,5 (S); 36,8 (M)
68,4
Average time of Hours Charts TP 36,8 (D); 10,5 (S); 5,3 (Q); 31,6 (M)
84,2
Inventory Rotation Index IR 21,1 (D); 15,8 (S); 42,1 78,9
Business Management Dynamics Vol.2, No.11, May 2013, pp.07-19
©Society for Business and Management Dynamics
(M)
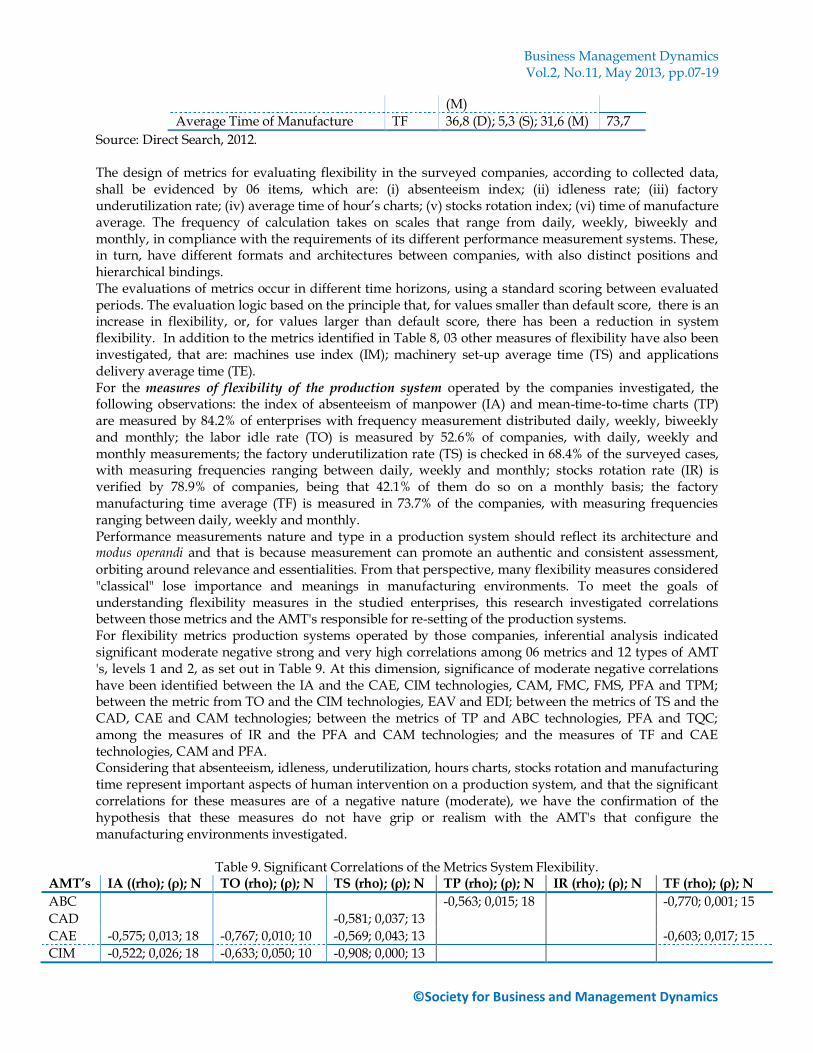
Average Time of Manufacture TF 36,8 (D); 5,3 (S); 31,6 (M) 73,7
Source: Direct Search, 2012. The design of metrics for evaluating flexibility in the surveyed companies, according to collected data, shall be evidenced by 06 items, which are: (i) absenteeism index; (ii) idleness rate; (iii) factory underutilization rate; (iv) average time of hour’s charts; (v) stocks rotation index; (vi) time of manufacture average. The frequency of calculation takes on scales that range from daily, weekly, biweekly and monthly, in compliance with the requirements of its different performance measurement systems. These, in turn, have different formats and architectures between companies, with also distinct positions and hierarchical bindings. The evaluations of metrics occur in different time horizons, using a standard scoring between evaluated periods. The evaluation logic based on the principle that, for values smaller than default score, there is an increase in flexibility, or, for values larger than default score, there has been a reduction in system flexibility. In addition to the metrics identified in Table 8, 03 other measures of flexibility have also been investigated, that are: machines use index (IM); machinery set-up average time (TS) and applications delivery average time (TE). For the measures of flexibility of the production system operated by the companies investigated, the following observations: the index of absenteeism of manpower (IA) and mean-time-to-time charts (TP) are measured by 84.2% of enterprises with frequency measurement distributed daily, weekly, biweekly and monthly; the labor idle rate (TO) is measured by 52.6% of companies, with daily, weekly and monthly measurements; the factory underutilization rate (TS) is checked in 68.4% of the surveyed cases, with measuring frequencies ranging between daily, weekly and monthly; stocks rotation rate (IR) is verified by 78.9% of companies, being that 42.1% of them do so on a monthly basis; the factory manufacturing time average (TF) is measured in 73.7% of the companies, with measuring frequencies ranging between daily, weekly and monthly. Performance measurements nature and type in a production system should reflect its architecture and modus operandi and that is because measurement can promote an authentic and consistent assessment,
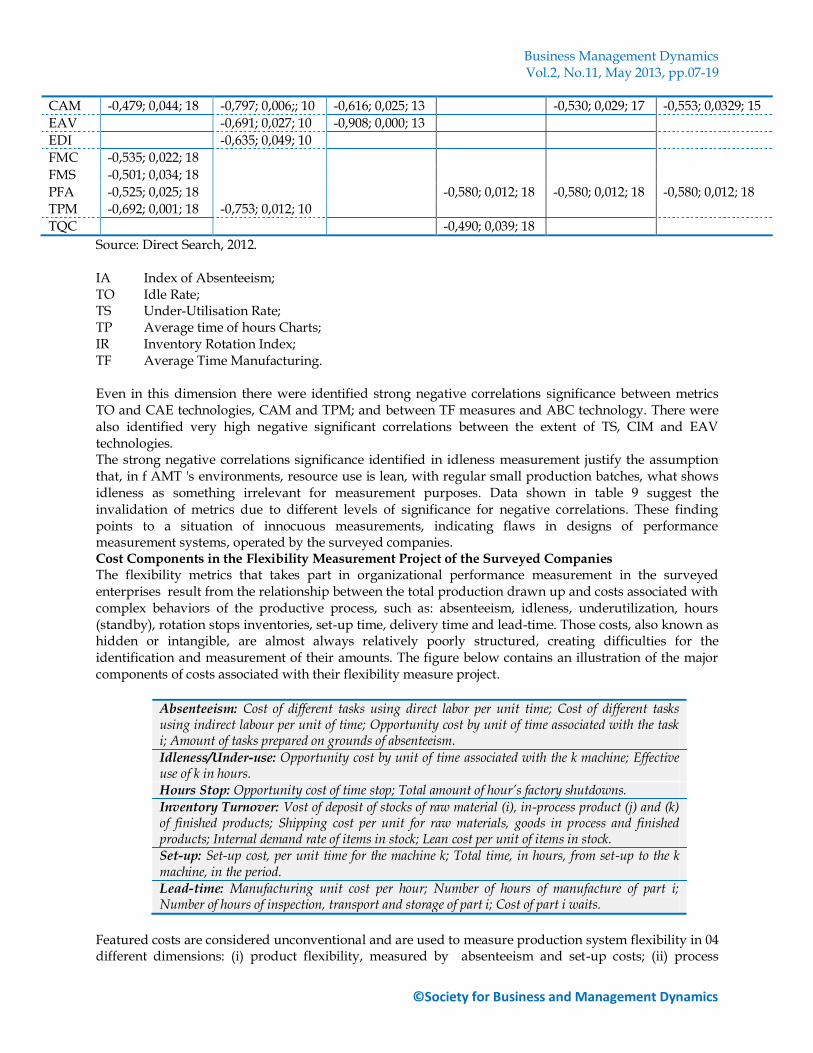
orbiting around relevance and essentialities. From that perspective, many flexibility measures considered "classical" lose importance and meanings in manufacturing environments. To meet the goals of understanding flexibility measures in the studied enterprises, this research investigated correlations between those metrics and the AMT's responsible for re-setting of the production systems. For flexibility metrics production systems operated by those companies, inferential analysis indicated significant moderate negative strong and very high correlations among 06 metrics and 12 types of AMT 's, levels 1 and 2, as set out in Table 9. At this dimension, significance of moderate negative correlations have been identified between the IA and the CAE, CIM technologies, CAM, FMC, FMS, PFA and TPM; between the metric from TO and the CIM technologies, EAV and EDI; between the metrics of TS and the CAD, CAE and CAM technologies; between the metrics of TP and ABC technologies, PFA and TQC; among the measures of IR and the PFA and CAM technologies; and the measures of TF and CAE technologies, CAM and PFA. Considering that absenteeism, idleness, underutilization, hours charts, stocks rotation and manufacturing time represent important aspects of human intervention on a production system, and that the significant correlations for these measures are of a negative nature (moderate), we have the confirmation of the hypothesis that these measures do not have grip or realism with the AMT's that configure the manufacturing environments investigated.
Table 9. Significant Correlations of the Metrics System Flexibility. AMT’s IA ((rho); (ρ); N TO (rho); (ρ); N TS (rho); (ρ); N TP (rho); (ρ); N IR (rho); (ρ); N TF (rho); (ρ); N
ABC -0,563; 0,015; 18 -0,770; 0,001; 15
CAD -0,581; 0,037; 13
CAE -0,575; 0,013; 18 -0,767; 0,010; 10 -0,569; 0,043; 13 -0,603; 0,017; 15
CIM -0,522; 0,026; 18 -0,633; 0,050; 10 -0,908; 0,000; 13
Business Management Dynamics Vol.2, No.11, May 2013, pp.07-19
©Society for Business and Management Dynamics
CAM -0,479; 0,044; 18 -0,797; 0,006;; 10 -0,616; 0,025; 13 -0,530; 0,029; 17 -0,553; 0,0329; 15
EAV -0,691; 0,027; 10 -0,908; 0,000; 13
EDI -0,635; 0,049; 10
FMC -0,535; 0,022; 18
FMS -0,501; 0,034; 18
PFA -0,525; 0,025; 18 -0,580; 0,012; 18 -0,580; 0,012; 18 -0,580; 0,012; 18
TPM -0,692; 0,001; 18 -0,753; 0,012; 10
TQC -0,490; 0,039; 18
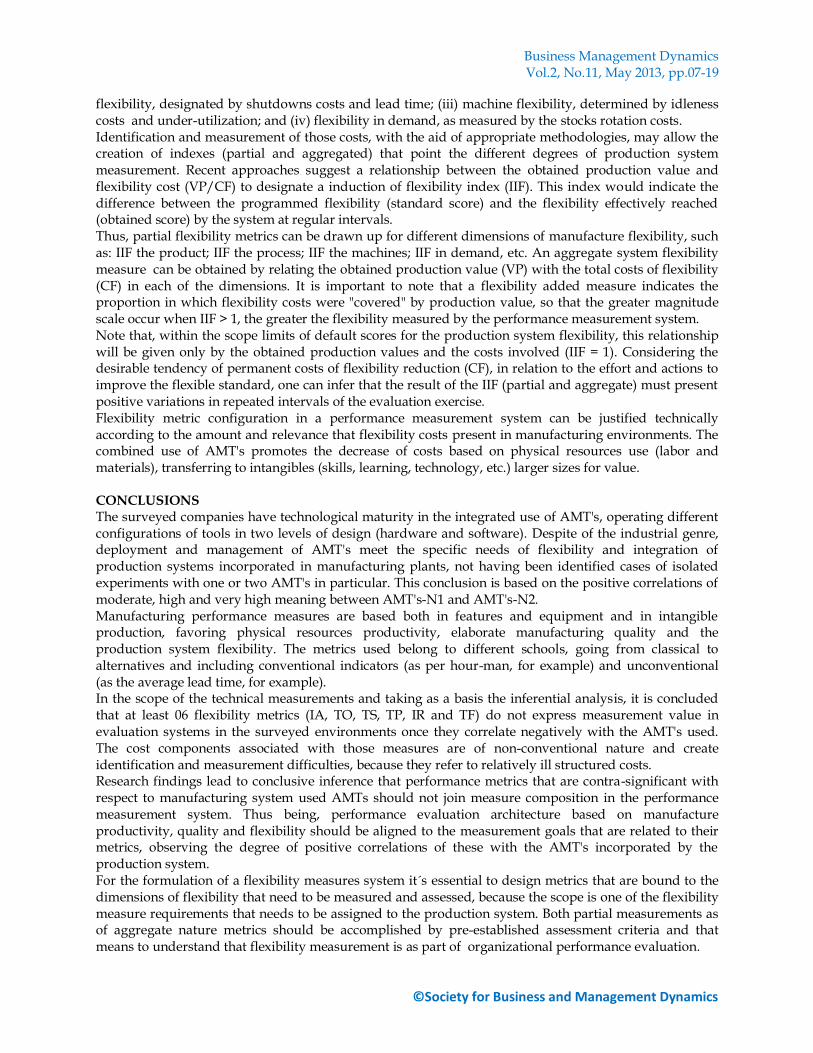
Source: Direct Search, 2012. IA Index of Absenteeism; TO Idle Rate; TS Under-Utilisation Rate; TP Average time of hours Charts; IR Inventory Rotation Index; TF Average Time Manufacturing. Even in this dimension there were identified strong negative correlations significance between metrics TO and CAE technologies, CAM and TPM; and between TF measures and ABC technology. There were also identified very high negative significant correlations between the extent of TS, CIM and EAV technologies. The strong negative correlations significance identified in idleness measurement justify the assumption that, in f AMT 's environments, resource use is lean, with regular small production batches, what shows idleness as something irrelevant for measurement purposes. Data shown in table 9 suggest the invalidation of metrics due to different levels of significance for negative correlations. These finding points to a situation of innocuous measurements, indicating flaws in designs of performance measurement systems, operated by the surveyed companies. Cost Components in the Flexibility Measurement Project of the Surveyed Companies The flexibility metrics that takes part in organizational performance measurement in the surveyed enterprises result from the relationship between the total production drawn up and costs associated with complex behaviors of the productive process, such as: absenteeism, idleness, underutilization, hours (standby), rotation stops inventories, set-up time, delivery time and lead-time. Those costs, also known as hidden or intangible, are almost always relatively poorly structured, creating difficulties for the identification and measurement of their amounts. The figure below contains an illustration of the major components of costs associated with their flexibility measure project.
Absenteeism: Cost of different tasks using direct labor per unit time; Cost of different tasks using indirect labour per unit of time; Opportunity cost by unit of time associated with the task i; Amount of tasks prepared on grounds of absenteeism.
Idleness/Under-use: Opportunity cost by unit of time associated with the k machine; Effective use of k in hours. Hours Stop: Opportunity cost of time stop; Total amount of hour’s factory shutdowns.
Inventory Turnover: Vost of deposit of stocks of raw material (i), in-process product (j) and (k) of finished products; Shipping cost per unit for raw materials, goods in process and finished products; Internal demand rate of items in stock; Lean cost per unit of items in stock. Set-up: Set-up cost, per unit time for the machine k; Total time, in hours, from set-up to the k machine, in the period. Lead-time: Manufacturing unit cost per hour; Number of hours of manufacture of part i; Number of hours of inspection, transport and storage of part i; Cost of part i waits.
Featured costs are considered unconventional and are used to measure production system flexibility in 04 different dimensions: (i) product flexibility, measured by absenteeism and set-up costs; (ii) process
Business Management Dynamics Vol.2, No.11, May 2013, pp.07-19
©Society for Business and Management Dynamics
flexibility, designated by shutdowns costs and lead time; (iii) machine flexibility, determined by idleness costs and under-utilization; and (iv) flexibility in demand, as measured by the stocks rotation costs. Identification and measurement of those costs, with the aid of appropriate methodologies, may allow the creation of indexes (partial and aggregated) that point the different degrees of production system measurement. Recent approaches suggest a relationship between the obtained production value and flexibility cost (VP/CF) to designate a induction of flexibility index (IIF). This index would indicate the difference between the programmed flexibility (standard score) and the flexibility effectively reached (obtained score) by the system at regular intervals. Thus, partial flexibility metrics can be drawn up for different dimensions of manufacture flexibility, such as: IIF the product; IIF the process; IIF the machines; IIF in demand, etc. An aggregate system flexibility measure can be obtained by relating the obtained production value (VP) with the total costs of flexibility (CF) in each of the dimensions. It is important to note that a flexibility added measure indicates the proportion in which flexibility costs were "covered" by production value, so that the greater magnitude scale occur when IIF > 1, the greater the flexibility measured by the performance measurement system. Note that, within the scope limits of default scores for the production system flexibility, this relationship will be given only by the obtained production values and the costs involved (IIF = 1). Considering the desirable tendency of permanent costs of flexibility reduction (CF), in relation to the effort and actions to improve the flexible standard, one can infer that the result of the IIF (partial and aggregate) must present positive variations in repeated intervals of the evaluation exercise. Flexibility metric configuration in a performance measurement system can be justified technically according to the amount and relevance that flexibility costs present in manufacturing environments. The combined use of AMT's promotes the decrease of costs based on physical resources use (labor and materials), transferring to intangibles (skills, learning, technology, etc.) larger sizes for value. CONCLUSIONS The surveyed companies have technological maturity in the integrated use of AMT's, operating different configurations of tools in two levels of design (hardware and software). Despite of the industrial genre, deployment and management of AMT's meet the specific needs of flexibility and integration of production systems incorporated in manufacturing plants, not having been identified cases of isolated experiments with one or two AMT's in particular. This conclusion is based on the positive correlations of moderate, high and very high meaning between AMT's-N1 and AMT's-N2. Manufacturing performance measures are based both in features and equipment and in intangible production, favoring physical resources productivity, elaborate manufacturing quality and the production system flexibility. The metrics used belong to different schools, going from classical to alternatives and including conventional indicators (as per hour-man, for example) and unconventional (as the average lead time, for example). In the scope of the technical measurements and taking as a basis the inferential analysis, it is concluded that at least 06 flexibility metrics (IA, TO, TS, TP, IR and TF) do not express measurement value in evaluation systems in the surveyed environments once they correlate negatively with the AMT's used. The cost components associated with those measures are of non-conventional nature and create identification and measurement difficulties, because they refer to relatively ill structured costs. Research findings lead to conclusive inference that performance metrics that are contra-significant with respect to manufacturing system used AMTs should not join measure composition in the performance measurement system. Thus being, performance evaluation architecture based on manufacture productivity, quality and flexibility should be aligned to the measurement goals that are related to their metrics, observing the degree of positive correlations of these with the AMT's incorporated by the production system. For the formulation of a flexibility measures system it´s essential to design metrics that are bound to the dimensions of flexibility that need to be measured and assessed, because the scope is one of the flexibility measure requirements that needs to be assigned to the production system. Both partial measurements as of aggregate nature metrics should be accomplished by pre-established assessment criteria and that means to understand that flexibility measurement is as part of organizational performance evaluation.
Business Management Dynamics Vol.2, No.11, May 2013, pp.07-19
©Society for Business and Management Dynamics
REFERENCES BRYMAN, Alan e CRAMER, Duncan. Análise de Dados em Ciências Sociais: Introdução às Técnicas
Utilizando o SPSS para Windows. Oeiras: Editora Celta, 2003. CORREA, C. A. e CORREA, H, L. Administração de Produção e Operações – Manufatura e Serviços –
Uma abordagem estratégica. São Paulo: Editora Atlas, 2012. EDVINSSON, Leif e MALLONE, Michael S. Capital Intelectual: descobrindo o valor real de sua empresa
pela identificação de seus valores internos. Tradução de Roberto Galman. São Paulo: Ed. Makron Books, 1998.
FIGUEIREDO FILHO, D. e SILVA JÚNIOR, J.A. Desvendando os Mistérios do Coeficiente de Correlação de Pearson (r). In Revista Política Hoje, Vol. 18, n. 1, 2009.
KAPLAN, R. S and NORTON, D. P. The Balanced Score Card: translating strategy into action. Boston: Harvard Business School Press, 1992.
KOTLER, P. e KELLER, K. L. Administração de Marketing. São Paulo: Pearson Prentice Hall, 2ª Edição, 2006.
KRAJEWSKY, L, RITZMAN, L. MALHOTRA, M. Administração da Produção e Operações. Ed. Pearson, 8ª. Edição, 2009.
MAIORES EMPRESAS, Edição 2011. Revista Valor 1000. Valor Econômico, Nº 12, agosto 2011. www.valor.com.br.
NEELY, Y, A. The evaluation of performance measurement research. International Journal of Operations and Production Management, v. 25, n. 12, 2005.
PEREIRA, S. C. F. Gerenciamento de Cadeias de Suprimentos: Análise da avaliação de desempenho de uma cadeia de carne e produtos industrializados de frango no Brasil. Tese (Doutorado em Administração de Empresas). Escola de Administração de Empresas de São Paulo. Fundação Getúlio Vargas. São Paulo, 2003.
PROBST, Gilbert; RAUB, Steffen e ROMHARDT, Kai. Gestão do Conhecimento: os elementos construtivos do sucesso. Porto Alegre: Ed. Bookman, 2002.
RICHARDSON, Peter R. and GORDON, John, R. M. Measuring Total Manufacturing Performance. Sloan Management Review, pp. 47—58, winter, 1980.
SVEIBY, Karl E. A Nova Riqueza das Organizações: gerenciando e avaliando patrimônios do conhecimento. Tradução de: Luiz Euclides T. F. Filho. Rio de Janeiro: Ed. Campus, 2000.
SEVERIANO FILHO, Cosmo. O enfoque vetorial da produtividade em um sistema de avaliação para a manufatura avançada na indústria de alimentos. (Tese de Doutorado), UFSC, Florianópolis, 1995.
SEVERIANO FILHO, Cosmo. Produtividade & Manufatura Avançada. João Pessoa: Edições PPGEP / Editora da UFPB, 1999.
SON, Young K. A framework for modern manufacturing economics. International Journal of Production Research, v. 29, n. 12, pp.2483-2499, 1991.
WAAL, André A. de. Performance-driven behavior as the key to improved organizational performance. Measuring Business Excellence, Vol. 14 Iss: 1, 2010.