MEASURENESS OF BRAND AWARENESS AND BRAND PRECEPTION
56
1 DECLARATION I hereby declare that the project entitled “Measurement of Brand awareness and Brand Perception ” submitted for the MBA Degree is my original work and the project has not formed the basis for the award of any degree, internship, fellowship or any other similar titles. Signature of the Student: Avneet Kaur Place: Mohali Date: 29-03-2014
-
Upload
avneet-kaur -
Category
Documents
-
view
126 -
download
0
Transcript of MEASURENESS OF BRAND AWARENESS AND BRAND PRECEPTION
1
DECLARATION
I hereby declare that the project entitled “Measurement of Brand awareness and Brand
Perception” submitted for the MBA Degree is my original work and the project has not
formed the basis for the award of any degree, internship, fellowship or any other similar
titles.
Signature of the Student: Avneet Kaur
Place: Mohali
Date: 29-03-2014
2
CERTIFICATE
This is to certify that the project entitled “Measurement of Brand awareness and Brand
Perception” is the bonafide work carried out by Avneet Kaur, student of MBA, Rayat Bahra
Institute of Management, Mohali, during the year 2014, in partial fulfillment of the
requirements for the award of the Degree of Master of Business Administration and that the
project has not formed the basis for the award previously of any degree, diploma, internship,
fellowship or any other similar title.
Signature of the Guide: Ms Amita Rani
Place: Mohali
Date: 29-03-2014
3
ACKNOWLEDGEMENT
“It is not possible to prepare a project report without the assistance &
encouragement of other people. This one is certainly no exception.”
On the very outset of this report, I would like to extend my sincere & heartfelt obligation
towards our Director Dr O.P. Midha for giving me an opportunity to do this project and also
all the facility members for their precious support.
I would express my gratitude to Ms Amita Rani for her guidance and support to
complete the project report.
My novice of the practical world would not have got me far, had it not been under the
direction of these people-
Ms Jasleen Kaur, Student of DAV College,
Mr Yogesh Pahwa, Dealer of L’Oreal Paris
Last but not least I wish to acknowledge the support of my family, friends, and each and
every member contributed to this project.
4
ABSTRACT
The project highlights on the topic of “The measurement of brand awareness and brand
perception”
The main purpose of the study is to determine the brand image, perception, attitudes and
behavior of the target audience with regard to the corporate L’Oreal Paris brand as well as the
products and personality of the L’Oreal Paris. This also denotes the purchasing pattern of
customers towards the brand.
The research methodology adopted for this study is descriptive. A descriptive study is
undertaken in order to ascertain and be able to describe the characteristics of the variable of
interest in a situation. As far as data is concerned structured undisguised questionnaire was
used to collect the primary data. The sampling technique involved in this research is stratified
sample, and the questionnaires are distributed to a sample size of 50
Analysis techniques are used to obtain finding and arrange information in a logical sequence
from the raw data collected. The tools that are used for analysis are Charts, Percentage,
Analysis, and Interval estimation.
From this study we can come to conclusion that high level of brand awareness is an important
driver with regard to influencing purchasing behaviour. Majority of the customers believe
that the branded products will have a good quality, the opinion about the branded products
will always be positive among the customers. This research clearly reveals that branded
products are always status related and enhances the sales of the products. L’Oréal has to
develop actions to enhance the brand imagery that this group associates with the L’Oréal
brand positively. These actions should lead to long-term strategic and market-related benefits
(e.g. market share) for L’Oréal within the target audience of this study.
5
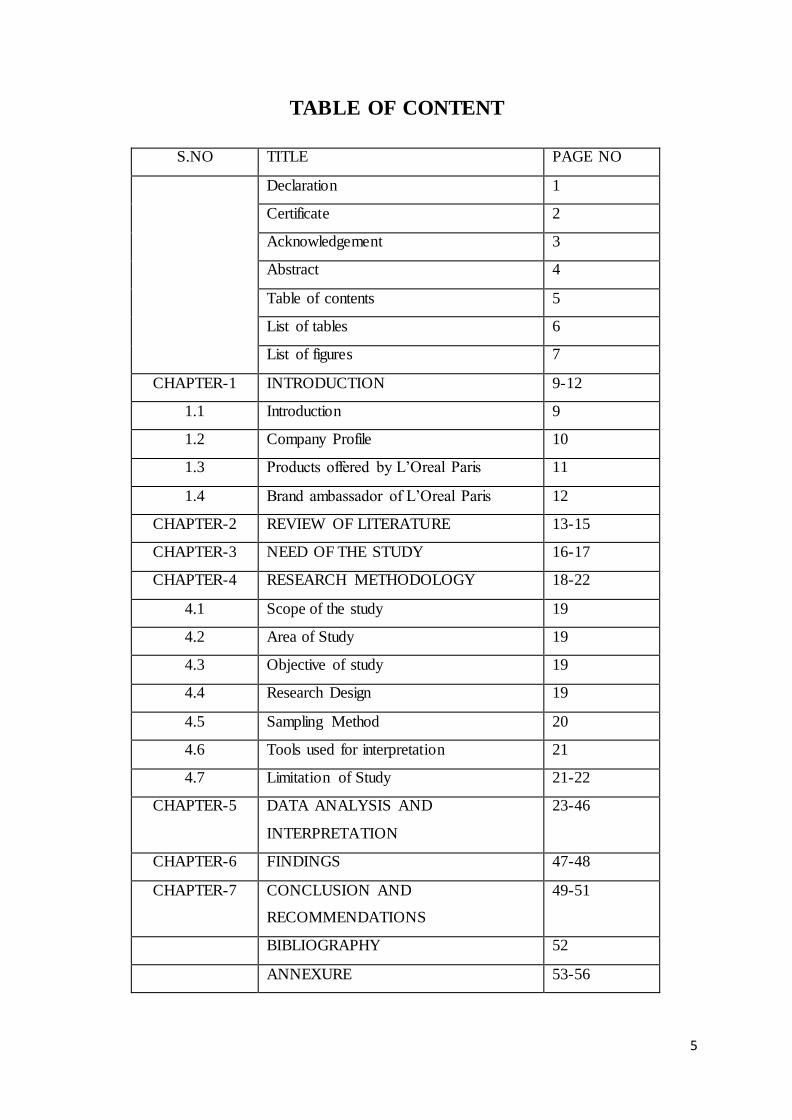
TABLE OF CONTENT
S.NO TITLE PAGE NO
Declaration 1
Certificate 2
Acknowledgement 3
Abstract 4
Table of contents 5
List of tables 6
List of figures 7
CHAPTER-1 INTRODUCTION 9-12
1.1 Introduction 9
1.2 Company Profile 10
1.3 Products offered by L’Oreal Paris 11
1.4 Brand ambassador of L’Oreal Paris 12
CHAPTER-2 REVIEW OF LITERATURE 13-15
CHAPTER-3 NEED OF THE STUDY 16-17
CHAPTER-4 RESEARCH METHODOLOGY 18-22
4.1 Scope of the study 19
4.2 Area of Study 19
4.3 Objective of study 19
4.4 Research Design 19
4.5 Sampling Method 20
4.6 Tools used for interpretation 21
4.7 Limitation of Study 21-22
CHAPTER-5
DATA ANALYSIS AND
INTERPRETATION
23-46
CHAPTER-6 FINDINGS 47-48
CHAPTER-7 CONCLUSION AND
RECOMMENDATIONS
49-51
BIBLIOGRAPHY 52
ANNEXURE 53-56
6
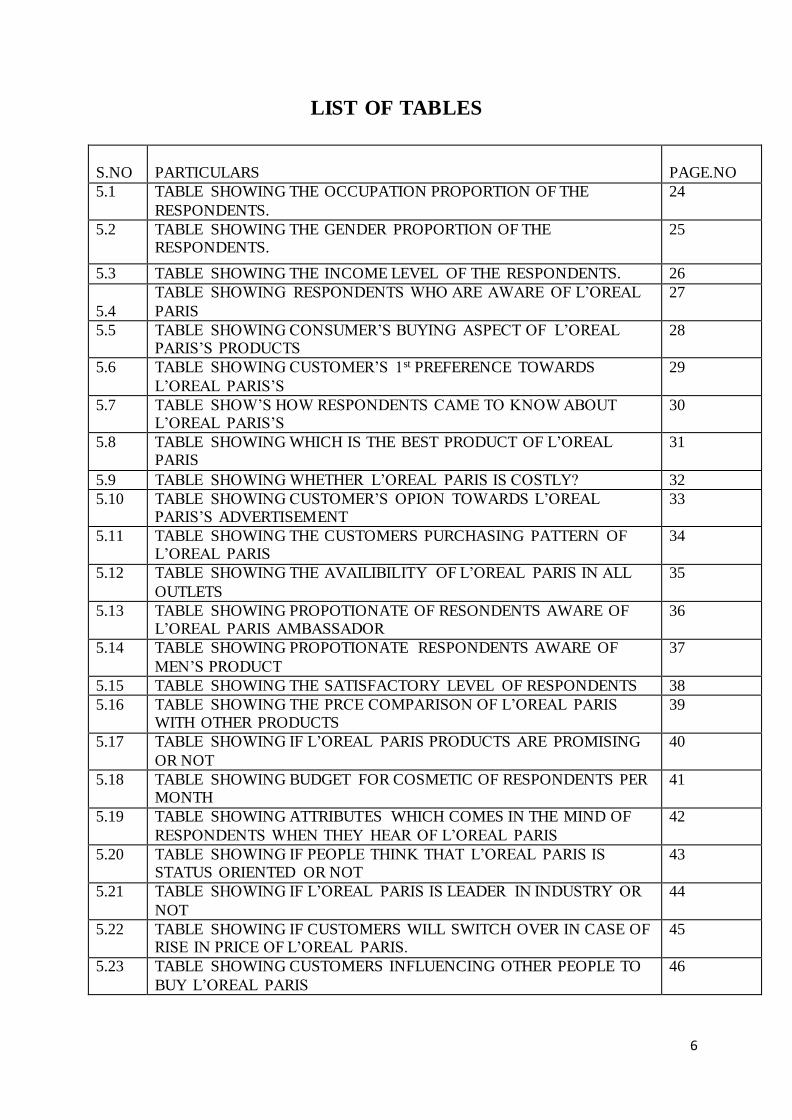
LIST OF TABLES
S.NO
PARTICULARS
PAGE.NO
5.1 TABLE SHOWING THE OCCUPATION PROPORTION OF THE
RESPONDENTS.
24
5.2 TABLE SHOWING THE GENDER PROPORTION OF THE RESPONDENTS.
25
5.3 TABLE SHOWING THE INCOME LEVEL OF THE RESPONDENTS. 26
5.4
TABLE SHOWING RESPONDENTS WHO ARE AWARE OF L’OREAL
PARIS
27
5.5 TABLE SHOWING CONSUMER’S BUYING ASPECT OF L’OREAL PARIS’S PRODUCTS
28
5.6 TABLE SHOWING CUSTOMER’S 1st PREFERENCE TOWARDS
L’OREAL PARIS’S
29
5.7 TABLE SHOW’S HOW RESPONDENTS CAME TO KNOW ABOUT L’OREAL PARIS’S
30
5.8 TABLE SHOWING WHICH IS THE BEST PRODUCT OF L’OREAL PARIS
31
5.9 TABLE SHOWING WHETHER L’OREAL PARIS IS COSTLY? 32
5.10 TABLE SHOWING CUSTOMER’S OPION TOWARDS L’OREAL PARIS’S ADVERTISEMENT
33
5.11 TABLE SHOWING THE CUSTOMERS PURCHASING PATTERN OF L’OREAL PARIS
34
5.12 TABLE SHOWING THE AVAILIBILITY OF L’OREAL PARIS IN ALL
OUTLETS
35
5.13 TABLE SHOWING PROPOTIONATE OF RESONDENTS AWARE OF L’OREAL PARIS AMBASSADOR
36
5.14 TABLE SHOWING PROPOTIONATE RESPONDENTS AWARE OF
MEN’S PRODUCT
37
5.15 TABLE SHOWING THE SATISFACTORY LEVEL OF RESPONDENTS 38
5.16 TABLE SHOWING THE PRCE COMPARISON OF L’OREAL PARIS WITH OTHER PRODUCTS
39
5.17 TABLE SHOWING IF L’OREAL PARIS PRODUCTS ARE PROMISING
OR NOT
40
5.18
TABLE SHOWING BUDGET FOR COSMETIC OF RESPONDENTS PER MONTH
41
5.19 TABLE SHOWING ATTRIBUTES WHICH COMES IN THE MIND OF
RESPONDENTS WHEN THEY HEAR OF L’OREAL PARIS
42
5.20 TABLE SHOWING IF PEOPLE THINK THAT L’OREAL PARIS IS STATUS ORIENTED OR NOT
43
5.21 TABLE SHOWING IF L’OREAL PARIS IS LEADER IN INDUSTRY OR
NOT
44
5.22 TABLE SHOWING IF CUSTOMERS WILL SWITCH OVER IN CASE OF RISE IN PRICE OF L’OREAL PARIS.
45
5.23 TABLE SHOWING CUSTOMERS INFLUENCING OTHER PEOPLE TO
BUY L’OREAL PARIS
46
7
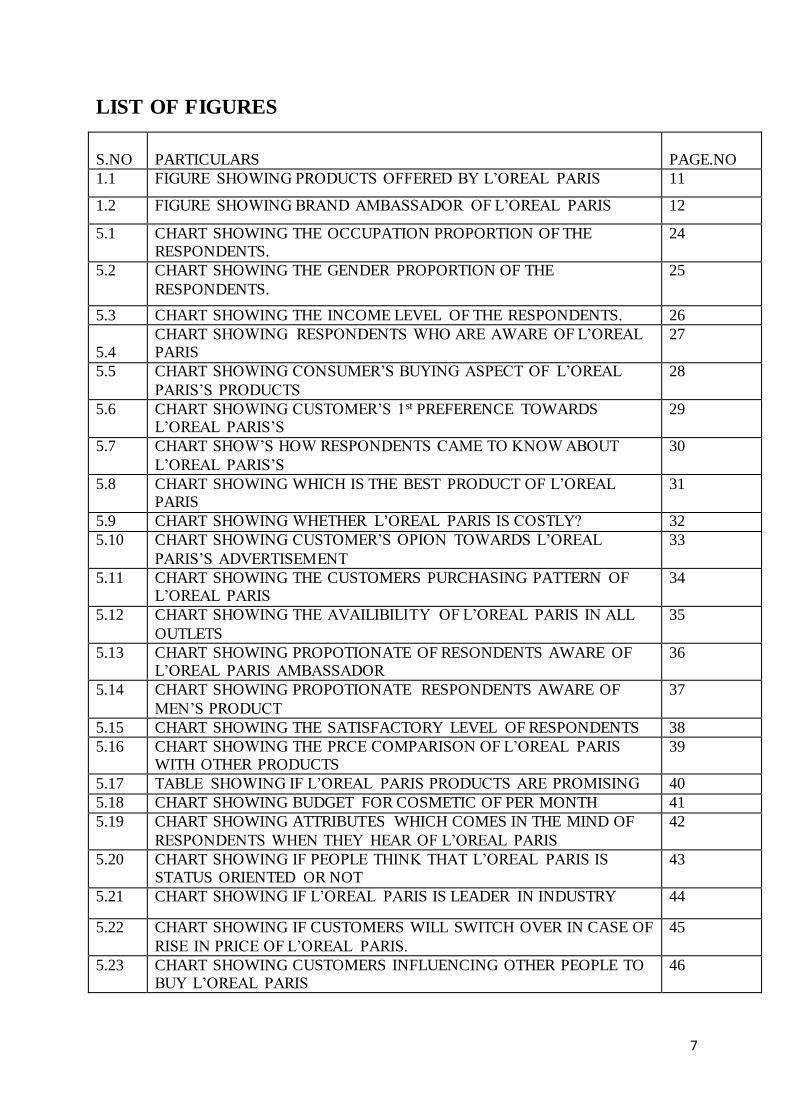
LIST OF FIGURES
S.NO
PARTICULARS
PAGE.NO
1.1 FIGURE SHOWING PRODUCTS OFFERED BY L’OREAL PARIS 11
1.2 FIGURE SHOWING BRAND AMBASSADOR OF L’OREAL PARIS 12
5.1 CHART SHOWING THE OCCUPATION PROPORTION OF THE RESPONDENTS.
24
5.2 CHART SHOWING THE GENDER PROPORTION OF THE
RESPONDENTS.
25
5.3 CHART SHOWING THE INCOME LEVEL OF THE RESPONDENTS. 26
5.4
CHART SHOWING RESPONDENTS WHO ARE AWARE OF L’OREAL PARIS
27
5.5 CHART SHOWING CONSUMER’S BUYING ASPECT OF L’OREAL
PARIS’S PRODUCTS
28
5.6 CHART SHOWING CUSTOMER’S 1st PREFERENCE TOWARDS L’OREAL PARIS’S
29
5.7 CHART SHOW’S HOW RESPONDENTS CAME TO KNOW ABOUT
L’OREAL PARIS’S
30
5.8 CHART SHOWING WHICH IS THE BEST PRODUCT OF L’OREAL PARIS
31
5.9 CHART SHOWING WHETHER L’OREAL PARIS IS COSTLY? 32
5.10 CHART SHOWING CUSTOMER’S OPION TOWARDS L’OREAL
PARIS’S ADVERTISEMENT
33
5.11 CHART SHOWING THE CUSTOMERS PURCHASING PATTERN OF L’OREAL PARIS
34
5.12 CHART SHOWING THE AVAILIBILITY OF L’OREAL PARIS IN ALL
OUTLETS
35
5.13 CHART SHOWING PROPOTIONATE OF RESONDENTS AWARE OF L’OREAL PARIS AMBASSADOR
36
5.14 CHART SHOWING PROPOTIONATE RESPONDENTS AWARE OF
MEN’S PRODUCT
37
5.15 CHART SHOWING THE SATISFACTORY LEVEL OF RESPONDENTS 38
5.16 CHART SHOWING THE PRCE COMPARISON OF L’OREAL PARIS WITH OTHER PRODUCTS
39
5.17 TABLE SHOWING IF L’OREAL PARIS PRODUCTS ARE PROMISING 40
5.18 CHART SHOWING BUDGET FOR COSMETIC OF PER MONTH 41
5.19 CHART SHOWING ATTRIBUTES WHICH COMES IN THE MIND OF
RESPONDENTS WHEN THEY HEAR OF L’OREAL PARIS
42
5.20 CHART SHOWING IF PEOPLE THINK THAT L’OREAL PARIS IS STATUS ORIENTED OR NOT
43
5.21 CHART SHOWING IF L’OREAL PARIS IS LEADER IN INDUSTRY 44
5.22 CHART SHOWING IF CUSTOMERS WILL SWITCH OVER IN CASE OF
RISE IN PRICE OF L’OREAL PARIS.
45
5.23 CHART SHOWING CUSTOMERS INFLUENCING OTHER PEOPLE TO BUY L’OREAL PARIS
46

8
CHAPTER 1
INTRODUCTION
9
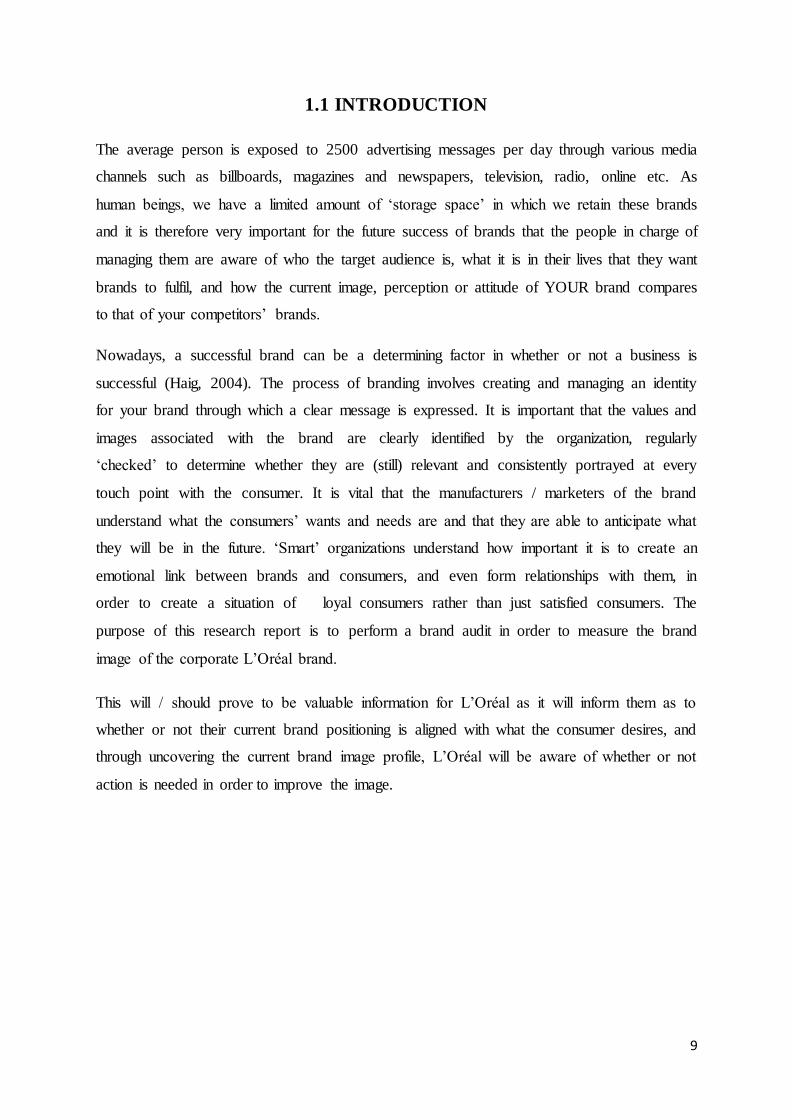
1.1 INTRODUCTION
The average person is exposed to 2500 advertising messages per day through various media
channels such as billboards, magazines and newspapers, television, radio, online etc. As
human beings, we have a limited amount of ‘storage space’ in which we retain these brands
and it is therefore very important for the future success of brands that the people in charge of
managing them are aware of who the target audience is, what it is in their lives that they want
brands to fulfil, and how the current image, perception or attitude of YOUR brand compares
to that of your competitors’ brands.
Nowadays, a successful brand can be a determining factor in whether or not a business is
successful (Haig, 2004). The process of branding involves creating and managing an identity
for your brand through which a clear message is expressed. It is important that the values and
images associated with the brand are clearly identified by the organization, regularly
‘checked’ to determine whether they are (still) relevant and consistently portrayed at every
touch point with the consumer. It is vital that the manufacturers / marketers of the brand
understand what the consumers’ wants and needs are and that they are able to anticipate what
they will be in the future. ‘Smart’ organizations understand how important it is to create an
emotional link between brands and consumers, and even form relationships with them, in
order to create a situation of loyal consumers rather than just satisfied consumers. The
purpose of this research report is to perform a brand audit in order to measure the brand
image of the corporate L’Oréal brand.
This will / should prove to be valuable information for L’Oréal as it will inform them as to
whether or not their current brand positioning is aligned with what the consumer desires, and
through uncovering the current brand image profile, L’Oréal will be aware of whether or not
action is needed in order to improve the image.
10
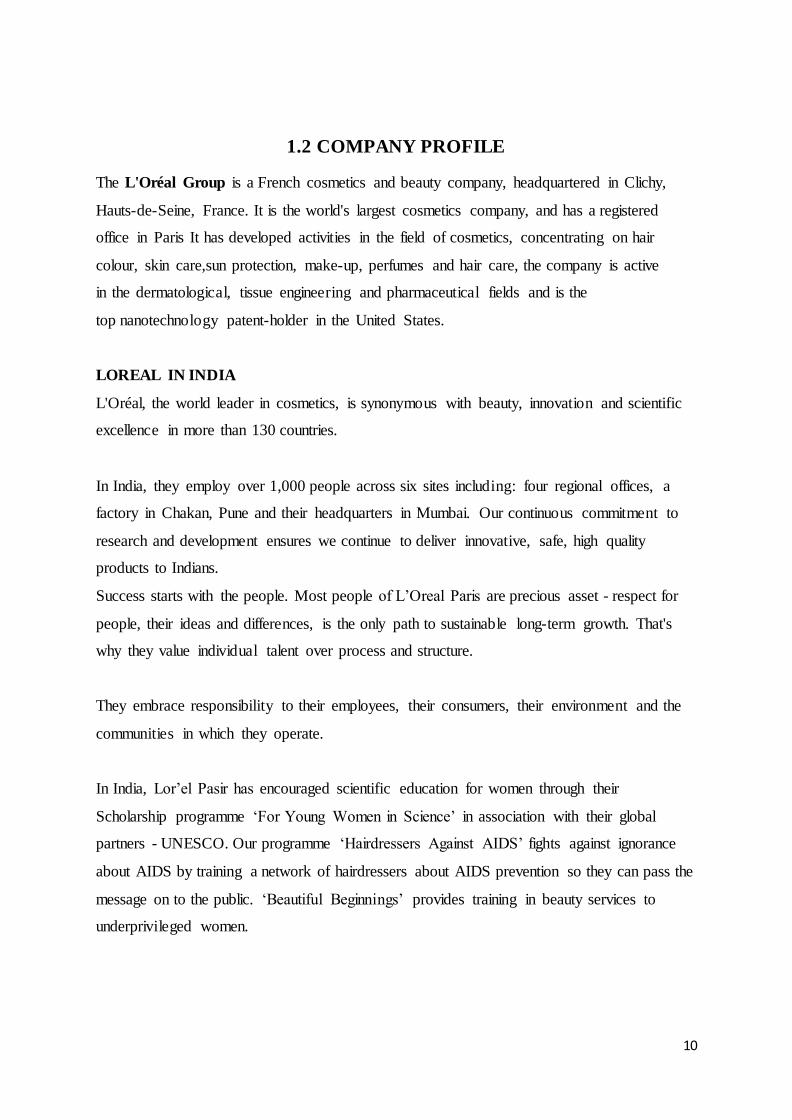
1.2 COMPANY PROFILE
The L'Oréal Group is a French cosmetics and beauty company, headquartered in Clichy,
Hauts-de-Seine, France. It is the world's largest cosmetics company, and has a registered
office in Paris It has developed activities in the field of cosmetics, concentrating on hair
colour, skin care,sun protection, make-up, perfumes and hair care, the company is active
in the dermatological, tissue engineering and pharmaceutical fields and is the
top nanotechnology patent-holder in the United States.
LOREAL IN INDIA
L'Oréal, the world leader in cosmetics, is synonymous with beauty, innovation and scientific
excellence in more than 130 countries.
In India, they employ over 1,000 people across six sites including: four regional offices, a
factory in Chakan, Pune and their headquarters in Mumbai. Our continuous commitment to
research and development ensures we continue to deliver innovative, safe, high quality
products to Indians.
Success starts with the people. Most people of L’Oreal Paris are precious asset - respect for
people, their ideas and differences, is the only path to sustainable long-term growth. That's
why they value individual talent over process and structure.
They embrace responsibility to their employees, their consumers, their environment and the
communities in which they operate.
In India, Lor’el Pasir has encouraged scientific education for women through their
Scholarship programme ‘For Young Women in Science’ in association with their global
partners - UNESCO. Our programme ‘Hairdressers Against AIDS’ fights against ignorance
about AIDS by training a network of hairdressers about AIDS prevention so they can pass the
message on to the public. ‘Beautiful Beginnings’ provides training in beauty services to
underprivileged women.
11
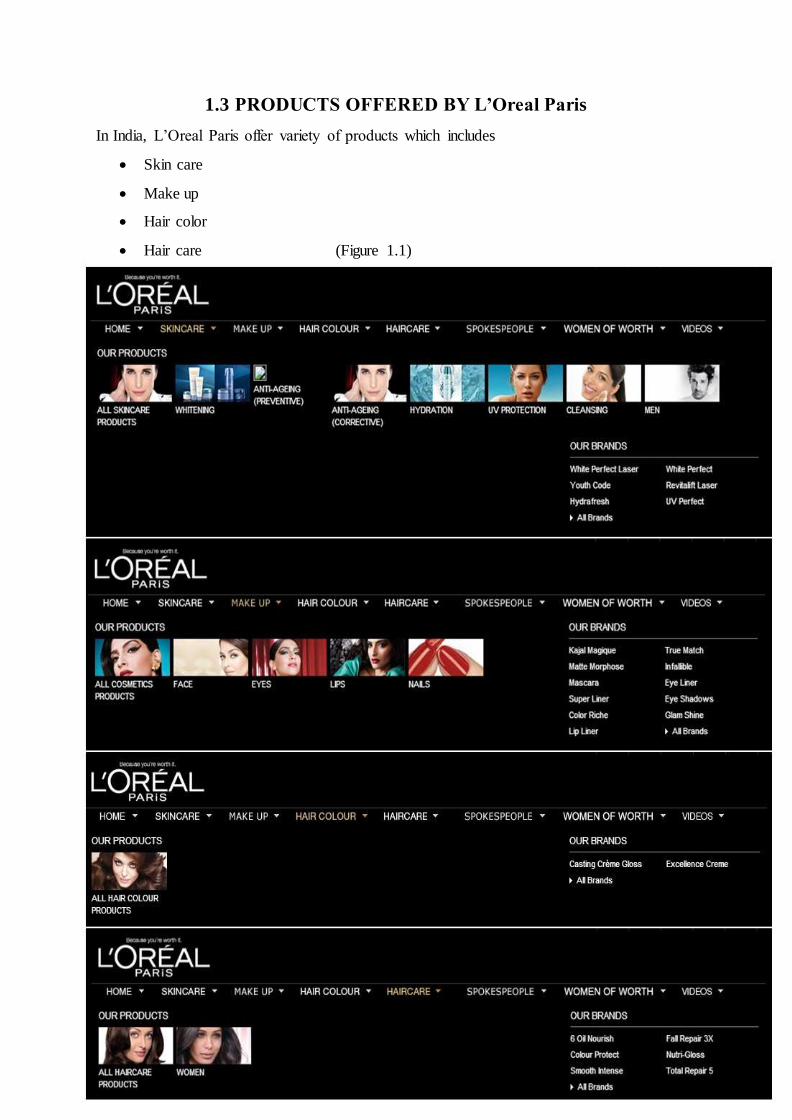
1.3 PRODUCTS OFFERED BY L’Oreal Paris
In India, L’Oreal Paris offer variety of products which includes
Skin care
Make up
Hair color
Hair care (Figure 1.1)
12
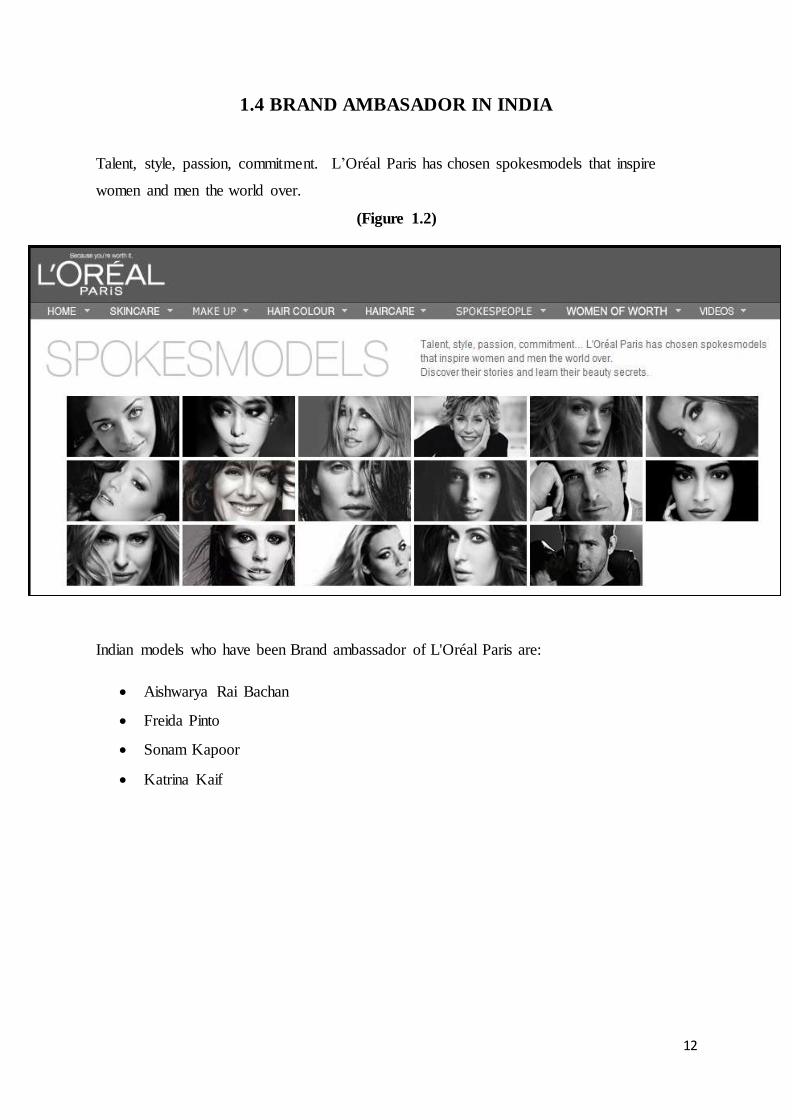
1.4 BRAND AMBASADOR IN INDIA
Talent, style, passion, commitment. L’Oréal Paris has chosen spokesmodels that inspire
women and men the world over.
(Figure 1.2)
Indian models who have been Brand ambassador of L'Oréal Paris are:
Aishwarya Rai Bachan
Freida Pinto
Sonam Kapoor
Katrina Kaif

13
CHAPTER 2
REVIEW OF LITERATURE
14
REVIEW OF LITERATURE
2.1 Hanna Bornmark, Kristianstad University
According to theory, consumer choose a brand they recognize, before an unfamiliar brand. If
the consumer do not choose according to theories, what are the factors that have a greater
effect on the buying behaviour?
There is not much research about the effect of brand awareness on brand choice, which is
why this subject was investigated. One of the purpose of this dissertation was to do a research
about brand awareness, to see to what extent it matters when purchasing the first time in an
unfamiliar environment. One of the objectives was to determine if there were any differences
in buying behaviour between the choosen cultures. The research group was limited to the
students from China, India and Iran at Kristianad University. Due to the low number of
participants from India, we had to exclude them from our analysis.
The research questions were important since they structured the problem that was to be
answered and made it easier to limit the scope of the dissertation. The questionnaire that was
handed out reflected our research questions. This made it possible to observe which product
the students recognized most and which product recognized the least.
The conclusion of the dissertation was that all investigated factors had some importance for
choice of brand, while quality had a greater effect on brand choice than brand awareness.
Further, there was no difference in buying behaviour between the cultures. Finally, it was not
possible to state any difference in buying behaviour the first time compared to today.
2.2 Stephenn Webb
Brand awareness and perception is important when trying to market a product or service into
a new or already established market. This study’s focal point rests on the ultimate
questions:”How does brand awareness and perception affects consumer purchasing?”. The
process involves a comprehensive understanding of the most current literature on marketing
and marketing theories, as well as a thorough review of three company rebranding case
studies and a comparison between them all, and an in-depth look at the design elements and
features of branding and the branding process. Additionally, interviews were undertaken, as
well as compiling survey data pertaining to each of four predetermined objective to back up
15
the researched literature. This research determines that brand design as a significant impact
on consumer purchasing.
2.3 Ingrid Staisch, University of Stellenbosch
The purpose of this introductory chapter is to introduce the reader to brands, as well as
the widely researched field of consumer behaviour. The primary field of research with which
this study is concerned is ‘Branding’. However, the author felt it also necessary to introduce
the reader to some of the theories on consumer behaviour due to the fact that there are many
similarities between these closely related fields of research and that many concepts and
theories in consumer behaviour are used throughout this research report.

16
CHAPTER 3
NEED OF THE STUDY
17
3.1 NEED OF STUDY
A brand awareness and Brand perception survey was needed because of following reasons:
To know the consumer perception toward L’Oreal Paris.
To know how does consumer feel about the products of L’Oreal Paris?
To know awareness of L’Oreal Paris brand amongst respondents.
To know how the sales can be boosted.
To know how to create brand equity of L’Oreal Paris.
To know effectiveness of advertisement on creating Brand image.
To know if the brand is adding value to products or not.
To know if the cost of L’Oreal Paris is reasonable or not.
To know if people are aware of brand ambassadors of L’Oreal Paris or not.
To know the satisfaction level of consumers for L’Oreal Paris.
To compare the brand with other brands.
To know which product is most popular amongst users.
18
CHAPTER 4
RESEARCH METHODOLOGY
19
4.1 SCOPE OF THE STUDY
This study helps to find the impact of the brand name among customers with reference to:
Find how far people are aware and attracted towards the brand name of L’Oreal Paris.
Find the relationship between the quality of the product and brand name of L’Oreal
Paris.
Find the satisfaction level of the customers in different ways towards L’Oreal Paris.
4.2 AREA OF STUDY
The population of study was people of Jalandhar. Sample is taken randomly from Students of
DAV College and HMV College, Jalandhar.
4.3 OBJECTIVE OF THE STUDY
PRIMARY OBJECTIVE
To measure the brand awareness and brand perception.
SECONDARY OBJECTIVE
The following are considered to be the secondary objectives of this research study:
To measure / determine the brand image, perceptions, attitudes and behavior of the
target audience with regard to the corporate L’Oréal brand as well as the products and
personality of the L’Oréal brand.
To measure / determine the value drivers for the target audience when purchasing
cosmetic, hair and body products.
To interpret the results of the measurements based on statistical analysis.
4.4 RESEARCH DESIGN
Research design is the framework or plan for a study that guides the collection and analysis
of the data. It is a map or blue print according to which research is to be conducted. The
research design is given below,
A) NATURE OF RESEARCH:
The research design followed for this study is descriptive research for analyzing the collected
data, an in-depth research analysis was framed and various statistical tools and techniques
were also used for the purpose.
20
B) DESCRIPTIVE RESEARCH :
Descriptive research includes surveys and fact-findings enquiries of different kinds. The
Major purpose of descriptive research is description of the state of affairs as it exists at
present. The methods of research utilized in descriptive research are survey methods of all
kinds, including comparative and correlation methods.
4.5 SAMPLING METHOD:
DATA TYPE:
The two main types of data for present study have been primary data and secondary data.
A) PRIMARY DATA:
Primary data is collected in the form of questionnaire. Through the questionnaire which
consists of a number of questions printed in a definite order on a set of forms, the respondents
were expected to read and understand the questions itself. The respondents need to answer
the questions on their own and according to their perception.
B) SECONDARY DATA:
Secondary data consists of information that already exists. Somewhere, having been collected
for specific purpose in the study. The secondary data for this study was collected from
various books, internet etc.
The methodology adopted to collect the primary data was interview schedule, which includes
a structured questionnaire to be given to the respondents, the respondents would be guided by
the interviewer to fill the questionnaire and direct observation method was also adopted.
QUESTIONNAIRE
The study relies to a great extent on primary data and some extent to secondary data. In order
to gather primary data from the respondents a non-disguised questionnaire was designed,
keeping in view the objectives of the study.
The questionnaire consists of the following type of questions:
DICHOTOMOUS:
Here the questions asked have only two alternatives from which the respondents were free to
choose one. An example question is quoted below is used in the questionnaire
Do you give preference to branded mobiles while buying cellular phones?
a) Yes b) No
21
OPEN ENDED QUESTION:
Here the respondents are given full freedom to answer anything. Open ended questions are
the type of question used to get suggestion from the respondent in order to give feedback to
the organization
MULTIPLE CHOICES:
Here the questions asked have a set of given alternatives from which the respondents may
choose one or more alternatives.
Which mobile you like to prefer?
a) Sony b) Samsung c) Micromax d) HTC e) Nokia
CLOSED ENDED QUESTION:
These types of questions do not allow the respondents to give answer freely. Closed ended
question are the type of questions with a clear delineated set of alternatives that confine the
respondents to choose one of them.
PERIOD OF STUDY:
The period of study has been from 20 March 2014- 22 March 2014
4.6 TOOLS USED FOR INTERPRETATION
CHARTS:
Bar chart and pie charts are used to get a clear look of the tabulated values.
PERCENTAGE ANALYSIS:
Percentage analysis refers to a special kind of ratio. Percentages are used in making
comparisons between two or more series of data. Percentage relates the data figure with the
base figure studied.
= 100n
d
Where, d = number of respondents
n = base or the sample group
4.7 LIMITATIONS OF THE STUDY
The survey was limited to Jalandhar city due to the limitation of time.
The study was conducted under of assumption that the information given by the
respondents is authentic.
22
Most of the respondents are students and are not earning anything so result may
confine to students only.
The respondents were reluctant to answer due to their busy schedule.
Many respondents were biased in their responses.
23
CHAPTER 5
DATA ANALYSIS
AND
INTERPRETATION
24
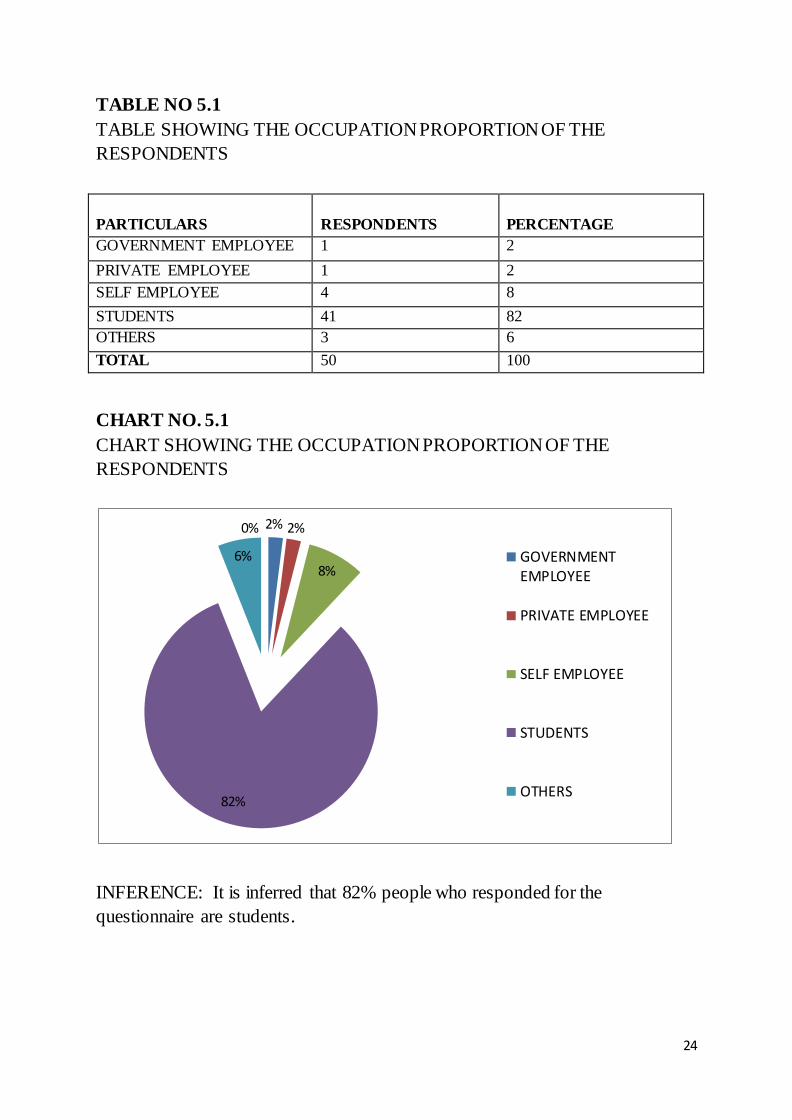
TABLE NO 5.1
TABLE SHOWING THE OCCUPATION PROPORTION OF THE
RESPONDENTS
PARTICULARS
RESPONDENTS
PERCENTAGE
GOVERNMENT EMPLOYEE 1 2
PRIVATE EMPLOYEE 1 2
SELF EMPLOYEE 4 8
STUDENTS 41 82
OTHERS 3 6
TOTAL 50 100
CHART NO. 5.1
CHART SHOWING THE OCCUPATION PROPORTION OF THE
RESPONDENTS
INFERENCE: It is inferred that 82% people who responded for the
questionnaire are students.
2% 2%
8%
82%
6%
0%
GOVERNMENTEMPLOYEE
PRIVATE EMPLOYEE
SELF EMPLOYEE
STUDENTS
OTHERS
25
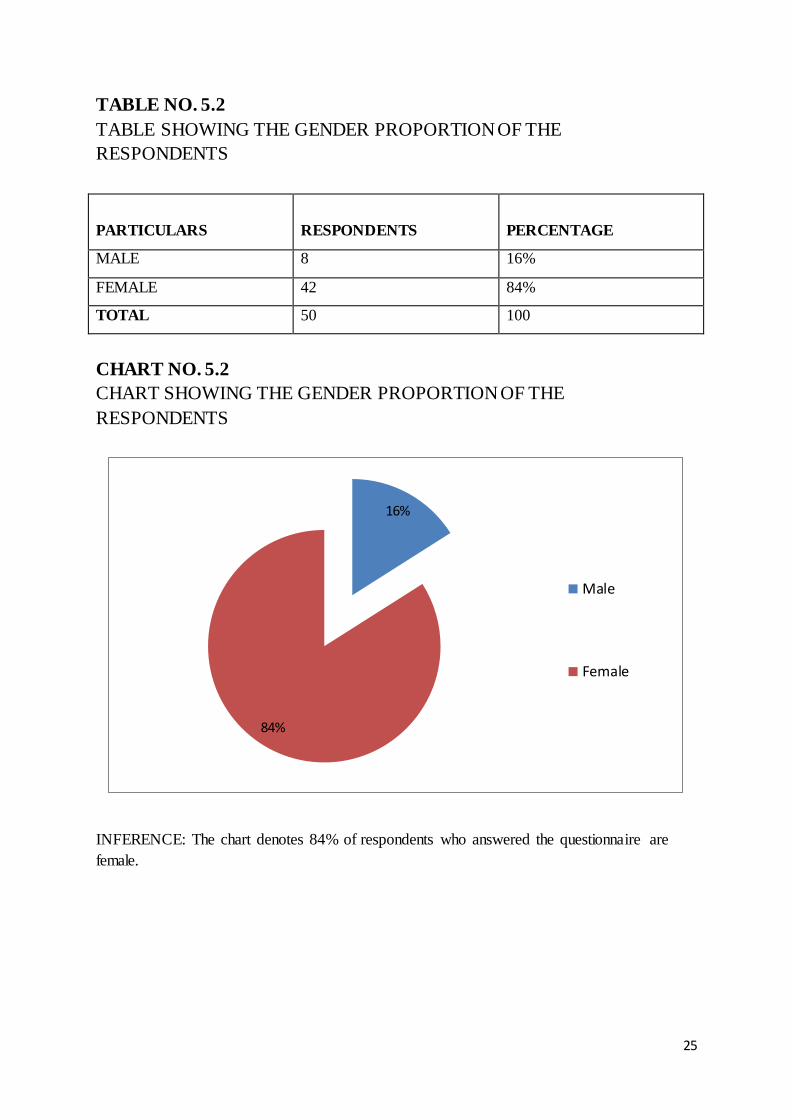
TABLE NO. 5.2
TABLE SHOWING THE GENDER PROPORTION OF THE
RESPONDENTS
PARTICULARS
RESPONDENTS
PERCENTAGE
MALE 8 16%
FEMALE 42 84%
TOTAL 50 100
CHART NO. 5.2
CHART SHOWING THE GENDER PROPORTION OF THE
RESPONDENTS
INFERENCE: The chart denotes 84% of respondents who answered the questionnaire are
female.
16%
84%
Male
Female
26
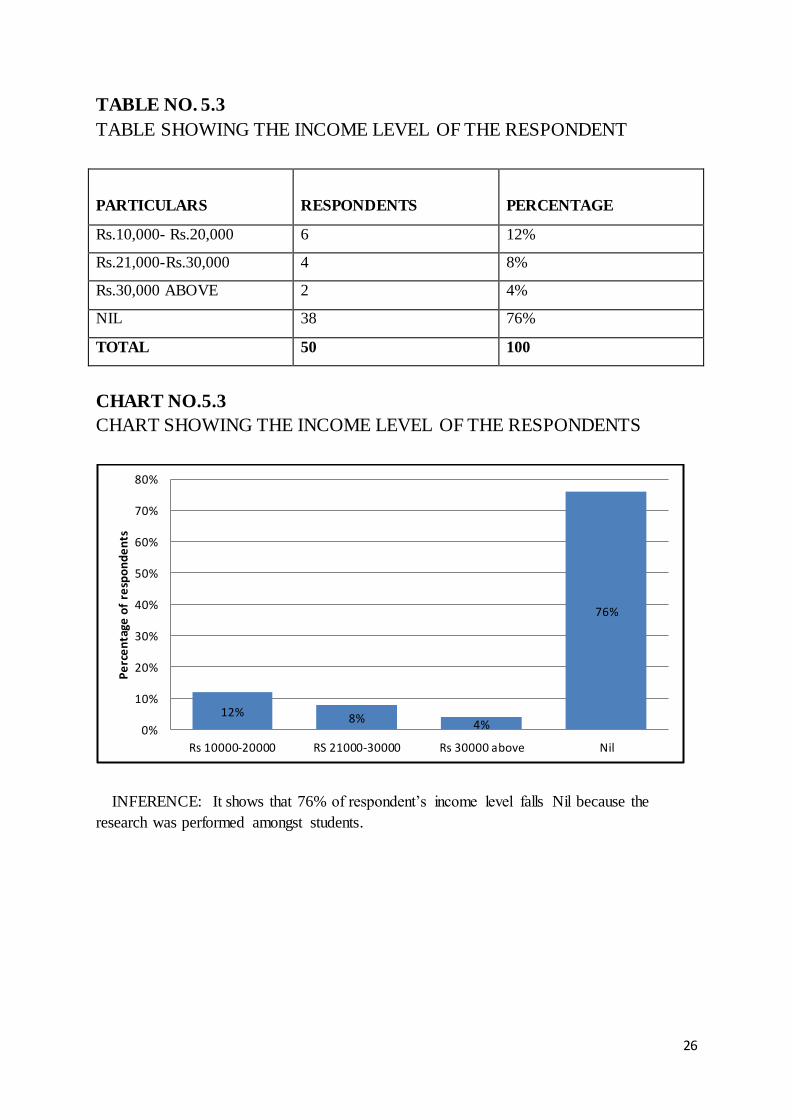
TABLE NO. 5.3
TABLE SHOWING THE INCOME LEVEL OF THE RESPONDENT
PARTICULARS
RESPONDENTS
PERCENTAGE
Rs.10,000- Rs.20,000 6 12%
Rs.21,000-Rs.30,000 4 8%
Rs.30,000 ABOVE 2 4%
NIL 38 76%
TOTAL 50 100
CHART NO.5.3
CHART SHOWING THE INCOME LEVEL OF THE RESPONDENTS
INFERENCE: It shows that 76% of respondent’s income level falls Nil because the
research was performed amongst students.
12% 8% 4%
76%
0%
10%
20%
30%
40%
50%
60%
70%
80%
Rs 10000-20000 RS 21000-30000 Rs 30000 above Nil
Pe
rce
nta
ge o
f re
spo
nd
en
ts
27
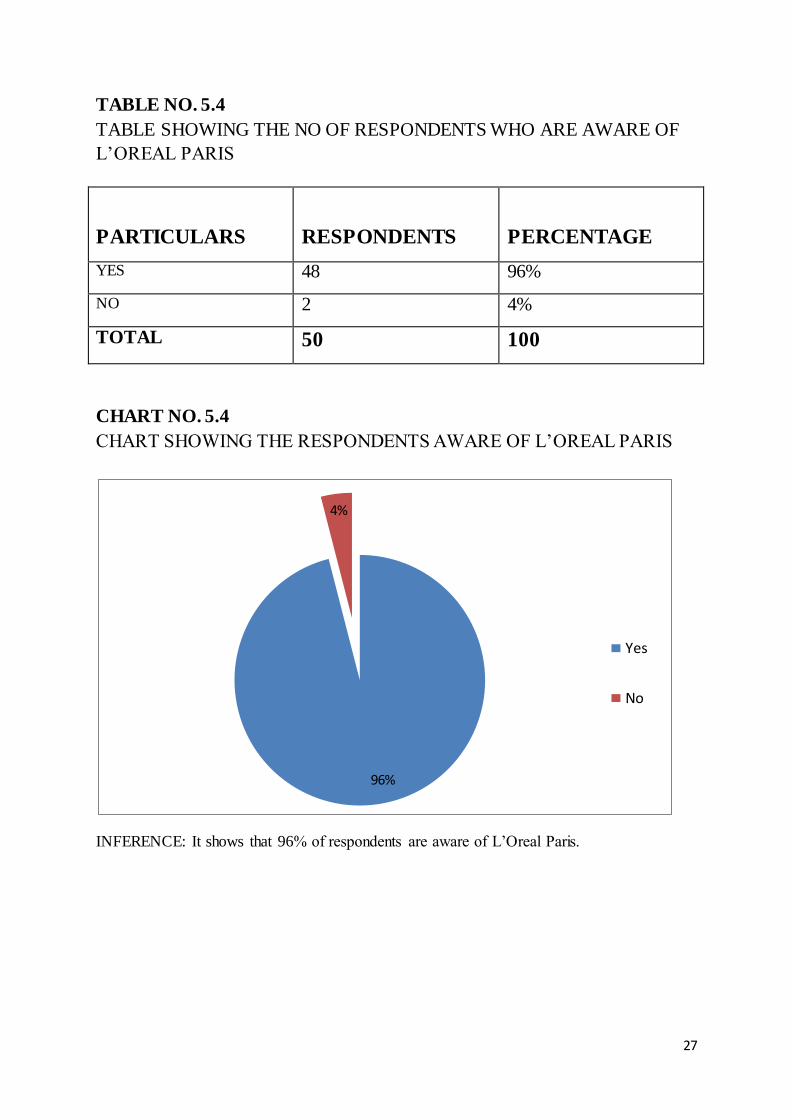
TABLE NO. 5.4
TABLE SHOWING THE NO OF RESPONDENTS WHO ARE AWARE OF
L’OREAL PARIS
CHART NO. 5.4
CHART SHOWING THE RESPONDENTS AWARE OF L’OREAL PARIS
INFERENCE: It shows that 96% of respondents are aware of L’Oreal Paris.
96%
4%
Yes
No
PARTICULARS
RESPONDENTS
PERCENTAGE
YES 48 96%
NO 2 4%
TOTAL 50 100
28
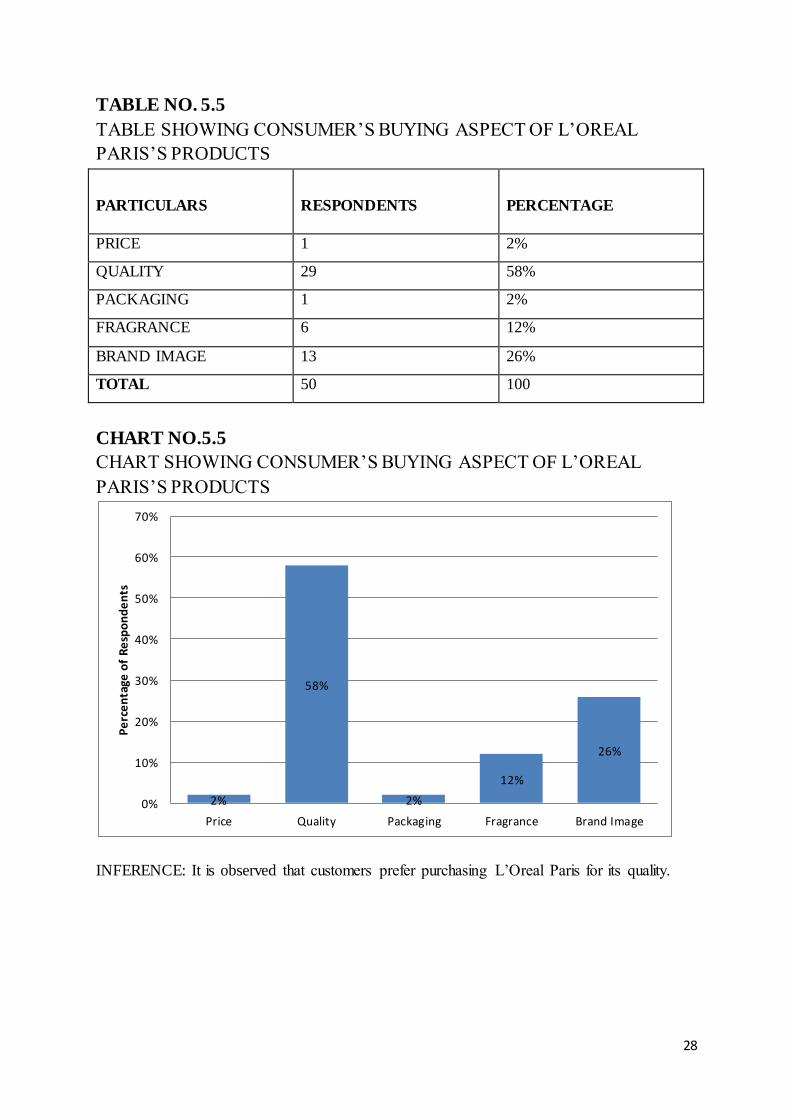
TABLE NO. 5.5
TABLE SHOWING CONSUMER’S BUYING ASPECT OF L’OREAL
PARIS’S PRODUCTS
PARTICULARS
RESPONDENTS
PERCENTAGE
PRICE 1 2%
QUALITY 29 58%
PACKAGING 1 2%
FRAGRANCE 6 12%
BRAND IMAGE 13 26%
TOTAL 50 100
CHART NO.5.5
CHART SHOWING CONSUMER’S BUYING ASPECT OF L’OREAL
PARIS’S PRODUCTS
INFERENCE: It is observed that customers prefer purchasing L’Oreal Paris for its quality.
2%
58%
2%
12%
26%
0%
10%
20%
30%
40%
50%
60%
70%
Price Quality Packaging Fragrance Brand Image
Pe
rce
nta
ge o
f R
esp
on
de
nts
29
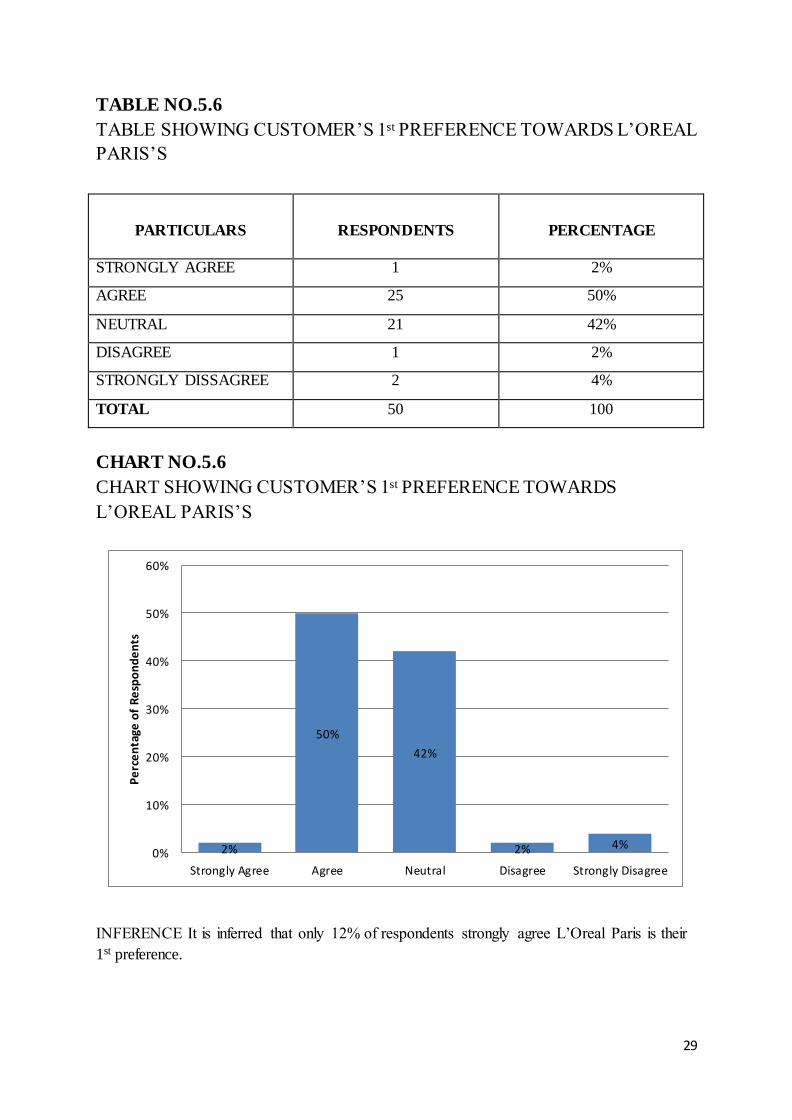
TABLE NO.5.6
TABLE SHOWING CUSTOMER’S 1st PREFERENCE TOWARDS L’OREAL
PARIS’S
PARTICULARS
RESPONDENTS
PERCENTAGE
STRONGLY AGREE 1 2%
AGREE 25 50%
NEUTRAL 21 42%
DISAGREE 1 2%
STRONGLY DISSAGREE 2 4%
TOTAL 50 100
CHART NO.5.6
CHART SHOWING CUSTOMER’S 1st PREFERENCE TOWARDS
L’OREAL PARIS’S
INFERENCE It is inferred that only 12% of respondents strongly agree L’Oreal Paris is their
1st preference.
2%
50%
42%
2% 4%0%
10%
20%
30%
40%
50%
60%
Strongly Agree Agree Neutral Disagree Strongly Disagree
Pe
rce
nta
ge o
f R
esp
on
de
nts
30
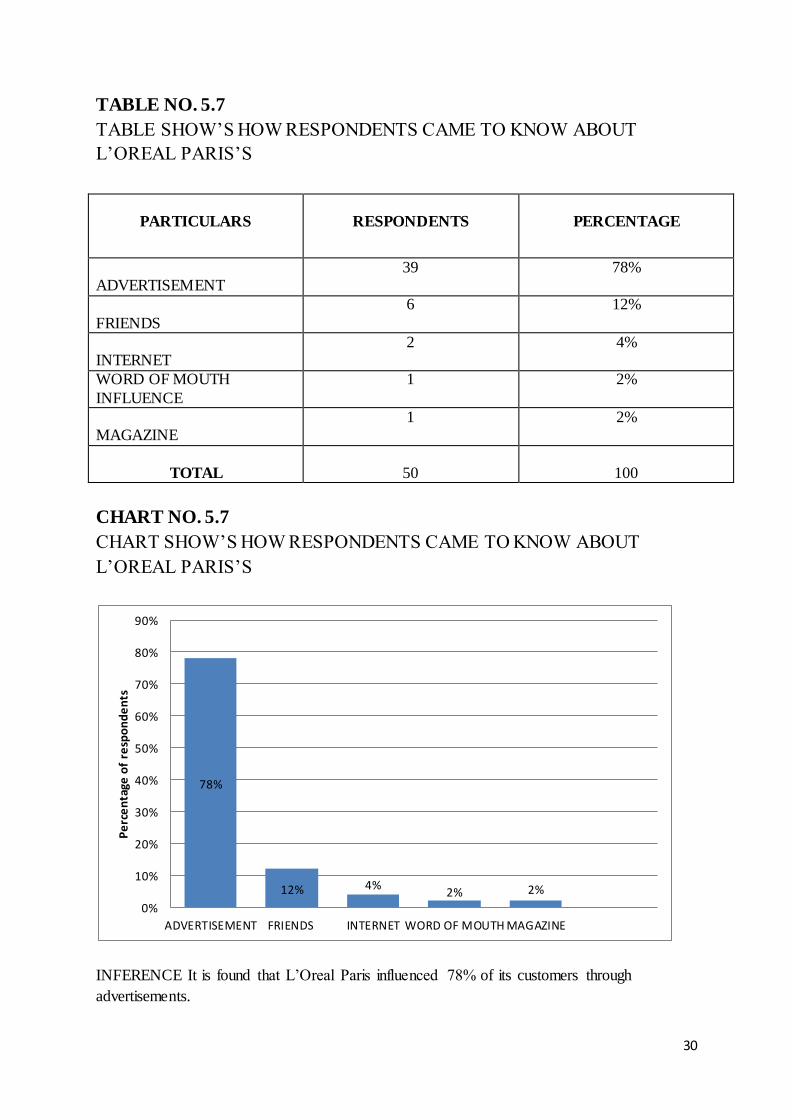
TABLE NO. 5.7
TABLE SHOW’S HOW RESPONDENTS CAME TO KNOW ABOUT
L’OREAL PARIS’S
PARTICULARS
RESPONDENTS
PERCENTAGE
ADVERTISEMENT
39 78%
FRIENDS
6 12%
INTERNET
2 4%
WORD OF MOUTH
INFLUENCE
1 2%
MAGAZINE
1 2%
TOTAL
50
100
CHART NO. 5.7
CHART SHOW’S HOW RESPONDENTS CAME TO KNOW ABOUT
L’OREAL PARIS’S
INFERENCE It is found that L’Oreal Paris influenced 78% of its customers through
advertisements.
78%
12% 4%2% 2%
0%
10%
20%
30%
40%
50%
60%
70%
80%
90%
ADVERTISEMENT FRIENDS INTERNET WORD OF MOUTH MAGAZINE
Pe
rce
nta
ge o
f re
spo
nd
en
ts
31
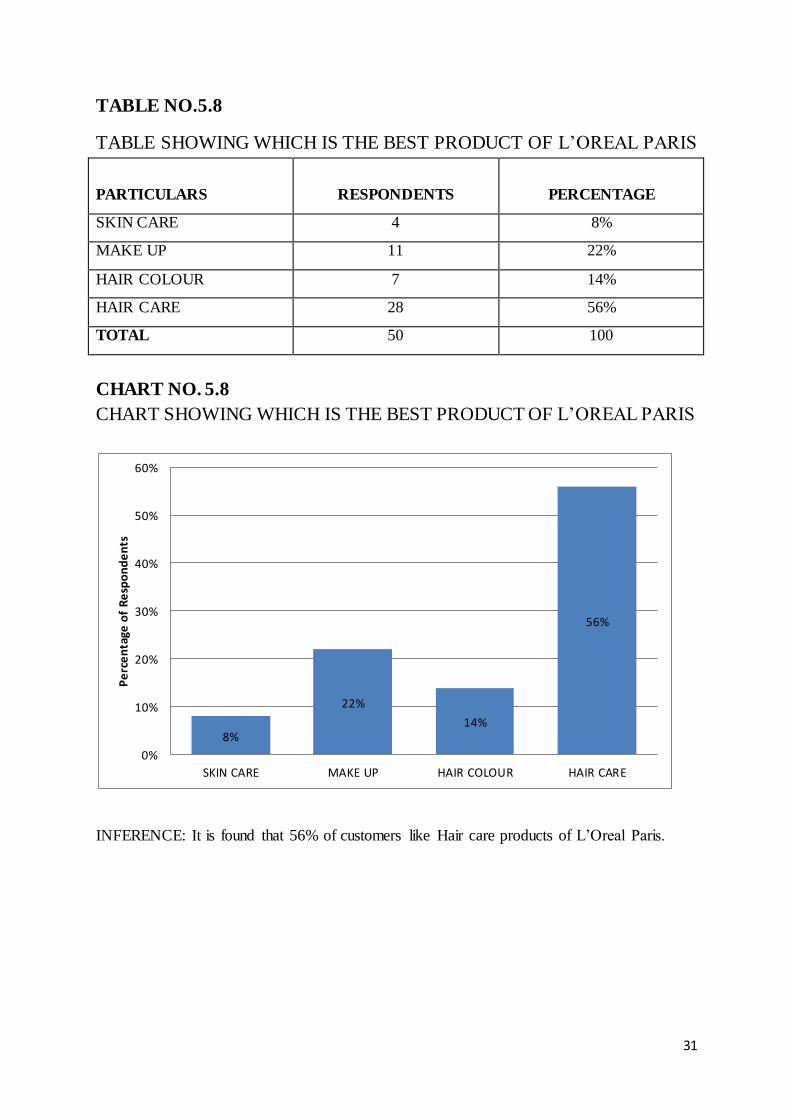
TABLE NO.5.8
TABLE SHOWING WHICH IS THE BEST PRODUCT OF L’OREAL PARIS
PARTICULARS
RESPONDENTS
PERCENTAGE
SKIN CARE 4 8%
MAKE UP 11 22%
HAIR COLOUR 7 14%
HAIR CARE 28 56%
TOTAL 50 100
CHART NO. 5.8
CHART SHOWING WHICH IS THE BEST PRODUCT OF L’OREAL PARIS
INFERENCE: It is found that 56% of customers like Hair care products of L’Oreal Paris.
8%
22%
14%
56%
0%
10%
20%
30%
40%
50%
60%
SKIN CARE MAKE UP HAIR COLOUR HAIR CARE
Pe
rce
nta
ge o
f R
esp
on
de
nts
32
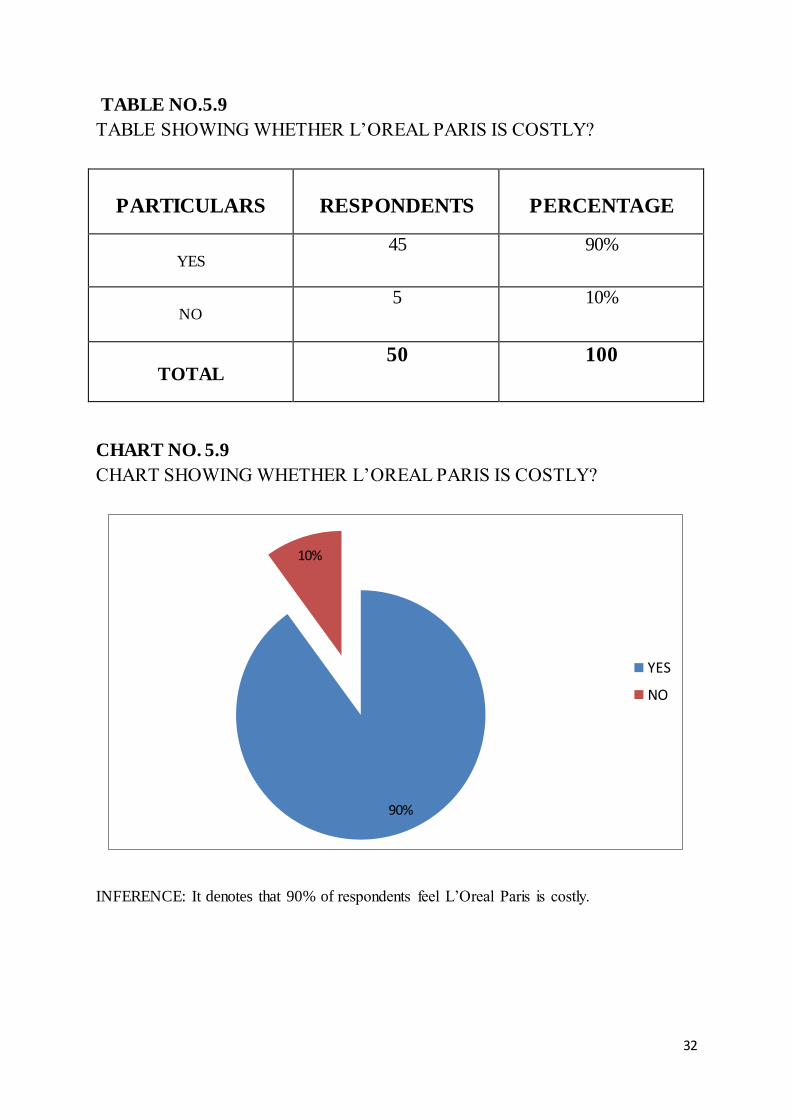
TABLE NO.5.9
TABLE SHOWING WHETHER L’OREAL PARIS IS COSTLY?
PARTICULARS
RESPONDENTS
PERCENTAGE
YES
45 90%
NO
5 10%
TOTAL
50 100
CHART NO. 5.9
CHART SHOWING WHETHER L’OREAL PARIS IS COSTLY?
INFERENCE: It denotes that 90% of respondents feel L’Oreal Paris is costly.
90%
10%
YES
NO
33
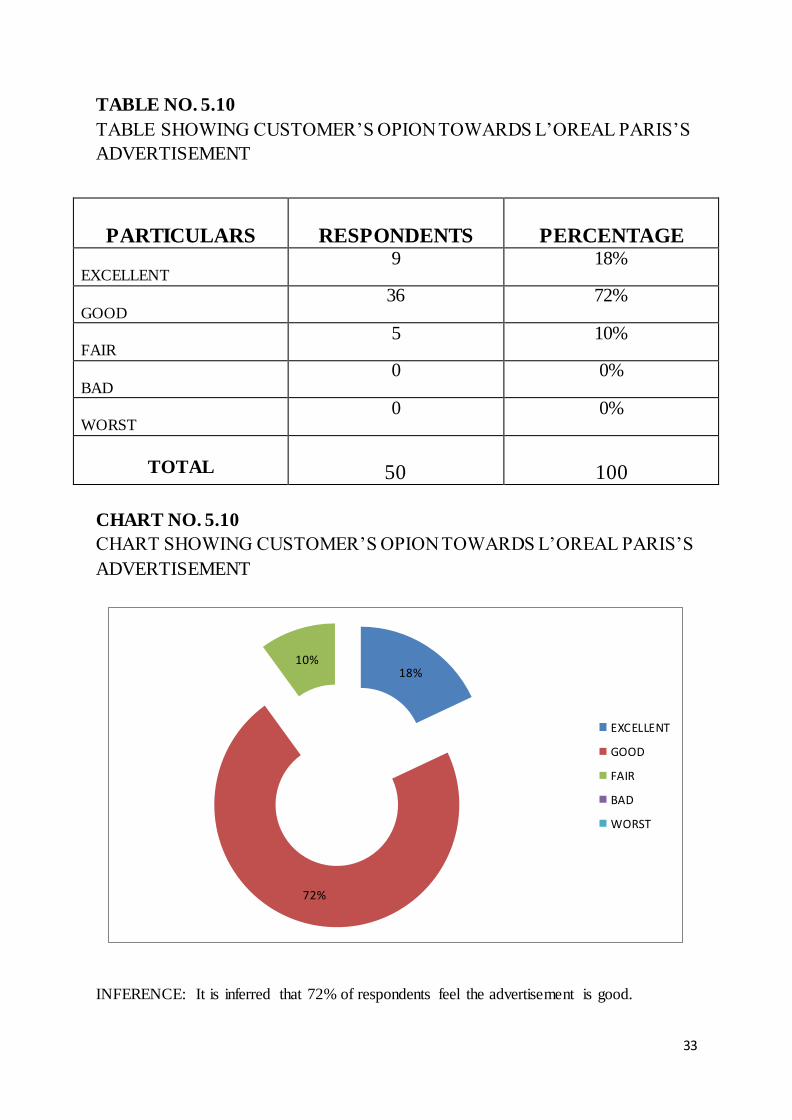
TABLE NO. 5.10
TABLE SHOWING CUSTOMER’S OPION TOWARDS L’OREAL PARIS’S
ADVERTISEMENT
CHART NO. 5.10
CHART SHOWING CUSTOMER’S OPION TOWARDS L’OREAL PARIS’S
ADVERTISEMENT
INFERENCE: It is inferred that 72% of respondents feel the advertisement is good.
18%
72%
10%
EXCELLENT
GOOD
FAIR
BAD
WORST
PARTICULARS
RESPONDENTS
PERCENTAGE EXCELLENT
9 18%
GOOD 36 72%
FAIR
5 10%
BAD 0 0%
WORST
0 0%
TOTAL
50
100
34
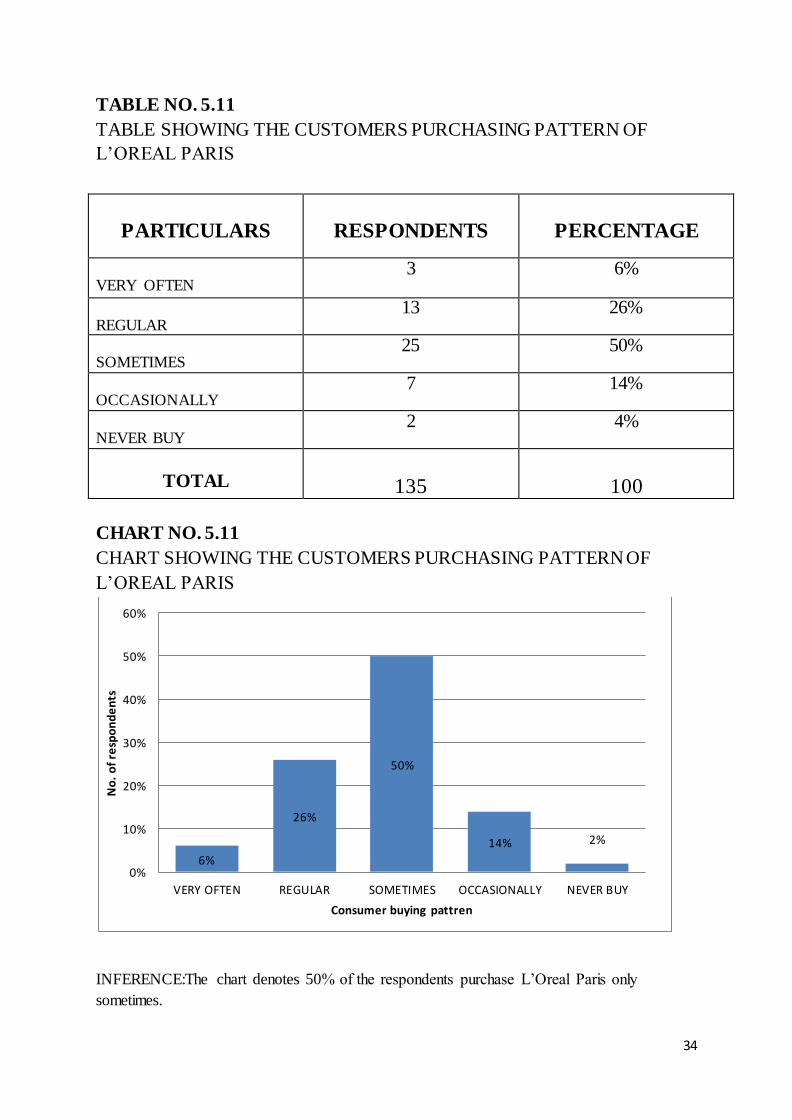
TABLE NO. 5.11
TABLE SHOWING THE CUSTOMERS PURCHASING PATTERN OF
L’OREAL PARIS
PARTICULARS
RESPONDENTS
PERCENTAGE
VERY OFTEN
3 6%
REGULAR 13 26%
SOMETIMES
25 50%
OCCASIONALLY
7 14%
NEVER BUY
2 4%
TOTAL
135
100
CHART NO. 5.11
CHART SHOWING THE CUSTOMERS PURCHASING PATTERN OF
L’OREAL PARIS
INFERENCE:The chart denotes 50% of the respondents purchase L’Oreal Paris only
sometimes.
6%
26%
50%
14% 2%
0%
10%
20%
30%
40%
50%
60%
VERY OFTEN REGULAR SOMETIMES OCCASIONALLY NEVER BUY
No
. o
f re
spo
nd
en
ts
Consumer buying pattren
35
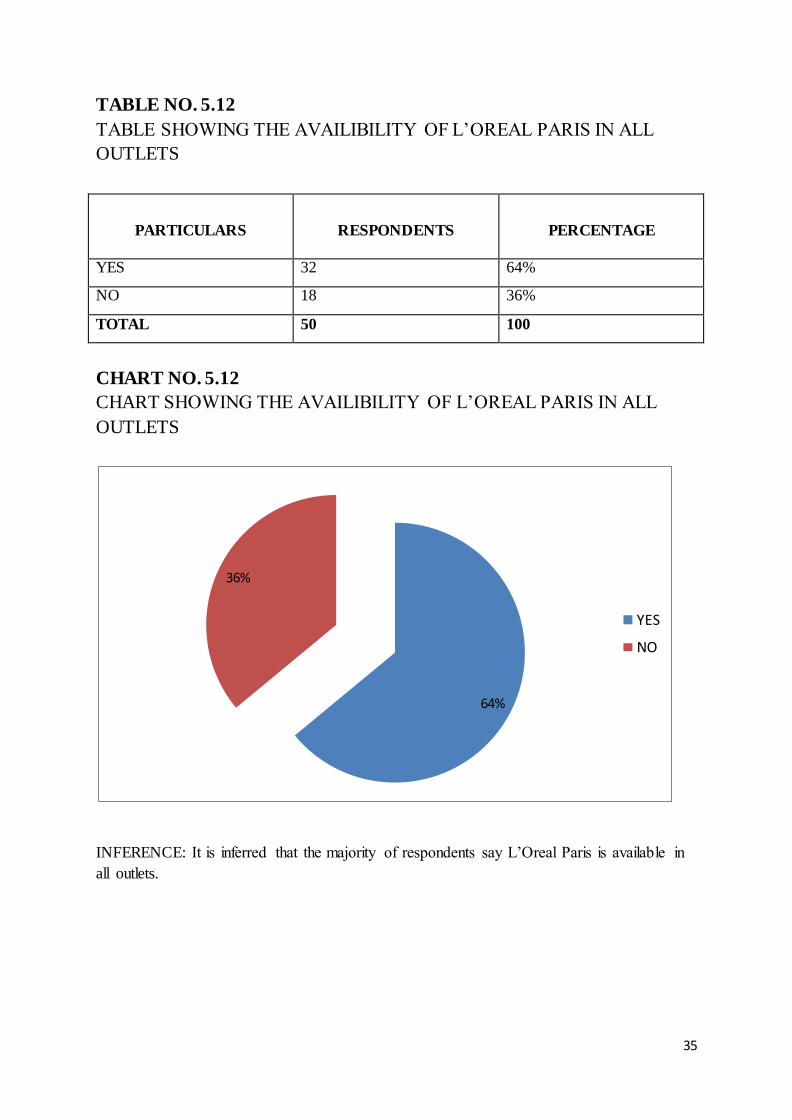
TABLE NO. 5.12
TABLE SHOWING THE AVAILIBILITY OF L’OREAL PARIS IN ALL
OUTLETS
PARTICULARS
RESPONDENTS
PERCENTAGE
YES 32 64%
NO 18 36%
TOTAL 50 100
CHART NO. 5.12
CHART SHOWING THE AVAILIBILITY OF L’OREAL PARIS IN ALL
OUTLETS
INFERENCE: It is inferred that the majority of respondents say L’Oreal Paris is available in
all outlets.
64%
36%
YES
NO
36
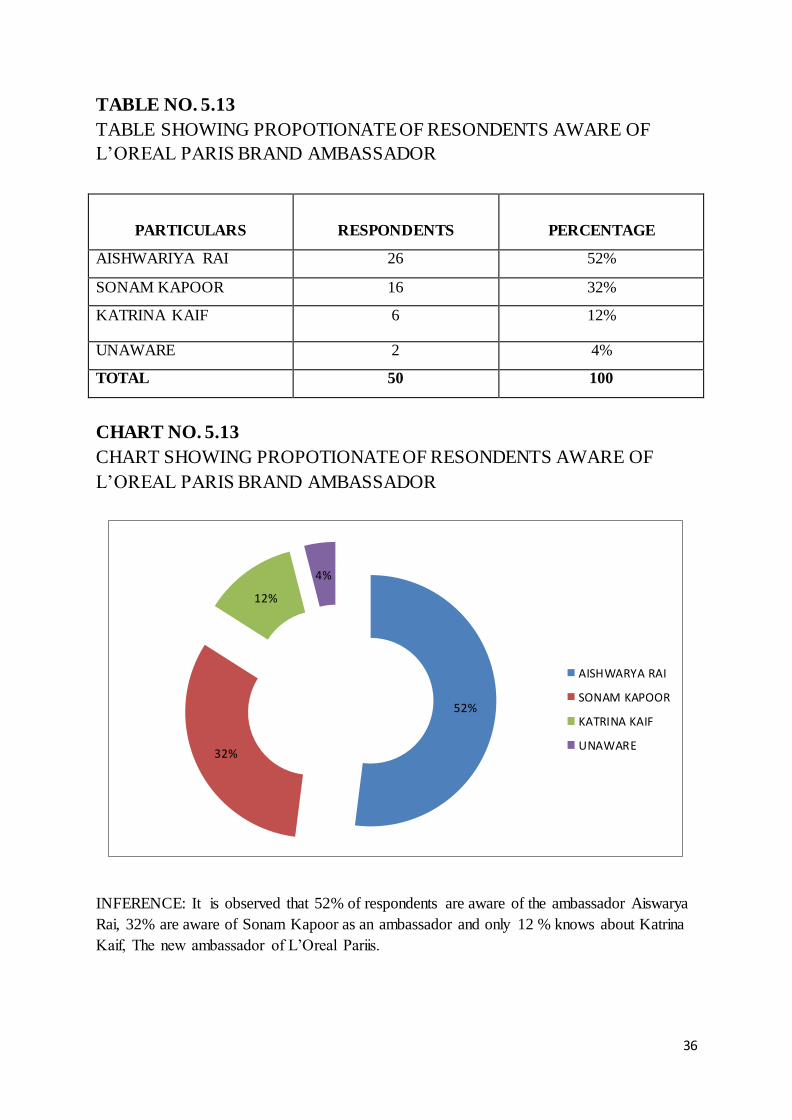
TABLE NO. 5.13
TABLE SHOWING PROPOTIONATE OF RESONDENTS AWARE OF
L’OREAL PARIS BRAND AMBASSADOR
PARTICULARS
RESPONDENTS
PERCENTAGE
AISHWARIYA RAI 26 52%
SONAM KAPOOR 16 32%
KATRINA KAIF 6 12%
UNAWARE 2 4%
TOTAL 50 100
CHART NO. 5.13
CHART SHOWING PROPOTIONATE OF RESONDENTS AWARE OF
L’OREAL PARIS BRAND AMBASSADOR
INFERENCE: It is observed that 52% of respondents are aware of the ambassador Aiswarya
Rai, 32% are aware of Sonam Kapoor as an ambassador and only 12 % knows about Katrina
Kaif, The new ambassador of L’Oreal Pariis.
52%
32%
12%
4%
AISHWARYA RAI
SONAM KAPOOR
KATRINA KAIF
UNAWARE
37
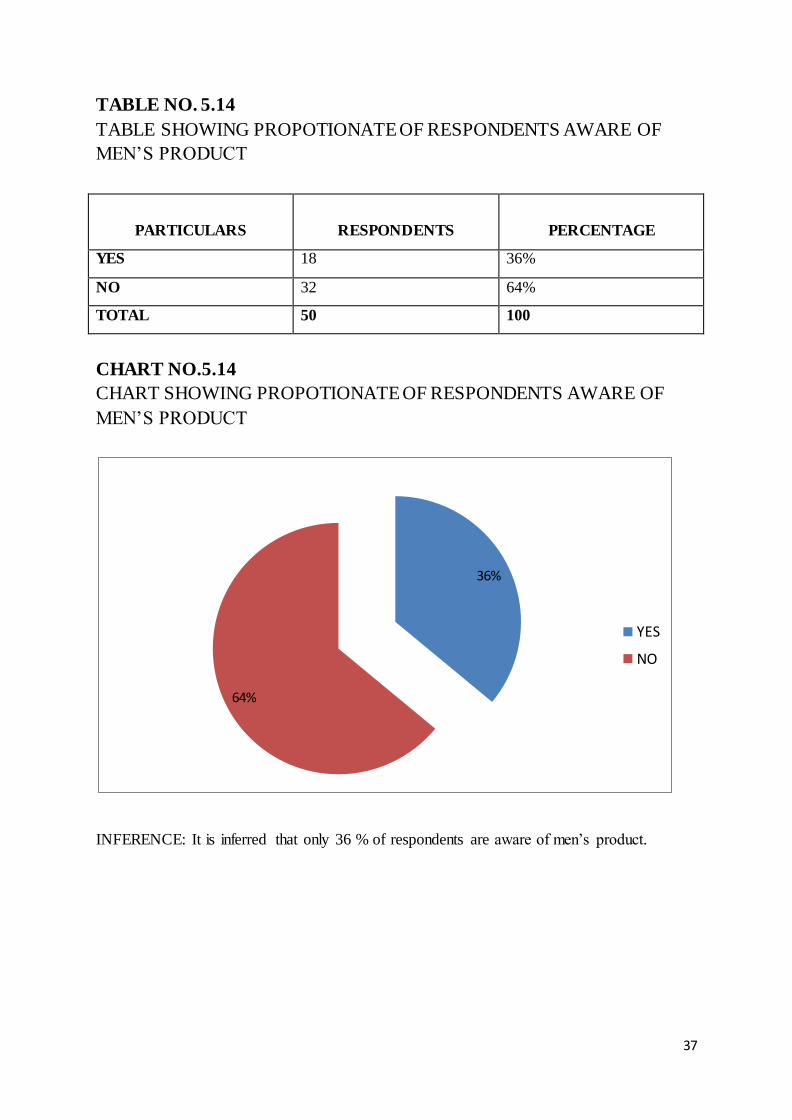
TABLE NO. 5.14
TABLE SHOWING PROPOTIONATE OF RESPONDENTS AWARE OF
MEN’S PRODUCT
PARTICULARS
RESPONDENTS
PERCENTAGE
YES 18 36%
NO 32 64%
TOTAL 50 100
CHART NO.5.14
CHART SHOWING PROPOTIONATE OF RESPONDENTS AWARE OF
MEN’S PRODUCT
INFERENCE: It is inferred that only 36 % of respondents are aware of men’s product.
36%
64%
YES
NO
38
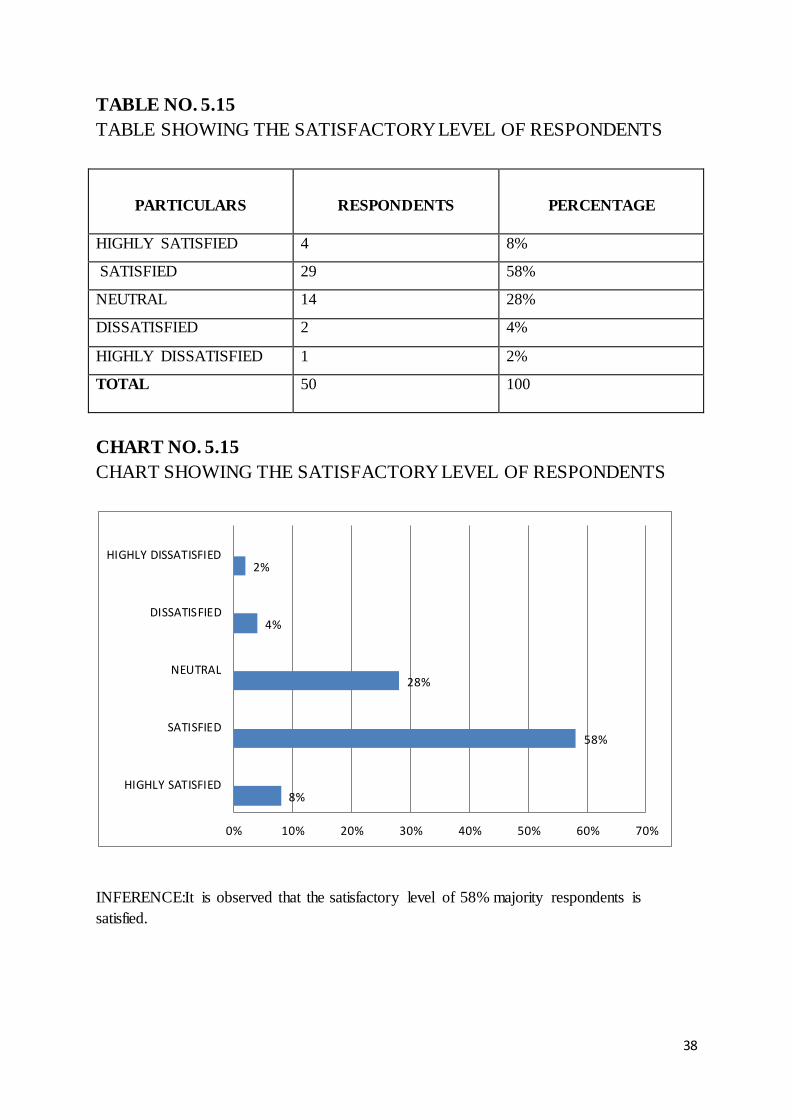
TABLE NO. 5.15
TABLE SHOWING THE SATISFACTORY LEVEL OF RESPONDENTS
PARTICULARS
RESPONDENTS
PERCENTAGE
HIGHLY SATISFIED 4 8%
SATISFIED 29 58%
NEUTRAL 14 28%
DISSATISFIED 2 4%
HIGHLY DISSATISFIED 1 2%
TOTAL 50 100
CHART NO. 5.15
CHART SHOWING THE SATISFACTORY LEVEL OF RESPONDENTS
INFERENCE:It is observed that the satisfactory level of 58% majority respondents is
satisfied.
8%
58%
28%
4%
2%
0% 10% 20% 30% 40% 50% 60% 70%
HIGHLY SATISFIED
SATISFIED
NEUTRAL
DISSATISFIED
HIGHLY DISSATISFIED
39
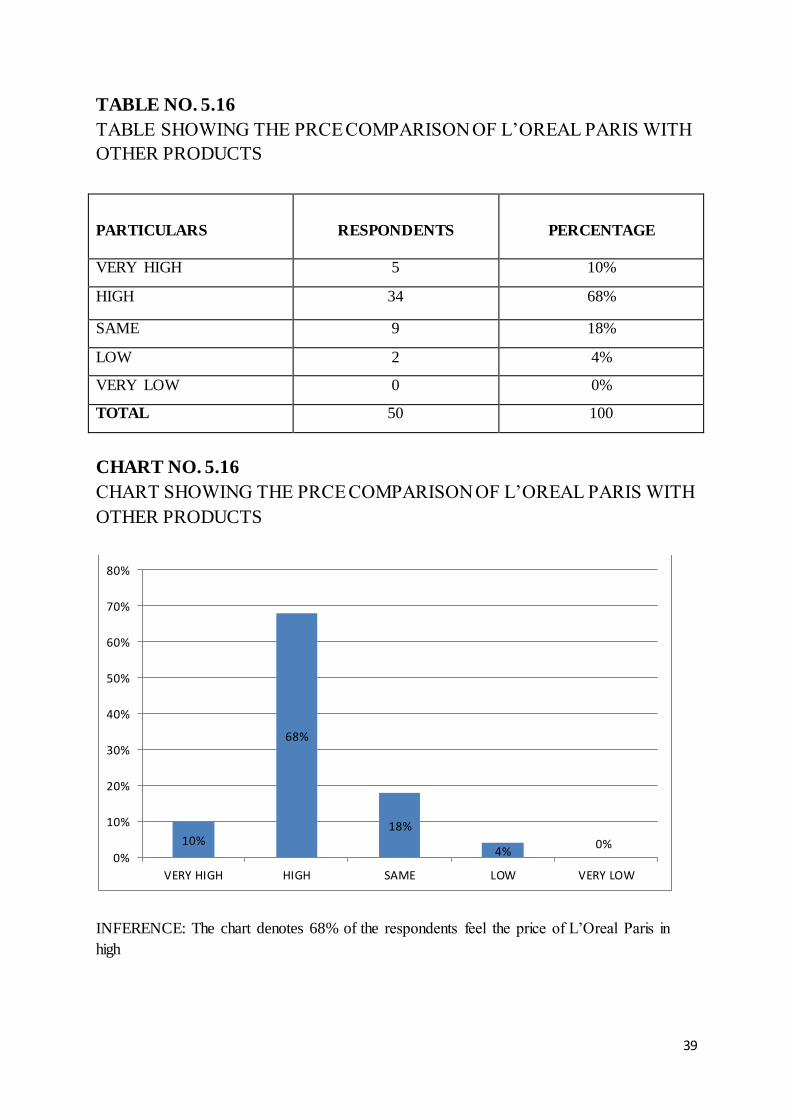
TABLE NO. 5.16
TABLE SHOWING THE PRCE COMPARISON OF L’OREAL PARIS WITH
OTHER PRODUCTS
PARTICULARS
RESPONDENTS
PERCENTAGE
VERY HIGH 5 10%
HIGH 34 68%
SAME 9 18%
LOW 2 4%
VERY LOW 0 0%
TOTAL 50 100
CHART NO. 5.16
CHART SHOWING THE PRCE COMPARISON OF L’OREAL PARIS WITH
OTHER PRODUCTS
INFERENCE: The chart denotes 68% of the respondents feel the price of L’Oreal Paris in
high
10%
68%
18%
4%0%
0%
10%
20%
30%
40%
50%
60%
70%
80%
VERY HIGH HIGH SAME LOW VERY LOW
40
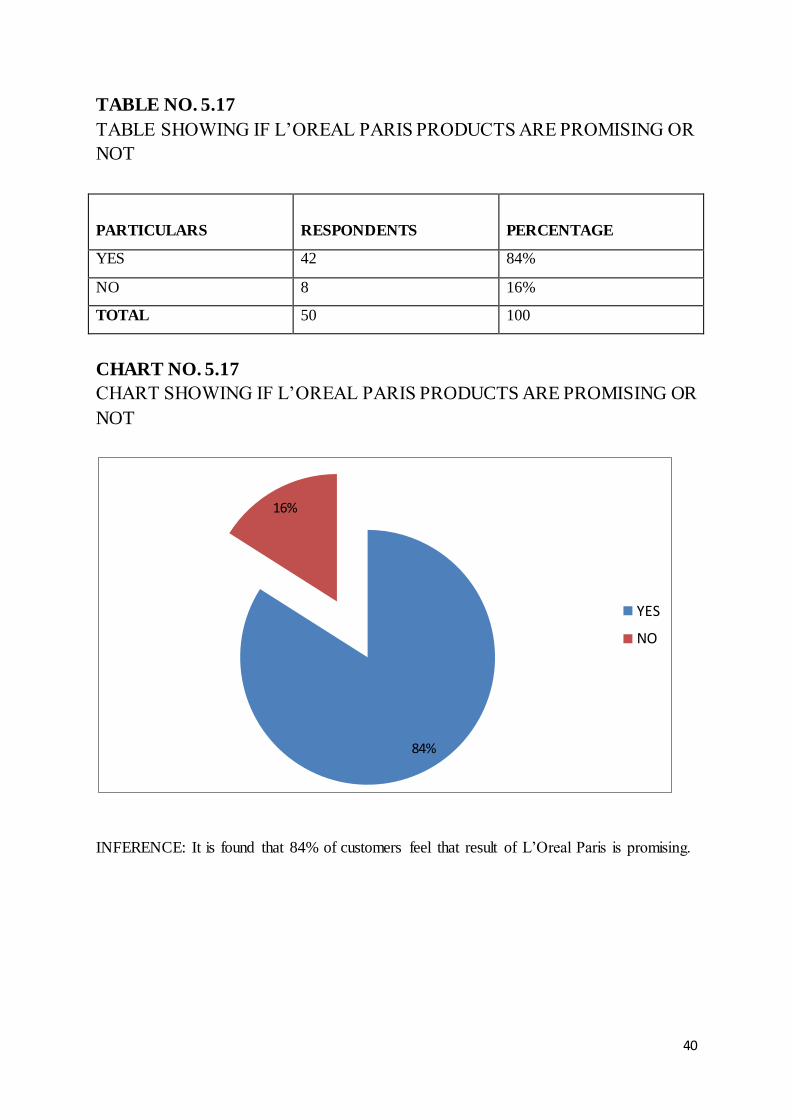
TABLE NO. 5.17
TABLE SHOWING IF L’OREAL PARIS PRODUCTS ARE PROMISING OR
NOT
PARTICULARS
RESPONDENTS
PERCENTAGE
YES 42 84%
NO 8 16%
TOTAL 50 100
CHART NO. 5.17
CHART SHOWING IF L’OREAL PARIS PRODUCTS ARE PROMISING OR
NOT
INFERENCE: It is found that 84% of customers feel that result of L’Oreal Paris is promising.
84%
16%
YES
NO
41
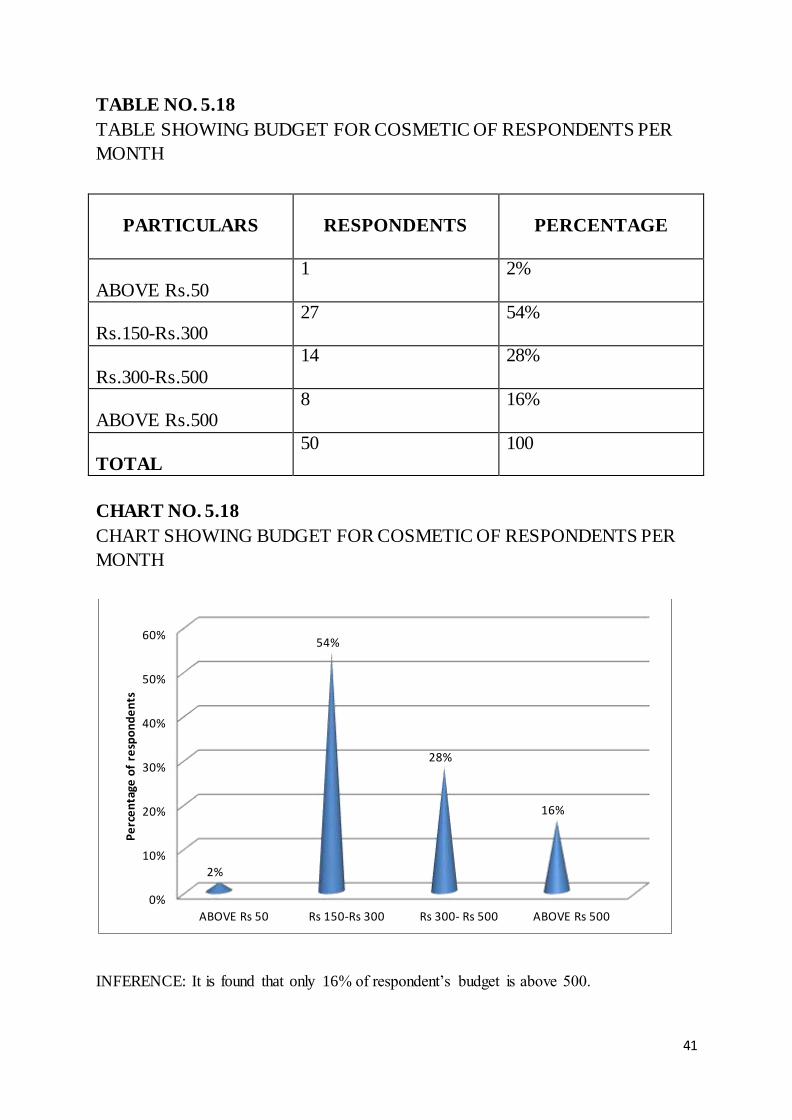
TABLE NO. 5.18
TABLE SHOWING BUDGET FOR COSMETIC OF RESPONDENTS PER
MONTH
PARTICULARS
RESPONDENTS
PERCENTAGE
ABOVE Rs.50
1 2%
Rs.150-Rs.300
27 54%
Rs.300-Rs.500
14 28%
ABOVE Rs.500
8 16%
TOTAL
50 100
CHART NO. 5.18
CHART SHOWING BUDGET FOR COSMETIC OF RESPONDENTS PER
MONTH
INFERENCE: It is found that only 16% of respondent’s budget is above 500.
0%
10%
20%
30%
40%
50%
60%
ABOVE Rs 50 Rs 150-Rs 300 Rs 300- Rs 500 ABOVE Rs 500
2%
54%
28%
16%
Pe
rce
nta
ge o
f re
spo
nd
en
ts
42
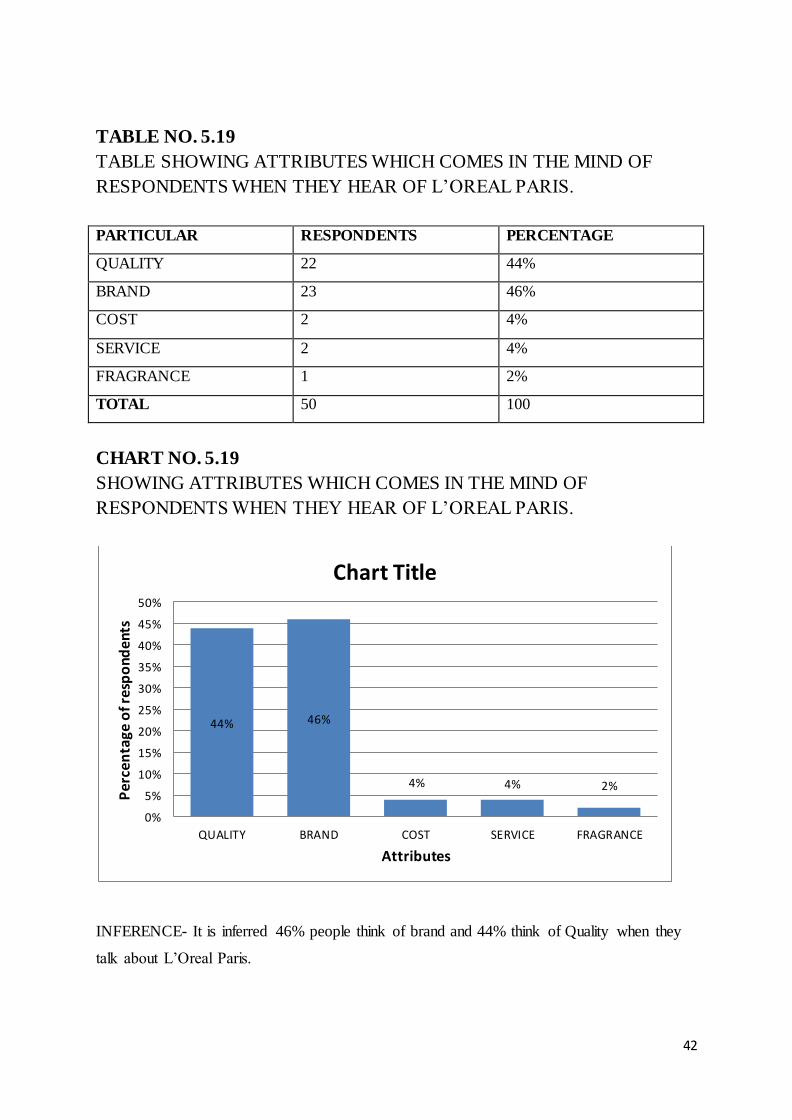
TABLE NO. 5.19
TABLE SHOWING ATTRIBUTES WHICH COMES IN THE MIND OF
RESPONDENTS WHEN THEY HEAR OF L’OREAL PARIS.
PARTICULAR RESPONDENTS PERCENTAGE
QUALITY 22 44%
BRAND 23 46%
COST 2 4%
SERVICE 2 4%
FRAGRANCE 1 2%
TOTAL 50 100
CHART NO. 5.19
SHOWING ATTRIBUTES WHICH COMES IN THE MIND OF
RESPONDENTS WHEN THEY HEAR OF L’OREAL PARIS.
INFERENCE- It is inferred 46% people think of brand and 44% think of Quality when they
talk about L’Oreal Paris.
44% 46%
4% 4% 2%
0%
5%
10%
15%
20%
25%
30%
35%
40%
45%
50%
QUALITY BRAND COST SERVICE FRAGRANCE
Per
cen
tage
of r
esp
ond
ents
Attributes
Chart Title
43
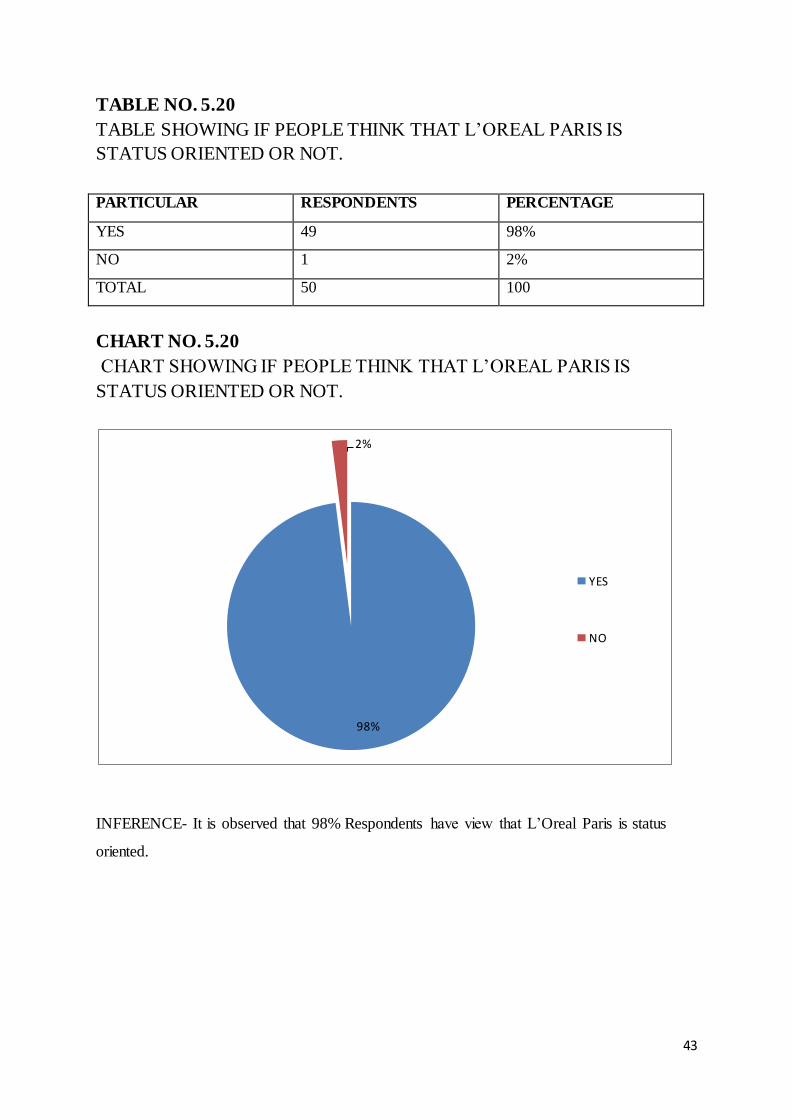
TABLE NO. 5.20
TABLE SHOWING IF PEOPLE THINK THAT L’OREAL PARIS IS
STATUS ORIENTED OR NOT.
PARTICULAR RESPONDENTS PERCENTAGE
YES 49 98%
NO 1 2%
TOTAL 50 100
CHART NO. 5.20
CHART SHOWING IF PEOPLE THINK THAT L’OREAL PARIS IS
STATUS ORIENTED OR NOT.
INFERENCE- It is observed that 98% Respondents have view that L’Oreal Paris is status
oriented.
98%
2%
YES
NO
44
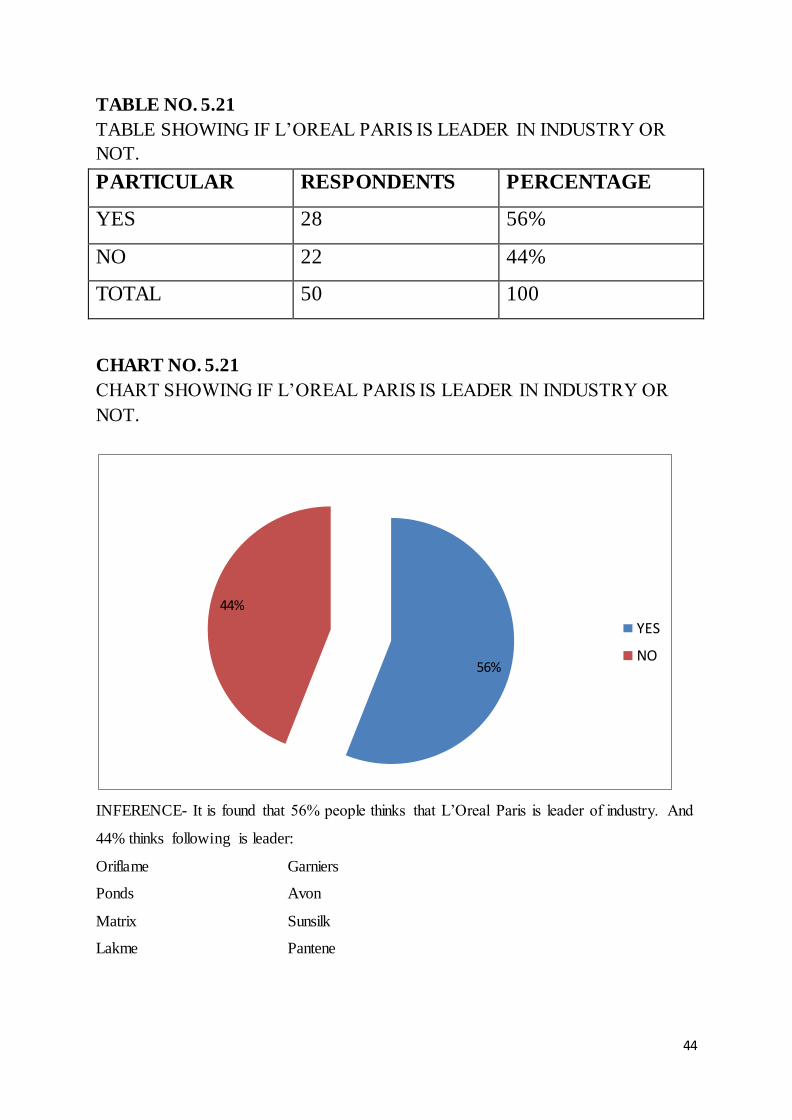
TABLE NO. 5.21
TABLE SHOWING IF L’OREAL PARIS IS LEADER IN INDUSTRY OR
NOT.
PARTICULAR RESPONDENTS PERCENTAGE
YES 28 56%
NO 22 44%
TOTAL 50 100
CHART NO. 5.21
CHART SHOWING IF L’OREAL PARIS IS LEADER IN INDUSTRY OR
NOT.
INFERENCE- It is found that 56% people thinks that L’Oreal Paris is leader of industry. And
44% thinks following is leader:
Oriflame Garniers
Ponds Avon
Matrix Sunsilk
Lakme Pantene
56%
44%
YES
NO
45
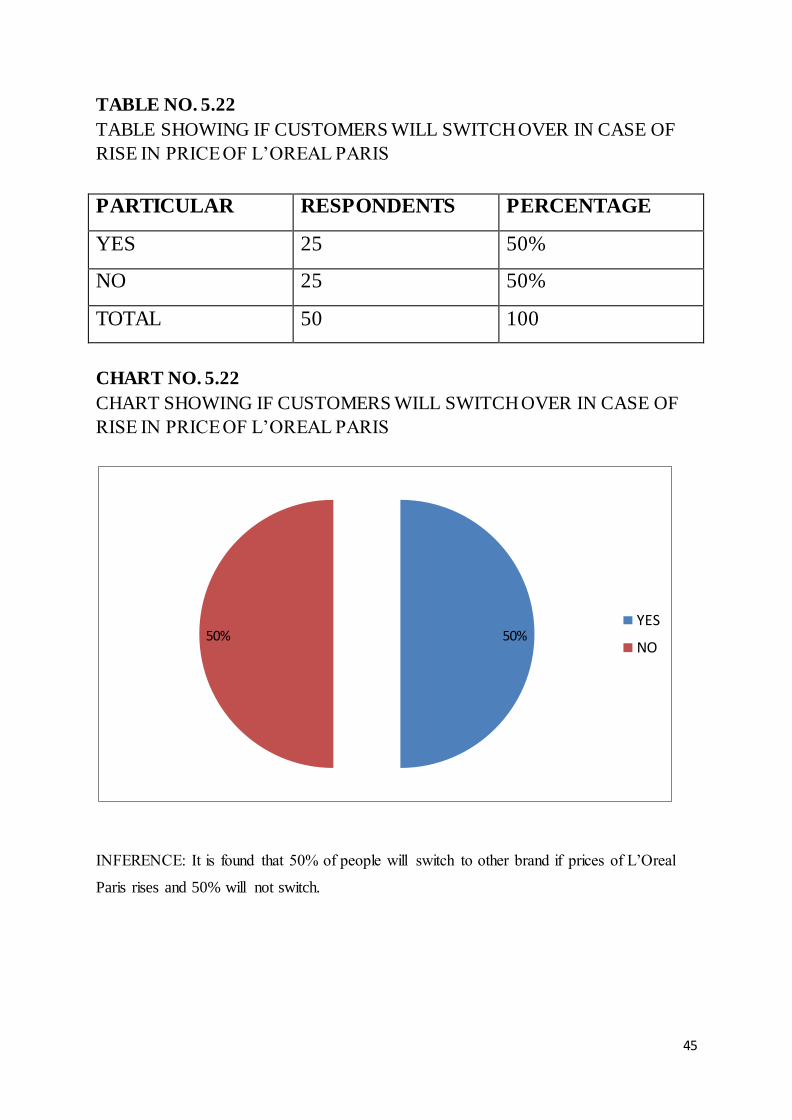
TABLE NO. 5.22
TABLE SHOWING IF CUSTOMERS WILL SWITCH OVER IN CASE OF
RISE IN PRICE OF L’OREAL PARIS
PARTICULAR RESPONDENTS PERCENTAGE
YES 25 50%
NO 25 50%
TOTAL 50 100
CHART NO. 5.22
CHART SHOWING IF CUSTOMERS WILL SWITCH OVER IN CASE OF
RISE IN PRICE OF L’OREAL PARIS
INFERENCE: It is found that 50% of people will switch to other brand if prices of L’Oreal
Paris rises and 50% will not switch.
50%50%YES
NO
46
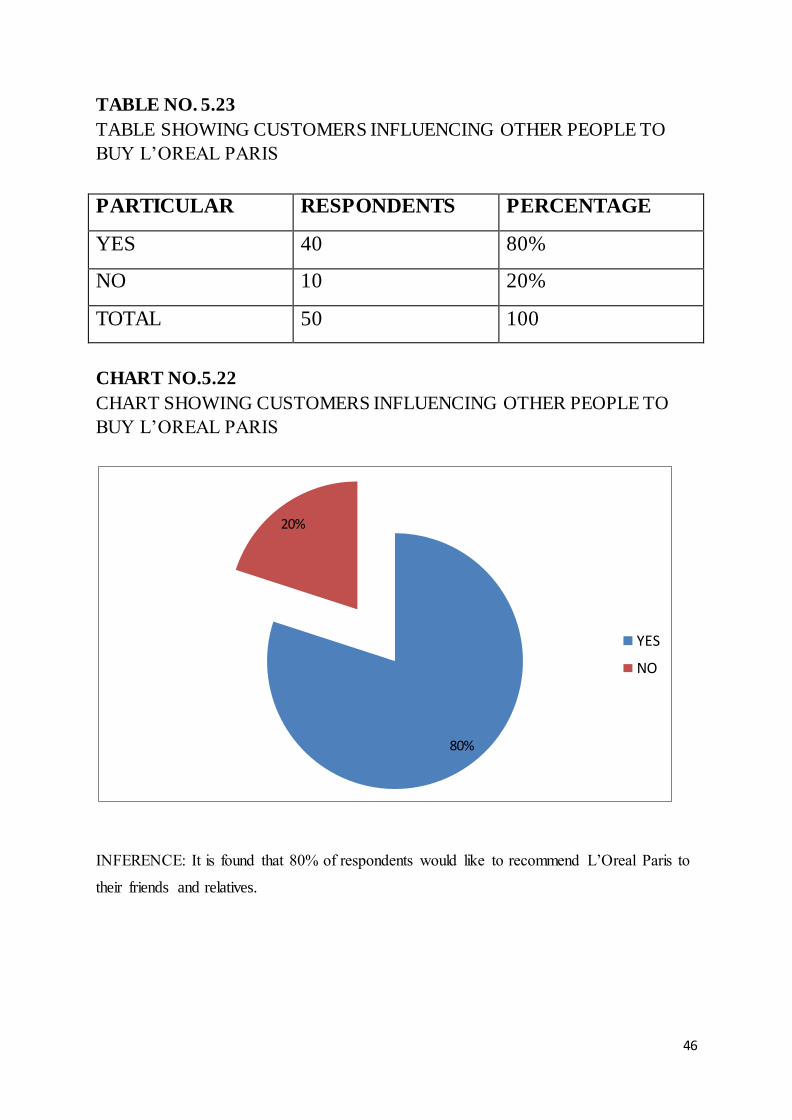
TABLE NO. 5.23
TABLE SHOWING CUSTOMERS INFLUENCING OTHER PEOPLE TO
BUY L’OREAL PARIS
PARTICULAR RESPONDENTS PERCENTAGE
YES 40 80%
NO 10 20%
TOTAL 50 100
CHART NO.5.22
CHART SHOWING CUSTOMERS INFLUENCING OTHER PEOPLE TO
BUY L’OREAL PARIS
INFERENCE: It is found that 80% of respondents would like to recommend L’Oreal Paris to
their friends and relatives.
80%
20%
YES
NO

47
CHAPTER 6
FINDINGS
48
6.1 FINDINGS
It is inferred from these charts and tables that:
82% people who responded for the questionnaire are students.
84% of respondents who answered the questionnaire are female.
76% of respondent’s income level falls Nil because the research was performed
amongst students.
96% of respondents are aware of L’Oreal Paris.
Customers prefer purchasing L’Oreal Paris for its quality.
Only 12% of respondents strongly agree L’Oreal Paris is their 1st preference.
L’Oreal Paris influenced 78% of its customers through advertisements.
56% of customers like Hair care products of L’Oreal Paris.
90% of respondents feel L’Oreal Paris is costly.
72% of respondents feel the advertisement is good.
50% of the respondents purchase L’Oreal Paris only sometimes.
The majority of respondents say L’Oreal Paris is available in all outlets.
52% of respondents are aware of the ambassador Aiswarya Rai, 32% are aware of
Sonam Kapoor as an ambassador and only 12 % knows about Katrina Kaif, The new
ambassador of L’Oreal Pariis.
Only 36 % of respondents are aware of men’s product.
The satisfactory level of 58% majority respondents is satisfied.
68% of the respondents feel the price of L’Oreal Paris in high
84% of customers feel that result of L’Oreal Paris is promising.
16% of respondent’s budget is above 500.
46% people think of brand and 44% think of Quality when they talk about L’Oreal
Paris.
98% Respondents have view that L’Oreal Paris is status oriented.
56% people thinks that L’Oreal Paris is leader of industry. And 44% thinks following
is leader: Oriflame, Garniers, Ponds, Avon, Matrix, Sunsilk, Lakme and Pantene
50% of people will switch to other brand if prices of L’Oreal Paris rises and 50% will
not switch.
80% of respondents would like to recommend L’Oreal Paris to their friends and
relatives.
49
CHAPTER 7
CONCLUSION
AND
RECOMMENDATIONS
50
7.1 CONCLUSION
The various tests conducted on the data obtained from the implementation of the
questionnaire allowed me to understand the various drivers for purchasing personal care
products. I could identify that a high level of brand awareness is an important driver with
regard to influencing purchasing behaviour. A few analyses with regards to the desirability
for the brand indicated that there was a difference in the levels of desire according to
ethnicity. It was shown that the ethnic group which had the most desire for the brand also
displayed the most positive behaviour with regard to purchases (behaviour). Further tests
were performed which gave a clear indication that it is possible to see the effect that a
favourable perception / attitude of the corporate / product L’Oréal brand has on influencing
behavioural intention and ultimately the end behaviour (purchases). In terms of identifying
whether or not the current value proposition of L’Oréal is suited to the target audience, the
overall impression of the author is that it would be a strategically important move if L’Oréal
were to try to develop a stronger emotional bond with their target audience, a well as to find
ways in which to ‘sell’ to the consumer unique self-expressive benefits which can be gained
when using L’Oréal branded products. The survey also revealed the weaker presence of
L’Oréal amongst the black ethnic group. The author believes that this weakly tapped market
could be a valuable additional income stream for L’Oréal if they were to develop actions to
enhance the brand imagery that this group associates with the L’Oréal brand positively. These
actions should lead to long-term strategic and market-related benefits (e.g. market share) for
L’Oréal within the target audience of this study.
51
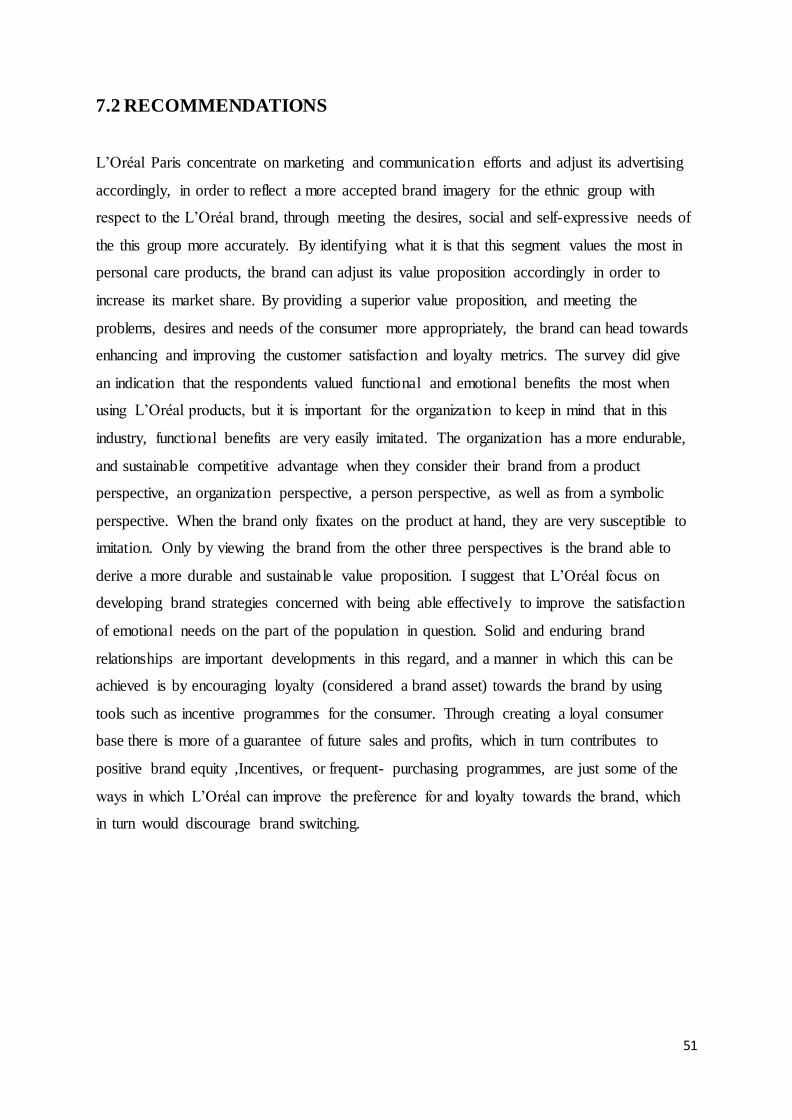
7.2 RECOMMENDATIONS
L’Oréal Paris concentrate on marketing and communication efforts and adjust its advertising
accordingly, in order to reflect a more accepted brand imagery for the ethnic group with
respect to the L’Oréal brand, through meeting the desires, social and self-expressive needs of
the this group more accurately. By identifying what it is that this segment values the most in
personal care products, the brand can adjust its value proposition accordingly in order to
increase its market share. By providing a superior value proposition, and meeting the
problems, desires and needs of the consumer more appropriately, the brand can head towards
enhancing and improving the customer satisfaction and loyalty metrics. The survey did give
an indication that the respondents valued functional and emotional benefits the most when
using L’Oréal products, but it is important for the organization to keep in mind that in this
industry, functional benefits are very easily imitated. The organization has a more endurable,
and sustainable competitive advantage when they consider their brand from a product
perspective, an organization perspective, a person perspective, as well as from a symbolic
perspective. When the brand only fixates on the product at hand, they are very susceptible to
imitation. Only by viewing the brand from the other three perspectives is the brand able to
derive a more durable and sustainable value proposition. I suggest that L’Oréal focus on
developing brand strategies concerned with being able effectively to improve the satisfaction
of emotional needs on the part of the population in question. Solid and enduring brand
relationships are important developments in this regard, and a manner in which this can be
achieved is by encouraging loyalty (considered a brand asset) towards the brand by using
tools such as incentive programmes for the consumer. Through creating a loyal consumer
base there is more of a guarantee of future sales and profits, which in turn contributes to
positive brand equity ,Incentives, or frequent- purchasing programmes, are just some of the
ways in which L’Oréal can improve the preference for and loyalty towards the brand, which
in turn would discourage brand switching.
52
BIBLIOGRAPHY
BOOKS:
Aaker, D. A., 1991. Managing Brand Equity: Capitalizing on the Value of a Brand
Name.
Philip Kotlar., Marketing Management.
Research Methodology – C.R. Kothari
WEBSITES:
http://www.forbes.com/technology/enterprisetech/2004/09/20/cxld0920itloyalty.html
.http://www.studymode.com/essays/Factors-Affecting-The-Location-Of-Retail-
578148.html
http://en.wikipedia.org/wiki/L'Or%C3%A9al
53
ANNEXTURE
Following things are attached with project:
Questionnaire
Posters of L’Oreal Paris
54
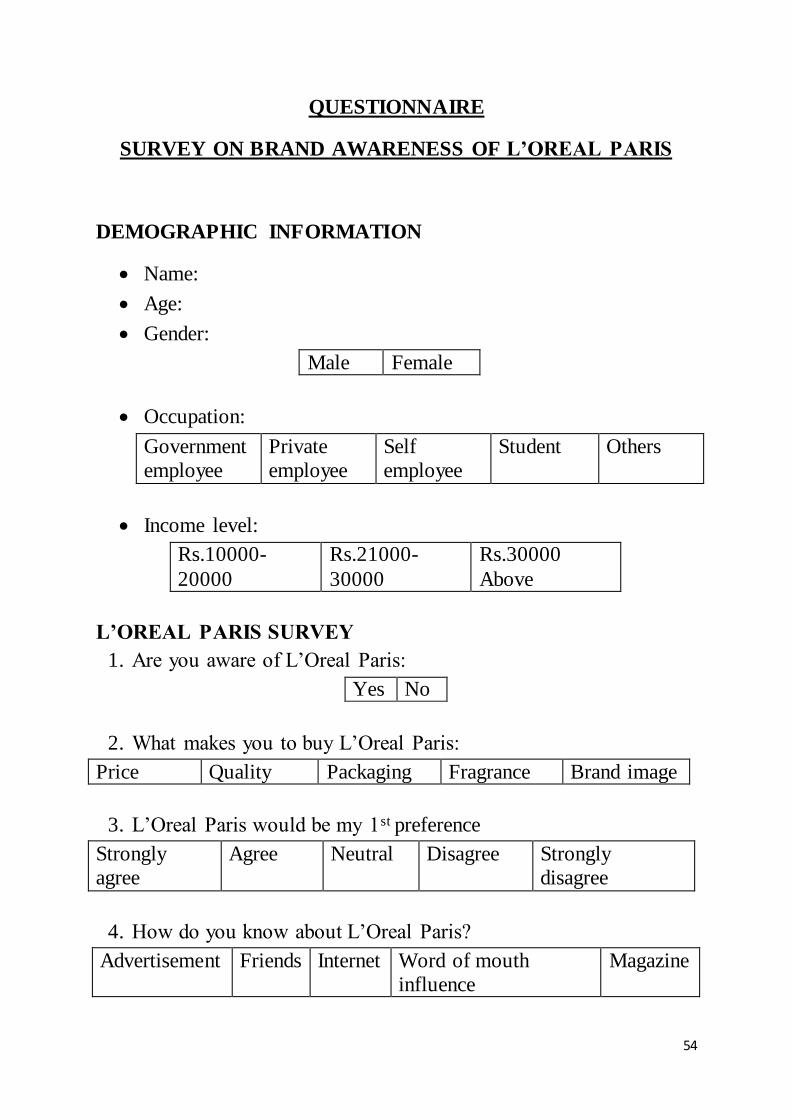
QUESTIONNAIRE
SURVEY ON BRAND AWARENESS OF L’OREAL PARIS
DEMOGRAPHIC INFORMATION
Name:
Age:
Gender:
Male Female
Occupation:
Government
employee
Private
employee
Self
employee
Student Others
Income level:
Rs.10000-
20000
Rs.21000-
30000
Rs.30000
Above
L’OREAL PARIS SURVEY
1. Are you aware of L’Oreal Paris:
Yes No
2. What makes you to buy L’Oreal Paris:
Price Quality Packaging Fragrance Brand image
3. L’Oreal Paris would be my 1st preference
Strongly
agree
Agree Neutral Disagree Strongly
disagree
4. How do you know about L’Oreal Paris?
Advertisement Friends Internet Word of mouth
influence
Magazine
55
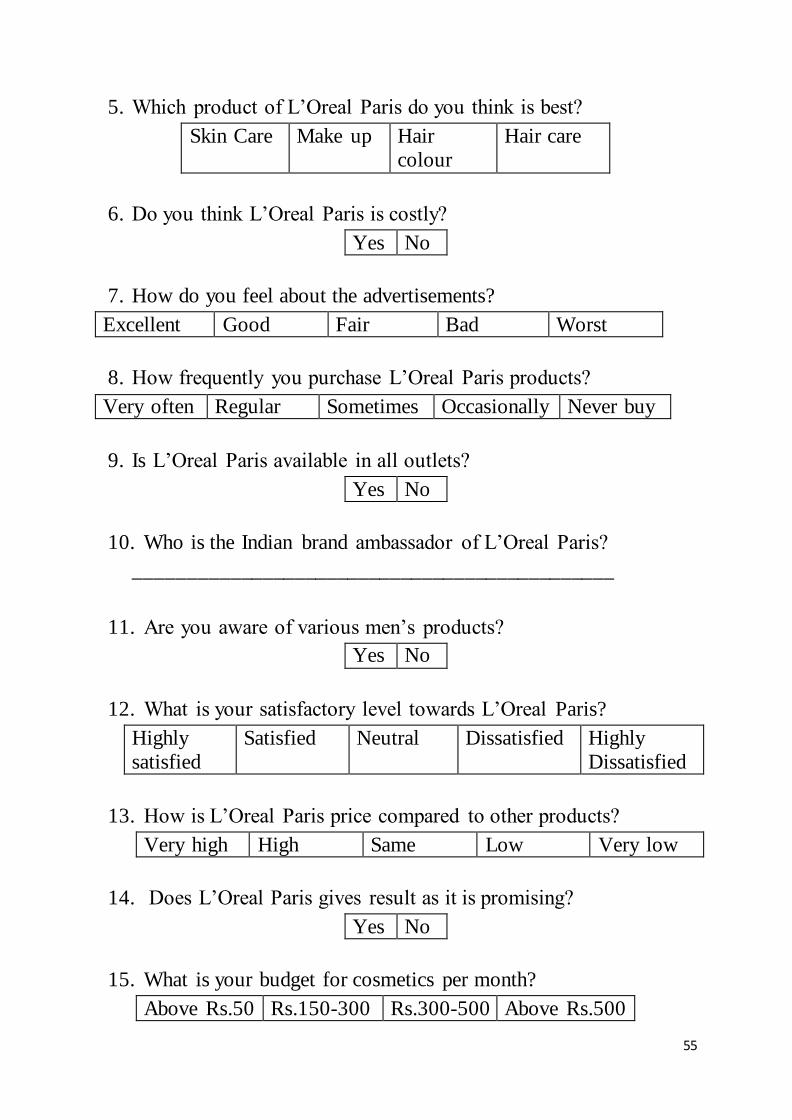
5. Which product of L’Oreal Paris do you think is best?
Skin Care Make up Hair
colour
Hair care
6. Do you think L’Oreal Paris is costly?
Yes No
7. How do you feel about the advertisements?
Excellent Good Fair Bad Worst
8. How frequently you purchase L’Oreal Paris products?
Very often Regular Sometimes Occasionally Never buy
9. Is L’Oreal Paris available in all outlets?
Yes No
10. Who is the Indian brand ambassador of L’Oreal Paris?
_____________________________________________
11. Are you aware of various men’s products?
Yes No
12. What is your satisfactory level towards L’Oreal Paris?
Highly
satisfied
Satisfied Neutral Dissatisfied Highly
Dissatisfied
13. How is L’Oreal Paris price compared to other products?
Very high High Same Low Very low
14. Does L’Oreal Paris gives result as it is promising?
Yes No
15. What is your budget for cosmetics per month?
Above Rs.50 Rs.150-300 Rs.300-500 Above Rs.500
56
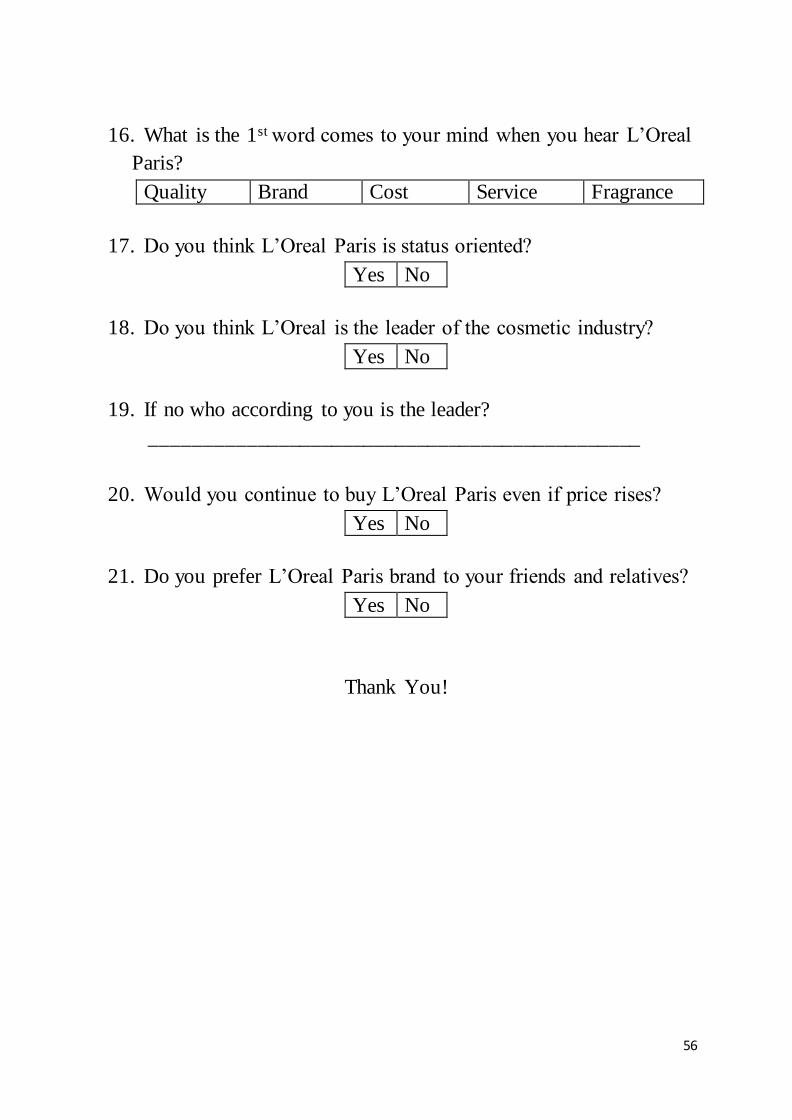
16. What is the 1st word comes to your mind when you hear L’Oreal
Paris?
Quality Brand Cost Service Fragrance
17. Do you think L’Oreal Paris is status oriented?
Yes No
18. Do you think L’Oreal is the leader of the cosmetic industry?
Yes No
19. If no who according to you is the leader?
______________________________________________
20. Would you continue to buy L’Oreal Paris even if price rises?
Yes No
21. Do you prefer L’Oreal Paris brand to your friends and relatives?
Yes No
Thank You!