
Measurements of Thermal Accomodation Coefficients · SANDIA REPORT SAND2005-6084 Unlimited Release...
31
SANDIA REPORT SAND2005-6084 Unlimited Release Printed October 2005 Measurements of Thermal Accomodation Coefficients Daniel J. Rader, Wayne M. Trott, John R. Torczynski, Jaime N. Castañeda, and T.W. Grasser Prepared by Sandia National Laboratories Albuquerque, New Mexico 87185 and Livermore, California 94550 Sandia is a multiprogram laboratory operated by Sandia Corporation, a Lockheed Martin Company, for the United States Department of Energy’s National Nuclear Security Administration under Contract DE-AC04-94AL85000. Approved for public release; further dissemination unlimited.
Transcript of Measurements of Thermal Accomodation Coefficients · SANDIA REPORT SAND2005-6084 Unlimited Release...

SAND2005-6084 Unlimited Release Printed October 2005 Measurements of Thermal Accomodation Coefficients
Daniel J. Rader, Wayne M. Trott, John R. Torczynski, Jaime N. Castañeda, and T.W. Grasser
Prepared by Sandia National Laboratories Albuquerque, New Mexico 87185 and Livermore, California 94550 Sandia is a multiprogram laboratory operated by Sandia Corporation, a Lockheed Martin Company, for the United States Department of Energy’s National Nuclear Security Administration under Contract DE-AC04-94AL85000. Approved for public release; further dissemination unlimited.

Issued by Sandia National Laboratories, operated for the United States Department of Energy by Sandia Corporation.
NOTICE: This report was prepared as an account of work sponsored by an agency of the United States Government. Neither the United States Government, nor any agency thereof, nor any of their employees, nor any of their contractors, subcontractors, or their employees, make any warranty, express or implied, or assume any legal liability or responsibility for the accuracy, completeness, or usefulness of any information, apparatus, product, or process disclosed, or represent that its use would not infringe privately owned rights. Reference herein to any specific commercial product, process, or service by trade name, trademark, manufacturer, or otherwise, does not necessarily constitute or imply its endorsement, recommendation, or favoring by the United States Government, any agency thereof, or any of their contractors or subcontractors. The views and opinions expressed herein do not necessarily state or reflect those of the United States Government, any agency thereof, or any of their contractors. Printed in the United States of America. This report has been reproduced directly from the best available copy. Available to DOE and DOE contractors from
U.S. Department of Energy Office of Scientific and Technical Information P.O. Box 62 Oak Ridge, TN 37831 Telephone: (865)576-8401 Facsimile: (865)576-5728 E-Mail: [email protected] Online ordering: http://www.osti.gov/bridge
Available to the public from
U.S. Department of Commerce National Technical Information Service 5285 Port Royal Rd Springfield, VA 22161 Telephone: (800)553-6847 Facsimile: (703)605-6900 E-Mail: [email protected] Online order: http://www.ntis.gov/help/ordermethods.asp?loc=7-4-0#online
2

SAND2005-6084Unlimited Release
Printed October 2005
Measurements of ThermalAccommodation Coefficients
Daniel J. Rader, Wayne M. Trott, John R. Torczynski,Jaime N. Castañeda, and Thomas W. Grasser
Engineering Sciences CenterSandia National Laboratories
P. O. Box 5800Albuquerque, New Mexico 87185-0834
Abstract
A previously-developed experimental facility has been used to determine gas-surface thermalaccommodation coefficients from the pressure dependence of the heat flux between parallel platesof similar material but different surface finish. Heat flux between the plates is inferred frommeasurements of temperature drop between the plate surface and an adjacent temperature-controlled water bath. Thermal accommodation measurements were determined from the pressuredependence of the heat flux for a fixed plate separation. Measurements of argon and nitrogen incontact with standard machined (lathed) or polished 304 stainless steel plates areindistinguishable within experimental uncertainty. Thus, the accommodation coefficient of 304stainless steel with nitrogen and argon is estimated to be 0.80 and 0.87 , respectively,independent of the surface roughness within the range likely to be encountered in engineeringpractice. Measurements of the accommodation of helium showed a slight variation with 304stainless steel surface roughness: 0.36 for a standard machine finish and 0.40 for apolished finish. Planned tests with carbon-nanotube-coated plates will be performed when 304stainless-steel blanks have been successfully coated.
0.02± 0.02±
0.02± 0.02±
3

Acknowledgments
This report includes work performed under LDRD 05-1287, “Thermal Accommodation ofCarbon Nanotube Coatings,” which was funded by the Laboratory Directed Research andDevelopment (LDRD) program at Sandia National Laboratories. The efforts of Prof. LarryOverzet at the University of Texas at Dallas in developing a method to provide carbon nanotubecoatings on our test plates is gratefully acknowledged.
4

Table of Contents
Table of Contents ....................................................................................................................5List of Figures .........................................................................................................................6List of Tables...........................................................................................................................7Nomenclature..........................................................................................................................8
1. Introduction.............................................................................................................................91.1. Overview........................................................................................................................91.2. Motivation......................................................................................................................91.3. Gas-Surface Accommodation Coefficient ...................................................................11
2. Theory ...................................................................................................................................122.1. Overview......................................................................................................................122.2. Fourier Geometry.........................................................................................................122.3. Surface Accommodation Model ..................................................................................132.4. Gas-Phase Heat Conduction ........................................................................................13
3. Experimental Apparatus and Procedure................................................................................153.1. Overview......................................................................................................................153.2. Vacuum Test Chamber and Environmental Control Systems ......................................153.3. Plate Assemblies ..........................................................................................................153.4. Test-Plate Surface Preparations ...................................................................................183.5. Heat-Flux Measurements .............................................................................................19
4. Experimental Results ............................................................................................................224.1. Overview......................................................................................................................224.2. Accommodation of Gases with Machined 304 Stainless Steel....................................224.3. Accommodation of Gases with Polished 304 Stainless Steel......................................254.4. Summary of Heat-Flux and Accommodation Measurements......................................28
5. Conclusions...........................................................................................................................29References.............................................................................................................................30Distribution ...........................................................................................................................32
5

List of Figures
Figure 1. Schematic diagram of the Fourier heat conduction geometry .....................................12Figure 2. Schematic diagram of the test chamber ......................................................................16Figure 3. Front view of assembled test chamber (observation window in foreground) .............16Figure 4. Elements of temperature-drop measurements in the “spool” assembly.......................17Figure 5. Carbon-nanotube coating ............................................................................................18Figure 6. Temperature (top) and temperature-difference (bottom) histories for the hot plate
(nitrogen, machined 304 stainless steel, 5-mm gap)....................................................20Figure 7. Plot of inverse ∆Tgas vs. inverse pressure in the temperature-jump regime (nitrogen,
Tc = 15.1°C, Th = 35.1°C, machined 304 stainless steel, 5-mm gap). .........................23Figure 8. Plot of inverse ∆Tgas vs. inverse pressure in the temperature-jump regime for helium
(top) and argon (bottom). .............................................................................................24Figure 9. Plot of inverse ∆Tgas vs. inverse pressure for machined and polished 304 stainless
steel. Top: argon, Tc = 5.2°C, Th = 45.0°C, 10-mm gap. Bottom: nitrogen, Tc = 15.1°C,Th = 35.1°C, 5-mm gap................................................................................................26
Figure 10. Plot of inverse ∆Tgas vs. inverse pressure for machined and polished 304 stainlesssteel: helium, Tc = 20.2°C, Th = 30.1°C, 10-mm gap. .................................................27
6

List of Tables
Table 1. Summary of Heat-Flux and Accommodation Measurements......................................28
7

Nomenclature
Roman Variablesmean molecular speed of a Maxwellian distribution, [m/s]incident energy flux [W/m2]reflected energy flux [W/m2]wall-equilibrium reflected energy flux [W/m2]thermal conductivity [W/(m⋅K)]Boltzmann constant [ ]gap between plates [m]molecular mass [kg]pressure [Pa]heat flux magnitude [W/m2]temperature [K]temperature of cold wall at [K]temperature of hot wall at [K]wall temperature [K]Cartesian coordinate [m]
Greek Variablesthermal accommodation coefficient [1]number of internal degrees of freedom [1]gas mean free path, [m]absolute viscosity [Pa⋅s]mass density [kg/m3]
Subscriptscontinuumfree molecularquantity at a solid wall boundaryboundary or wall atboundary or wall at
AcronymsEUVL Extreme Ultraviolet LithographyFS Full ScaleMEMS Micro Electro Mechanical SystemsUTD University of Texas at Dallas
c 8kBT πm⁄EinEreEwKkB 1.380658 10 23–× J/KLmPqTT c x 0=T h x L=T wz
αζλ 2µ( ) ρc( )⁄µρ
CFMwallc z 0=h z L=
8

1. Introduction
1.1. Overview
Heat transfer to surfaces immersed in noncontinuum (transitional or rarefied) gas flow continuesto be an active area of research. Gases exhibit noncontinuum effects when the characteristiclength scale of the system becomes comparable to the gas mean free path. Thus, these effectsbecome important when either the system length scale becomes small (e.g., Micro ElectroMechanical Systems) or when the gas pressure becomes low (e.g., semiconductor manufacturingor spacecraft aerodynamics). A priori prediction of noncontinuum, gas-phase heat flux requires adetailed description of the gas-surface interaction. Unfortunately, and despite considerable effortover the past century, reliable gas-surface interaction mechanisms are still lacking. This gap inunderstanding becomes increasingly serious as modelers are asked to perform ever moresophisticated engineering analyses of systems exhibiting marked noncontinuum behavior. It iswell recognized that the remedy to this dilemma lies in the development of a reliable,experimentally-validated database of gas-surface interaction models. Ideally, this database wouldspan the wide range of gas-surface combinations that are of interest in modern engineeringapplications.
A previous LDRD-funded study (Rader et al., 2004) took a major step toward meeting this needby developing an experimental chamber and diagnostics that can provide measurements of gas-surface thermal accommodation coefficients. The present report documents work performedunder a follow-on LDRD that investigates the role of surface roughness on the thermalaccommodation coefficient. The goal of this work was to measure the thermal accommodationcoefficients of three very distinct surfaces: 1) mirror-polished 304 stainless steel (a smoothsurface), 2) standard machined (by lathe) 304 stainless steel (a moderately rough surface), and3) 304 stainless steel coated with a carbon nanotube forest (a fully rough surface). The long-termhope is to identify strategies for reliably designing surfaces that provide a specified level ofthermal accommodation.
A review of gas-surface interaction theory and the details of the experimental apparatus andprocedure used here are described in detail in a previous report (Rader et al., 2004). Briefsummaries of the salient features of this previous work are repeated here for the convenience ofthe reader. This chapter continues with an introduction to the problem of gas-surface interactions.Chapter 2 provides a condensed review of the underlying theory. Chapter 3 provides a shortsummary of the capabilities of the experimental apparatus and the test surfaces used in this work.Chapter 4 presents the most recent experimental results. Chapter 5 summarizes the work anddiscusses the plans for completing this study.
1.2. Motivation
The need to predict heat transfer to a surface immersed in a noncontinuum gas is common to avariety of applications of interest at Sandia National Laboratories. Gases exhibit noncontinuumeffects when the characteristic length scale of the system becomes comparable to the gas mean
9

free path, λ, defined as the average distance traveled by a molecule between collisions. As thedefinition of mean free path is somewhat arbitrary, a number of definitions persist in the literature;the definition of mean free path given by Springer (1971) is used here:
, (1)
where µ and ρ are the gas viscosity and mass density, is the mean molecularspeed, kB is the Boltzmann constant, T is the local gas temperature, and m is the gas molecularmass. Noncontinuum effects become important either when system length scales becomemicroscopically small or when gas pressures become low. The rise of noncontinuum behaviorwith decreasing pressure results from the inverse dependence of the mean free path on gas density,as given in Equation (1).
Applications with microscopic length scales are becoming increasingly common since the adventof Micro Electro Mechanical Systems (MEMS), which are currently manufactured with micron-scale geometric features. Microsystems are usually operated in air at ambient pressure andtemperatures, for which the mean free path is ~0.065 µm (Karniadakis and Beskok, 2002). Sincethe mean free path is not negligibly small compared to the geometric length scales, the conductionof heat across small gas channels exhibits noncontinuum features. Thus, engineering design toolsintended for thermal management analyses in microsystems must include noncontinuumcapabilities. These design tools will require specific gas-surface interaction models for thematerials and finishes encountered in microsystems. Device designers would benefit from theability to select surfaces that could provide a desired level of thermal performance; e.g., surfacesthat are nearly insulating (low accommodation) or highly conductive (high accommodation).
Noncontinuum gas-flow effects are also encountered when the system pressure becomes small.This approach to the noncontinuum limit arises from the fact that the mean free path is inverselyproportional to the gas density; thus, at sufficiently low pressures the mean free path becomescomparable even to macroscopic length scales. One long-established field of research, rarefied gasdynamics, pertains to the study of noncontinuum flow around high-speed spacecraft in the upperatmosphere. Rarefied gas flow is also observed in low-speed, low-pressure systems, such assemiconductor and MEMS manufacturing. All of these applications are of particular interest toSandia. One of the key challenges facing the development of Extreme UltraViolet Lithography(EUVL) was the protection of the lithographic mask from particle deposition. One proposedsolution was the use of thermophoretic protection, in which the mask is kept slightly warmer thana parallel plate (Klebanoff and Rader, 2000; Rader et al., 2002). The flow of heat from the warmermask to the cooler plate forces particles to move away from the mask, thereby providingprotection from particle contamination. A key challenge in this design is to maximize the heatflow through the gas resulting from a given temperature difference between the mask and plate.For EUVL mask protection purposes, highly accommodating surfaces are desired.
The above applications motivated the search for a highly-accommodating surface. One possibilityfor achieving high accommodation is to manufacture a surface with a high degree of microscopicroughness and/or porosity. This report documents the preliminary results of an investigation ofthis concept.
λ 2µρc------=
c 8kBT πm⁄( )1 2/=
10

1.3. Gas-Surface Accommodation Coefficient
Momentum and heat transfer to surfaces immersed in noncontinuum gas flows continues to be thesubject of many studies since Maxwell’s pioneering work over 100 years ago (Maxwell, 1890). Topredict momentum and heat fluxes, it is essential to know the net balance of energy andmomentum carried by molecules impinging on and reflecting from a surface. Despiteconsiderable efforts to understand this process, detailed gas-surface interaction mechanisms arestill lacking (e.g., Ohwada, 1996). Consequently, a priori prediction of rarefied flow in simplegeometries continues to be an open question.
In the absence of detailed gas-surface interaction models, theoretical predictions for stress andheat transfer usually can be brought into agreement with experimental observations by usingempirical parameters called accommodation coefficients. The most widely used parameter forheat transfer is the thermal accommodation coefficient, α, which is defined by
(2)
where Ein is the incident energy flux, Ere is the reflected energy flux, and Ew is the energy flux thatwould be achieved if the reflected molecules were emitted in thermal equilibrium at the surfacetemperature (Schaaf and Chambre, 1958; Springer, 1971). The thermal accommodationcoefficient varies between unity (complete accommodation, diffuse reflection) and zero(adiabatic, specular reflection). The simple partition of gas-surface collisions into a diffuse, fullyaccommodated fraction and a specular fraction is often referred to as the Maxwell wall model, aconvention which is followed in this work. Note that Equation (2) represents an average over afinite area of surface and a very large number of gas-surface collisions. Also, no attempt is madeto distinguish among the possibly different accommodations for the various molecular degrees offreedom. Thus, the net flux of translational energy is lumped together with that of rotational andvibrational energy, if present. Experimental data related to the separate contributions to theaccommodation coefficient of the different energy modes are virtually nonexistent.
Previous experimental studies have measured the thermal accommodation coefficient in a varietyof geometries and over a wide range of gas-surface combinations. Springer (1971) presents sometypical values while an extensive review is available in Saxena and Joshi (1989). The data showthat accommodation strongly depends on the composition and temperature of the gas and surface,on gas pressure, and on the state of the surface (roughness, contaminant adsorption, gasadsorption). Experimental values reported for the thermal accommodation coefficient range from0.01 to nearly unity, depending on the gas-surface combination and the level of contaminant gaslayers adsorbed on the surface. The smaller values tend to be observed for light gases strikingsurfaces composed of higher-atomic-weight molecules (e.g., helium striking a clean tungstensurface); near unity values tend to be observed for heavy gases striking lower- or similar-molecular weight or contaminated surfaces (e.g., on tungsten). Qualitative theoretical argumentspredict that thermal accommodation tends to increase with increasing gas molecular weight andwith roughness for a given surface. A key limitation of the existing data base, however, is the lackof accommodation data for surfaces encountered in present-day MEMS devices.
αEin Ere–
Ein Ew–----------------------=
11

2. Theory
2.1. Overview
In this study, the gas-surface thermal accommodation coefficient is inferred from experimentalmeasurements of the pressure dependence of gas heat flux between two parallel plates of unequaltemperature. The gas-phase conduction of heat between infinite parallel plates is often referred toas the Fourier problem and has received considerable theoretical treatment in the literaturebecause of its geometric simplicity. The following chapter reviews this theoretical literature with aparticular emphasis on those results which are of use in interpreting the experimental results thatwill be presented later (for more details, see Rader et al., 2004).
2.2. Fourier Geometry
The classic Fourier geometry is defined by a quiescent gas occupying the region between twoinfinite, parallel plates of unequal temperature. A schematic diagram of this geometry is shown inFigure 1. The two plates are separated by a gap, L, and the coordinate system is defined such that
corresponds to the surface of the bottom plate. The temperature of the top plate, Th, isassumed (without loss of generality) to be higher than that of the lower plate, Tc. In theexperiments, these two temperatures do not differ by much, so the assumption istypically satisfied. Because of the imposed temperature difference, heat is conducted through thegas from the hot plate to the cold plate. The theoretical analyses assume that the gas is quiescent(no mass flow); consequently, the gas-phase heat transfer between the plates is dominated byconduction, and convection is neglected. Radiation is not treated theoretically in this chapter but isconsidered in the experimental analysis.
COLD PLATE, Tc
HOT PLATE, Th
z
Heat Flux, q
Figure 1. Schematic diagram of the Fourier heat conduction geometry.
z = L
z = 0
z 0=
T h T c– T c«
12

2.3. Surface Accommodation Model
A Maxwell (1890) wall model is considered in this study. In the Maxwell model, a fraction, , ofmolecules is reflected diffusely with complete thermal accommodation, while the remainingfraction of molecules, , is assumed to be reflected specularly. Molecules undergoing adiffuse reflection possess a half-range Maxwellian molecular velocity distribution in equilibriumwith the wall temperature. For a specular reflection, the tangential velocity of a molecule is leftunchanged while the normal velocity changes sign but not magnitude. A purely diffuse surfacewould be characterized by , a purely specular surface would have , while in thegeneral case the surface accommodation coefficient would lie somewhere in between, .
As discussed in Chapter 1, the Maxwell wall model is undoubtedly overly simplistic, but it is infact this simplicity that has made this model so popular for correlating experimental observations.In general, each wall would be expected to be characterized by a separate accommodationcoefficient. Thus, would be associated with the hot wall, and with the cold wall. Inpractice, however, the experiments presented below are performed with the careful intent tomaintain the materials and surface finishes of the two plates as similar as possible. In this case, theassumption is made that there is only one accommodation coefficient, .
2.4. Gas-Phase Heat Conduction
In the free molecular limit (λ >> L) molecules travel back and forth between the plates withoutcolliding with each other; in this case the heat transfer between the plates can be described from amolecular point of view. In the free molecular limit, the space between the walls is characterizedby two streams of non-collisional molecules, with higher-energy molecules streaming downwardfrom the hot plate and lower-energy molecules streaming upward from the cold plate. For astationary gas with ζ internal degrees of freedom, Bird (1994, p. 84) has shown that the total heatflux to a surface is increased by a factor of (1 + ζ/4) compared to the translational heat flux. Thus,Bird’s (1994, p. 280) monatomic-gas result for the free molecular heat flux, , can be extendedto a polyatomic gas for the case of small temperature differences and equal wall accommodationcoefficients:
, (3)
where and the approximation has been used. The freemolecular heat flux is directly proportional to the gas pressure, P; in the limit of vanishingpressure, the heat flux approaches zero, as it must in a vacuum. No gradients in macroscopic gasproperties are observed in the free molecular limit: the temperature is constant across the domainwith a value equal to the geometric mean of the two wall temperatures, .
In the continuum limit (λ << L), the energy equation is satisfied using the well-known Fourier heatconduction law. In this case, the continuum heat flux, , is given by
α
1 α–
α 1= α 0=0 α 1≤ ≤
αh αc
α α h αc= =
qFM
qFM12--- Pc
T------
α2 α–------------
1 ζ4---+
T h T c–( ) ,–=αh αc α= =
T h T c– T c«
T T h1 2/ T c
1 2/= T h1 2/ T c
1 2/+ 2T 1 2/≈
T T h1 2/ T c
1 2/=
qC
13

, (4)
where K is the gas thermal conductivity which depends on temperature. Equation (4) appliesequally well for any gas (i.e., monatomic, diatomic) if the appropriate value of K is used. The one-dimensional nature of the Fourier geometry requires that the heat flux be constant across thedomain (independent of z). Note that the thermal conductivity is independent of pressure; hence,the heat flux is also independent of pressure as long as the flow lies in the continuum regime. Forsmall temperature variations, the thermal conductivity can be assumed to be constant, andEquation (4) can be integrated to obtain:
. (5)
The prediction of the heat flux in the transition regime that lies between the free molecular andcontinuum limits is challenging, ultimately requiring a complete solution of the Boltzmannequation. Although many theoretical analyses are available in the literature (for a review, seeSpringer, 1971), few result in closed-form expressions for the heat flux. One exception is theanalysis of Liu and Lees (1961), who used a four-moment solution of the linearized Boltzmannequation for a monatomic gas to derive an approximate, closed-form expression for the heat flux.Springer (1971) extended Liu and Lees’ analysis to polyatomic gases and presented the followingexpression for the heat flux, q, which is intended to apply over the entire pressure range:
, (6)
where . Springer (1971) has shown that Equation (6) agrees reasonably wellwith the limited available experimental data for monatomic and diatomic gases over a wide rangeof conditions. Independently, Sherman (1963) suggested a simple interpolation formula for heatflux that has the same form as Equation (6), except that he allowed the continuum and freemolecular heat fluxes to be calculated from their complete (not linearized) expressions. Forconvenience, Equation (6) is referred to as the “Sherman-Lees” interpolation formula for heatflux.
For analysis of the experimental data to be presented later, it is convenient to rewrite Equation (6)in the following form:
. (7)
qC K T( )dTdz-------–=
qC KT h T c–
L------------------
,–= T h T c– T c«
qqC------ 1
1qC
qFM----------+
--------------------1
1 2KT
Lα
2 α–------------
1 ζ4---+
cP
------------------------------------------------+---------------------------------------------------------,= = αh αc α= =
T h T c– T c«
c 8kBT πm⁄( )1 2/=
1q--- 1
qC------
1qC------ 2KT
Lα
2 α–------------
1 ζ4---+
c
------------------------------------------- 1P---⋅ ⋅+=
14

3. Experimental Apparatus and Procedure
3.1. Overview
This chapter provides a brief description of the design and operation of the vacuum test chamberand diagnostics used in the present study (see Rader et al., 2004). The vacuum test chamber wasdesigned to accommodate all of the control systems and diagnostics needed to provide heat-fluxmeasurements between two parallel, 14.25-cm-diameter plates. Heat flux between the plates isinferred from temperature-drop measurements between precision thermistors embedded near theexposed surface of each plate and those immersed in an adjacent water plenum. To provide a highdegree of accuracy, state-of-the-art components were selected for controlling system pressure,flow rate, plate alignment, plate temperatures, plate positions, system pressure, and systemtemperature.
3.2. Vacuum Test Chamber and Environmental Control Systems
A schematic of the vacuum test chamber design is shown in cross section in Figure 2. The testchamber is a 41-cm-diameter sphere with six 33.66-cm (13.25-in) OD standard conflat flangeswelded as shown. The opposing upper and lower flanges were used to mount the upper and lowerplate assemblies. An observation window (optical-quality quartz) occupies the flange extendingout of the plane in Figure 2. A photograph of the test chamber and associated support systems isshown in Figure 3.
Stable control and accurate measurement of gas conditions in the test chamber are essentialprerequisites for making the measurements desired in this project. Pressure measurements aremade using five state-of-the-art, MKS 690A high-accuracy Baratron pressure transducers (0.05%of full scale). Chamber pressure is actively controlled by comparing the Baratron-measuredpressure with an operator-selected pressure set-point; an MKS 244E pressure/flow controllermaintains the desired pressure by regulating the flow into the chamber through an automatedMKS 245 proportioning control valve. Tests show that the flow controller provides exceptionallystable chamber pressures; for example, the system can maintain a pressure of 30.00 ± 0.01 mTorrover long periods of operation. Thus, the pressure-measurement and flow-regulation subsystemsprovide extremely accurate and precise control.
3.3. Plate Assemblies
Significant care was given to the design of the assemblies which hold the test plates (whoseworking surfaces are in contact with the gas and determine the gas/surface interface). The plateassemblies were designed to meet several aggressive requirements: 1) maintain a constanttemperature across the test plate, 2) precisely position each plate surface independently,3) maintain parallel alignment between the two plates, 4) provide thermistor access for heat-fluxmeasurements, and 5) allow for ~1-day interchange of plates.
15

Figure 2. Schematic diagram of the test chamber.
Intermediate
Lower PlateAssembly
Test
E-GunChamber
Upper PlateAssembly
Chamber
Chamber
DiagnosticPlate
WaterPlenums
Figure 3. Front view of assembled test chamber (observation window in foreground).
16
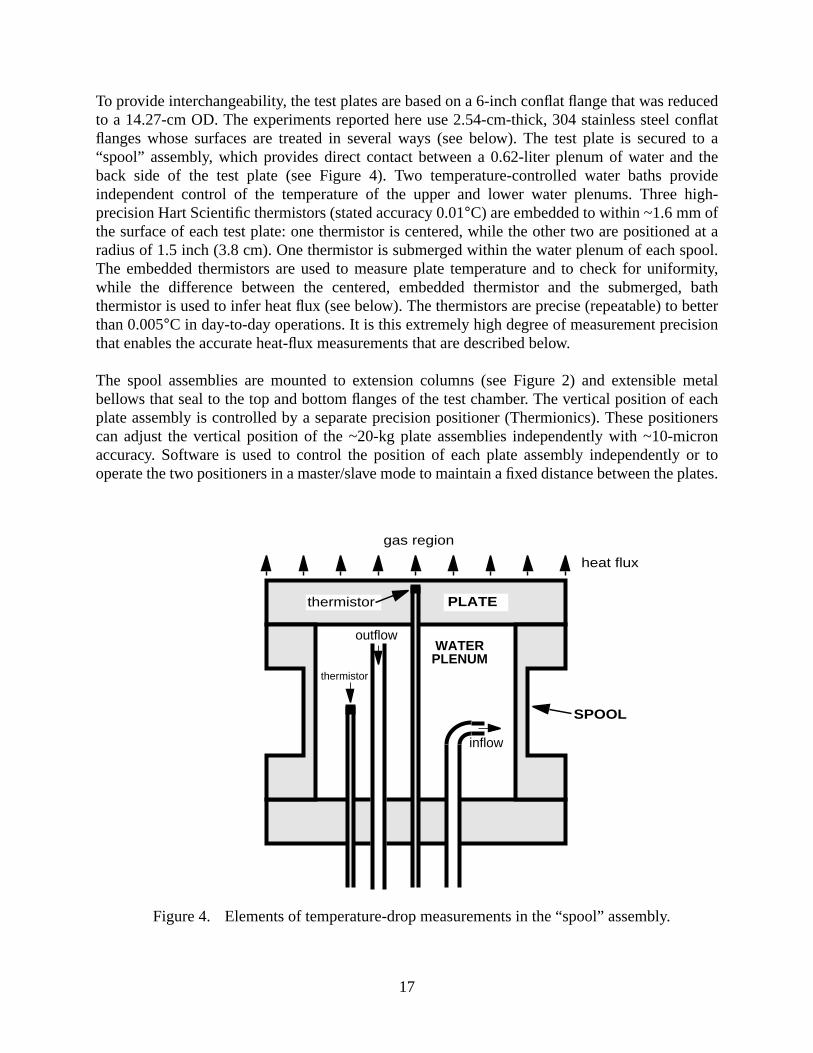
To provide interchangeability, the test plates are based on a 6-inch conflat flange that was reducedto a 14.27-cm OD. The experiments reported here use 2.54-cm-thick, 304 stainless steel conflatflanges whose surfaces are treated in several ways (see below). The test plate is secured to a“spool” assembly, which provides direct contact between a 0.62-liter plenum of water and theback side of the test plate (see Figure 4). Two temperature-controlled water baths provideindependent control of the temperature of the upper and lower water plenums. Three high-precision Hart Scientific thermistors (stated accuracy 0.01°C) are embedded to within ~1.6 mm ofthe surface of each test plate: one thermistor is centered, while the other two are positioned at aradius of 1.5 inch (3.8 cm). One thermistor is submerged within the water plenum of each spool.The embedded thermistors are used to measure plate temperature and to check for uniformity,while the difference between the centered, embedded thermistor and the submerged, baththermistor is used to infer heat flux (see below). The thermistors are precise (repeatable) to betterthan 0.005°C in day-to-day operations. It is this extremely high degree of measurement precisionthat enables the accurate heat-flux measurements that are described below.
The spool assemblies are mounted to extension columns (see Figure 2) and extensible metalbellows that seal to the top and bottom flanges of the test chamber. The vertical position of eachplate assembly is controlled by a separate precision positioner (Thermionics). These positionerscan adjust the vertical position of the ~20-kg plate assemblies independently with ~10-micronaccuracy. Software is used to control the position of each plate assembly independently or tooperate the two positioners in a master/slave mode to maintain a fixed distance between the plates.
Figure 4. Elements of temperature-drop measurements in the “spool” assembly.
inflow
outflowWATER
thermistor
thermistor
PLENUM
heat flux
gas region
SPOOL
PLATE
17

3.4. Test-Plate Surface Preparations
All of the surfaces tested to date are based on a 2.54-cm-thick, 304 stainless steel conflat flange.In previous work (Rader et al., 2004), two plates were prepared with a standard machined (lathed)surface with an RMS roughness of ~2 µm. These plates were installed in the test chamber, andtheir thermal accommodation coefficient was inferred from heat-flux measurements as describedbelow. For this investigation, four additional 304 stainless steel plates were prepared with thesame standard machined surface. Two of these plates were subsequently polished at the Sandiashops to achieve a mirror finish characterized by an RMS roughness of ~20 nm — a hundred-foldreduction in surface roughness. Measurements of the thermal-accommodation coefficient of thesetwo polished plates are presented below. The final two plates were shipped to the University ofTexas at Dallas (UTD) to be coated with carbon nanotubes. An example of the fractal-likemorphology that can be achieved with a carbon-nanotube coating is shown in Figure 5(microphotograph courtesy of L. Overzet, UTD). These plates have not yet been coated due to thedifficulty in uniformly coating such a large area. It is expected that the remaining challenges willbe overcome and carbon-nanotube-coated plates returned for testing in the fall of 2005.
Figure 5. Carbon-nanotube coating (image courtesy of Prof. L. Overzet, UTD).
NANOTUBE COATING
SUBSTRATE
18

3.5. Heat-Flux Measurements
Temperature-difference measurements are used to infer the axial heat flux between the two testplates (Rader et al., 2004). For this purpose, the temperature difference of interest is between acentral thermistor embedded just beneath the test-plate working surface and another immersed inthe adjacent water plenum (see Figure 4). This is a challenging measurement strategy, as the heatflux through a low-pressure gas is known to be extremely small. The measurement is furthercomplicated by the fact that the thermal conductivities of solids and liquids are very largecompared to those of gases. Consequently, the temperature differences across the water plenumand stainless steel plate are found to be extremely small but measurable given the high precisionof the Hart thermistors (Rader et al., 2004).
As an example, Figure 6 shows measured temperature (top) and temperature-difference (bottom)histories for nitrogen coupled with the machined 304 stainless steel plates. The test was conductedwith an inter-plate gap of 5 mm and bath temperatures of 15°C and 35°C (approximatelysymmetric about room temperature). Thermistor readings were recorded with the chamber heldnear vacuum (left side of the plots) and at pressures between 1 and 6700 mTorr (series of stepsmoving to the right side of the plots). Histories are shown only for the hot (top) plate. Only thetemperatures recorded by the center embedded and the immersed thermistors are shown in Figure6 (top).
The accurate determination of heat flux based on temperature measurements assumes that thetemperature difference between the embedded and immersed thermistors is linearly proportionalto the axial heat flux. Taking advantage of symmetry, the difference between the temperatures ofthe central embedded thermistor, , and the immersed thermistor, , is considered.Temperature-difference histories for the data are presented in Figure 6 (bottom), where themagnitude of the differences is . One immediate observation is that the pressuresteps are now much more clearly identifiable than in Figure 6 (top). This improvement in signal isa result of the difference operation, which removes intermediate- and long-term drifts in theliquid-plenum temperature. Although these drifts are reasonably small (~0.05°C over 5 hours),they act to conceal the true trend of the temperature differences. For constant conditions (e.g.,fixed pressure, gap, plate temperatures), averaging the temperature difference over time (30-60minutes) significantly improves the signal-to-noise ratio of the measurements. Using timeaveraging, the current apparatus can resolve temperature-difference steps as small as ~0.001°C.For example, when pressure is changed from 1 to 3 mTorr, the measured temperature differenceincreases by 0.009°C, about one order of magnitude larger than the minimum resolution (seeFigure 6). Clearly, very small changes in heat flux can be resolved with the current system.
The next step in determining gas-phase conduction is to subtract parasitic heat losses which arealways present in the system but can be observed in isolation at vacuum. In the absence of gas,any heat flux through the test plates must result from either radiation or solid conduction. For thepresent apparatus, it is believed that the majority of the parasitic loss results from radiation. Thus,in the following discussion, parasitic losses observed under vacuum are attributed to radiation.Radiation heat losses are clearly evident in Figure 6 for the 0 mTorr cases; for the top plate, this
T center T im
T center T im–
19

0 5000 10000 15000 20000Time (seconds)
34.8
34.9
35.0
35.1
35.2
Tem
per
atu
re (
oC
)
Immersed Thermistor
Figure 6. Temperature (top) and temperature-difference (bottom) histories forthe hot plate (nitrogen, machined 304 stainless steel, 5-mm gap).
0 mTorr 1 310
30
100
300
0 5000 10000 15000 20000Time (seconds)
0.00
0.05
0.10
0.15
0.20
0.25
| Tem
per
atu
re D
iffe
ren
ce |
(oC
)
0 mTorr 13
10
30
100
300
987 mTorr
3.3 Torr
6.7 Torr
RADIATION, ∆Trad
GAS CONDUCTION, ∆Tgas
L = 5 mm, 15.1oC and 35.1oCHot Plate304 SS (machined) & Nitrogen
Center Thermistor
L = 5 mm, 15.1oC and 35.1oCHot Plate304 SS (machined) & Nitrogen
6.7 Torr987
20

heat-loss contribution is labeled “RADIATION” in the figure and gives a temperature differenceof C. The temperature-difference contribution from gas-phase conduction,
, is determined by subtracting the temperature difference observed under vacuum, ,from the total temperature difference:
. (8)
Although the radiation contribution is much smaller than gas-phase conduction at higherpressures, at pressures below a few mTorr radiation dominates.
The final step in determining heat flux from temperature-difference measurements is to establish acalibration point. One possibility is suggested by the high-pressure data of Figure 6, which clearlyshow that the measured temperature difference plateaus for pressures above ~5 Torr. Theexplanation for this behavior is that the continuum limit has been achieved, for which gas-phaseheat conduction becomes independent of pressure. The continuum heat flux, qC, can be accuratelycalculated using Equation (4), the plate separation, and gas properties (see Chapter 2). Heat flux atarbitrary pressures can be determined by a simple scaling:
, (9)
where
. (10)
Given that is proportional to heat flux, , it is possible to rewrite Equation (7) in a formthat is convenient for data analysis:
. (11)
Equation (11) is not rigorous, being based on two assumptions: 1) that the Sherman-Leesinterpolation formula correctly describes the pressure-dependence of gas heat flux, and 2) that themeasured temperature differences are linearly related to the axial heat flux. Nevertheless,Equation (11) is proposed as a means of correlating the experimental measurements of as afunction of pressure. The form of Equation (11) suggests that a plot of against inversepressure, , should be linear. A graphical interpretation of such a plot is that the y-axisintercept equals the reciprocal of the continuum-limit temperature difference, , and the slopeis a function of known quantities and the accommodation coefficient. Thus, regression of datasuch as are shown in Figure 6 can be used to determine a best-fit value for the slope from whichthe accommodation coefficient is extracted. For more details, see Rader et al. (2004).
∆T rad 0.026°=∆T gas ∆T rad
∆T gas ∆T ∆T rad–=
qqC------
∆T gas
∆T C--------------=
∆T C ∆T gas( )P ∞→lim ∆T ∆T rad–( )
P ∞→lim= =
∆T gas q
1∆T gas-------------- 1
∆T C-----------
1∆T C----------- 2KT
Lα
2 α–------------
1 ζ4---+
c
------------------------------------------- 1P---⋅ ⋅+=
∆T gas1 ∆T gas⁄
1 P⁄∆T C
21

4. Experimental Results
4.1. Overview
This chapter presents data from tests of machined and highly-polished 304 stainless steel incontact with helium, argon, and nitrogen. Thermal accommodation coefficients are determinedfrom the pressure dependence of the heat flux (inferred from the temperature drop between thebath-immersed and plate-embedded thermistors) as described in the previous chapter.
4.2. Accommodation of Gases with Machined 304 Stainless Steel
Measurements of as a function of pressure are made for machined 304 stainless steel platesin contact with helium, argon, and nitrogen (see also Rader et al., 2004). Two plates wereprepared with a standard machined (lathed) surface, and both had a measured RMS roughness of~2 µm. For each gas-plate combination, several tests are performed using different combinationsof plate separation and hot and cold plate temperatures. The data have been analyzed in themanner described in Chapter 3 and plotted in the form suggested by Equation (11). For example,the raw data for nitrogen shown in Figure 6 (5-mm gap, and ) arereplotted in Figure 7 for the pressure range mTorr ( Pa). Data forboth the cold (bottom) and hot (top) plates are shown. The linear nature of the data when plottedin this fashion is clearly evident. Linear regressions to the data from each plate give correlationcoefficients near unity, : the reciprocal of the intercept and the slope are given inTable 1. The reciprocal of the regression intercepts give continuum-limit temperature differencesof and 0.1895 °C for the cold and hot plates, respectively. Inspection of the top-plate temperature histories plotted in Figure 6 reveals that the 6.7-Torr measurement has reached99% of the continuum limit.
The regression slopes can be used to determine the thermal accommodation coefficient accordingto Equation (11). The resulting values for the cold and hot plate, and 0.795,respectively, are in excellent agreement. This is a satisfying result, as the heat flux between thetwo plates should be exactly equal in the ideal one-dimensional situation where parasitic heatlosses and nonlinearities can be neglected. The determination of thermal accommodation forgas/surface interactions is the goal of this experiment. The results reported here are consistentwith a Maxwell wall model in which 80% of nitrogen molecules undergo a diffuse, thermally-accommodated reflection, while the remainder undergo a specular reflection. Moreover, the goodagreement between data and regression in Figure 7 suggest that the Sherman-Lees interpolationfunction works exceptionally well in the near-continuum regime.
Similar tests are repeated with the machined 304 stainless steel plates with argon and helium. Theconditions used for the argon tests are: 10-mm gap, and . Theconditions used for the helium tests are: 10-mm gap, and . The datafrom these two tests are analyzed in the manner described above and plotted in the pressure ranges
∆T gas
T c 15.1°C= T h 35.1°C=30 P 6700< < 4.0 P 893.3< <
r2 0.99999=
∆T C 0.2152=
α 0.808=
T c 5.2°C= T h 45.0°C=T c 20.2°C= T h 30.1°C=
22

mTorr ( Pa) for argon and mTorr( Pa) for helium. The results are plotted in Figure 8 for the both the cold andhot plates. As before, the linear nature of the data when plotted in this fashion is clearly evident,with correlation coefficients near unity. The reciprocals of the intercepts and the slopes are givenin Table 1. The accommodation coefficients calculated for argon for the cold and hot plates,
and 0.866, respectively, are in good agreement. The accommodation coefficientscalculated for helium for the cold and hot plates, and 0.360, respectively, are also ingood agreement.
Based on these and additional tests, the best accommodation coefficients for helium, nitrogen, andargon in contact with machined 304 stainless steel is determined to be , 0.80, and 0.87,respectively, with an estimated uncertainty of for each value. As suggested by qualitativephysical arguments, the accommodation coefficient increases with increasing gas molecularweight. For helium, only about one third of the wall collisions transfer heat, while for the heaviergases the fraction is closer to unity.
Figure 7. Plot of inverse ∆Tgas vs. inverse pressure in the temperature-jump regime(nitrogen, Tc = 15.1°C, Th = 35.1°C, machined 304 stainless steel, 5-mm gap).
Hot PlateCold Plate
α = 0.795
15.1oC & 35.1oCL = 5 mm
α = 0.808
Fit with
Fit with
Experimental Data
1/P (Pa-1)
| 1/∆
Tg
as |
(K-1
)304 SS (machined) & Nitrogen
0.00 0.02 0.04 0.06 0.083.0
4.0
5.0
6.0
7.0
8.0
50 P 10000< < 6.7 P 1333.2< < 200 P 10000< <26.7 P 1333.2< <
α 0.875=α 0.363=
α 0.36=0.02±
23

Figure 8. Plot of inverse ∆Tgas vs. inverse pressure in the temperature-jump regime forhelium (top) and argon (bottom).
Hot PlateCold Plate
α = 0.8665.2oC & 45.0oC
L = 10 mm
α = 0.875
Fit with
Fit with
Experimental Data
1/P (Pa-1)
| 1/∆
Tg
as |
(K-1
)
304 SS (machined) & Argon
0.00 0.02 0.04 0.06 0.085.0
6.0
7.0
8.0
9.0
10.0
Hot PlateCold Plate
α = 0.36020.2oC & 30.1oC
L = 10 mm
α = 0.363
Fit with
Fit with
Experimental Data
0 0.01 0.02 0.03 0.041/P (Pa-1)
3.0
4.0
5.0
6.0
7.0
8.0
| 1/∆
Tg
as |
(K-1
)304 SS (machined) & Helium
24

4.3. Accommodation of Gases with Polished 304 Stainless Steel
Measurements of as a function of pressure are presented for polished 304 stainless steelplates in contact with helium, argon, and nitrogen. The plates were essentially identical to theplates described in the previous section but are hand polished to obtain a mirror finish (measuredsurface roughness, ~20 nm). Polished plates tests are performed under the same conditions (platetemperatures and separation) as in the previous section with the same three gases: helium, argon,and nitrogen. As before, inverse temperature difference is plotted against inverse pressure, and thethermal accommodation coefficient is determined from the slope of the line. For comparison, thecold-plate results from both the machined- and polished-plate tests are shown below (hot-plateresults are comparable). The best-fit slopes and intercepts are given in Table 1.
The results for argon and nitrogen are shown Figure 9. For both gases, the machined and polishedcurves are substantially parallel, which implies that the accommodation coefficients are similar.The accommodation coefficients for argon in contact with the machined and polished plates arefound to be and 0.875, respectively. The accommodation coefficients for nitrogen incontact with the machined and polished plates are found to be and 0.800, respectively.For each gas, the machined- and polished-plate accommodation coefficients agree withinexperimental uncertainty, . Thus, for argon and nitrogen, the effect of surface roughness onaccommodation is smaller than can be detected in this experiment. This result is surprisingconsidering the factor of 100 difference in surface roughness between the two surfaces. Given thatthese two surfaces generally span the range of surfaces roughness that can be obtained usingconventional machining processes with 304 stainless steel, the preliminary conclusion drawn hereis that thermal accommodation coefficient for argon and nitrogen combined with 304 stainlesssteel are 0.87 and 0.80, respectively, independent of surface roughness. Clearly, additional testsare warranted to test this hypothesis. One interesting point to note is that both polished-plate testsexhibit a different x-axis-intercept than the machined-plate tests. Since the x-intercept is related tothe reciprocal of the continuum heat flux, which is independent of accommodation, this result isunexpected. Although the shift is small, ~6%, it suggests a systematic error in the measurements.Candidates include side-wall parasitic heat losses and uncertainties in the inter-plate separationarising from chamber flexure under vacuum; both of these issues are being addressed in plannedupgrades to the experimental chamber.
The results for helium in contact with the machined and polished plates are shown separately inFigure 10. These results are qualitatively distinct from the argon and nitrogen data in two regards.First, the x-intercept of the two curves are found to be in very good agreement, suggesting that theheat fluxes in these two tests approach the same continuum limit. Unlike the nitrogen and argonresults, however, the slopes for the two helium experiments are clearly distinguishable, implyingdistinct accommodation coefficients for the two different surfaces. Calculation of accommodationcoefficients from the slopes gives values for the machined and polished plates of and0.409, respectively. Thus, although the observed difference is only slightly larger thanexperimental uncertainties, it appears that there is a small effect of surface roughness on thethermal accommodation of helium with 304 stainless steel. A good estimate for helium would be
with rough 304 stainless steel, and with polished 304 stainless steel.
∆T gas
α 0.865=α 0.808=
0.02±
α 0.363=
α 0.36= α 0.40=
25

Figure 9. Plot of inverse ∆Tgas vs. inverse pressure for machined and polished 304stainless steel. Top: argon, Tc = 5.2°C, Th = 45.0°C, 10-mm gap.Bottom: nitrogen, Tc = 15.1°C, Th = 35.1°C, 5-mm gap.
1/P (Pa-1)
| 1/∆
Tg
as| (
K-1
)5.2oC & 45.0oC
L = 10 mm
304 SS & ArgonCold Plate
0 0.02 0.04 0.06 0.085.0
6.0
7.0
8.0
9.0
10.0
α = 0.875
0.865
Machined
Polished
1/P (Pa-1)
| 1/∆
Tg
as| (
K-1
)
15.1oC & 35.1oCL = 5 mm
304 SS & NitrogenCold Plate
0.00 0.02 0.04 0.06 0.083.0
4.0
5.0
6.0
7.0
8.0
α=0.800
0.808
MachinedPolished
26

Figure 10. Plot of inverse ∆Tgas vs. inverse pressure for machined and polished 304stainless steel: helium, Tc = 20.2°C, Th = 30.1°C, 10-mm gap.
20.2oC & 30.1oCL = 10 mm
304 SS & HeliumCold Plate
0.01 0.02 0.03 0.041/P (Pa-1)
3.0
4.0
5.0
6.0
7.0
8.0
| 1/∆
Tg
as| (
K-1
)α = 0.363
0.409
Machined
Polished
0
27

4.4. Summary of Heat-Flux and Accommodation Measurements
Table 1. Summary of heat-flux and accommodation measurements
Gas, L, Tc/Th
Cold (bottom) Plate Hot (top) Plate
∆TC(K)
slope(Pa/K)
α ∆TC(K)
slope(Pa/K)
α
Helium, 10 mm,20.2/30.1°C,
machined 304 SS
0.3061 108.48 0.363 0.2838 118.32 0.360
Helium, 10 mm,20.2/30.1°C,
polished 304 SS
0.3056 93.55 0.409 0.2506 122.41 0.387
Argon, 10 mm,5.2/45.0°C,
machined 304 SS
0.1683 20.232 0.875 0.1319 26.266 0.866
Argon, 10 mm,5.2/45.0°C,
polished 304 SS
0.1582 21.95 0.865 0.1175 29.135 0.872
Nitrogen, 5 mm,15.1/35.1°C,
machined 304 SS
0.2152 29.700 0.808 0.1895 34.680 0.795
Nitrogen, 5 mm,15.1/35.1°C,
polished 304 SS
0.2025 32.195 0.800 0.1731 38.571 0.787
28

5. Conclusions
Heat transfer to surfaces immersed in noncontinuum (transitional or rarefied) gas flow continuesto be an active area of research. Gases exhibit noncontinuum effects when the characteristiclength scale of the system becomes comparable to the gas mean free path. Thus, these effectsbecome important either when the system length scale becomes small or when the gas pressurebecomes low. A priori prediction of noncontinuum, gas-phase heat flux requires a detaileddescription of the gas-surface interaction. Because of the physical complexity of the problem, themost effective approach to providing such descriptions is careful experimental investigations.This LDRD-funded study has provided preliminary experimental data related to the role ofsurface roughness on thermal accommodation for 304 stainless steel in contact with helium,argon, and nitrogen.
In this study, a previously-developed experimental facility has been used to determine thermalaccommodation coefficients from the pressure dependence of heat flux between two parallelplates. Heat flux between the plates is inferred from temperature-drop measurements. The use ofhigh-precision thermistors and the careful control of experimental conditions allow heat-fluxmeasurements to be made with great precision.
Thermal accommodation measurements of argon and nitrogen in contact with standard machined(lathed) or polished 304 stainless steel plates are indistinguishable within experimentaluncertainty. Thus, the accommodation coefficient of 304 stainless steel with nitrogen and argon isestimated to be 0.80 and 0.87 , respectively, independent of the surface roughnesswithin the range likely to be encountered in engineering practice. Measurements of theaccommodation of helium showed a slight variation with 304 stainless steel surface roughness:0.36 for a standard machine finish and 0.40 for a polished finish. Planned tests withcarbon-nanotube-coated plates will be performed when 304 stainless steel blanks have beensuccessfully coated.
0.02± 0.02±
0.02± 0.02±
29

References
Bird, G. A. (1994) Molecular Gas Dynamics and the Direct Simulation of Gas Flows, ClarendonPress, Oxford.
Karniadakis, G. E., and Beskok, A. (2002) Micro Flows: Fundamentals and Simulation, Springer-Verlag, New York.
Klebanoff, L. E., and Rader, D. J. (2000) “Protection of lithographic components from particlecontamination,” U.S. Patent #6,153,044, issued November 28.
Liu, C. Y., and Lees, L. (1961) “Kinetic theory description of plane compressible Couette flow,” inRarefied Gas Dynamics, L. Talbot, ed., Academic Press, New York, pp. 391-428.
Maxwell, J. C. (1890) The Scientific Papers of James Clark Maxwell, Vol. 2, CambridgeUniversity Press, London and New York.
Ohwada, T. (1996) “Heat flow and temperature and density distributions in a rarefied gas betweenparallel plates with different temperatures,” Physics of Fluids 8: 2153-2160.
Rader, D. J., Dedrick, D. E., Beyer, E. W., Leung, A. H., and Klebanoff, L. E. (2002) “Verificationstudies of thermophoretic protection for EUV masks,” in Emerging Lithographic TechnologiesVI, Roxanne L. Engelstad, ed., Proceedings of the SPIE 4688: 182-193.
Rader, D. J., Trott, W. M., Torczynski, J. R., Gallis, M. A., Castañeda, J. N., and Grasser, T. W.(2004) “Microscale Rarefied Gas Dynamics and Surface Interactions for EUVL and MEMSApplications,” Sandia National Laboratories report, SAND2004-5329, printed November.
Saxena, S. C., and Joshi, R. K. (1989) Thermal Accommodation and Adsorption Coefficients ofGases, Hemisphere Publishing Corporation, New York.
Schaaf, S. A., and Chambre, P. L. (1958) “Flow of rarefied gases,” in Fundamental ofGasdynamics, Vol. III, H. W. Emmons, ed., Princeton University Press, Princeton, pp. 687-739.
Sherman, F. S. (1963) “A survey of experimental results and methods for the transition regime ofrarefied gas dynamics,” in Rarefied Gas Dynamics, Vol. II, J. A. Lauermann, ed., AcademicPress, New York, pp. 228-260.
Springer, G. S. (1971) “Heat transfer in rarefied gases,” in Advances in Heat Transfer, T. F. Irvineand J. P. Hartnett, eds., Academic Press, New York, pp. 163-218.
30

Distribution
1 MS 0384 Org. 1500 A. C. Ratzel
1 MS 0825 Org. 1510 W. L. Hermina
1 MS 0834 Org. 1512 J. E. Johannes
1 MS 0834 Org. 1512 C. J. Bourdon
1 MS 0834 Org. 1512 J. N. Castañeda
1 MS 0834 Org. 1512 T. W. Grasser
1 MS 0834 Org. 1512 S. P. Kearney
1 MS 0834 Org. 1512 L. M. Phinney
5 MS 0834 Org. 1512 D. J. Rader
5 MS 0834 Org. 1512 W. M. Trott
1 MS 0826 Org. 1513 S. N. Kempka
3 MS 0826 Org. 1513 M. A. Gallis
1 MS 0826 Org. 1513 E. S. Piekos
3 MS 0826 Org. 1513 J. R. Torczynski
1 MS 0826 Org. 1513 C. C. Wong
1 MS 0834 Org. 1514 J. S. Lash
1 MS 0825 Org. 1515 B. Hassan
1 MS 0836 Org. 1516 E. S. Hertel
1 MS 0836 Org. 1517 R. O. Griffith
1 MS 0836 Org. 1517 R. J. Buss
1 MS 0123 Org. 1011 D. L. Chavez (LDRD Office)
1 MS 9018 Org. 8945-1 Central Technical Files
2 MS 0899 Org. 9616 Technical Library
31