Measurements of Signals from Muons Crossing the...
9
Angra Neutrino Project AngraNote 004-2007 Measurements of Signals from Muons Crossing the Hamamatsu R5912 PMT Enclosure Vertically and Horizontally W. Raposo, M. Vaz Centro Brasileiro de Pesquisas Fisicas - CBPF, Rio de Janeiro, Brazil L. Villasenor * Universidad Michoacana de San Nicolas de Hidalgo - UMSNH, Morelia, Mexico Abstract Any photo multiplier tube (PMT) operated in the presence of background cosmic ray muons can show multi-photo electron signals due to the interaction of these high energy (around 2 GeV) muons with its glass envelope. The Cherenkov light produced in the glass is converted to photo- electrons (PE) at the photo cathode with high quantum efficiency since the light is predominantly in the UV-blue visible range. This mechanism is common to all PMTs and the rate of these noise events increases with the PMT surface area. Knowledge of the PMT charge spectrum of this process will allow a subtraction of this background noise in the relevant situations or it can be used as the basis of a monitoring scheme to specifically monitor PMT gains uncoupled from the overall gain of the detector. We report on measurements of this effect for the Hamamatsu R5912 PMT. We have found that muons crossing the PMT vertically produce 40 PEs on average while muon crossing horizontally produce 29 PEs on average. In both cases the most probable values for the rise-times from 10% to 90% of these signals were around 12 ns. * Corresponding author, e-mail: [email protected]
Transcript of Measurements of Signals from Muons Crossing the...
Angra Neutrino Project AngraNote 004-2007
Measurements of Signals from Muons Crossing the HamamatsuR5912 PMT Enclosure Vertically and Horizontally
W. Raposo, M. VazCentro Brasileiro de Pesquisas Fisicas - CBPF, Rio de Janeiro, Brazil
L. Villasenor∗Universidad Michoacana de San Nicolas de Hidalgo - UMSNH, Morelia, Mexico
Abstract
Any photo multiplier tube (PMT) operated in the presence of background cosmic ray muonscan show multi-photo electron signals due to the interaction of these high energy (around 2 GeV)muons with its glass envelope. The Cherenkov light produced in the glass is converted to photo-electrons (PE) at the photo cathode with high quantum efficiency since the light is predominantlyin the UV-blue visible range.
This mechanism is common to all PMTs and the rate of these noise events increases with thePMT surface area. Knowledge of the PMT charge spectrum of this process will allow a subtractionof this background noise in the relevant situations or it can be used as the basis of a monitoringscheme to specifically monitor PMT gains uncoupled from the overall gain of the detector. Wereport on measurements of this effect for the Hamamatsu R5912 PMT. We have found that muonscrossing the PMT vertically produce 40 PEs on average while muon crossing horizontally produce29 PEs on average. In both cases the most probable values for the rise-times from 10% to 90% ofthese signals were around 12 ns.
∗Corresponding author, e-mail: [email protected]
AngraNote 004-2007 1
1 IntroductionNeutrino interactions in the Angra Experiment [1] will be detected by means of photo multipliertubes surrounding the active volume of the detector. Cosmic ray muons crossing the active volumeconstitute the main background to the relatively rare neutrino interactions. In addition to interactingwith the active volume, muons can also produce signals due to their interaction with the glass envelopeof the PMTs through Cherenkov and possibly transition radiation processes. It is therefore importantto have a good knowledge of the charge spectrum due to these effects. This knowledge will allow apossible subtraction of this background noise in the relevant situations or, at the same time, it can beused as the basis of a monitoring scheme of PMT gains. The PMT Hamamatsu R5912 [2] is amongthe candidate PMTs to be used for the Angra detector [1].
The background of single muons from the natural flux of secondary cosmic rays, arriving at arate of 1min−1cm−2 [3], was used to study the integrated charge and rise-time of the PMT signalsproduced by muons crossing the PMT near vertically and near horizontally. We use the resultreported elsewhere [4] on the measurement of the gain of the Hamamatsu PMT by using an LEDflasher to convert charge into number of PEs.
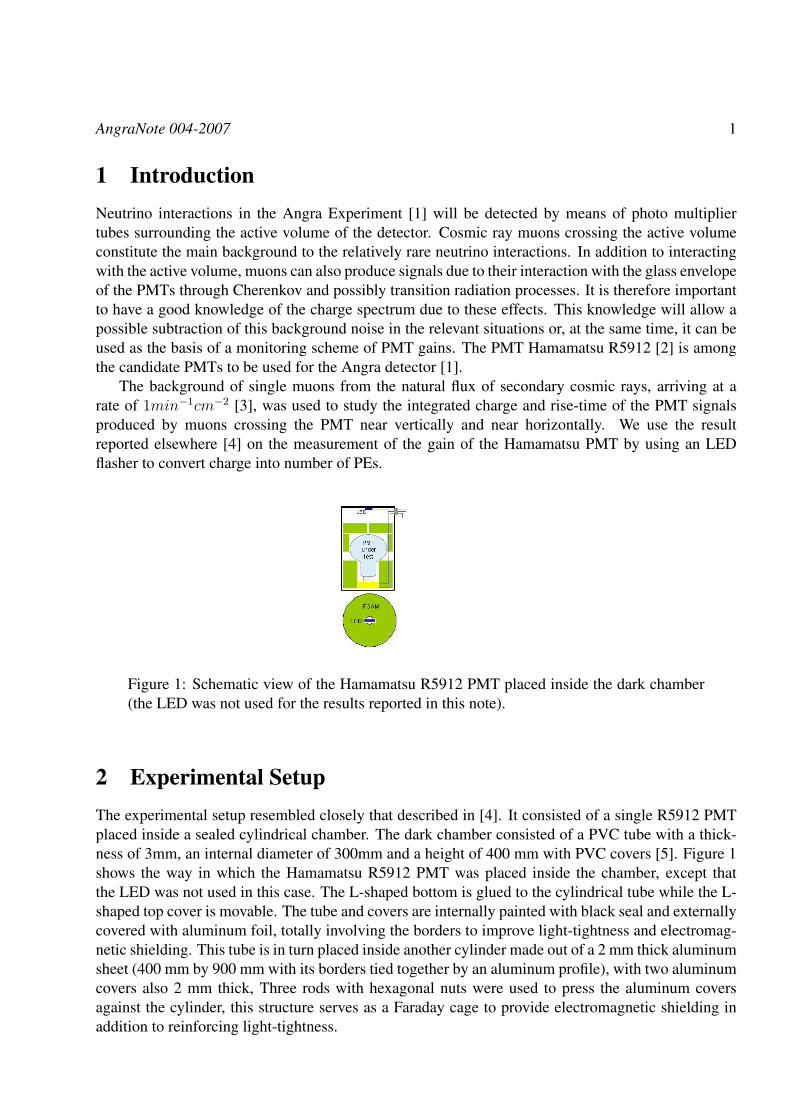
Figure 1: Schematic view of the Hamamatsu R5912 PMT placed inside the dark chamber(the LED was not used for the results reported in this note).
2 Experimental SetupThe experimental setup resembled closely that described in [4]. It consisted of a single R5912 PMTplaced inside a sealed cylindrical chamber. The dark chamber consisted of a PVC tube with a thick-ness of 3mm, an internal diameter of 300mm and a height of 400 mm with PVC covers [5]. Figure 1shows the way in which the Hamamatsu R5912 PMT was placed inside the chamber, except thatthe LED was not used in this case. The L-shaped bottom is glued to the cylindrical tube while the L-shaped top cover is movable. The tube and covers are internally painted with black seal and externallycovered with aluminum foil, totally involving the borders to improve light-tightness and electromag-netic shielding. This tube is in turn placed inside another cylinder made out of a 2 mm thick aluminumsheet (400 mm by 900 mm with its borders tied together by an aluminum profile), with two aluminumcovers also 2 mm thick, Three rods with hexagonal nuts were used to press the aluminum coversagainst the cylinder, this structure serves as a Faraday cage to provide electromagnetic shielding inaddition to reinforcing light-tightness.

AngraNote 004-2007 2
Figure 2: Photograph of the experimental setup showing the dark chamber in a horizontalposition with the scintillation paddle on top of it (upper left corner), the HV power supply,the digital oscilloscope (Tektronix TDS1012B) and the PC monitor.
The background of single muons from the natural flux of secondary cosmic rays, arriving at arate of 1min−1cm−2 [3], was used to study the PMT signals produced by muons crossing the PMTnear vertically and near horizontally. The trigger signal was obtained from a scintillation paddle (withactive scintillation area of 10 cm by 15 cm) placed on top of the dark chamber. Two different positionsof the chamber were used, one vertical and the other horizontal. Since muons are not vertical but havean angular distribution given approximately by cos2θ, the muon missed the R5912 PMT on manytriggered events for which the PMT trace was simply black current. Figure 2 shows a photographof the experimental setup for horizontal muons, it includes the dark chamber placed in horizontalposition with the PMT inside and the scintillation paddle on top (upper left corner), the HV powersupply, the digital oscilloscope and the PC. The oscilloscope used was a Tektronix TDS 1012B [6]connected to a PC through a USB port. The PMT traces of all triggered events were immediatelytransferred into the PC by means of a data acquisition program written in LabView [7].
Figure 3 shows a snapshot of the front panel of the LabView program used to measure off-linethe charge, amplitude and rise-times of the PMT traces previously recorded onto the PC’s hard disk,it displays a typical event corresponding to a muon crossing the PMT in a near vertical direction.The upper curve is the trace of the Hamamatsu R5912 PMT and the lower one its integrated charge.Likewise, Figure 4 displays the signal produced by a muon crossing the PMT in a near horizontaldirection.

AngraNote 004-2007 3
Figure 3: Typical event corresponding to a muon crossing the PMT in a near vertical di-rection. The upper curve is the trace of the Hamamatsu R5912 PMT and the lower one theintegrated charge. The horizontal scale of the oscilloscope was 10 ns/div. The amplitude ofthe R5912 PMT trace was 516 mV for this particular event.
3 Results and DiscussionAlthough the maximum data acquisition rate obtained with the USB oscilloscope and the LabView-based DAQ system was around 5 Hz, in this case the acquisition rate was limited by the flux of muons(about 1 min−1cm−2 [3]) and the size of the scintillation paddle (about 10 cm by 15 cm). The pulsetraces of thousands of events were recorded into the hard disk of a PC. The charge, amplitude and rise-time from 10% to 90% were subsequently measured off-line for every event by using another LabViewprogram. These parameters were analyzed and plotted using the ROOT program [8]. The results wepresent in this note correspond to a high voltage of 1500 V for the R5912 PMT, however, since weconvert the integrated charge to number of photoelectrons, these results are essentially independentof the HV (assuming we are in the linear region of the PMT).
Figure 5 shows the distribution of the integrated charge (expressed in number of photoelectrons)versus rise-time from 10% to 90% for the Hamamatsu R5912 PMT placed vertically below thescintillation paddle. The events clustered around zero charge correspond to the cases where themuons do not produce any signal either because they missed the PMT or because they crossed itthrough a passive region. Note that there is a clear gap between the region with zero charge and theregion around the most probable value for the charge. Figure 6 shows the distribution of integratedPMT charge expressed in PEs. The cut Q > 7pC was done to remove the peak at zero charge. Fromthis plot we see that the charge distribution of Cherenkov radiation produced by muons crossingthe PMT in a near vertical direction is asymmetrical, i.e., non Gaussian, with a mean value for the

AngraNote 004-2007 4
Figure 4: Typical event corresponding to a muon crossing the PMT in a near horizontaldirection. The upper curve is the trace of the Hamamatsu R5912 PMT and the lower onethe integrated charge. The amplitude of the PMT trace for this event was around 570 mV.The horizontal scale of the oscilloscope was 10 ns/div.
Risetime 10%-90% (ns)0 20 40 60 80 100
Ch
arg
e (P
E)
-20
0
20
40
60
80
100
120
140
160
180
p1/2.2:p3
Figure 5: Charge vs rise-time from 10% to 90% for muons crossing the Hamamatsu PMT in a near vertical direction. The integratedPMT charge is given in number of photoelectrons. As described in [4] the PMT gain was 2.2 pC per PE at 1500 V.
number of PEs of 40 and the most probable value of 35 PEs.

AngraNote 004-2007 5
htempEntries 6161
Mean 39.95
RMS 18.79
Charge (PE)0 20 40 60 80 100 120 140 160 180
dN
/dQ
0
100
200
300
400
500
htempEntries 6161
Mean 39.95
RMS 18.79
p1/2.2 {p1>7}
Figure 6: Charge distribution for muons crossing the Hamamatsu PMT in a near vertical direction. The integrated PMT charge isgiven in number of photoelectrons. The previously measured PMT gain was 2.2 pC per PE at 1500 V.
htempEntries 6161
Mean 18.3
RMS 10.24
Risetime 10%-90% (ns)0 10 20 30 40 50 60
dN
/dT
0
100
200
300
400
500
htempEntries 6161
Mean 18.3
RMS 10.24
p3 {p1>7}
Figure 7: Rise-time from 10% to 90% for muons crossing the Hamamatsu PMT in a near vertical direction.
Figure 7 shows the distribution of rise-time from 10% to 90% for muons crossing the HamamatsuPMT in a near vertical direction. As in Figure 6, the cut Q > 7pC was merely done to remove theevents where the muon missed the PMT or it did not produce any significant signal. The rise-timedistribution is very asymmetrical with a mean value of 18 ns and a most probable value of 12 ns.
Figure 8 shows the integrated charge distribution expressed in number of photoelectrons versusthe rise-time from 10% to 90% for the Hamamatsu R5912 PMT placed horizontally below thescintillation paddle. The events clustered around zero charge correspond to the cases where themuons that do not produce any signal either because they missed the PMT or because they crossed itthrough a passive region. Unlike the case where the muons cross the PMT vertically, in this case thereis no gap between the the line of zero charge and the region with significant values for the integrated

AngraNote 004-2007 6
Risetime 10%-90% (ns)0 20 40 60 80 100
Ch
arg
e (P
E)
-50
0
50
100
150
200
p1/2.2:p3
Figure 8: Distribution of integrated charge vs rise-time from 10% to 90% for muons crossing the Hamamatsu PMT in a nearhorizontal direction. Charge is given in number of photoelectrons. As described in [4] the PMT gain is 2.2 pC per PE at 1500 V.
htempEntries 7164
Mean 29.36
RMS 30
Charge (PE)0 20 40 60 80 100 120 140 160 180 200 220 240
dN
/dQ
0
100
200
300
400
500
600
700
800
900
htempEntries 7164
Mean 29.36
RMS 30
p1/2.2 {p1>3}
Figure 9: Distribution of the integrated charge for muons crossing the Hamamatsu PMT in a near horizontal direction. Charge isconverted to number of photoelectrons.
PMT charge. Figure 9 shows the distribution of integrated PMT charge expressed in PEs. The cutQ > 3pC was merely done to cut out part of the peak at zero charge in order to make more visible thestructure of the charge distribution. From this plot we see that the spectrum of Cherenkov radiationsignal produced by muons crossing the PMT in a near horizontal direction is clearly different fromthe case where the muons cross the PMT near vertically. In the horizontal case the most probablevalue for the integrated charge deposited by muons is near zero, with a second peak at 30 PEs and amean value of 29 PEs.
Figure 10 shows the distribution of rise-time from 10% to 90% for muons crossing the HamamatsuPMT in a near horizontal direction. As in Figure 9, the cut Q > 3pC was merely done to remove part

AngraNote 004-2007 7
of the peak at zero charge. The rise-time distribution is very asymmetrical with a mean value of 21 nsand a most probable value of 16 ns.
htempEntries 7164
Mean 21.16
RMS 16.19
Risetime 10%-90% (ns)0 20 40 60 80 100
dN
/dT
0
100
200
300
400
500
600
700
800
htempEntries 7164
Mean 21.16
RMS 16.19
p3 {p1>3}
Figure 10: Rise-time from 10 to 90% for muons crossing the Hamamatsu PMT in a near horizontal direction.
At this point it is convenient to point out that the most probable value for the rise-time from 10%to 90% for single photoelectrons for the same Hamamatsu R5912 PMT operated at the same 1500 Vwere measured, see [4], and presented a most probable value of around 10 ns.
4 ConclusionsWe have reported on measurements of the charge spectrum due to the interaction of cosmic ray muonswith the glass envelope of the Hamamatsu R5912 PMT. The quantitative knowledge of this effect isimportant for at least two reasons: it allows a subtraction of this background noise in the relevantsituations, and it can be used as the basis of a monitoring scheme to specifically monitor PMT gains.The mean number of PEs produced by vertically crossing muons was 40. The charge distributionobtained was Gaussian-like with long tails (more similar to a Landau distribution). The non-Gaussiandistribution measured for the rise-time from 10% to 90% showed a mean value of 18 ns, a mostprobable value of 12 ns and a long tail for higher values.
In the case of horizontal muons, the charge distribution consisted on two different distributionssuperimposed: a Gaussian-like centered around 33 PEs and an exponential-like one as shown inFigure 9. These different charge distributions might indicate two main physical processes to producethe signals. The mean number of PEs produced by horizontally crossing muons was 29, i.e., incontrast with 40 for vertical muons. The non-Gaussian distribution measured for the rise-time from10% to 90% showed a mean value of 21 ns with a most probable value of 12 ns.

AngraNote 004-2007 8
References[1] J. C. Anjos et al., Braz. J. Phys. vol.36 no.4a So Paulo Dec. 2006.
[2] http : //www.sales.hamamatsu.com/en/products/electron − tube −division/detectors/photomultiplier − tubes/part− r5912.php
[3] Review of Particle Physics, W.-M. Yao et al., Journal of Physics G 33, 1 (2006), http ://pdg.lbl.gov/
[4] W. Raposo, M. Vaz and L. Villasenor, Angra Technical Note no.3, Octubre 2007.
[5] Vaz, Mario - Class notes on Basic Instrumentation in High Energy Physics, CBPF, May 2007.
[6] See http : //www.tek.com/products/oscilloscopes/tds1000tds2000/index.html
[7] See http : //www.ni.com/labview/
[8] http : //root.cern.ch/