Measurements of Quality Differentiation
35
Measurements of Quality Differentiation Jari Huttunen Helsinki University of Technology Networking laboratory
Transcript of Measurements of Quality Differentiation

Measurements of Quality Differentiation
Jari HuttunenHelsinki University of Technology
Networking laboratory
Contents• Network prototype
– Topology and system configuration• Traffic generation
– Traffic generators and traffic tracing• Applications• Theory
– PHBs• Assured Forwarding• Expedited Forwarding
• Test cases– Best Effort (BE)– Expedited Forwarding (EF)– Assured Forwarding (AF)– EF + AF– AF: Bad provisioning
• Summary• Conclusions• Future work
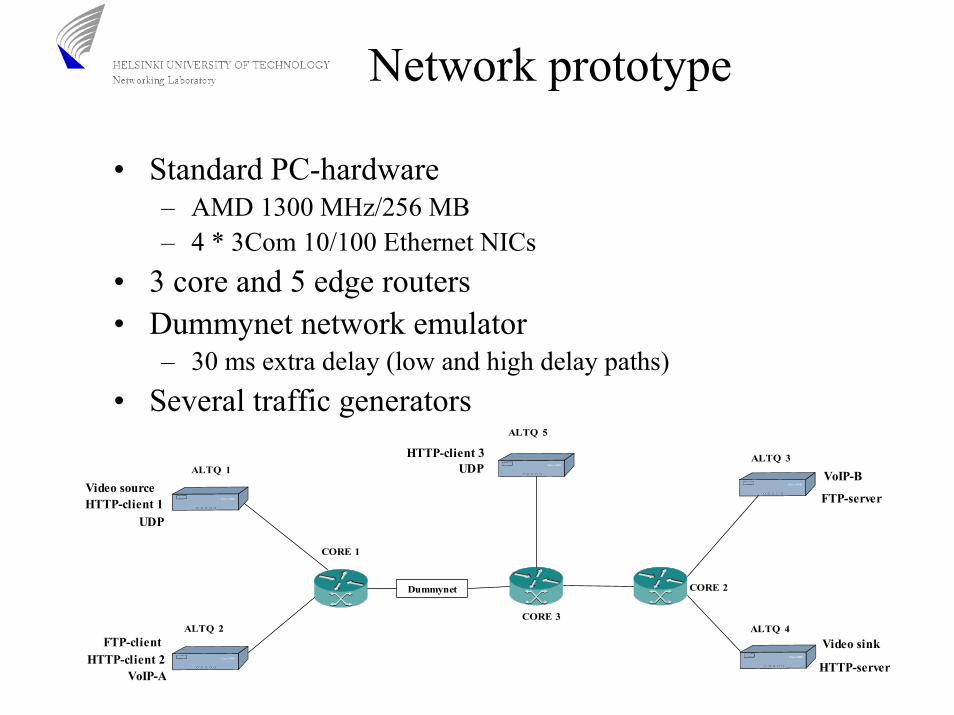
Network prototype
• Standard PC-hardware– AMD 1300 MHz/256 MB– 4 * 3Com 10/100 Ethernet NICs
• 3 core and 5 edge routers• Dummynet network emulator
– 30 ms extra delay (low and high delay paths)• Several traffic generators
ALTQ 1
ALTQ 2
CORE 1
Dummynet
ALTQ 3
ALTQ 4
CORE 2
ALTQ 5
CORE 3
VoIP-A
HTTP-client 1
HTTP-client 2
UDPHTTP-client 3
HTTP-server
FTP-client
Video source
Video sink
VoIP-B
FTP-server
UDP
System configuration
• FreeBSD OS with ALTQ-package– QoS mechanisms (queueing, scheduling, shaping, metering, marking)
• All NICs configured to 10Base-Tx full duplex• CBQ is used in traffic shaping
– WRR as a general scheduler• Static provisioning, no borrowing between classes
– Capacity differentation (a predefined amount of link capacity for each traffic class)
• Queue management: tail-drop, RED, RIO• Token Bucket (TB) and two rate Three Color Marker (TrTCM) used
for metering/marking (color blind)
Traffic generation
• Applications with different properties– Real time / non-real time– Bandwidth sensitive / delay sensitive– TCP / UDP based– Constant bitrate / varying bitrate– Long “friendly” TCP flows / short “aggressive” flows
• How to carry all this traffic in a single network and same time provide quality of service?
Traffic generation (cont.)
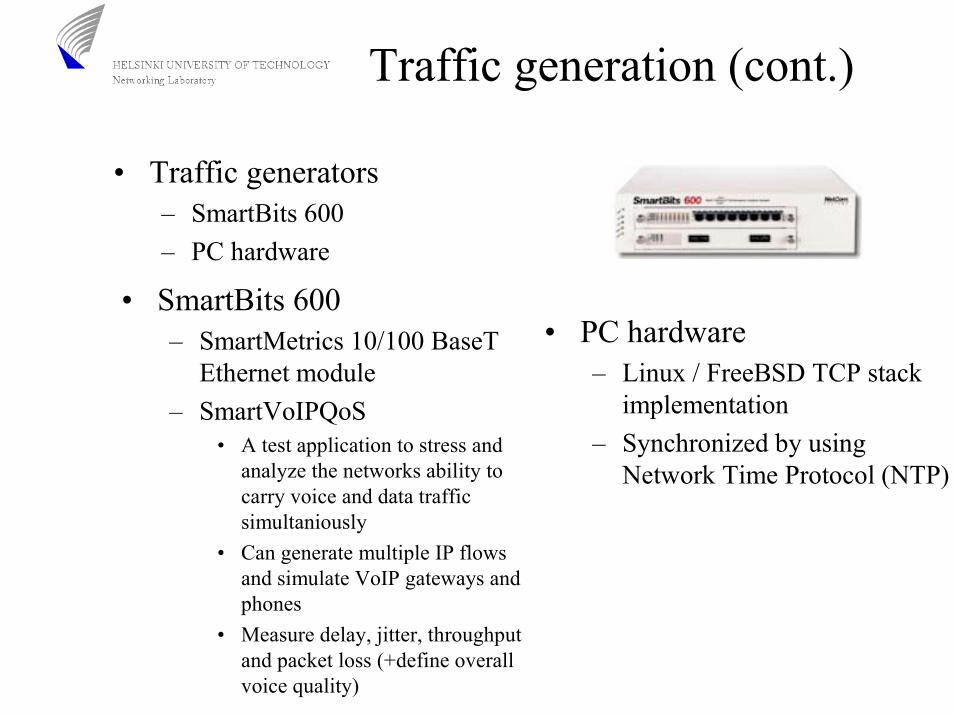
• Traffic generators– SmartBits 600– PC hardware
• SmartBits 600– SmartMetrics 10/100 BaseT
Ethernet module– SmartVoIPQoS
• A test application to stress and analyze the networks ability to carry voice and data traffic simultaniously
• Can generate multiple IP flows and simulate VoIP gateways and phones
• Measure delay, jitter, throughput and packet loss (+define overall voice quality)
• PC hardware– Linux / FreeBSD TCP stack
implementation– Synchronized by using
Network Time Protocol (NTP)
Traffic tracing
• SmartBits 600 can trace the traffic it sends and give aggregated results– Transmit flows → Collect data from cards → Display
results
• We perform also packet capturing using Tcpdump at client and server side– Analysis of TCP traffic
• RTT, throuhput etc.
– Packet captures are analyzed with Tcptrace tool (http://irg.cs.ohiou.edu/software/tcptrace/idex.html)
Applications• VoIP
– SmartBits 600 and SmartVoIPQoS software– G.711 µ-law voice coding with 20 ms framing
• Packets size of 218 Bytes
– We apply 20 flows per client, bi-directional• =40 VoIP flows
– Silence detection is not being modelled• Constant bitrate application
– Mapping to PSQM (Perceptual Speech Quality Measure) voice scoring system (0.4→6.5)
• Comparing measurement results to a matrix that includes mappings between PSQM scores and the effect of impairments (jitter, packet loss)
• Low PSQM value indicates of high voice quality• PSQM values are affected by:
– Frame loss– Jitter– Type of codec used
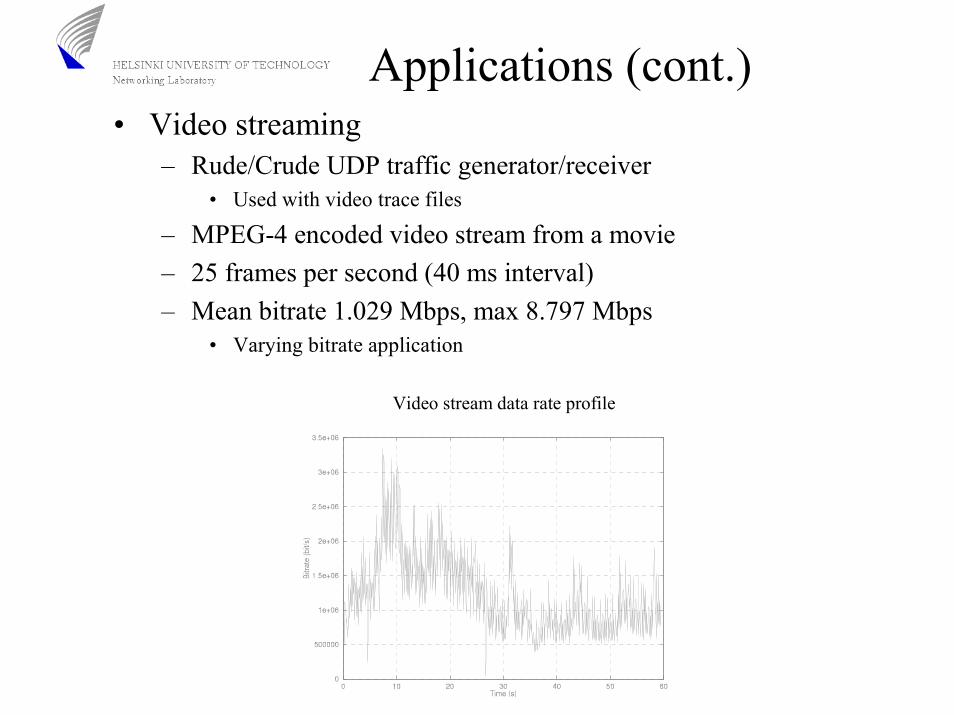
Applications (cont.)• Video streaming
– Rude/Crude UDP traffic generator/receiver• Used with video trace files
– MPEG-4 encoded video stream from a movie– 25 frames per second (40 ms interval)– Mean bitrate 1.029 Mbps, max 8.797 Mbps
• Varying bitrate application
Video stream data rate profile
Applications (cont.)• FTP
– Client-server transactions– A modified version of Markus Peuhkuri’s Kilent-Server application– Packets size of 1500 B (MTU)– 50 individual file transfers– File size modelled by geometric distribution (mean 500 kB)– Example of long lasting TCP connections
Applications (cont.)• HTTP
– Apache 2.0 www-server• Most popular web server in the Internet
– Siege is used at the client side• http testing and benchmarking utility• Simulates a predefined number of users• Reports of response times, amount of data transferred, etc.
– 2 clients with high delay paths and 1 client (client #3) with a low delay path
• Study the effect of dissimilar RTT
– HTTP 1.0– Simulating 165 users– Object size modelled by geometric ditsribution (mean 10 kB)– Reading time 12 s– Example of short, interactive TCP connections
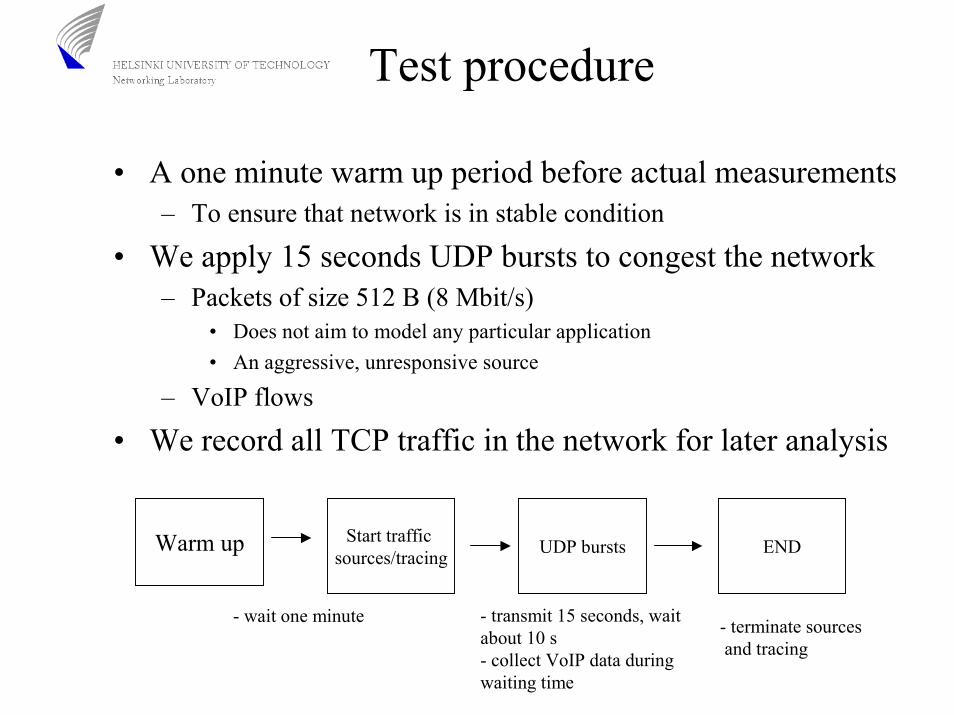
Test procedure
• A one minute warm up period before actual measurements– To ensure that network is in stable condition
• We apply 15 seconds UDP bursts to congest the network– Packets of size 512 B (8 Mbit/s)
• Does not aim to model any particular application• An aggressive, unresponsive source
– VoIP flows
• We record all TCP traffic in the network for later analysis
Warm up Start traffic sources/tracing UDP bursts END
- wait one minute - transmit 15 seconds, wait about 10 s- collect VoIP data during waiting time
- terminate sources and tracing
Per Hop Behavior (PHB)
• Defines the treatment how traffic belonging to a certain behavior group is forwarded at the individual network node
• DiffServ codepoint of a packet (DSCP) is used to select the PHB
• Two standardized PHB groups– Assured Forwarding– Expedited Forwarding
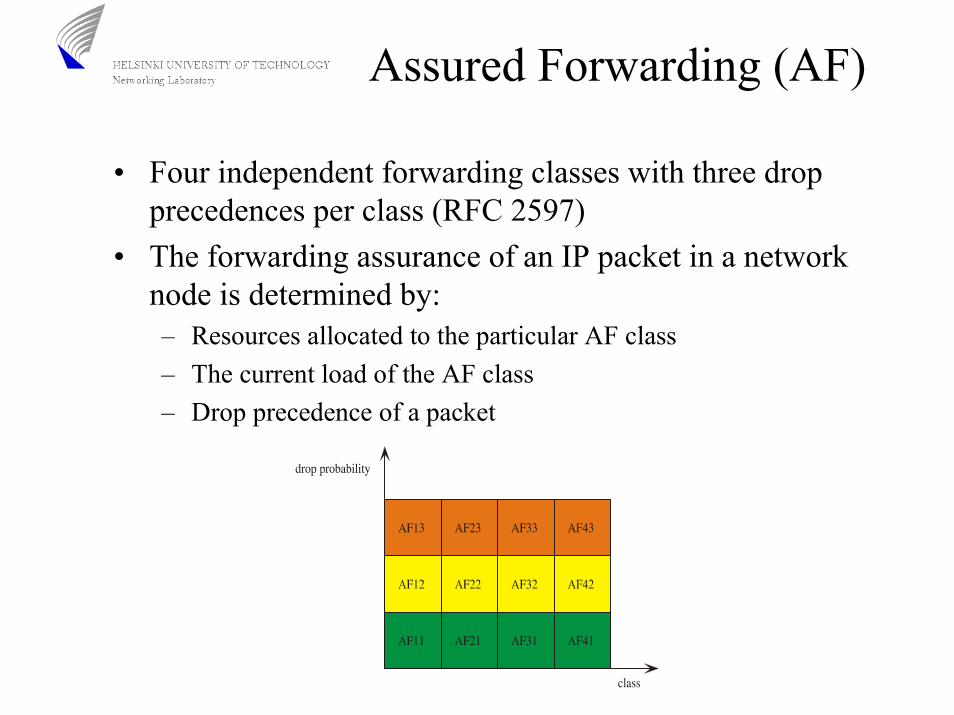
Assured Forwarding (AF)
• Four independent forwarding classes with three drop precedences per class (RFC 2597)
• The forwarding assurance of an IP packet in a network node is determined by:– Resources allocated to the particular AF class– The current load of the AF class– Drop precedence of a packet
Expedited Forwarding (EF)
• ” Leased line emulation”– Low loss, low latency and assured bandwidth service
• Defined in RFC 2598• Strict queueing treatment• Arrival rate < minimum service rate
– Requires powerful forwarding from the router
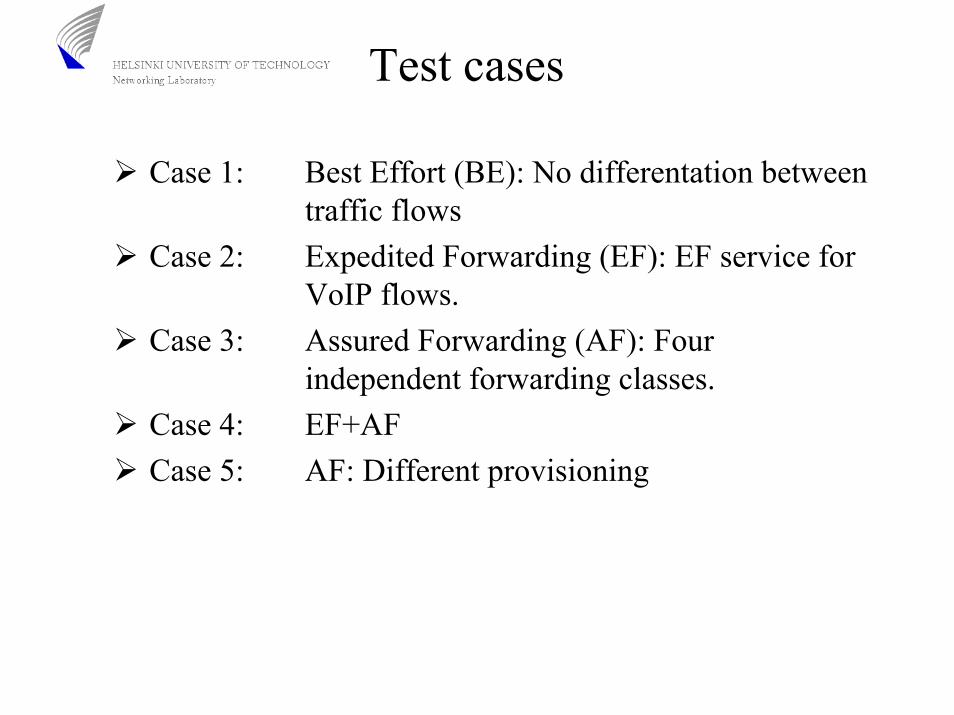
Test cases
� Case 1: Best Effort (BE): No differentation between traffic flows
� Case 2: Expedited Forwarding (EF): EF service for VoIP flows.
� Case 3: Assured Forwarding (AF): Four independent forwarding classes.
� Case 4: EF+AF� Case 5: AF: Different provisioning
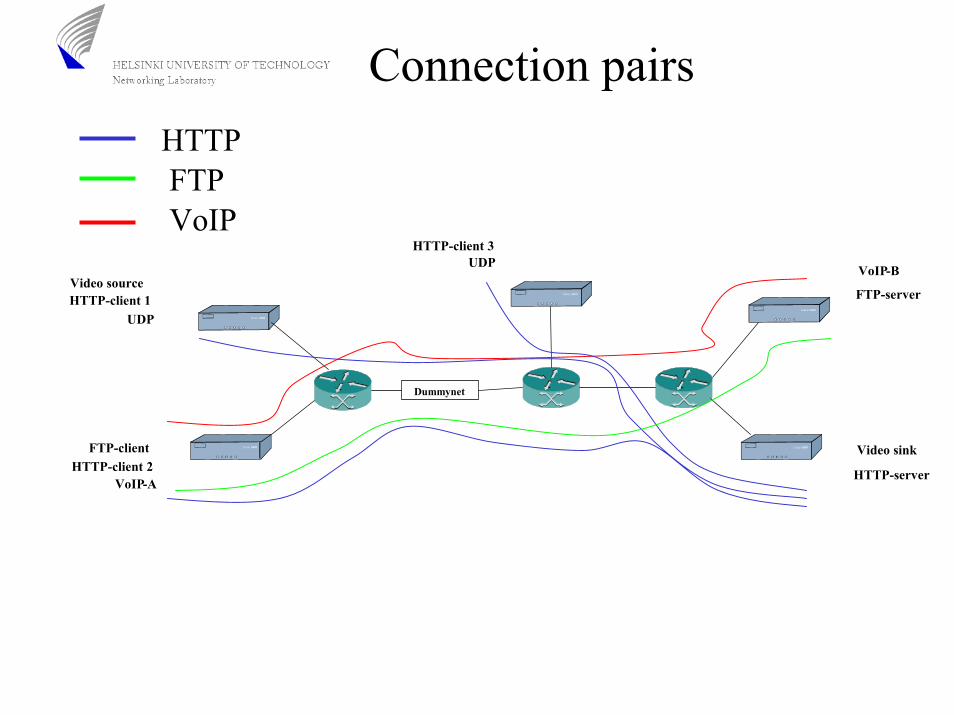
Connection pairsHTTP
Dummynet
VoIP-A
HTTP-client 1
HTTP-client 2
UDPHTTP-client 3
HTTP-server
FTP-client
Video source
Video sink
VoIP-B
FTP-server
UDP
VoIPFTP

Case 1: BE
• Baseline (reference) for our studies• No differentiation
– Traffic sources are competing of the resources– Situation in today’s Internet
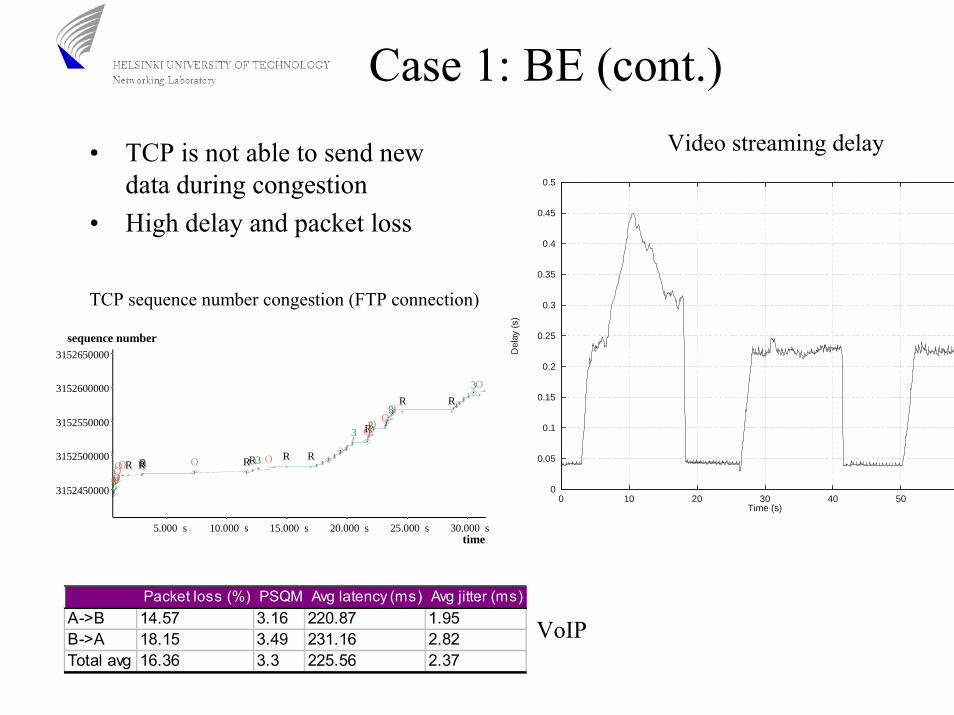
Case 1: BE (cont.)Video streaming delay• TCP is not able to send new
data during congestion• High delay and packet loss
0
0.05
0.1
0.15
0.2
0.25
0.3
0.35
0.4
0.45
0.5
0 10 20 30 40 50 60
Del
ay (
s)Time (s)
TCP sequence number congestion (FTP connection)
3152650000
3152600000
3152550000
3152500000
3152450000
30.000 s25.000 s20.000 s15.000 s10.000 s5.000 s
sequence number
time
O3
RRO3
OO3ROO3
RRO3RORO3RORROOOOOO3
Packet loss (%) PSQM Avg latency (ms) Avg jitter (ms)A->B 14.57 3.16 220.87 1.95B->A 18.15 3.49 231.16 2.82Total avg 16.36 3.3 225.56 2.37
VoIP
Case 1: BE (cont.)
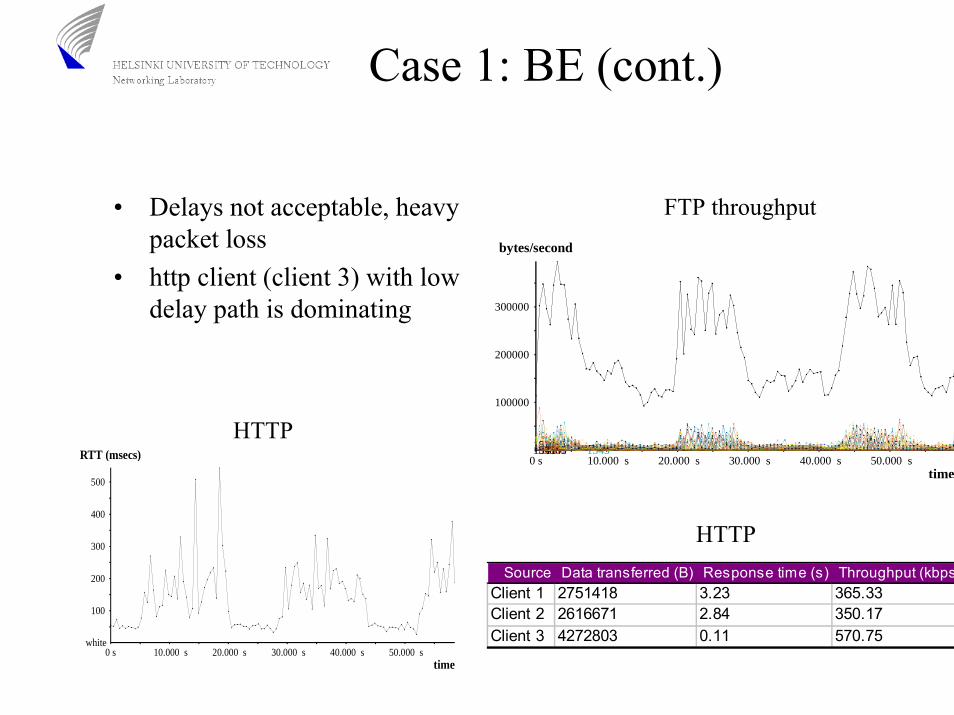
• Delays not acceptable, heavy packet loss
• http client (client 3) with low delay path is dominating
FTP throughput
300000
200000
100000
50.000 s40.000 s30.000 s20.000 s 10.000 s0 s
bytes/second
time
154315611562156515461554155715361552153115341541
HTTP
500
400
300
200
100
50.000 s 40.000 s 30.000 s 20.000 s 10.000 s0 s
RTT (msecs)
time
white
HTTPSource Data transferred (B) Response time (s) Throughput (kbps)
Client 1 2751418 3.23 365.33Client 2 2616671 2.84 350.17Client 3 4272803 0.11 570.75
Case 2: EF
• Two scenarios– 20 % of the link capacity provisioned for VoIP traffic– 30 % of the link capacity provisioned for VoIP traffic
• Other traffic sources get BE service• Max delay set to 20 ms• Leased line emulation
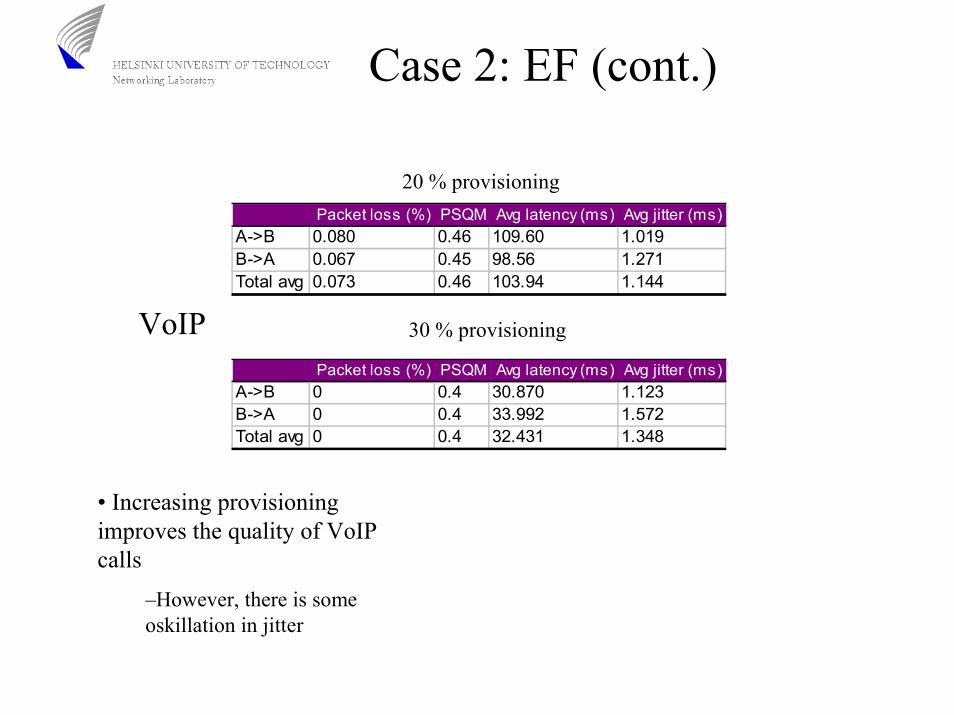
Case 2: EF (cont.)
20 % provisioning Packet loss (%) PSQM Avg latency (ms) Avg jitter (ms)
A->B 0.080 0.46 109.60 1.019B->A 0.067 0.45 98.56 1.271Total avg 0.073 0.46 103.94 1.144
VoIP 30 % provisioning
Packet loss (%) PSQM Avg latency (ms) Avg jitter (ms)A->B 0 0.4 30.870 1.123B->A 0 0.4 33.992 1.572Total avg 0 0.4 32.431 1.348
• Increasing provisioning improves the quality of VoIP calls
–However, there is someoskillation in jitter
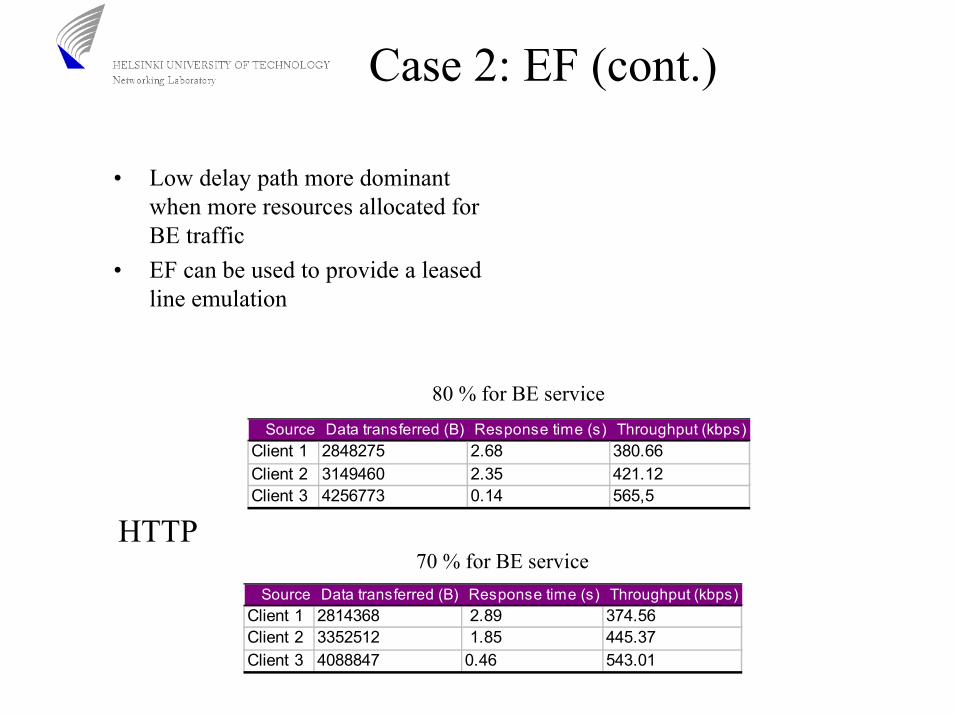
Case 2: EF (cont.)
80 % for BE service
• Low delay path more dominant when more resources allocated for BE traffic
• EF can be used to provide a leased line emulation
Source Data transferred (B) Response time (s) Throughput (kbps)Client 1 2848275 2.68 380.66Client 2 3149460 2.35 421.12Client 3 4256773 0.14 565,5
HTTP70 % for BE service
Source Data transferred (B) Response time (s) Throughput (kbps)Client 1 2814368 2.89 374.56Client 2 3352512 1.85 445.37Client 3 4088847 0.46 543.01
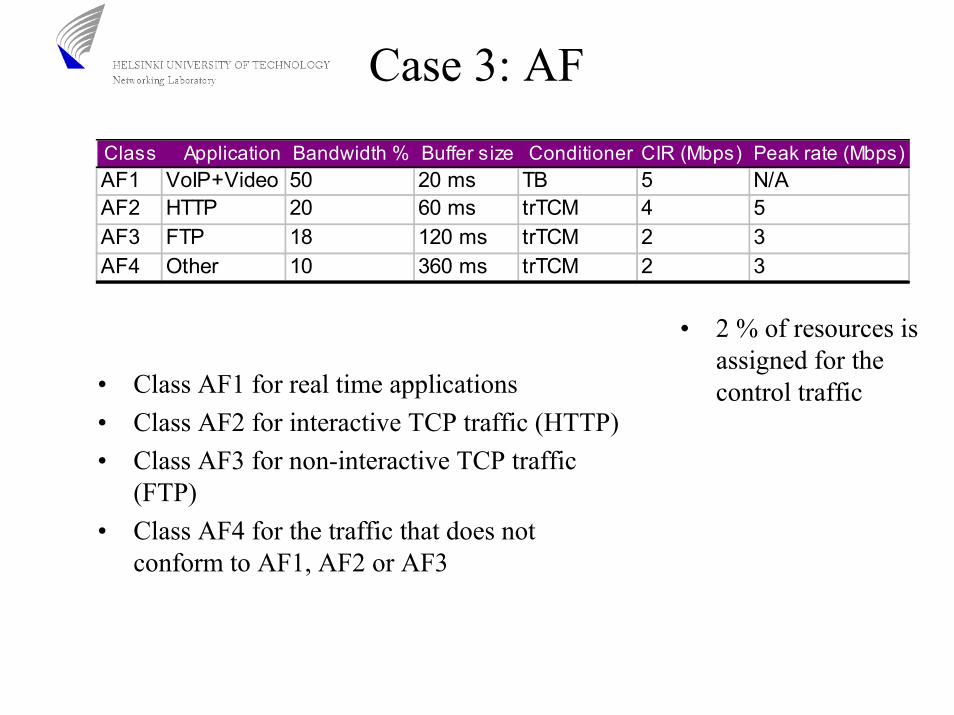
Case 3: AF
Class Application Bandwidth % Buffer size Conditioner CIR (Mbps) Peak rate (Mbps)AF1 VoIP+Video 50 20 ms TB 5 N/AAF2 HTTP 20 60 ms trTCM 4 5AF3 FTP 18 120 ms trTCM 2 3AF4 Other 10 360 ms trTCM 2 3
• 2 % of resources is assigned for the control traffic• Class AF1 for real time applications
• Class AF2 for interactive TCP traffic (HTTP)• Class AF3 for non-interactive TCP traffic
(FTP)• Class AF4 for the traffic that does not
conform to AF1, AF2 or AF3
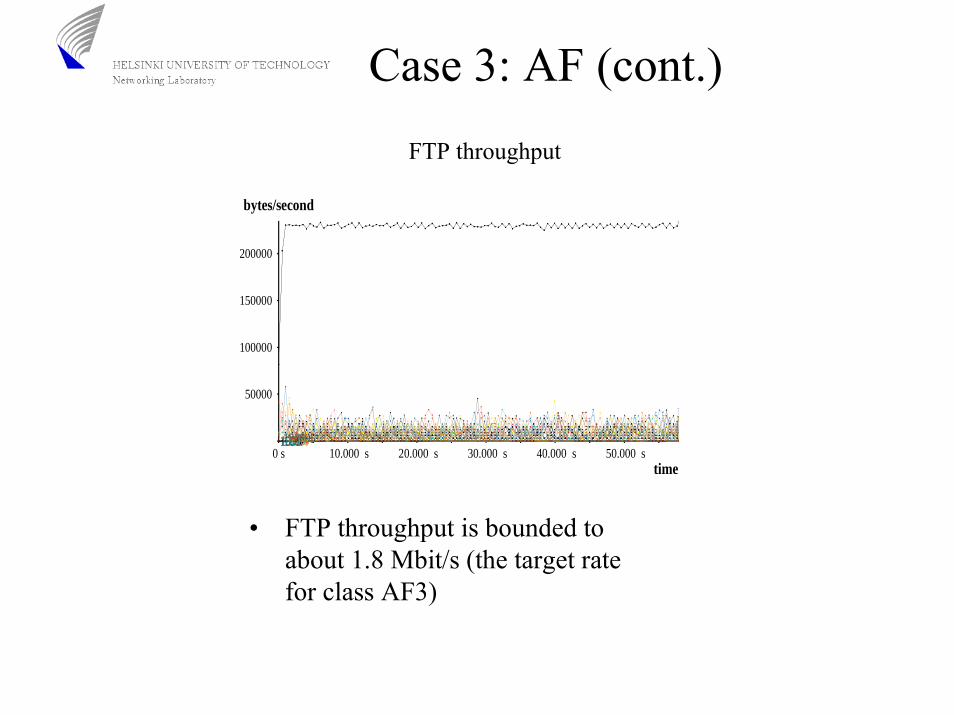
Case 3: AF (cont.)FTP throughput
200000
150000
100000
50000
50.000 s 40.000 s 30.000 s 20.000 s 10.000 s0 s
bytes/second
time
16051606161416161595160716091593159615991601
• FTP throughput is bounded to about 1.8 Mbit/s (the target rate for class AF3)
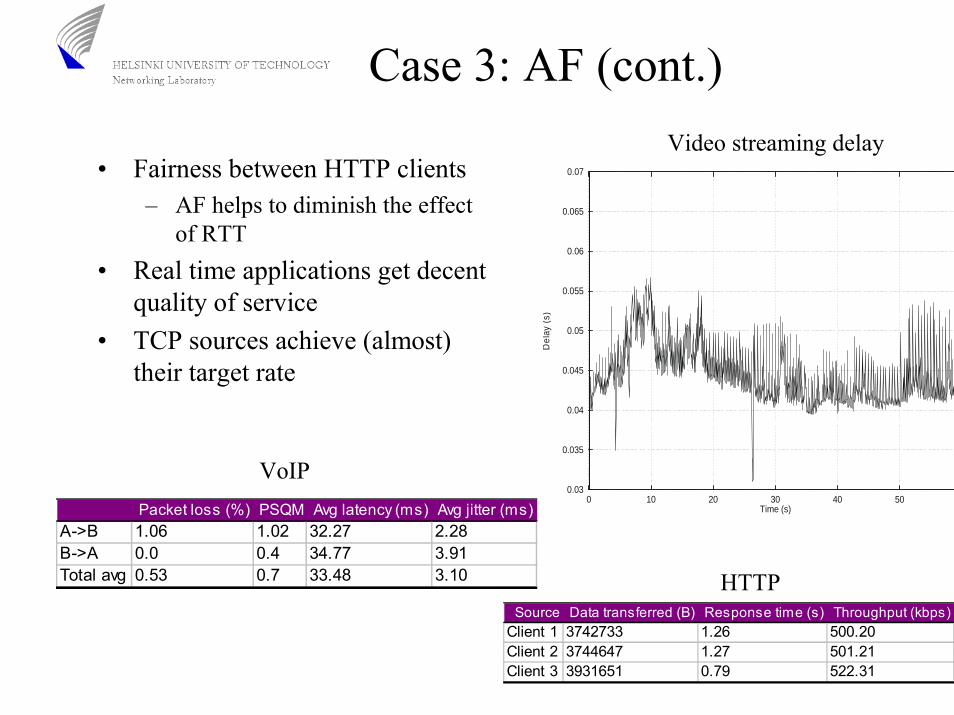
Case 3: AF (cont.)Video streaming delay
• Fairness between HTTP clients– AF helps to diminish the effect
of RTT• Real time applications get decent
quality of service• TCP sources achieve (almost)
their target rate
0.03
0.035
0.04
0.045
0.05
0.055
0.06
0.065
0.07
0 10 20 30 40 50 60
Del
ay (
s)
Time (s)
VoIPPacket loss (%) PSQM Avg latency (ms) Avg jitter (ms)
A->B 1.06 1.02 32.27 2.28B->A 0.0 0.4 34.77 3.91Total avg 0.53 0.7 33.48 3.10 HTTP
Source Data transferred (B) Response time (s) Throughput (kbps)Client 1 3742733 1.26 500.20Client 2 3744647 1.27 501.21Client 3 3931651 0.79 522.31
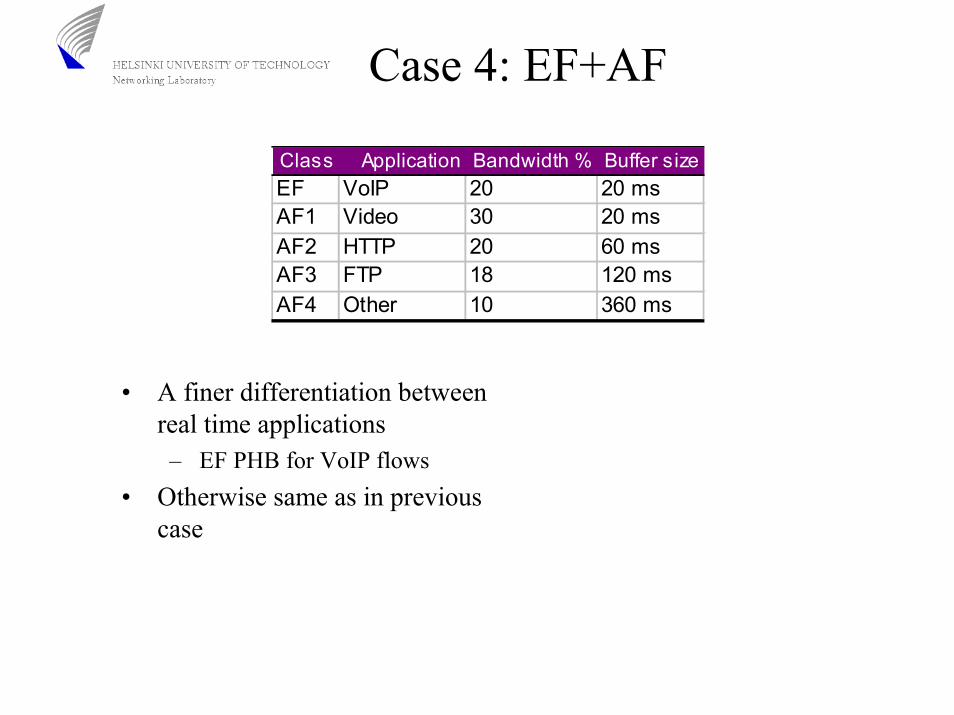
Case 4: EF+AF
Class Application Bandwidth % Buffer sizeEF VoIP 20 20 msAF1 Video 30 20 msAF2 HTTP 20 60 msAF3 FTP 18 120 msAF4 Other 10 360 ms
• A finer differentiation between real time applications– EF PHB for VoIP flows
• Otherwise same as in previous case
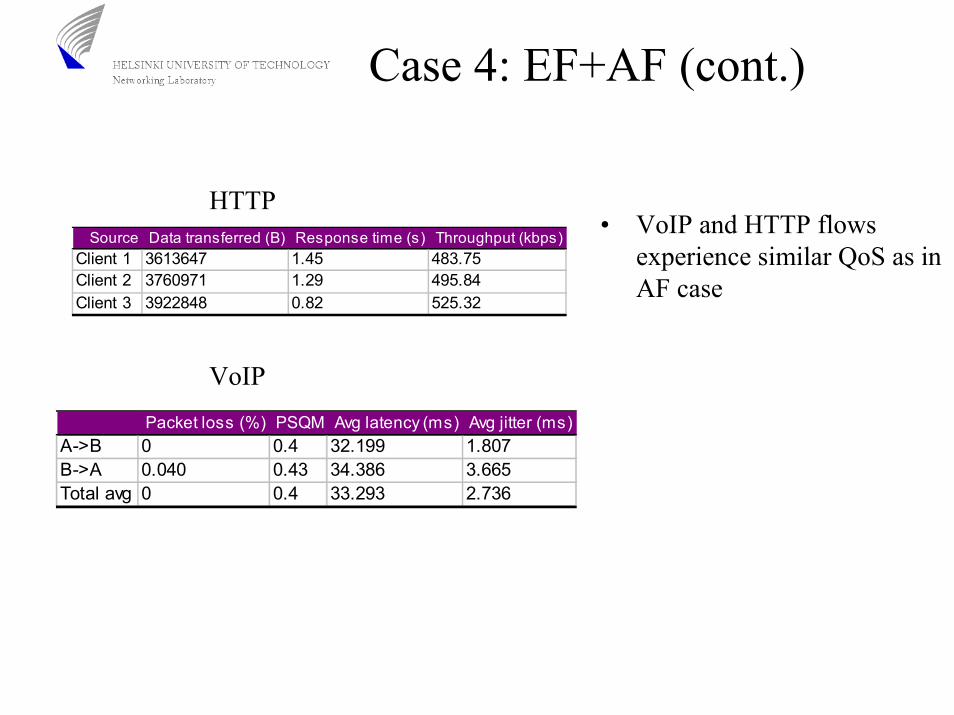
Case 4: EF+AF (cont.)
• VoIP and HTTP flows experience similar QoS as in AF case
Packet loss (%) PSQM Avg latency (ms) Avg jitter (ms)A->B 0 0.4 32.199 1.807B->A 0.040 0.43 34.386 3.665Total avg 0 0.4 33.293 2.736
Source Data transferred (B) Response time (s) Throughput (kbps)Client 1 3613647 1.45 483.75Client 2 3760971 1.29 495.84Client 3 3922848 0.82 525.32
VoIP
HTTP
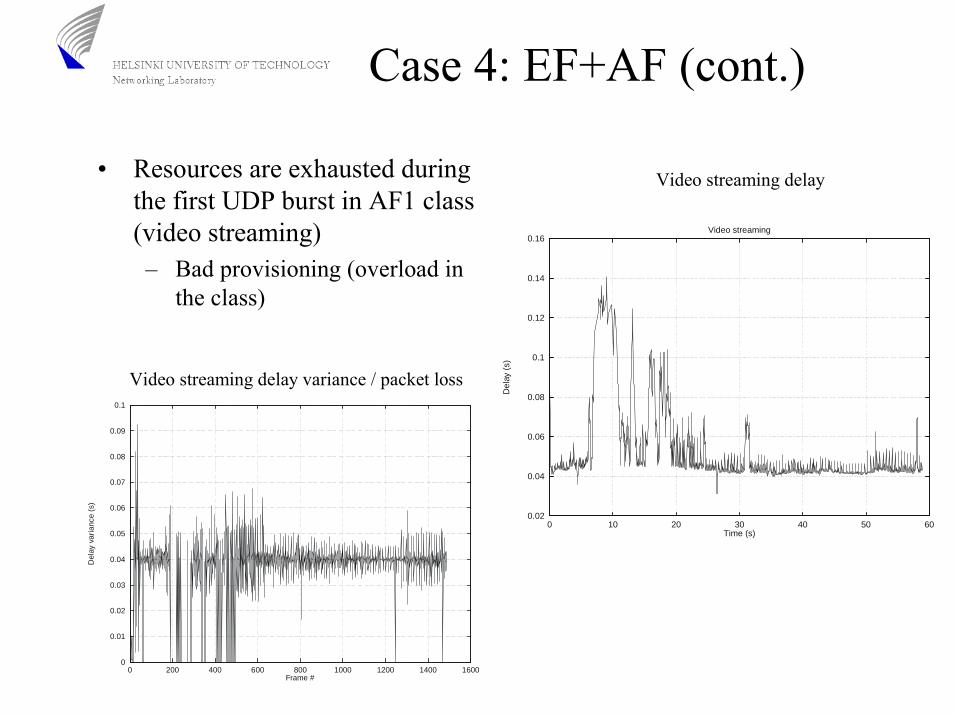
Case 4: EF+AF (cont.)
• Resources are exhausted during the first UDP burst in AF1 class (video streaming)– Bad provisioning (overload in
the class)
Video streaming delay
0.02
0.04
0.06
0.08
0.1
0.12
0.14
0.16
0 10 20 30 40 50 60
Del
ay (
s)
Time (s)
Video streaming
Video streaming delay variance / packet loss
0
0.01
0.02
0.03
0.04
0.05
0.06
0.07
0.08
0.09
0.1
0 200 400 600 800 1000 1200 1400 1600
Del
ay v
aria
nce
(s)
Frame #
Case 5: AF different provisioning
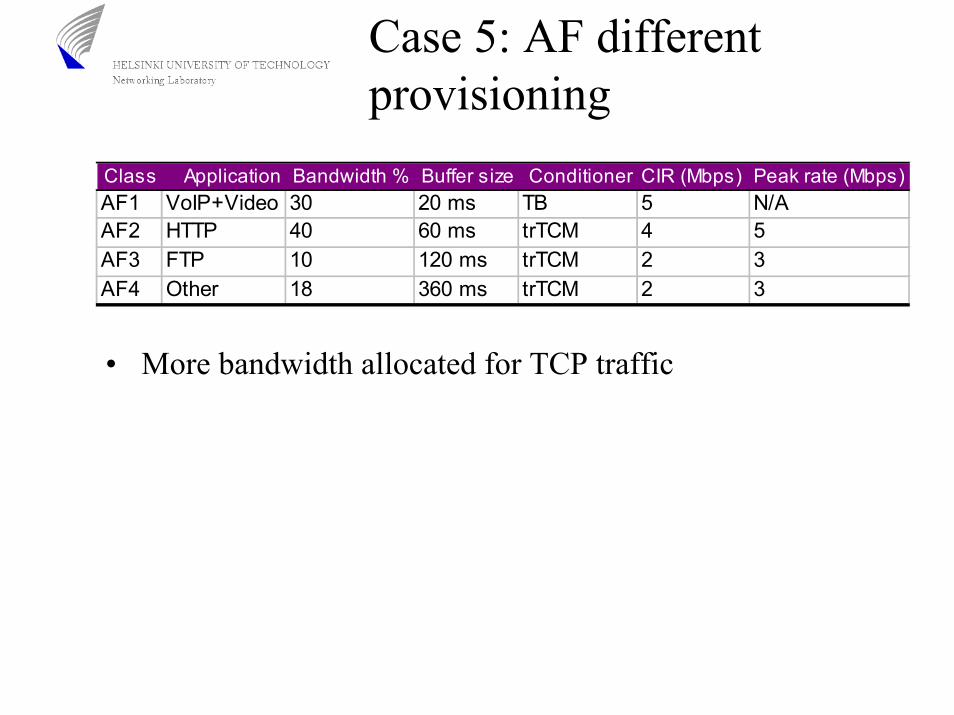
Class Application Bandwidth % Buffer size Conditioner CIR (Mbps) Peak rate (Mbps)AF1 VoIP+Video 30 20 ms TB 5 N/AAF2 HTTP 40 60 ms trTCM 4 5AF3 FTP 10 120 ms trTCM 2 3AF4 Other 18 360 ms trTCM 2 3
• More bandwidth allocated for TCP traffic
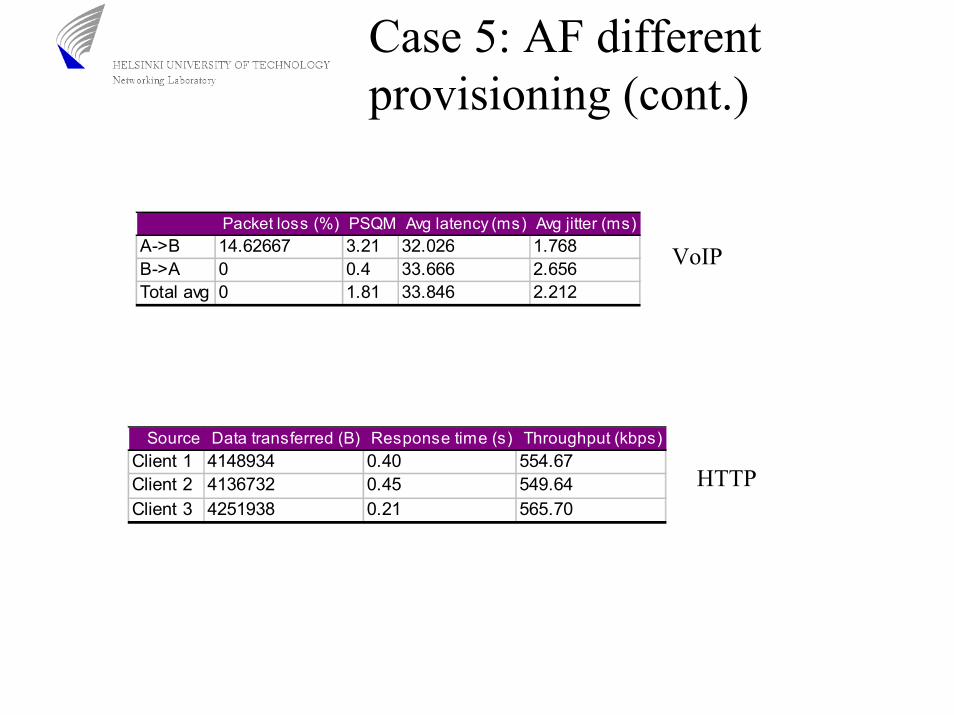
Case 5: AF different provisioning (cont.)
Packet loss (%) PSQM Avg latency (ms) Avg jitter (ms)A->B 14.62667 3.21 32.026 1.768B->A 0 0.4 33.666 2.656Total avg 0 1.81 33.846 2.212
VoIP
Source Data transferred (B) Response time (s) Throughput (kbps)Client 1 4148934 0.40 554.67Client 2 4136732 0.45 549.64Client 3 4251938 0.21 565.70
HTTP
Summary
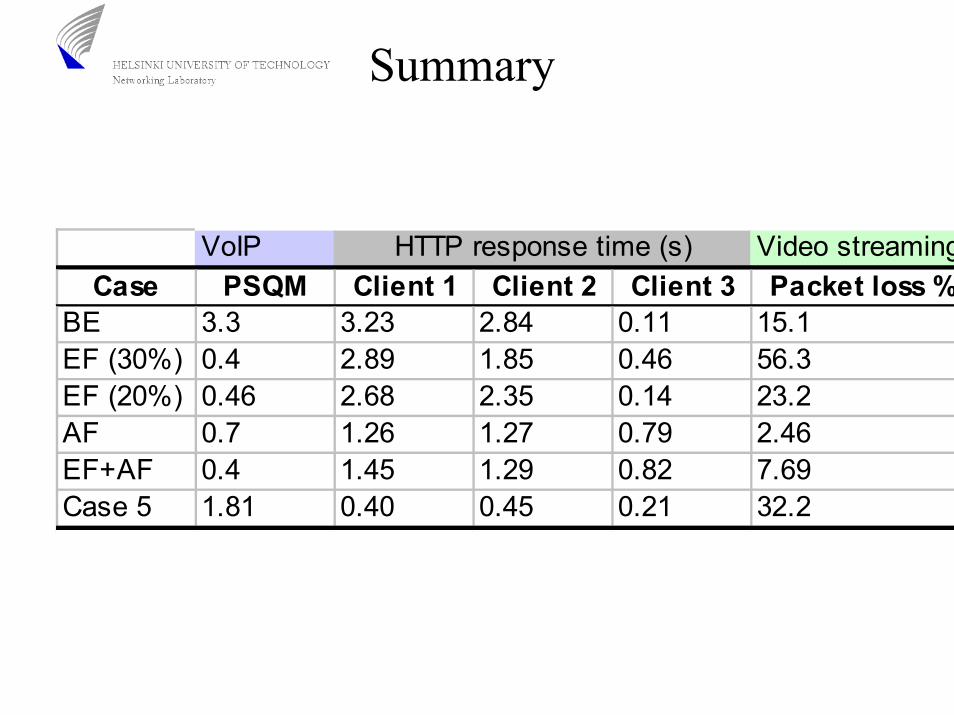
VoIP HTTP response time (s) Video streamingCase PSQM Client 1 Client 2 Client 3 Packet loss %
BE 3.3 3.23 2.84 0.11 15.1EF (30%) 0.4 2.89 1.85 0.46 56.3EF (20%) 0.46 2.68 2.35 0.14 23.2AF 0.7 1.26 1.27 0.79 2.46EF+AF 0.4 1.45 1.29 0.82 7.69Case 5 1.81 0.40 0.45 0.21 32.2
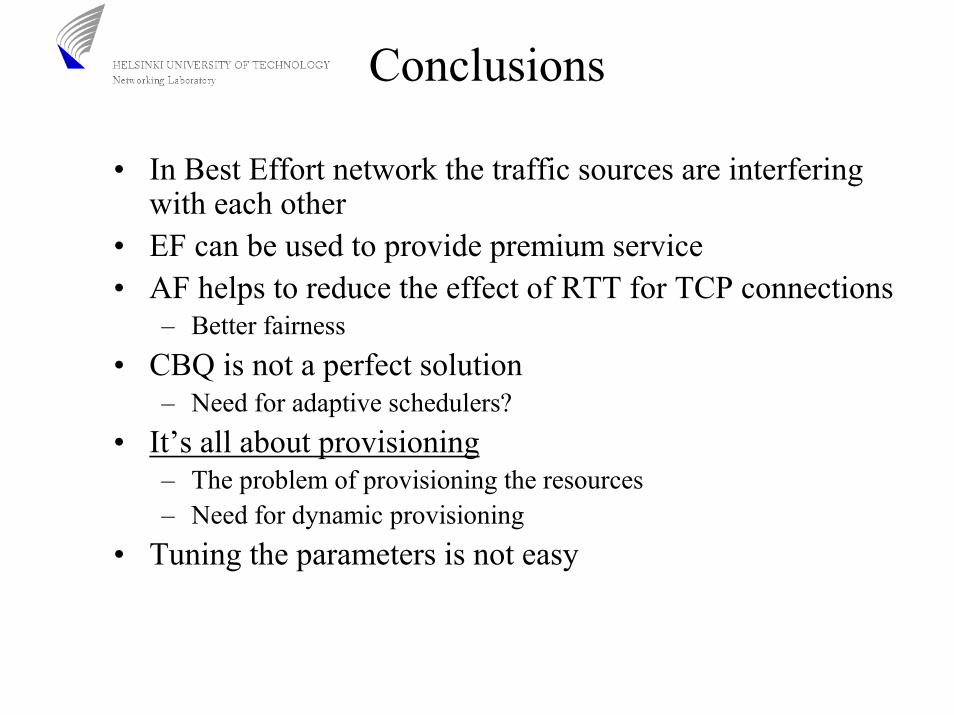
Conclusions
• In Best Effort network the traffic sources are interfering with each other
• EF can be used to provide premium service • AF helps to reduce the effect of RTT for TCP connections
– Better fairness• CBQ is not a perfect solution
– Need for adaptive schedulers?• It’s all about provisioning
– The problem of provisioning the resources– Need for dynamic provisioning
• Tuning the parameters is not easy
Future work
• Test different mechanisms– Borrowing, different schedulers, queuing algorithms etc.
• Measurements using dynamic provisioning• Adding more flows / connections per class• More realistic traffic distribution
– More TCP connections• Deeper analysis on data• Measurements using Adtech AX4000• Development of centralized management platform
– Easier to manage the network and traffic generators

Thank you
Questions ?