Radio Frequency Interference Measurements in WLAN Networks ...

NTIA-Report-80-56
Measu rements of InterferenceBetween AM Radios
Due to Local OscillatorRadiation
J.R. Juroshek
D.D. Crombie
G.E. Wasson
u.s. DEPARTMENT OF COMMERCEPhilip M. Klutznick, Secretary
Henry Geller, Assistant Secretaryfor Communications and Information
December 1980


TABLE OF CONTENTS
Page
LIST OF FIGURES iv
ABSTRACT .1
1. INTRODUCTION 1
2. RECEIVER IF RESPONSE 2
3. LOCAL OSCILLATOR RADIATION 5
4. IMAGE FREQUENCY SUSCEPTIBILITY 21
5. CONCLUSIONS 23
6. REFERENCES 26
iii

LIST OF FIGURES
Page
Figure 1. IF frequency response of a typical AM radio. Measurements were made at 3 different IF AGe levels corresponding to (a) minimum gain, (b) average gain, and (c)maximum gain.
Figure 2. Block diagram of test setup used to measure IF frequencyresponses.
Figure 3. Block diagram for local oscillator radiation measurements.
Figure 4. Summary of receiver local oscillator frequency measurements.
Figure 5. Example of effective IF center frequency measurements foran individual AM radio.
Figure 6. Example of effective IF center frequency measurements foran individual AM radio.
Figure 7. Example of effective IF center frequency measurements foran individual AM radio.
Figure 8. Summary of receiver local oscillator frequency measurementsusing nontechnical people to tune the AM radios.
Figure 9. Block diagram of test setup used in measuring separationrequirements for local oscillator interference.
3
4
6
8
9
10
11
12
13
Figure 10. SINAD reduction produced by AM radio local oscillator radiationat 1040 kHz. 15
Figure 11. SINAD reduction produced by AM radio local oscillatorradiation at 1270 kHz. 16
Figure 12. SINAD reduction produced by AM radio local oscillatorradiation at 1540 kHz. 17
Figure 13. SINAD reduction produced by horizontal oscillator radiationfrom a TV receiv~r at 551 kHz. 18
Figure 14. SINAD reduction produced by horizontal oscillator radiationfrom a TV receiver at 945 kHz. 19
Figure 15. SINAD reduction produced by horizontal oscillator radiationfrom a TV receiver at 1530 kHz. 20
Figqre 16. Block diagram of measurement setup for image rejectionratio measurements. 22
Figure 17. Summary of image rejection ratio measurements. 24
Figure 18. Summary of beat notes observed during image ratio measurements. 25
iv

MEASUREMENTS OF INTERFERENCE BETWEEN AM RADIOSDUE TO LOCAL OSCILLATOR RADIATION
*J. R. Juroshek, D. D. Crombie, and G. E. Wasson
Interference caused by local oscillator radiation from AM radios isa known problem. It is particularly troublesome when the local oscillatorfrequency of one radio coincides with the tuned frequency of another,nearby AM radio. This condition produces an annoying tone in the victimreceiver whose frequency is dependent on the frequency difference betweenthe local oscillator and tuned frequency of the victim radio. It hasbeen suggested that this source of interference would be more troublesomeif AM radio stations were assigned frequencies in 9 kHz channel incrementsinstead of the current 10 kHz increments. These arguments, however, arelargely based on idealized assumptions for AM radios. This reportdescribes the measurement of local oscillator radiation from a sample oftest radios. Measurements were made of local oscillator frequency forvarious tuning conditions~ Also described in the report are measurementsof the separation distance required to produce a given amount of interference in a victim receiver and the image rejection ratio with 9 kHzand 10 kHz spacings. The report concludes that there are no significantdifferences in interference between 9 kHz and 10 kHz assignments insofaras receiver local oscillator radiation and image frequency susceptibilityare concerned.
1. INTRODUCTION
It has been suggested that the effects of AM receiver imperfections, e.g.,
local oscillator radiation and image frequency susceptibility, will be worse if
9 kHz channeling is adopted in Region 2 than if the current 10 kHz channeling is
continued (International Telecommunication Union, 1980). As a result, it has been
proposed that pairs of frequencies causing these forms of interference could not
be assigned in the same geographic areas. The suggestion arises because of the
reduced frequency (1 kHz) of the beats between the interfering and wanted signals
with 9 kHz spacing. For example, assume that a receiver is tuned to 540 kHz. Then
if its intermediate frequency (IF) is 455 kHZ, the local oscillator will radiate on
995 kHz. If a nearby (within a few meters) receiver is tuned to a station on
either 990 or 1000 kHz, it will likely have a 5 kHz beat tone superimposed on its
audio output. If the channeling plan were changed to 9 kHz spacing, the local
oscillator would remain on 995 kHz (because 540 kHz is unchanged) but it would
cause interference to stations on the new frequencies of 990 and 999 kHz. The
first would be subjected to a 5 kHz beat as before, while the second would be
subjected to a 4 kHz beat instead of 5 kHz. The concern is that the 4 kHz beat
would be significantly more troublesome to the listener than one at 5 kHz.
*The authors are with the U.S. Department of Commerce, National Telecommunicationsand Information Administration, Institute for Telecommunication Sciences, Boulder,Colorado 80303

In the case of image frequency interference, with 10 kHz channelization, a
receiver tuned to a station on 540 kHz would receive interference from image
frequency stations on 540 + 2(455) = 1450 kHz. The beat frequency under these
circumstances will then be zero. At 9 kHz channel spacings, however, the image
frequency station would be onl449 kHz, giving rise to a beat of 1 kHz. If there
is the change of the zero frequency beat to 1 kHz, then this would be important.
Further examination of these points shows that it is the actual local oscillator
frequency rather than the nominal local oscillator (LO) frequency that causes the
problem. The actual LQ frequency of a receiver tuned to 540 kHz can differ from
the nominal 995 kHz local oscillator 'frequency for several reasons. First, super
heterodyne receivers suffer from tracking errors which can cause the LO frequency
to be in error by several kHz. Second, the difficulty of tuning receivers precisely
can introduce an additional error of as much as +2 kHz. Third, the local oscillator
frequency can drift as much asafew hundred Hz in an hour or so because of voltage
and temperature changes. Another factor influencing LO frequency is that a receiver's
IF response is not always symmetrical nor is it always centered at 455 kHz.
2. RECEIVER IF RESPONSE
The frequency response of the IF filter is one of the major factors in deter
mining the eventual frequency of the local oscillator. A nonsymmetric frequency
response or a response offset from the nominal 455 kHz center frequency will
correspondingly bias the local oscillator frequency. This section of the report
examines some typical receiver IF characteristics.
Measuring the IF responses of an AM receiver is a difficult task at best.
This difficulty is due, at least in part, to the IF automatic gain control (AGC)
circuitry which is generally used in AM receivers. A frequency response measured
with the AGC enabled is significantly different from one measured with the AGC
disabled. Also, a reasonable amount of care must be exercised if any probes or
instruments are attached to the IF filter to avoid changing its characteristics.
The frequency response of a typical AM receiver with its AGC disabled is shown
in Figure l(a) through (c). These measurements were made using the test setup
shown in Figure 2. Basically, the receiver's AGC circuit is connected to an
external power supply so that its level can be held constant at a representative
value. The frequency response is then measured by coupling a 450 to 460 kHz 'swept
frequency signal into the receiver IF filter through a loop. The input to the IF is
obtained from radiated coupling as no direct connection to the receiver's IF filter
2

2dBI
(a) B6=6.0 kHzf -456.6kHzc
450 455 460
2daI(b) B6-6.7kHz
f -=456.4kHzc
450 455 460
(c) B6=7. 1kHzf -456.4kHzc
I455
1 1
450 460
Figure 1. IF frequency response of a typical AM Radio. Measurements were madeat 3 different IF AGe levels corresponding to (a) minimum gain,(b) average gain, and (c) maximum gain.
3

SINGLE TURNLOOP, ANTEN~~A
SPECTRUMANALYZER
IMn INPUT IMPEDANCEWITH ~20 PPFD
DCPOWERSUPPLY
, .; IF OUTPUT
IAMPLIFIER I
TO RECEIVERAGC
SIGr~ALGEf~
450-460 KHz+:--
Figure 2. Block diagram of test setup used to measure IF frequency responses.

is used. Next, the IF filter is monitored by attaching a high input impedance
amplifier and oscilloscope probe to the IF output. The output from this amplifier
is then sent to a spectrum analyzer where the spectrum photographs are recorded.
The photographs in Figure l(a) through (c) were made on the same receiver at
three different AGC voltages. These levels were chosen to span the normal dynamic
range of the test receiver, where the figures correspond to IF conditions of (a)
minimum gain, (b) average gain, and (c) maximum gain. Note that this change in AGC
produces a change in the 6 dB bandwidth (B6) from 6.0 kHz to 7.1 kHz. The center
frequency (f ) of the IF filter response, which is defined as the average of the twoc
6 dB frequencies, correspondingly varies from 456.6 kHz to 456.4 kHz.
It should be noted that the IF measurements described here are designed to
measure only the IF filter. The effective filtering in the complete receiver is
influenced by other factors such as radio frequency (rf) filtering in the receiver
frontend as well as any post-detection audio filtering. The rf filtering in an AM
radio can be significant and is primarily obtained by tuning the ferrite input
antenna with the variable tuning capacitor.
3. LOCAL OSCILLATOR RADIATION
3.1 LO Frequency
Measurements of local oscillator radiation were made on seven receivers for each
of six frequencies. The technique used is block diagrammed in Figure 3. In making
the measurements an HP 8660C signal generator was first tuned to a test frequency
such as 540 kHz. l This signal was 30% modulated with a 400 Hz tone. Next, the
receiver under test was optimally tuned to this signal. The signal generator was
then switched to a frequency 455 kHz higher which, for the example, would be 540 +
455 = 995 kHz. An audible beat note was then observed in the Collins 651-S-1A
receiver which had been pretuned to 995 kHz. This beat note is the difference be
tween the frequency of the signal generator (currently set at 995 kHz) and the
frequency of the local oscillator in the receiver under test. The precise frequency
of the local oscillator radiation can now be determined by manually tuning the signal
generator until a zero beat is observed.
lCertain commercial equipment, instruments, or materials are identified in this paperto specify adequately the experimental procedure. In no case does such identification imply recommendation or endorsement by the National Telecommunications andInformation Administration, nor does it imply that the material or equipmentidentified is necessarily the best available for the purpose.
5

o-
S E TURNINGLANTENNA",
Loop ~
HP 8660 • 'SIG GEN
FZ
(ZERO BEAT)
FD
AM LoopANTENNA
6CSolLLINSS-IARECEIVER
RECEIVERUNDERTEST -,
To SPEAKERTERMINALS
OSC I '_LOSCOPE
To SPEAKERTERMINALS
Figure 3. Block diagram for local oscillator radiation measurements.
A summary of the results from these tests is shown in Figure 4. Insteadof
plotting local oscillator frequency, the results are shown as effective IF filter
center frequency; which is simply the zero beat frequency measured minus the test
frequency that the radio was tuned to. For example, if a zero beat frequency of
996.234 kHz was measured when the test radio was tuned to 540 kHz, the effective
IF filter center frequency plotted would be 996.234 - 540 = 456.234 kHz. The data
using 400 Hz modulation are shown with dots. Because of the wide scatter that
could have arisen through the use of 400 Hz modulation, the measurements were
repeated using 3 kHz modulation. These data are shown by asterisks in Figure 4.
Samples of these measurements for individual radios are shown in Figures 5
through 7. In these figures, three different symbols are used to show the repeat
ability of the data during measurements taken at different times. For example,
all of the data shown with squares were taken on one day. Figures 5 and 6 clearly
show the effects that tracking error can have over the AM band. On the other
hand, Figure 7 shows the lack of consistency that was observed in some radios.
As a further test of any potential bias introduced by the person tuning the
AM receivers or the modulation on the desired signal, a series of tests were made
using six nontechnical people to tune each of the radios. For these tests, the AM
radios were tuned to local standard broadcast signals at 630, 1090, and 1600 kHz
instead of a tone-modulated signal generator. The frequency of the local oscillator
was determined by zero beating with the HP 8660C signal generator as described
above. Test results using five receivers are shown in Figure 8. As can be seen,
the spread of the data is of the order of at least 5 kHz and is not significantly
different with nontechnical people tuning to actual AM radio stations.
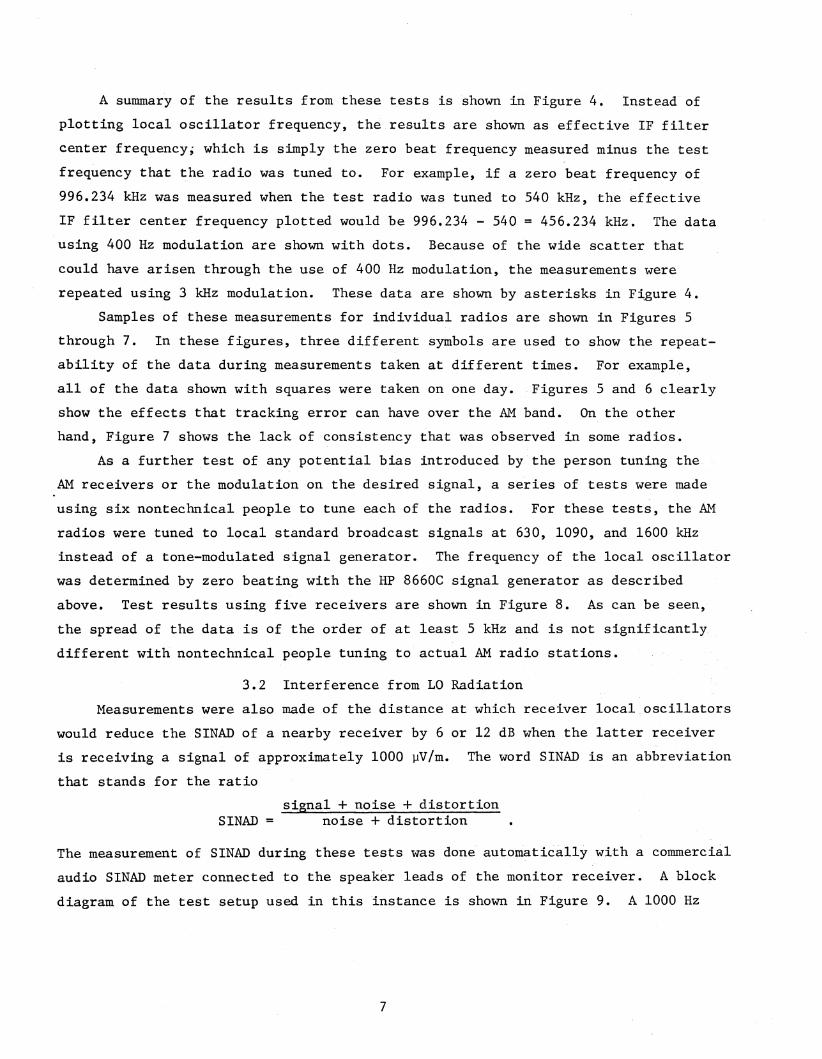
3.2 Interference from La Radiation
Measurements were also made of the distance at which receiver local oscillators
would reduce the SINAD of a nearby receiver by 6 or 12 dB when the latter receiver
is receiving a signal of approximately 1000 ~V/m. The word SINAD is an abbreviation
that stands for the ratio
SINADsignal + noise + distortion
noise + distortion
The measurement of SINAD during these tests was done automatically with a commercial
audio SINAD meter connected to the speaker leads of the monitor receiver. A block
diagram of the test setup used in this .Lnst ance is shown in Figure 9. A 1000 Hz
7

460
* 3000 Hz r~ODULAT ION• • 400 Hz MODULATION•459 • •• •• •
• •• •••
458 • *• •~ • • •
~ * • •N -* •::c eM- •~ • • • • *.• •"'--" • • ,If • *->- •
457 • ** • I •t...)
• •~ • •W • .. • • •• :*::::::::> , • •ctf •w * • *:* i-• •c:r:: • J
, • ..LL • • ,e:::: • • •456 I • •l..L.JI- * • • *:2: •LLI • - •t...) * *• *c:::: •l..L.J
* • ~ # *l- •---J455 * •........
LL
* ~•L.L
* * * * *........* • • *w • '*:>
*........* • *I- 454 *t...) • -Mel..L.J * f • .*LL * * *LL
* * * *w• * *
* **453 * *
452 ~---'--_--I~-_....L--__--I-__----L. """
540 720 900 1080 1260 1530
FREQUE~JCY (KHz)Figure 4. Summary of receiver local oscillator frequency measurements
8

IIIIII460 r----,r-----r----,-----r------r~----.-----
459 ~ -N D:::c~
~
>-L.) .-~
l.L.J::::J 458Q ~
l.L.J 0C -
0:::: 0LL
0:::LJ.J 0J-z: *LJ.J C CL.)
457 IJ •I-- C0:::: 0 * -LJ.JJ- •---1.........LL 0LL 0.........
w 456 I--
>-
.........I-UWLLLLw
455 I I I I I I
540 720 900 1080 1260 1530
FREQUEf~CY ) KHz
Figure 5. Example of effective IF center frequency measurements for anindividual AM radio. The different symbols are used to distinguishbetween measurements conducted at different times.
9

457 I I I I I I
..8 0
N 456 ~:::c -~
~
>-L)
:2:W::::>c:zsl..J.J 455 *"0:::: I-- -LL
0:::: 0C
WI- ..~ 0l..J.Je......> C
0::::454 *"w ~ -
t- O C--.J1--1 0LL
LL C1--1
l..J.J>-1--1 453 10-- -l-e......>l..J.JLLLLl..J.J
452 I I I I I I
540 720 900 1080 1260 1530
FREQUEt~CY) KHz
Figure 6. Example of effective IF center frequency measurements for anindividual AM radio. The different symbols are used to distinguishbetween measurements conducted at different times.
10

IIIIII460 .---,...-----r-----....,....-----r-----......------..-~
N 459 ~ -::r:~
">-t..) 0~
LLJ::::::>QLLJ 458 - -0::::LL
0::::LLJ
0I-::c:::=:wt..)
0:::: 457 -LLJ -I-.-J.........LL
CLL......... !LLJ C 0::> 456 - -.........
*"l-t..)LLJLLLLLLJ
c455 I I I I I I
540 720 900 1080 1260 1530
FREQUENCY) KHz
Figure 7. Example of effective IF center frequency measurements for anindividual &~ radio. The different symbols are used to distinguishbetween measurements conducted at different times.
11

460 r------,------r-----......----CUMULATIVE RESULTS6 PEOPLE J 5 RECEIVERS
•
456
459
458
~
N::c~
'-' 457>uzw~
QW0:::LL
0:::WIzWu0:::WI----I 455........LL
LL........w>-........~ 454wLLLLW
•
•..••••..••..•••••
••
••
•••
•••...••..••
•••-I
•••••
•
•
••
..•••••••••
••
••••••••
·1
••
•453 .. •
•
16001090
FREQUENCY (KHz)
630452 "---~-------.1..--------l----.J
Figure 8. Summary of receiver local oscillator frequency measurementsusing nontechnical people to tune the AM radios.
12
1000 Hz
LOCAL OSCILLATOR RADIATIONFROM RECEIVER
~
w
HP 8660 C
RECEIVERUNDERTEST
/'
d //
//
-: \A~1
r,'ON ITORRECEIVER
SINADMETER
Figure 9. Block diagram of test setup used in measuring separationrequirements for local oscillator interference.

tone generator within the SINAD meter is used to amplitude modulate an HP 8660C
signal generator by 30%. The receiver under test is both tuned and oriented so
that it produces a maximum degradation in SINAD in the monitor receiver. The
distance between the receiver under test and monitor receiver is then adjusted to
produce either a 6 dB or 12 dB reduction in SINAD. Measurement results for these
tests are shown in Figures 10, 11, and 12. Frequencies tested for local oscillator
radiation were 1040, 1270, and 1540 kHz which are produced by receiver tunings of
approximately 585, 715, and 1085 kHz, respectively. A total of nine receivers
were tested during this series.
Identical measurements were made with the AM test receivers replaced by two
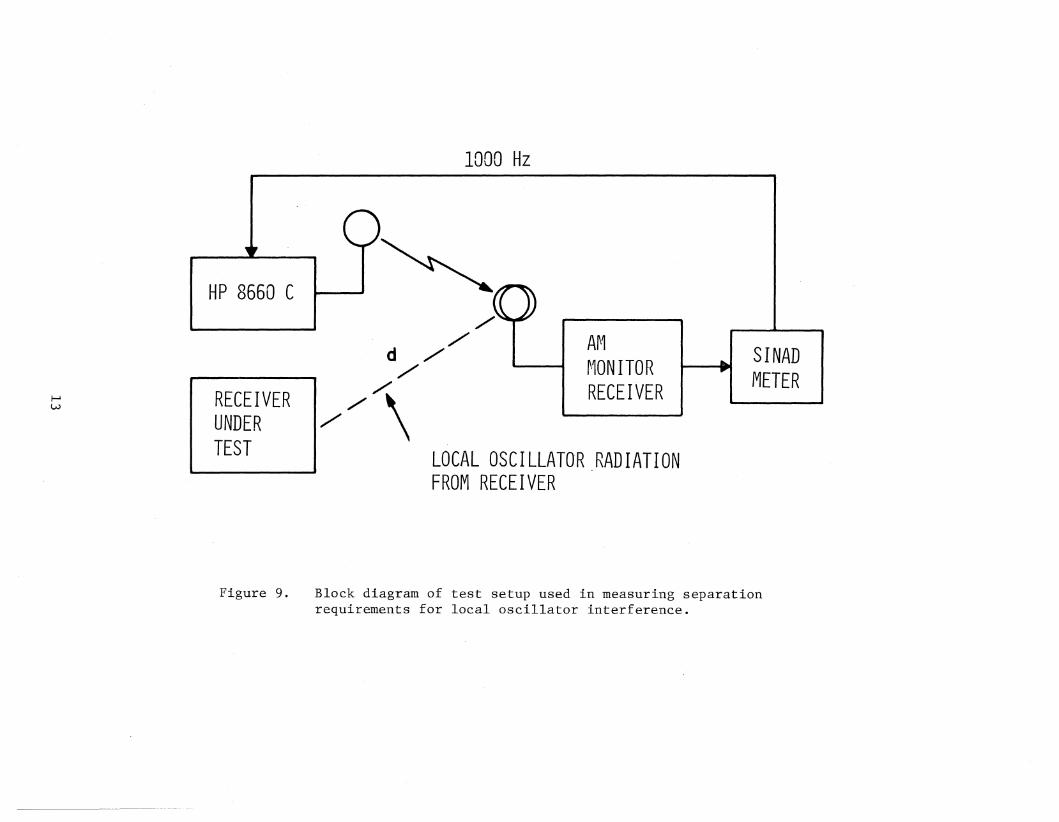
TV receivers. The distance required to produce 6 and 12 dB SINAD degradations
from TV horizontal oscillator radiation is shown in Figures 13, 14, and 15. As in
the previous tests, the TV receiver was also oriented for worst case interference
condit.ions. Horizontal oscillator radiation was measured at the AM radio frequencies
of 551, 945, and 1530 kHz which correspond to the 35th, 60th, and 96th harmonics
of the 15.75 kHz horizontal scanning frequency.
These tests, as in the previous case, were conducted with a single AM monitor
receiver in a 1000 ~V/m field modulated at 30% by a 1000 Hz tone. All of the measure
ments were made at frequencies not in use by strong, local AM radio stations. The
1000 ~V/m fields were generated by placing the AM receiver's loop stick antenna
approximately 60 em from the center of a single turn loop. -The construction of
this loop and input voltages required to generate a 1000 ~V/m field are as described
"in the publication "American Standard Methods of Testing Amplitude-Modulation
Broadcast Receivers" (1961).
The measurements also show that the effective IF filter center frequency of
AM t adLo e can vary between 453 kHz and 459 kHz, which means that a difference in
local oscillator frequency of the order of 6 kHz can be expected. Thus, an AM
radio tuned to a station at 540 kHz would have its local oscillator at a frequency
between 993 kHz and 999 kHz. A nearby radio tuned to a station at 999 kHz, in a
9 kHz assignment plan, could receive interference with an audio beat note between
a kHz to 6 kHz. This contradicts the argument that the beat note would be near
4 kHz with a 9 kHz assignment plan as opposed to 5 kHz in a 10 kHz assignment plan.
Separation distance between two AM radios of the order of 1 meter produced a
6 dB SINAD degradation due to interference from local oscillator radiation. Similarly
it is shown that separation distances of the order of 1 to 4 meters between a TV
14

4
E..0W0.:::: ~v::Jawn::z0
~0::: 2~w(f)
1040 KHz
x xxxxx
xx
x
x xxxxxxxx
o ---JL.-_--I
6 DB 12 DBSINAD REDUCTION
Figure 10. SINAD reduction produced by AM radio local oscillator radiationat 1040 kHz.
15

1270 KHz
4
E6w0::: 3::>aw0::
Z0
~0::: 2~w(f)
xxxx
x1 xx xx
xxx XXxxxx
O'-_~ ..a....-_-...I
6 DB 12 DBSINAD RED.UCT ION
Figure 11. SINAD reduction produced by AM radio local oscillator radiationat 1270 kHz.
16

1540 KHz
4
E0W0::: 3::)awa::z0
~lL 2~w(f)
x xxxx
XXx xx
xx x
x
x xxx
o __-.....- l..-_--J
6 DB 12 DBSINAD REDUCT Ior~
Figure 12. SINAD reduction produced by AM radio local oscillator radiationat 1540 kHz.
17
5
551 KHz
4 xxxx
xxx xx
:E 0 XX
~o~ :3 00QW X0::::..--.. X=::>GW0::::
Z0
00..--..
2.- 0<I: 00::::<I:
00-XW
(/)
XO
DO~
§
6 DBo
12 DB
SINAD REDUCTION
Figure 13. SINAD reduction produced by horizontal oscillator radiation froma TV receiver at 551 kHz. The different symbols are used todistinguish between two television receivers.
18

5
945 KHz
4
~
'"~ 3LL.J0::::........:::::>C2'l..L.J0::::
:2::c:>......-..I-
2e::::r:~0::::
<c CDO< X0-lJ..J X 0C/) X
ox oXoXx xx
[] ><OX0 XOO<X000
0 000
6 DBo
12 DBSINAD REDUCTION
Figure 14. SINAD reduction produced by horizontal oscillator radiation from aTV receiver at 945 kHz. The different symbols are used to distinguishbetween two television receivers.
19

5
1530'KHz
4
~
"'0w 30:::I--t
::::>QLl.J0:::
Zat--f
l-e::::(
2ce:::-ecCL
~WC/)
~ X
X>04J 0X [j<)()(J 0XOD
oMo0x00 X
0
12 DBo
6 DB
SINAD REDUCTION
Figure 15. SINAD reduction produced by horizontal oscillator radiation from a TVreceiver at 1530 kHz. The different symbols are used to distinguishbetween two television receivers.
20

receiver and AM radio can produce a similar 6 dB SINAD degradation. This degradation
is due to radiation at harmonics of the 15.75 horizontal scanning oscillator in the
TV. Thus if local oscillator radiation from AM radios prohibits the use of certain
pairs of frequencies, then TV receiver radio would also prohibit the use of certain
frequency assignments that are close to multiples of 15.75 kHz.
4. IMAGE FREQUENCY SUSCEPTIBILITY
Measurements were made on eight receivers in order to compare image rejection
obtained with 9 kHz and 10 kHz channel spacings. A block diagram of these tests
is shown in Figure 16. As can be seen from the diagram, an image signal and a
desired signal are added together in a balanced hybrid network. These two signals
are then transmitted through a single turn loop to the receiver under test. The
desired signal is modulated 80% by a 1000 Hz tone while the image signal is
modulated 80% by a 400 Hz tone. The level of desired signal is set to produce a
signal of approximately 1000 ~V/m at the AM receiver under test. Measurements of
image rejection ratio are then made by increasing the level of the image signal
until a 6 dB degradation in SINAD of the receiver under test is observede The
ratio of image signal level to desired signal level (SI/Sd) at the input to the
transmitter loop is defined as the image rejection ratio.
These tests were conducted at the following frequencies:
ASSIGNMENTS BELOWDESIRED FREQUENCY NEAREST IMAGE AND ABOVE NEARESTASSIGNMENT FREQUENCY ASSIGNMENT IMAGE CHANNEL SPACING
540 kHz 1450 kHz 1440, 1460 kHz 10 kHz
540 1449 1440, 1458 9
640 1550 1540, 1560 10
639 1548 1539, 1557 9
720 1630 1620, 1640 10
720 1629 1620, 1638 9
800 1710 1700, 1720 10
801 1710 1701, 1719 9
For each desired frequency it was necessary to conduct tests at the nearest image
frequency as well as at frequency assignments above and below this frequency. The
reason for this is that there is no way of predicting which of those three f r e
quencies will produce the worst case (smallest) image rejection ratio.
21

1,000 Hz AUDIO TONE
6dB
NN
HP 8660C DESIREDSIGNAL VSIGNALGENERATOR
_I HYBRID PM 5171~
AMP30 dB
60em
CALIBRATEDLOOP
TORECEIVER
TERMINALS7
RECEIVER IUNDERTEST
SINADMETER
HP 8660CSIGNALGENERATOR,
400Hz
HP 3310AFUNCTIONGENERATOR
IMAGESIGNAL
50.Q
OSCI LLOSCOPEMONITOR
OCILLOSCOPEMONITOR
Figure 16. Block diagram of measurement setup for image rejection ratio measurements.

A summary of these measurements is shown in Figure 17. Plotted here is the
worst case image ratio for eight receivers. The circles denote those measurements
where the smallest case image occurred at the nearest image frequency. The star
symbol, on the other hand, means that the worst case image ratio occurred on the
frequency below, while the square denotes the image occurred at the frequency
above. ~ecause of equipment limitations, the maximum Sr/Sd that could be generated
was 48 dB. rf a radio was tested at Sr/Sd = 48 dB, and a SrNAD degradation less
than 6 dB was detected, it is shown in Figure 1'7 as an arrow indicating a potential
response greater than 48 dB. One of the eight radios tested had no detectable
image response at Sr/Sd = 48 dB and therefore is not plotted on the figure.
As described previously, a radio tuned to a station, such as 540 kHz, would
receive interference from an image frequency station on 1450 kHz. The beat fre
quency would be zero if the local oscillator frequency of the radio were precisely
540 + 455 = 995 kHz. However, since the previous tests have already shown that
this is not likely to be the case, a nonzero audio beat note will be heard from
the radio. Figure 18 shows the frequency of the beat note that was observed for
each of the worst case image measurements shown in Figure 17. This measurement
was made by simply changing the frequency of the HP 8660 image signal generator
until a zero beat was observed and then noting the frequency change necessary to
produce the zero beat.
These tests show that the image rejection ratio, Sr/Sd' is of the order of
20 dB to 45 dB. No appreciable difference were observed in this ratio with 9 kHz
channel spacing versus 10 kHz channel spacing.
5. CONCLUSIONS
The measurements show no apparent differences in interference characteristics
between 9 kHz assignments and 10 kHz assignments insofar as receiver local oscillator
radiation and image frequency susceptibility are concerned. The data obtained
do not support the claim that these receiver characteristics would produce signifi
cantly different interference characteristics with a 9· kHz frequency assignment plan
as compared to the present 10 kHz plan. Tests have shown that differences in
local oscillator frequencies of the order of 6 kHz can be expected from AM radios
tuned to the same station. These differences are due to receiver design and
manufacturing characteristics as well as difference in the way a person tunes a
radio. Measurements at the harmonics of horizontal scan frequency of two TV
receivers show that this source of interference is comparable or stronger than the
local oscillator radiation from the AM radios. Thus, if local oscillator radiation
23

50
45
CD-c
-c40en
<,H
en0
~ 35ct:
w(.!)«~
30H
Wen«u~ 25enct:03=
20
15
o Nearest image frequency~ frequency below nearest imageC frequency above nearest image
t t ft ", t ttt tt- - -0 "0 -co -0 •••0 "0
0 0
I--- o -0 0
0 0 0[] 0
[]
I-- -0 []
[] 00 0 0
~ [] -0 0
[]
~ [] -
o 0
0 0 0...-.
0 -
0 0
0 *~ 0 0 -
0
540 540 640 639 720 720 800 80110kHz 9kHz 10kHz 9kHz 10kHz 9kHz 10kHz 9kHz
Figure 17. Summary of image rejection ratio measurements.
24

"....".
N::c~........,
w 6(!)<{~H
W00 5<{U
I-000::0
4~
>-CD
0Wu 3:::::>000::a..>- 2uzw:::::>0w0::l.L.
ttwCD
0
o Nearest image frequency_ Frequency below nearest imageo Frequency above nearest image
~ -0
0
- 0 -[]
0 0
~ -
0 c 0[J
0 0 c
80
~
0 00 -
0
0 c0
0 0
- -0
0 0 0 0 0
0 0 0o
[J §o
0 []
- -o 8 CD
o 0
*cfl 8
00
540 540 640 639 720 720 800 80110kHz 9kHz 10kHz 9kHz 10'kHz 9kHz 10kHz 9 kHz
Figure 18. Summary of beat notes observed during image ratio measurements.
25

from AM radios prohibits the use of certain pairs of frequencies, then TV receiver
radiation would _also prohibit the use of certain frequency assignments that are
close to multiples of the 15.75 kHz horizontal scanning frequency.
6 . REFERENCES
American Standards Association, Inc. (1961), American Standard Methods of TestingAmplitude-Modulation Broadcast Receivers, C16.19-1951, pp 1-24.
International Te1ecomm~nicationUnion (1980), Regional Broadcasting Conference,Document No. 34-E, Buenos Ares, Argentina, March 11.
* u.s.GOVERNMENT PRINTING OFFICE: 1981-778-458/215 Region No.8 26

FORM NTIA-29(4-80)
, U.S. DEPARTMENT OF COMMERCENAT'L. TELECOMMUNICATIONS AND INFORMATION ADMINISTRATION
BIBLIOGRAPHIC DATA SHEET
1. PUBLICATION NO.
NTIA Report 80-56
2. Gov't Accession No. 3. Recipient's Accession No.
4. TITLE AND SUBTITLE
Measurements of interference between am radios dueto local oscillator radiation
7. AUTHOR(S)
J. R. Juroshek, D. D. Crombie, and G. E. Wasson8. PERFOR.MING ORGANIZATION NAME AND ADDRESS
NTIA/ITS325 BroadwayBoulder, CO 80303
11. Sponsoring Organization Name and Address
14. SUPPLEMENTARY NOTES
5. Publication Date
December 19806. Performing Organization Code
9. Project/Task/Work Unit No.
10. Contract/Grant No.
12. Type of Report and Period Covered
13.
15. ABSTRACT (A 200-word or less factual summary of most significant information. if document includes a siqniiicent bibliography or literaturesurvey, mention it here.)
Interference caused by local oscillator radiation from AM radios is a knownproblem. It is particularly troublesome when the local oscillator frequency ofone radio coincides with the tuned frequency of another, nearby AM radio. Thiscondition produces an annoying tone in the victim receiver whose frequency isdependent on the frequency difference between the local oscillator and tunedfrequency of the victim radio. It has been suggested that this source of interference would be more troublesome if AM radio stations were assigned frequenciesin 9 kHz channel increments instead of the current 10 kHz increments. Thesearguments, however, are largely based on idealized assumptions for AM radios.This report describes the measurement of local oscillator radiation from a sampleof test radios. Measurements were made of local oscillator frequency forvarious tuning conditions. Also described in the report are measurements of theseparation distance required to produce a given amount of interference in a
(continued on reverse)16. Key Words (Alphabetical order, separated by semicolons)
17. AVAILABILITY STATEMENT
rn UNLIMITED.
o FOR OFFICIAL DISTRIBUTION.
18. Security Class. (This report)
(u)19. Security Class. (This page)
(u)
20. Number of pages
2621. Price:

15. ABSTRACT (cont'd)
victim receiver and the image rejection ratio with 9 kHz and 10 kHz spacings.The report concludes that there are po significant differences in interferencebetween 9 kHz and 10 kHz assignments insofar as receiver local oscillatorradiation and image frequency susceptibility are concerned.