
Measurement & Verification (M&V) : Procedures and Methods · Tie to Energy Management Systems...
25
Measurement & Verification (M&V) : Procedures and Methods Zodiac Baskar Subbarao PE, CxA, CBCP, CMVP, LEED AP http://www.zodiacintl.com [email protected]
Transcript of Measurement & Verification (M&V) : Procedures and Methods · Tie to Energy Management Systems...

Measurement & Verification (M&V): Procedures and Methods
Zodiac
Baskar SubbaraoPE, CxA, CBCP, CMVP, LEED APhttp://[email protected]

Agenda
Building EnergyM&V C t d G id liM&V Concepts and GuidelinesM&V Approach LEED M&V LEED M&VM&V Plan Calibrated Simulation
2
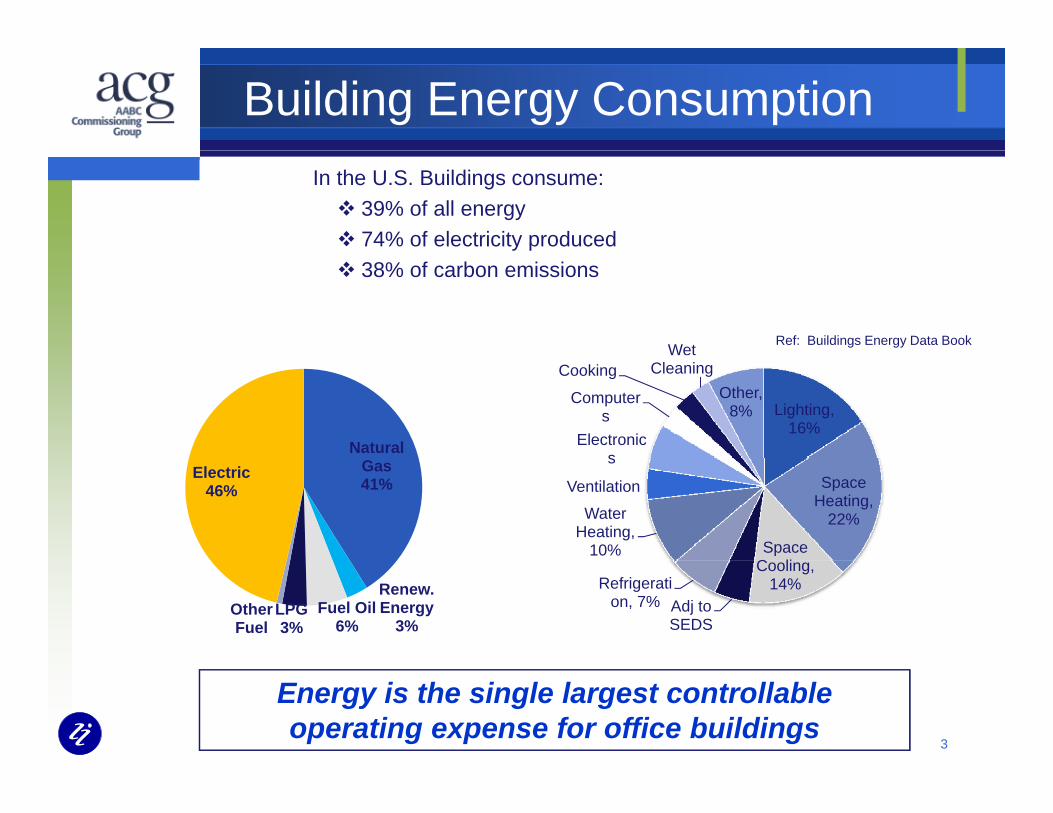
Building Energy ConsumptionIn the U.S. Buildings consume: 39% of all energy 74% of electricity produced
Ref: Buildings Energy Data Book
38% of carbon emissions
Wet
Lighting, 16%
Electronics
Computers
Cooking CleaningOther,
8%
Natural
Space Heating,
22%
Space C li
Water Heating,
10%
Ventilation
sGas41%
Electric46%
Cooling, 14%
Adj to SEDS
Refrigeration, 7%
Renew. Energy
3%Fuel Oil
6%LPG3%
Other Fuel
3
Energy is the single largest controllable operating expense for office buildings

Building Facility
Electric
PV ArrayDC
GridAC
AC Load
BUILDING ENERGY EFFICIENCY MEASURESRENEWABLE – DELIVER ENERGYRESULTS IN UTILITY ENERGY SAVINGS
Building 2
Inverter kWhHeat / Cool
LEED CREDIT – ON-SITE RENEWABLE ENERGYNO BASELINE OR ENERGY SAVINGS CALCULATION
Return LoopWater Temp
Supply WaterTemp
FlowMeter
Water Refrig Air
Heating
Cooling
GEOTHERMAL
Work
4
Renewable energy technologies supply energy rather than simply reduce energy consumed
GEOTHERMAL

Measurement and VerificationM&V is the process of using measurement to reliably determine actual savings created within an individual facility.
Energy = Baseline – Post installation +/- Adjustmentsgy jSavings Energy use Period Energy
300
350
Baseline
200
250
Baseline Adj. Baseline
Measured Energy use
Savings
50
100
150
Baseline PeriodPost InstallationPeriod
Measured Energy useEnergy Usage
‐
Jan‐10 Feb‐10 Mar‐10 Apr‐10 May‐10 Jun‐10 Jul‐10 Aug‐10 Sep‐10 Oct‐10 Nov‐10 Dec‐10 Jan‐11 Feb‐11 Mar‐11 Apr‐11 May‐11 Jun‐11 Jul‐11 Aug‐11 Sep‐11 Oct‐11 Nov‐11
Baseline Post‐Retrofit What Would Have Happened
5
Savings cannot be directly measured, since they represent the absence of energy use

M&V and Benchmarking Identify energy savings opportunitiesMeet sustainability rating requirements (LEED) To serve as a commissioning tool Support evaluation of efficiency programs Account for variance from the utility budget Enhance financing of efficiency projects D t fi i l t ti
Num
ber of
Bui
ldin
gs Document financial transactions
100
Building Energy Performance Rating
1
Worst PerformersBest Performers
25507590 10
121.129.9 165.786.0 339.4EPA Performance Rating &
Energy Intensity(kBtu/ft2-year)
G5060708090
100
ting
Benchmarking through ENERGY STAR Portfolio Manager
Target Rating uses EPA energy performance rating of 1-100
C b ildi i0
1020304050
Rat
6
Compare one building against a national sample of similar buildings
0 50 100 150 200 250
Building EUI, Total Energy Use per Sq. Ft. (source kBtu/sf)
Benchmark Target Finder Score ENERGY STAR

Guidelines
LEED NCRenewable energy
7IPMVP: International Performance Measurement and Verification Protocol www.evo-world.orgFEMP: Federal Energy Management Program

IPMVP – M&V Options
LEEDNC & CI
LEED CI
Approach based on objective, constraints and cost
8
pp oac based o object e, co st a ts a d costto determine energy and water savings
ECM: Energy Conservation Measure

LEED M&V
PFp3Water Metering and
Reporting
PFp1Building-Level Energy
Metering
EAc5 M&V EAc5 M&V
PFc1.1Advanced Energy
Metering
Provide a process for corrective action if the results of the M&V plan indicate that energy savings
PFc3Advanced Water
Metering and Reporting
PFc1.2Reconcile Projected and Actual Energy
Performance
indicate that energy savings are not being achieved.
Collect and share energy and water use data
Core & Shell – M&V Base
LEED V2.2CREDIT CATEGORIES - SIX
LEED 2009CREDIT CATEGORIES – SEVEN
PREREQUISITES – NINEPRESCRIPTIVE REQUIREMENTS
LEED 2012 (PILOT)CREDIT CATEGORIES – TENPREREQUISITES – FIFTEEN
NEW PERFORMANCE CATEGORY
Building and Tenant Submetering
Option D, IPMVP Vol III, 2006Final report - address variance, avoided tenant energy use, energy cost and GHG emissions to the EAc1 baseline
MOVING TO PERFORMANCE BASE RATING
9
Credit is being redeveloped to address building performance
Leadership in Energy and Environmental Design(LEED®) U.S. Green Building Council (USGBC)

LEED Related Credits
10
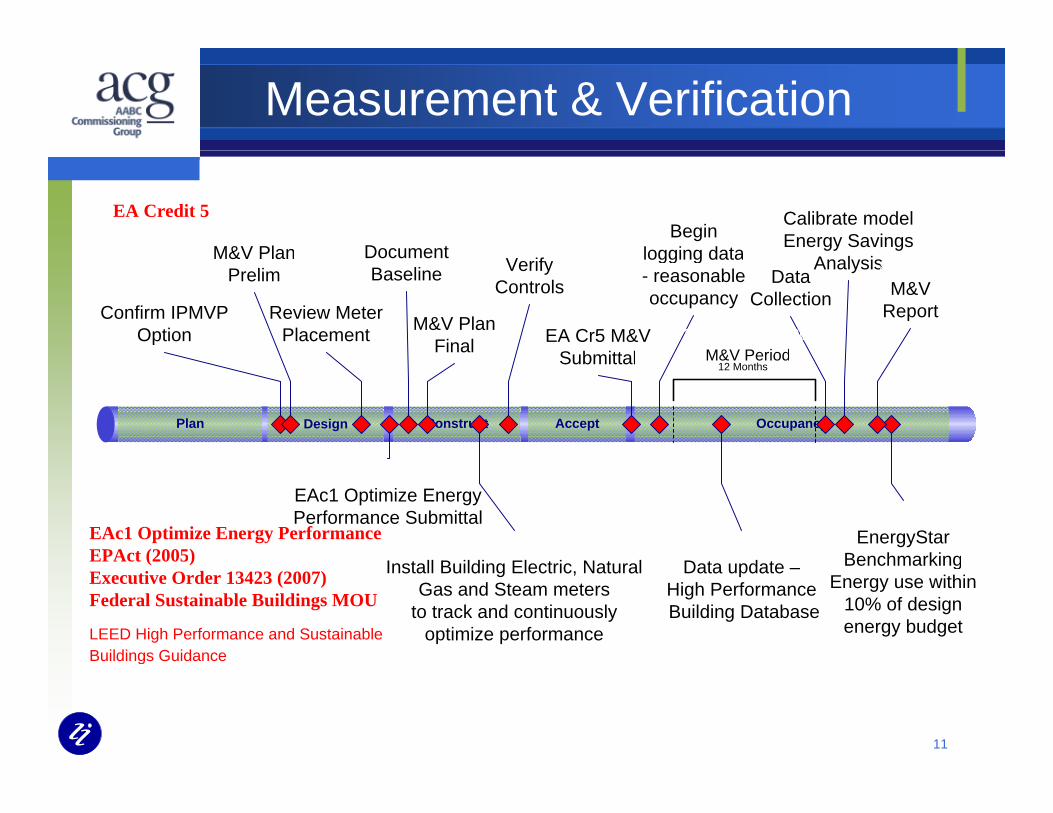
Measurement & Verification
EA Credit 5
7/28/20094/6/2009
M&V Plan 5/22/2009
8/1/2009Calibrate modelEnergy Savings
6/23/2009Begin
logging data5/1/2009
Document
4/4/2009Confirm IPMVP
Option
5/5/2009M&V Plan
Final
7/28/2009Data
Collection
M&V PlanPrelim Verify
Controls4/21/2009Review Meter
Placement
Analysis8/8/2009M&V
Report
logging data- reasonable occupancy
Document Baseline
6/17/2009EA Cr5 M&V
Submittal6/26/2009 - 7/26/2009
M&V Period
Plan Design Construct Accept Occupancy
12 MonthsSubmittal M&V Period
EAc1 Optimize Energy PerformanceEPAct (2005)
8/11/2009EnergyStar
Benchmarking
4/27/2009EAc1 Optimize Energy Performance Submittal
5/16/2009I t ll B ildi El t i N t l
7/6/2009D t d tEPAct (2005)
Executive Order 13423 (2007)Federal Sustainable Buildings MOU
LEED High Performance and Sustainable Buildings Guidance
BenchmarkingEnergy use within
10% of design energy budget
Install Building Electric, Natural Gas and Steam meters
to track and continuously optimize performance
Data update –High PerformanceBuilding Database
11
g

LEED Requirements5/9/2009
Control Drawing showing meters (top 80% of bldg energy end-uses)
7/3/2009Upload
End-useMetering
information
6/28/2009Upload
M&V Plan
LEED NC v2009
Construct Accept Occupancy
gy )
7/8/2009
CreditNarrative
7/13/2009
Special Circumstances
(optional)
6/2/2009
Contract - M&V Period Recertify
5 yrs
Collect & reportWhole-project
energy and water
LEED-NC 12 Months LEED-EBOM
or soonerMPRs use data for 5 years
Optional
Process for corrective actions if energy savings are not being acheived
12
Decreased energy and water use consumption is a major component of LEED certification
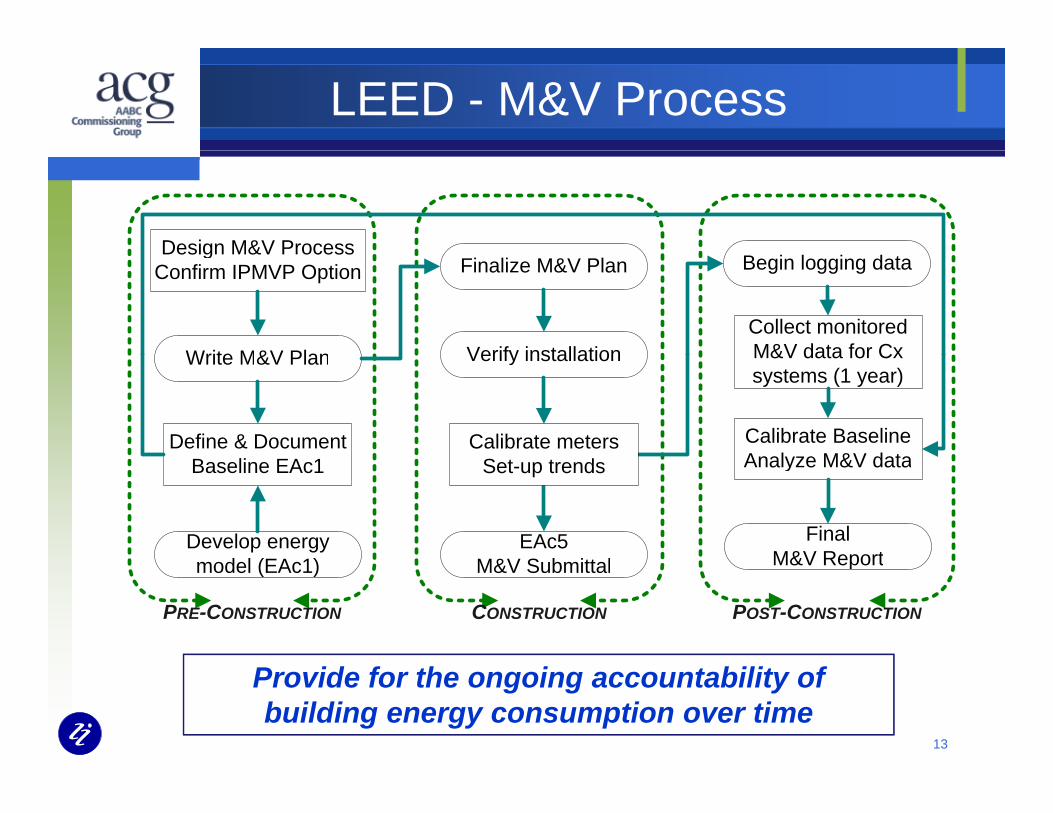
LEED - M&V Process
Design M&V ProcessDesign M&V ProcessConfirm IPMVP Option
Collect monitored M&V data for CxWrite M&V Plan Verify installation
Finalize M&V Plan Begin logging data
Define & Document
M&V data for Cx systems (1 year)
Write M&V Plan
Calibrate BaselineAnalyze M&V data
Verify installation
Calibrate metersBaseline EAc1
Final M&V Report
Analyze M&V data
Develop energy d l (EA 1)
EAc5 M&V S b itt l
Set-up trends
PRE-CONSTRUCTION CONSTRUCTION POST-CONSTRUCTION
M&V Reportmodel (EAc1) M&V Submittal
13
Provide for the ongoing accountability of building energy consumption over time

M&V Plan
Project Specific M&V Plan Details of baseline conditions and data collected Document assumptions and sources of data What will be verified Who will conduct the M&V activities and when
Details of engineering analysis performed Details of engineering analysis performed How energy savings will be calculated Utility rates and how they will be used to calculate cost savings Detail any operations & maintenance (O&M) cost savings claimedy p ( ) g
Energy ModelingEAc1, BaselineEnergy Efficient featuresand Hardware
Commissioning & M&VM&V Plan – Metering, Calibrate
d l t b ilt th d
Architect Engineer
Oversees the LEED Process
model to as-built, weather and occupancy trends LEED AP
Cx Agent, M&V
OwnerLong Term trending
14
Trend logsTie to Energy Management Systems
Controls Contractor
Facility Manager
g gFine tune building systemsEnergy Management

Baseline
Baseline physical conditions Equipment inventory and
Factors Items Monitored Equipment inventory and
conditions Occupancy
Nameplate data
Items Monitored How long Complexity
Nameplate data Energy consumption rate Control strategies
Stability of baseline Other variables
Other
It i i t t t l d fi d d t th
15
It is important to properly define and document the baseline conditions

Building Energy Use
Software Tool Model Proposed Building Model Baseline Building Elements
Envelope 2,000,000
Total Energy Use Envelope Lighting HVAC Systems
R t l
1,678,106
1,189,1731,200,000
1,600,000
, ,
h
Receptacle Schedules Energy Prices 400,000
800,000
kWh
0Annual
16LEED design submittal EAc1
Baseline Design

Metering
Whole Building Electric: kW kWh
Energy end-uses Primary HVAC equipment Electric: kW, kWh
Natural Gas: Cubic Feet Water: Gallons Steam: Pounds
Primary HVAC equipment Secondary HVAC equipment Lighting Vertical Transportation
Chilled Water: Gallons, deg F, kW, variable speed, status
PropanePhotovoltaic DC and AC output
Other (plug loads, processes etc.)
Photovoltaic – DC and AC output Geothermal or Ground Source
Energy Ref: 2003 CBECS
WaterCookingOther
Natural GasOffiS
Misc.Electricity
Water Heating
CookingOtherOffice Equipment
Water heating
Cooling
Space Heating
Use
17
Space Heating
Lighting
Ventilation

Data Collection
Advanced Meters Accuracy
Building Automation System (BAS) is a tool for collection, storage/retrieval,
l i d i li i f Digital Output - Pulse Frequency – one pulse per unit Quantities Measured
M t C fi ti
analysis and visualization of equipment and systems operating performance
Measurement Configuration Operating Temperature Humidity Range Type DDC Type Code – ASME, AWWA, other Other
Capital and Installed Cost
System
Recalibration needs Maintenance Cost
BUILDING
18
BAS can monitor energy consumption of specific end-uses

Weather
60%
70%
80%
70
80
90
Win
d
Average Area Climate Data: ST. LOUIS, MO
30%
40%
50%
60%
30
40
50
60
70
Sun
shin
e
Pre
cipi
tatio
n, W
0%
10%
20%
0
10
20
30
Jan Feb Mar Apr May Jun Jul Aug Sep Oct Nov Dec
Tem
p,
Weather data in a variety of formatsd / th /i d ht
Axis TitleTemperature (F) Precipitation (in) Wind (MPH) Sunshine (%)
www.gard.com/weather/index.htm http://www.eere.energy.gov/buildings/energyplus/weatherdata
_sources.cfm www.weatherunderground.com Other
19

Calibration
Buildings are dynamic systems Collect post-retrofit energy datap gy Collect Weather data Occupancy / usage Operation patterns 0 7
0.80.9
1
Lighting Schedules - Baseline
Operation patterns System parameters PV System Geothermal system 0 1
0.20.30.40.50.60.7
Frac
tion
Geothermal system
Re Run simulation
00.1
1 2 3 4 5 6 7 8 9 101112131415161718192021222324
Hour
Weekday Sat Sun Hol Re-Run simulation Verify model simulates actual conditions Check predicted vs. actual for energy types
Weekday Sat Sun Hol
p gy yp
20
When differences are acceptable, the simulation is called “calibrated simulation”

Calibrated SimulationB
asis 30-year avg weather, design
occupancy, schedules and set Actual Weather, Occupancy
and Schedules, Metered 30 Year Weather DataTMY2
sign
edB
Calibrated Design Case ModelDesign Case Model(EA credit 1 Option1)
Post-Construction Design Case Model
points energy use, Utility Bills TMY2
As-
des
plia
ntui
ldin
g st
ics
Budget Case Model Calibrated Baseline Case Model Post-Construction
Cod
e C
omp
Adj
uste
d Bu
Cha
ract
ers
Code CompliantAppendix G ASHRAE 90.1
Code CompliantAppendix G ASHRAE 90.1
Baseline Case ModelAppendix G ASHRAE 90.1
Budget Case Modelminus
Design Case Model
Baseline Case minus Design Model
OrBaseline Model– Actual Bills
Or
Baseline Case Modelminus
Design Case Model
EnergySavings
21
Baseline minus Metered Energy Use
Design Submittal - EAc1 and EAp2 One Year Post Construction Long Term Average

Building Energy Use
Total Energy Use
1,678,106
1,189,1731,259,869
1,763,689
1,248,6321 200 000
1,600,000
2,000,000
400 000
800,000
1,200,000
kWh
0
400,000
Annual
Baseline Design As-Built Adj Baseline Metered
22
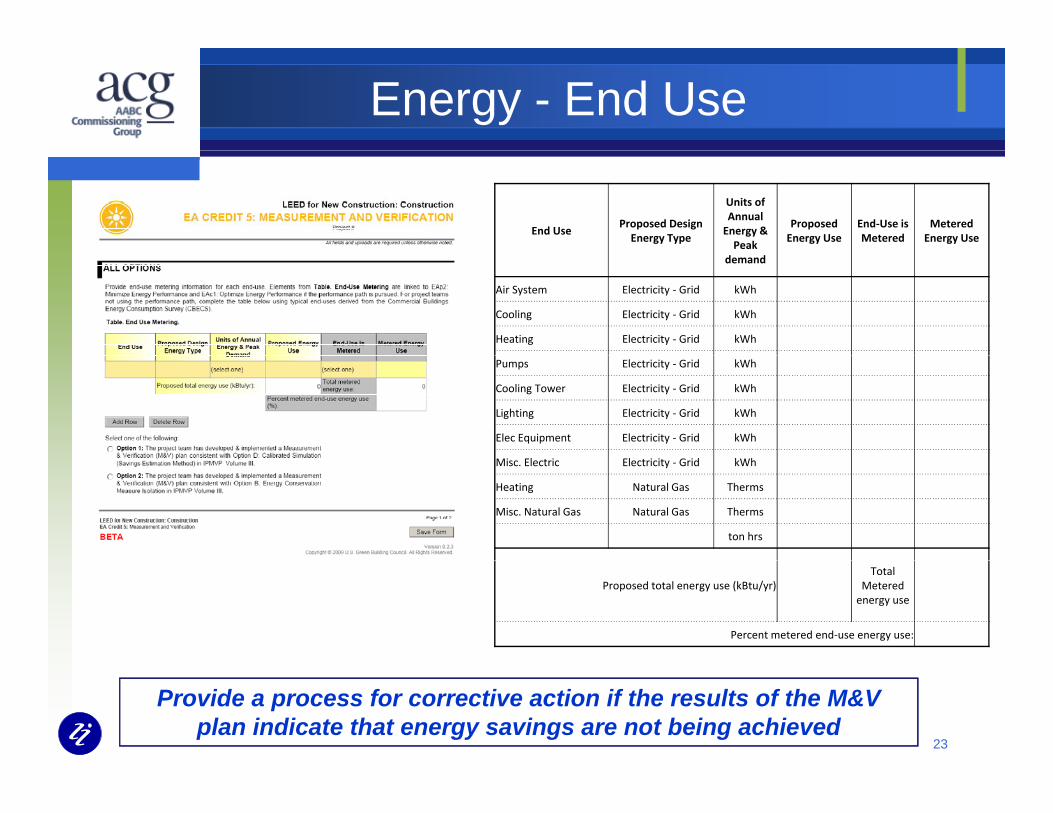
Energy - End Use
End UseProposed Design Energy Type
Units of Annual Energy & Peak
Proposed Energy Use
End‐Use is Metered
Metered Energy Use
demand
Air System Electricity ‐ Grid kWh
Cooling Electricity ‐ Grid kWh
Heating Electricity ‐ Grid kWh
Pumps Electricity ‐ Grid kWh
Cooling Tower Electricity ‐ Grid kWh
Lighting Electricity ‐ Grid kWh
Elec Equipment Electricity ‐ Grid kWh
l l d k hMisc. Electric Electricity ‐ Grid kWh
Heating Natural Gas Therms
Misc. Natural Gas Natural Gas Therms
ton hrs
Proposed total energy use (kBtu/yr)Total
Metered energy use
Percent metered end‐use energy use:
23
Provide a process for corrective action if the results of the M&V plan indicate that energy savings are not being achieved

Limitations and Uncertainty
Option D LimitationsReq ires significant effort Requires significant effort
Use specialized software that requires significant experience to use Results vary with effort (and $$$) expended Requires measurement for calibration
Uncertainty Modeling assumptions and effort Modeling assumptions and effort Meter data measurement uncertainty Uncertainty associated with the weather data Non-weather-dependent load is assumed to be proportional to
number of scheduled hours
24

Thank You!Thank You!
Zodiac
Baskar SubbaraoPE, CxA, CBCP, CMVP, LEED APhttp://www zodiacintl comhttp://[email protected]