Measurement Science and Standards to Support the ... M4 Tarlov Biomanufacturing Summit Lowell... ·...
34
Material Measurement Lab Measurement Science and Standards to Support the Development of Safe and Effective Protein Therapeutics 3rd Annual Biopharmaceutical Summit on PAT and QbD in the Biopharmaceutical Industry May 29, 2014 Michael J. Tarlov Program Coordinator of NIST Biomanufacturing Program Chief, Biomolecular Measurement Division Material Measurement Laboratory
Transcript of Measurement Science and Standards to Support the ... M4 Tarlov Biomanufacturing Summit Lowell... ·...
Material Measurement Lab
Measurement Science and Standards to
Support the Development of Safe and
Effective Protein Therapeutics
3rd Annual Biopharmaceutical Summit on PAT and
QbD in the Biopharmaceutical Industry
May 29, 2014
Michael J. Tarlov
Program Coordinator of NIST Biomanufacturing Program
Chief, Biomolecular Measurement Division
Material Measurement Laboratory

NIST Program in Biomanufacturing
Measurement science, standards, and
data to support development,
manufacturing & regulatory approval of
biologic drugs
Developed from Over 5 Years of Stakeholder Input:
NIST Criteria for Priority Setting: 1. Magnitude/urgency of industrial need
2. Correspondence between need and NIST mission to develop
infrastructural technologies
3. Potential impact of NIST involvement
4. Can NIST respond with a timely, high quality product
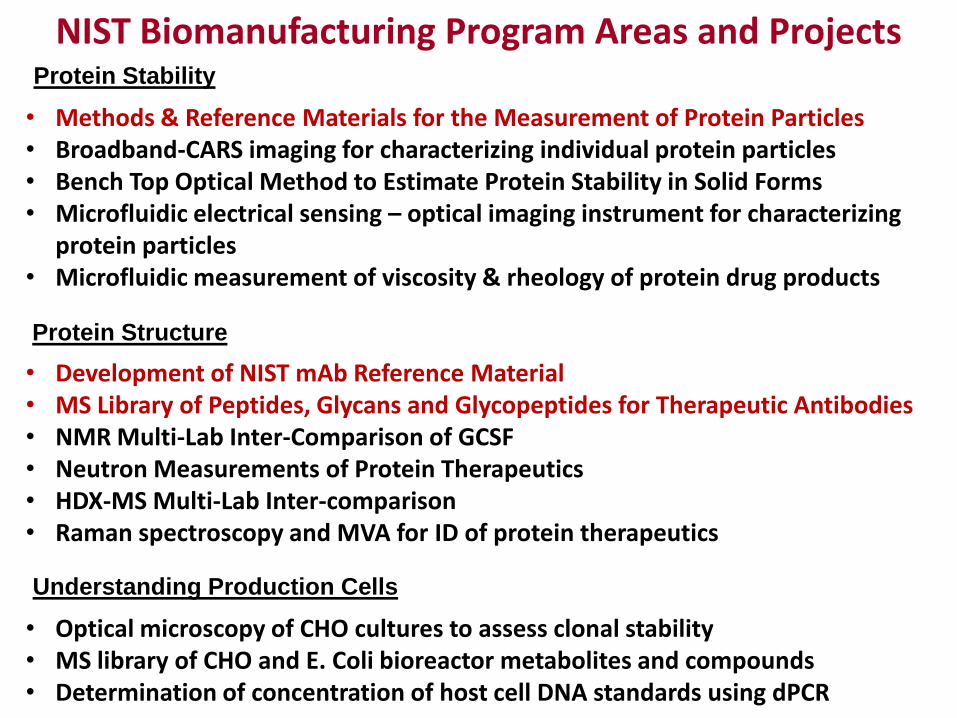
NIST Biomanufacturing Program Areas and Projects
• Methods & Reference Materials for the Measurement of Protein Particles • Broadband-CARS imaging for characterizing individual protein particles • Bench Top Optical Method to Estimate Protein Stability in Solid Forms • Microfluidic electrical sensing – optical imaging instrument for characterizing
protein particles • Microfluidic measurement of viscosity & rheology of protein drug products
• Development of NIST mAb Reference Material • MS Library of Peptides, Glycans and Glycopeptides for Therapeutic Antibodies • NMR Multi-Lab Inter-Comparison of GCSF • Neutron Measurements of Protein Therapeutics • HDX-MS Multi-Lab Inter-comparison • Raman spectroscopy and MVA for ID of protein therapeutics
• Optical microscopy of CHO cultures to assess clonal stability • MS library of CHO and E. Coli bioreactor metabolites and compounds • Determination of concentration of host cell DNA standards using dPCR
Protein Stability
Protein Structure
Understanding Production Cells
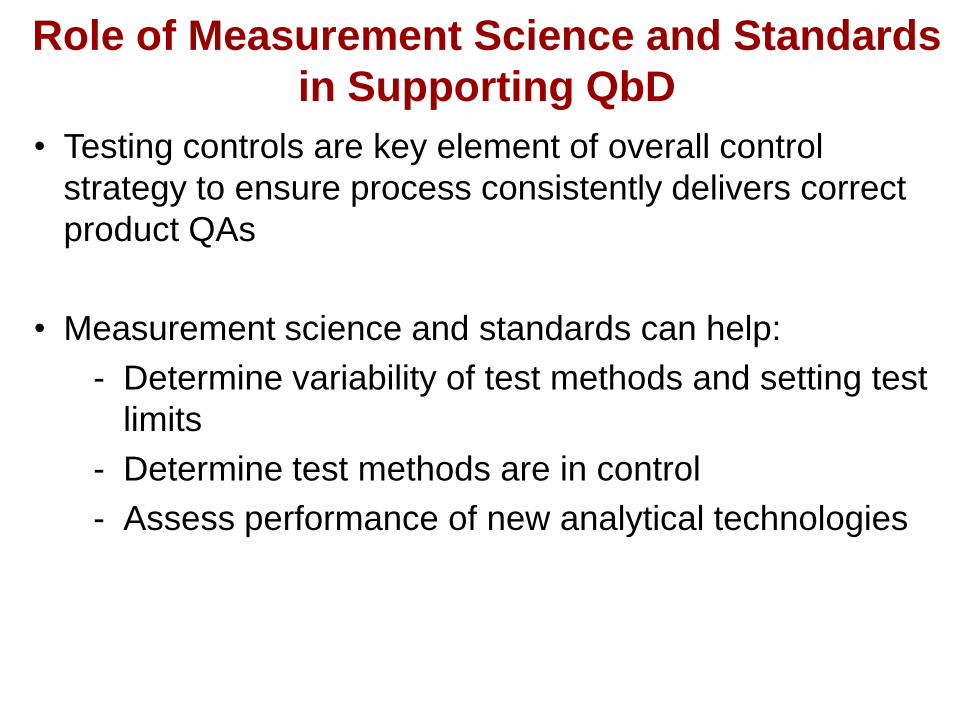
Role of Measurement Science and Standards
in Supporting QbD
• Testing controls are key element of overall control
strategy to ensure process consistently delivers correct
product QAs
• Measurement science and standards can help:
- Determine variability of test methods and setting test
limits
- Determine test methods are in control
- Assess performance of new analytical technologies
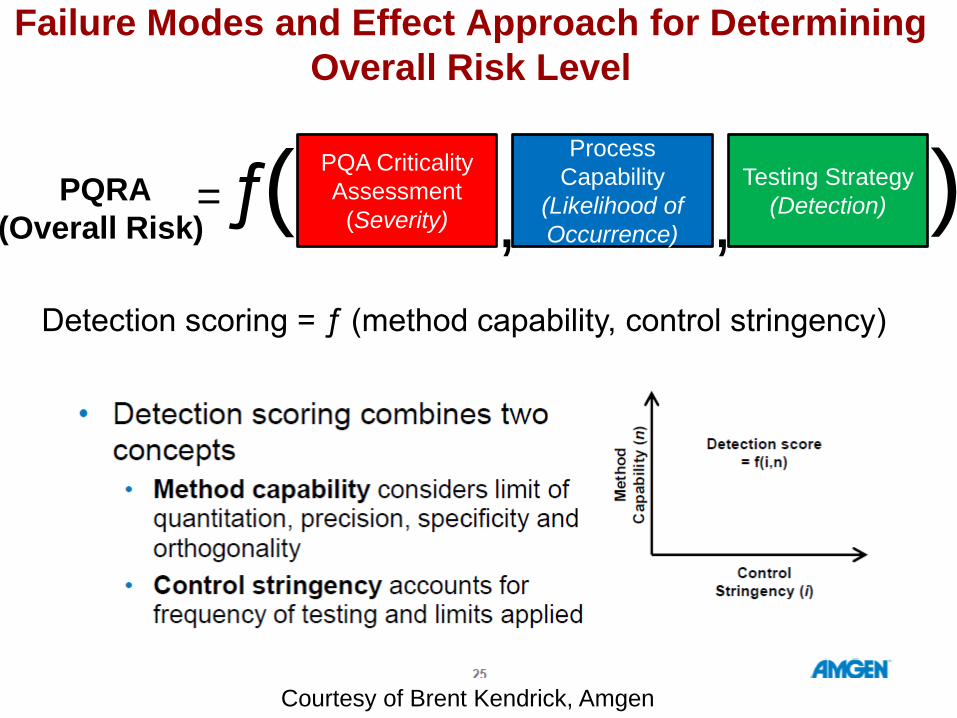
Failure Modes and Effect Approach for Determining
Overall Risk Level
PQRA
(Overall Risk) = ƒ
PQA Criticality
Assessment
(Severity)
Process
Capability
(Likelihood of
Occurrence)
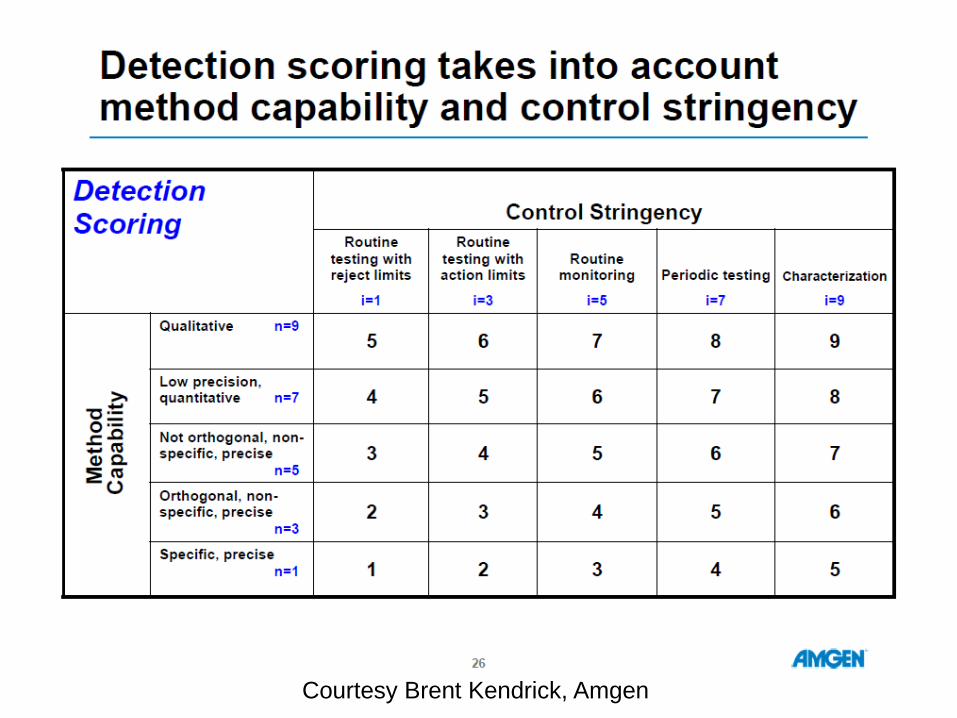
Testing Strategy
(Detection) (
(
, , Detection scoring = ƒ (method capability, control stringency)
Courtesy of Brent Kendrick, Amgen

Protein Particle Measurements and Standards
Activities
Goals:
• Reduce risks to safety and efficacy of biotherapeutics by supporting
accurate counting and characterization of particles
• Support industry in understanding involvement of particles in biological
pathways, e.g., immunogenicity
Activities:
1. Measurement science: appropriate models for instrument response
- Identify and characterize physical properties of protein particles
relevant to counting method considered
2. Reference materials: materials that mimic protein particles
3. Measurement tools: new orthogonal particle measurement
technologies

Light Obscuration Scaling: Instrument Model
Approach:
1. Model small particles as spheroids; use scaling approximations for large
particles
2. Obtain the average refractive index of the particles from Quantitative Phase
Imaging
3. Calculate the instrument response using Rayleigh-Gans light scattering
models
4. Transform the LO data using the instrument response curve to estimate the
actual particle diameter corresponding to the measured diameters.
Transformation scales particle diameter, not count
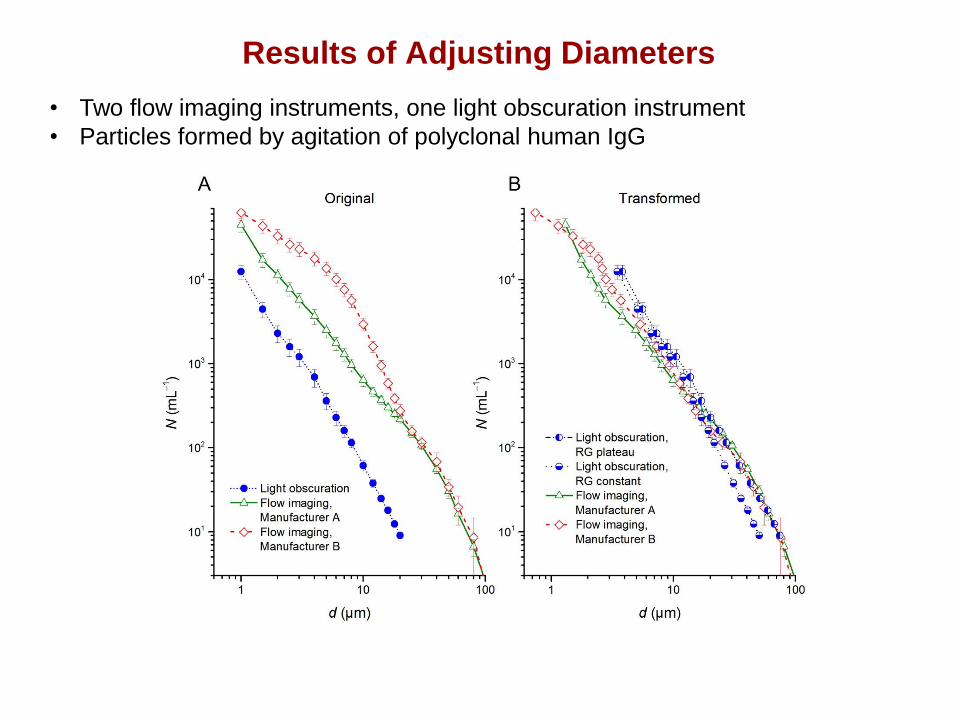
Results of Adjusting Diameters
• Two flow imaging instruments, one light obscuration instrument
• Particles formed by agitation of polyclonal human IgG

Candidate Particle Reference Material: Abraded
Fluoropolymer ETFE polymer (tetrafluoroethlyene/ethylene copolymer) has desirable
properties:
1. Rugged, with refractive index of 1.40—close to that of protein
2. Appears like protein with mechanical abrasion process—oscillatory
motion pulls off irregular, tangled particles
3. Producing polydisperse suspension as reference material, 1 to 25 µm
SEM images of ETFE particles
on alumina filters
Protein particles ETFE
particles
Light Obscuration Flow Imaging
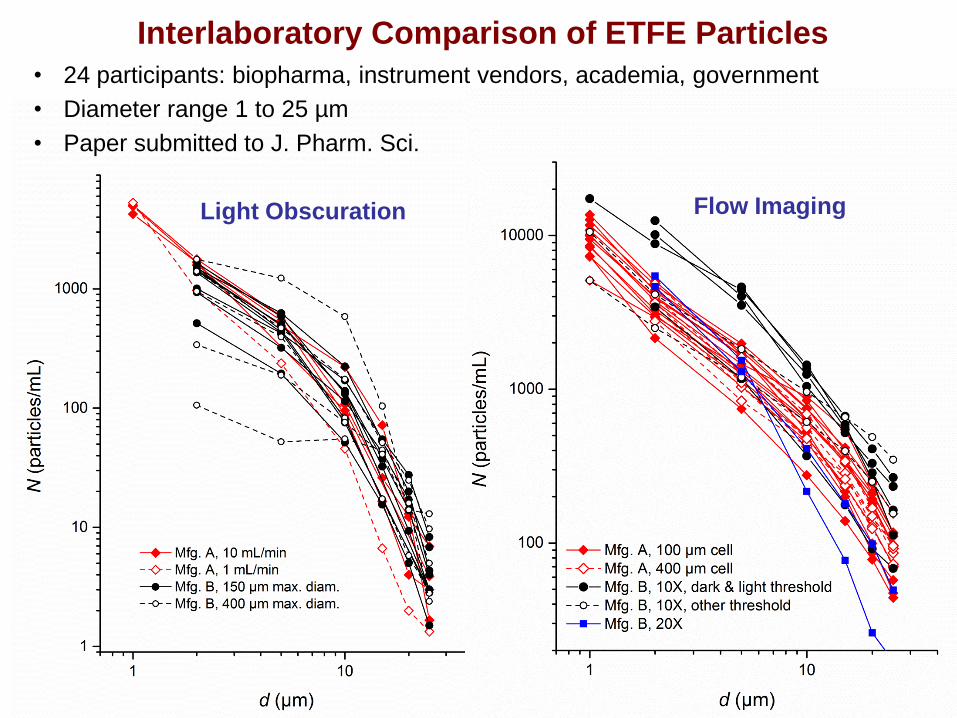
Interlaboratory Comparison of ETFE Particles
• 24 participants: biopharma, instrument vendors, academia, government
• Diameter range 1 to 25 µm
• Paper submitted to J. Pharm. Sci.
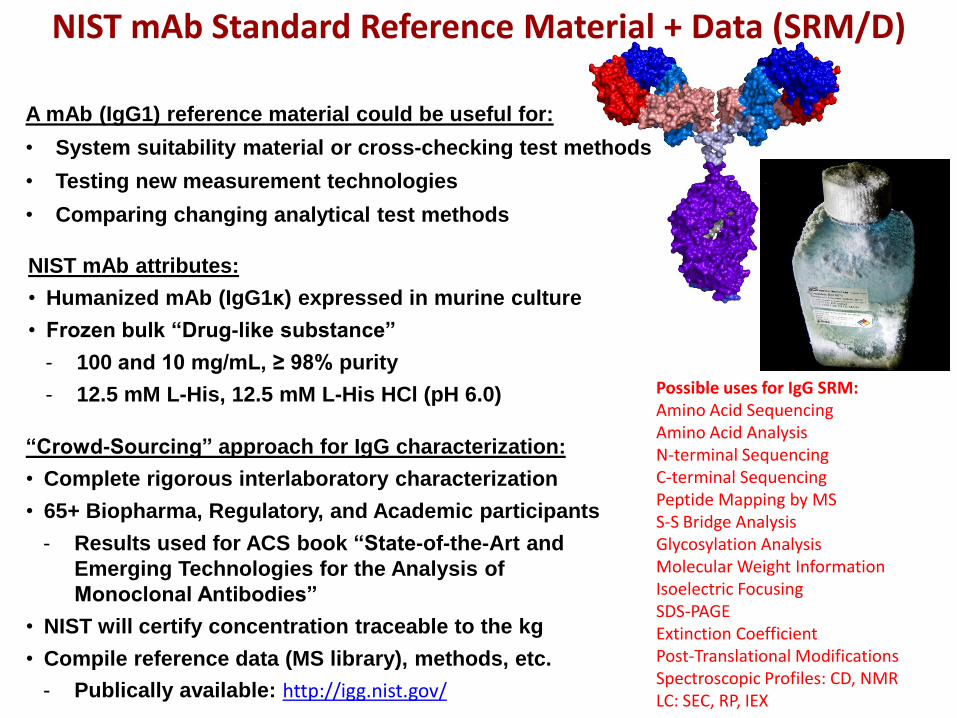
NIST mAb Standard Reference Material + Data (SRM/D)
NIST mAb attributes:
• Humanized mAb (IgG1κ) expressed in murine culture
• Frozen bulk “Drug-like substance”
- 100 and 10 mg/mL, ≥ 98% purity
- 12.5 mM L-His, 12.5 mM L-His HCl (pH 6.0) Possible uses for IgG SRM: Amino Acid Sequencing Amino Acid Analysis N-terminal Sequencing C-terminal Sequencing Peptide Mapping by MS S-S Bridge Analysis Glycosylation Analysis Molecular Weight Information Isoelectric Focusing SDS-PAGE Extinction Coefficient Post-Translational Modifications Spectroscopic Profiles: CD, NMR LC: SEC, RP, IEX
A mAb (IgG1) reference material could be useful for:
• System suitability material or cross-checking test methods
• Testing new measurement technologies
• Comparing changing analytical test methods
“Crowd-Sourcing” approach for IgG characterization:
• Complete rigorous interlaboratory characterization
• 65+ Biopharma, Regulatory, and Academic participants
- Results used for ACS book “State-of-the-Art and
Emerging Technologies for the Analysis of
Monoclonal Antibodies”
• NIST will certify concentration traceable to the kg
• Compile reference data (MS library), methods, etc.
- Publically available: http://igg.nist.gov/
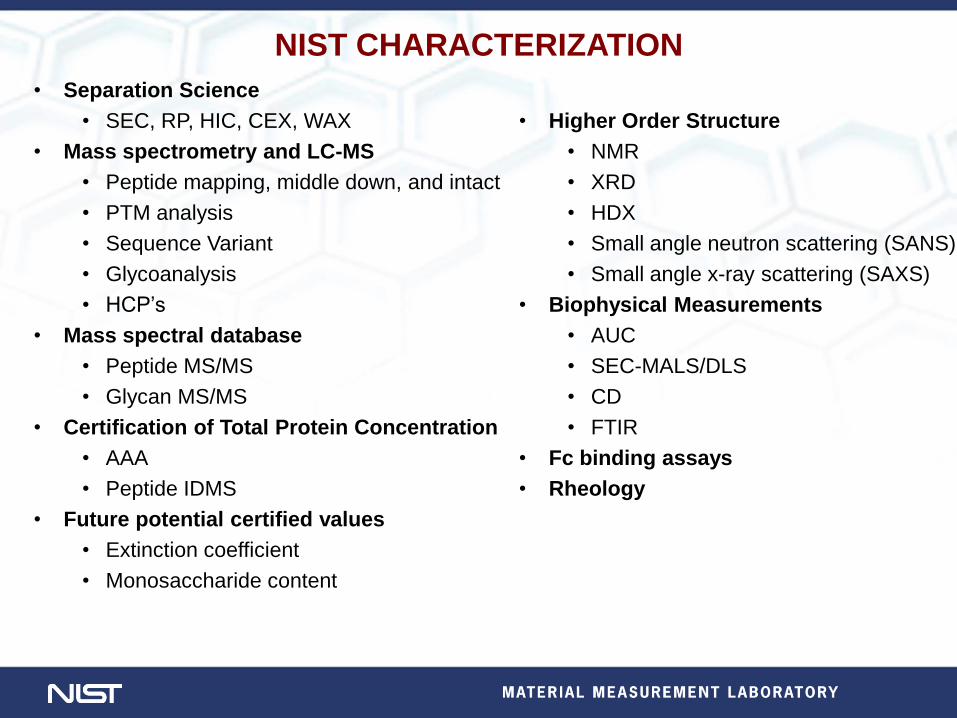
NIST CHARACTERIZATION
• Separation Science
• SEC, RP, HIC, CEX, WAX
• Mass spectrometry and LC-MS
• Peptide mapping, middle down, and intact
• PTM analysis
• Sequence Variant
• Glycoanalysis
• HCP’s
• Mass spectral database
• Peptide MS/MS
• Glycan MS/MS
• Certification of Total Protein Concentration
• AAA
• Peptide IDMS
• Future potential certified values
• Extinction coefficient
• Monosaccharide content
• Higher Order Structure
• NMR
• XRD
• HDX
• Small angle neutron scattering (SANS)
• Small angle x-ray scattering (SAXS)
• Biophysical Measurements
• AUC
• SEC-MALS/DLS
• CD
• FTIR
• Fc binding assays
• Rheology

Building a Comprehensive MS Reference Library of Peptides,
Glycans, & Glycopeptides of the NIST mAb
NIST/EPA/NIH Mass Spectral
Library
EI spectra of 212K compounds
Peptide Library
500,000 peptides for 8
species
Small Molecule Tandem MS
7K compounds Ion trap/
Collision cell
IgG Library
with NIST reference material
glycans
glycopeptides peptides
intact & large fragments?
• NIST MS reference libraries most widely used in world
• No comprehensive MS spectral library of mAbs exists
• Build integrated IgG MS library of:
– Tryptic peptides – all modifications
– Glycans – all forms
– Glycopeptides
High quality MS reference data
– Spectra for ion trap and collision cells (range
of energies) for various precursor ions
– Consensus spectra: peak voting; intensity
averaging; reject contaminants & noise
– Quality control: % explained peaks, proper
energy dependence, precursor purity
• Future mAb Standard Reference Material will include MS
reference data (SRM/D)
NA2G1F from Rituximab Matches Library
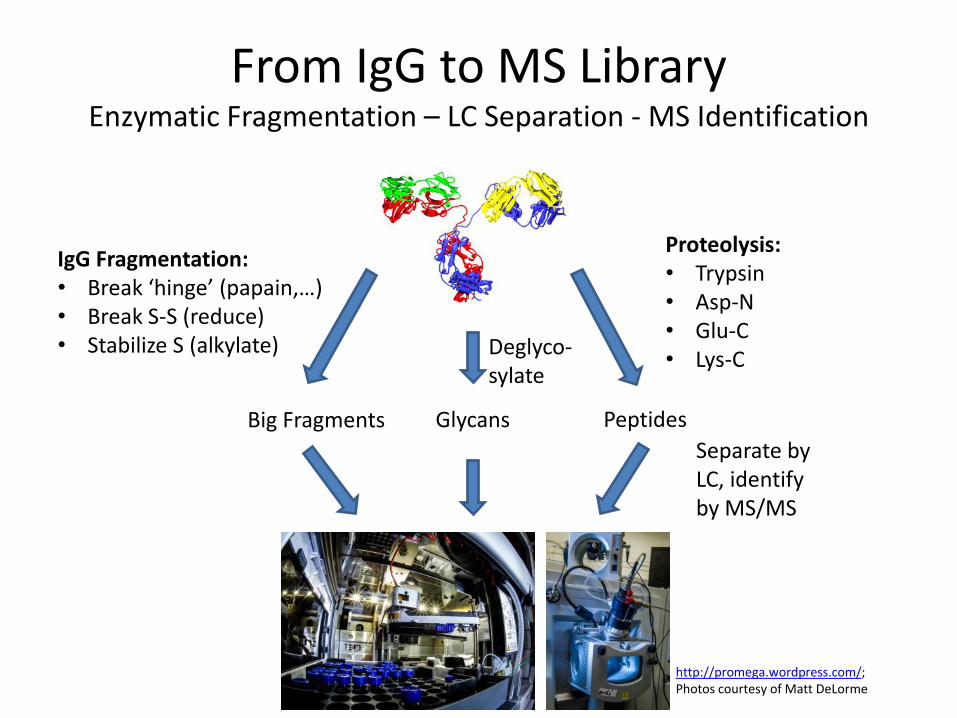
From IgG to MS Library Enzymatic Fragmentation – LC Separation - MS Identification
http://promega.wordpress.com/; Photos courtesy of Matt DeLorme
IgG Fragmentation: • Break ‘hinge’ (papain,…) • Break S-S (reduce) • Stabilize S (alkylate)
Glycans Big Fragments Peptides
Proteolysis: • Trypsin • Asp-N • Glu-C • Lys-C
Deglyco-sylate
Separate by LC, identify by MS/MS
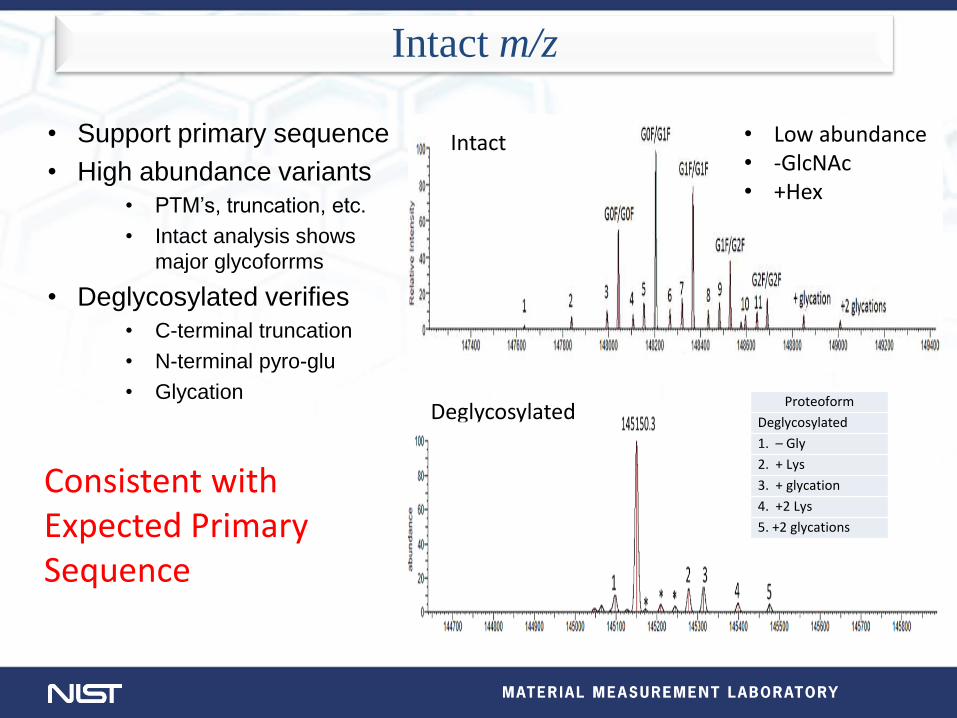
Intact m/z
Consistent with Expected Primary Sequence
• Support primary sequence
• High abundance variants
• PTM’s, truncation, etc.
• Intact analysis shows
major glycoforrms
• Deglycosylated verifies
• C-terminal truncation
• N-terminal pyro-glu
• Glycation Deglycosylated
Proteoform
Deglycosylated
1. – Gly
2. + Lys
3. + glycation
4. +2 Lys
5. +2 glycations
Intact • Low abundance • -GlcNAc • +Hex
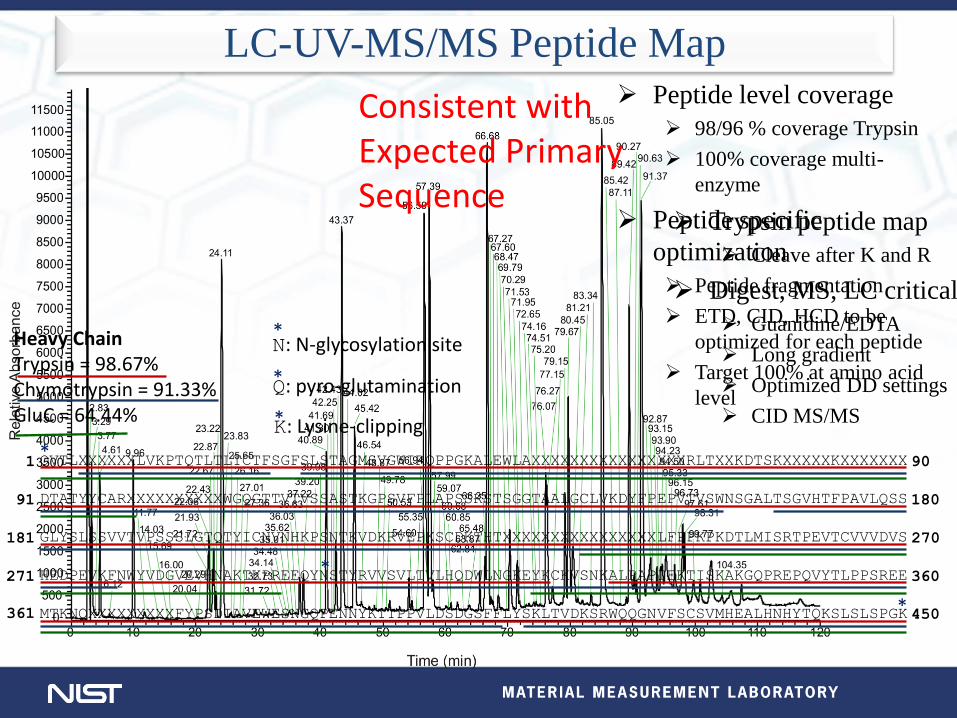
LC-UV-MS/MS Peptide Map
Trypsin peptide map
Cleave after K and R
Digest, MS, LC critical
Guanidine/EDTA
Long gradient
Optimized DD settings
CID MS/MS
Heavy Chain Trypsin = 98.67% Chymotrypsin = 91.33% GluC = 64.44%
* N: N-glycosylation site
K: Lysine-clipping *
* Q: pyro-glutamination
Peptide level coverage
98/96 % coverage Trypsin
100% coverage multi-
enzyme
Peptide specific
optimization
Peptide fragmentation
ETD, CID, HCD to be
optimized for each peptide
Target 100% at amino acid
level
QVTLXXXXXXLVKPTQTLTLTCTFSGFSLSTAGMSVGWIRQPPGKALEWLAXXXXXXXXXXXXXXXXRLTXXKDTSKXXXXXKXXXXXXX
DTATYYCARXXXXXXXXXXWGQGTTVTVSSASTKGPSVFPLAPSSKSTSGGTAALGCLVKDYFPEPVTVSWNSGALTSGVHTFPAVLQSS
GLYSLSSVVTVPSSSLGTQTYICNVNHKPSNTKVDKRVEPKSCDKTHTXXXXXXXXXXXXXXXXLFPPKPKDTLMISRTPEVTCVVVDVS
HEDPEVKFNWYVDGVEVHNAKTKPREEQYNSTYRVVSVLTVLHQDWLNGKEYKCKVSNKALPAPIEKTISKAKGQPREPQVYTLPPSREE
MTKNQXXXXXXXXXFYPSDIAVEWESNGQPENNYKTTPPVLDSDGSFFLYSKLTVDKSRWQQGNVFSCSVMHEALHNHYTQKSLSLSPGK
270
360
90
180
450
1
91
181
271
361
*
*
*
Consistent with Expected Primary Sequence
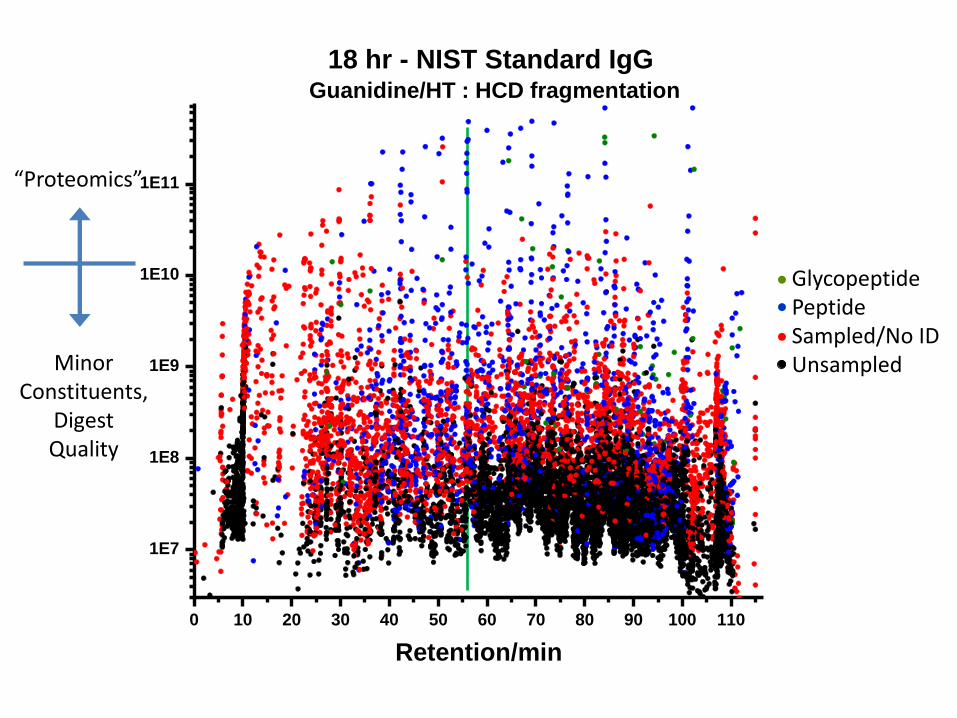
0 10 20 30 40 50 60 70 80 90 100 110
1E7
1E8
1E9
1E10
1E11
Retention/min
18 hr - NIST Standard IgG Guanidine/HT : HCD fragmentation
“Proteomics”
Minor Constituents,
Digest Quality
Glycopeptide Peptide Sampled/No ID Unsampled
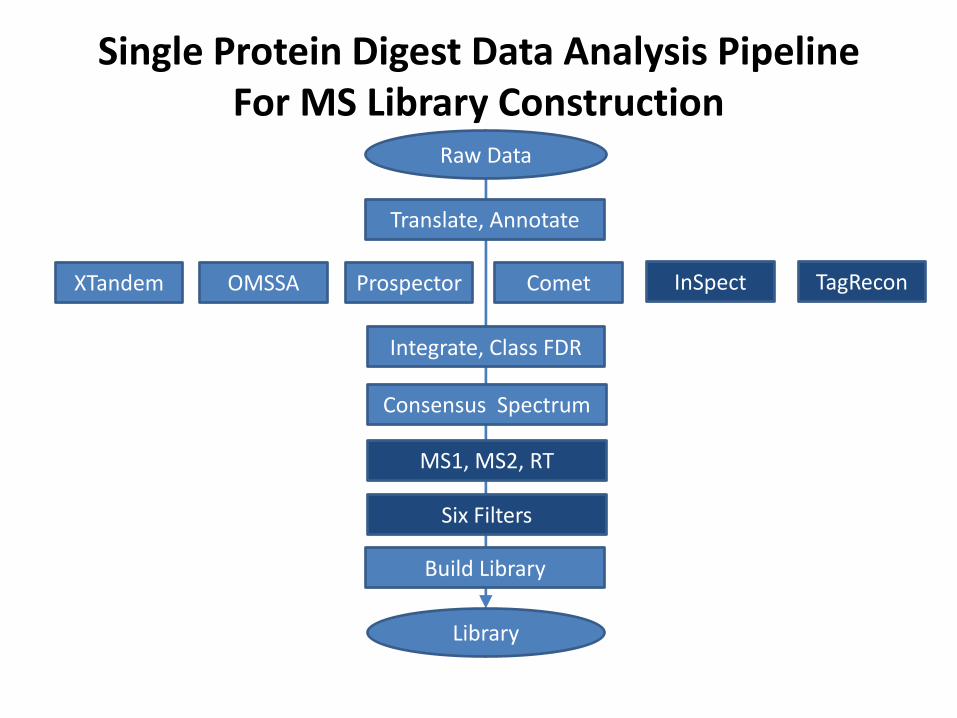
Single Protein Digest Data Analysis Pipeline For MS Library Construction
Raw Data
Translate, Annotate
XTandem Prospector OMSSA Comet
Integrate, Class FDR
Consensus Spectrum
Six Filters
Library
Build Library
InSpect TagRecon
MS1, MS2, RT

Class Common or Uncommon
Peptide Class Spectra
1 C Simple Tryptic 567
2 C Tryptic with Expected Missed-Cleavage 461
3 C Common Modifications 369
4 C In-Source Semitryptic 1010
5 U In-Solution Semitryptic
6 U Artifacts and PTMs 372
7 U Unexpected Missed-Cleavage 689
8 U Under/Over Alkylation 42
Total 3510
NIST mAb HCD Tryptic Peptide Library
Peptide Classes
Peptide Modifications
Modification Delta mass Modified site Spectra
Oxidation +15.9949 M, H, W 778
Deamidation +0.9840 N, Q 96
Cation:Na +21.9819 D, E 84
Cation:Fe[II] +53.9193 L, G, S, T, P, V… 62
Formyl +27.9949 N-terminus, K, S, T 50
Pyro-carbamidomethyl +39.9949 C at N-terminus 24
Gln->pyro-Glu -17.0265 Q at N-terminus 21
Dehydrated -18.0106 D, S, T 15
Glu->pyro-Glu -18.0106 E at N-terminus 14
Cation:Ca[II] +37.9469 I/L, P, S, T, G… 10
Methyl +14.0157 K, H 9
Dioxidation +31.989829 M,W 8
Carbamyl +43.0058 N-terminus, K,T,M 8
Trioxidation +47.984744 W 3
Preliminary: More Mods to Come!
Conclusions
• NIST measurement science and standards support QbD for
protein biologics through improved characterization of CQAs
and development of methods specific for CQAs
• Particle measurement science and standards aid in more
accurate sizing and counting of protein particles
• NIST monoclonal antibody reference material will find use in:
- Assessing method variability, utility, etc.
- Determining performance of new technologies
- System suitability testing/method qualification
- Source of widely available historical data
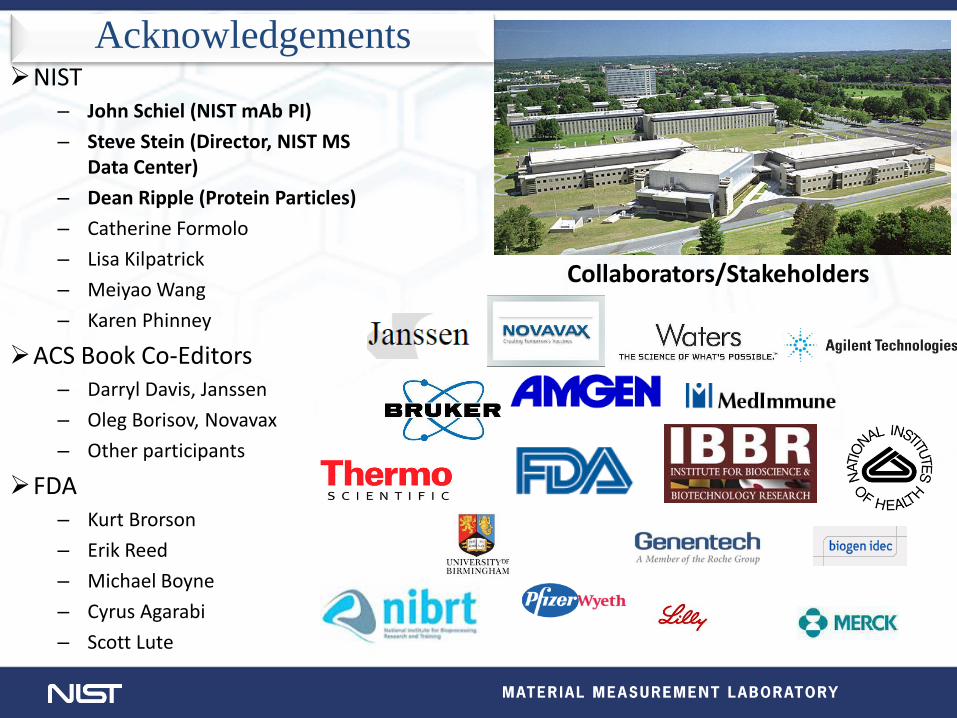
Collaborators/Stakeholders
Acknowledgements NIST
– John Schiel (NIST mAb PI)
– Steve Stein (Director, NIST MS Data Center)
– Dean Ripple (Protein Particles)
– Catherine Formolo
– Lisa Kilpatrick
– Meiyao Wang
– Karen Phinney
ACS Book Co-Editors – Darryl Davis, Janssen
– Oleg Borisov, Novavax
– Other participants
FDA – Kurt Brorson
– Erik Reed
– Michael Boyne
– Cyrus Agarabi
– Scott Lute

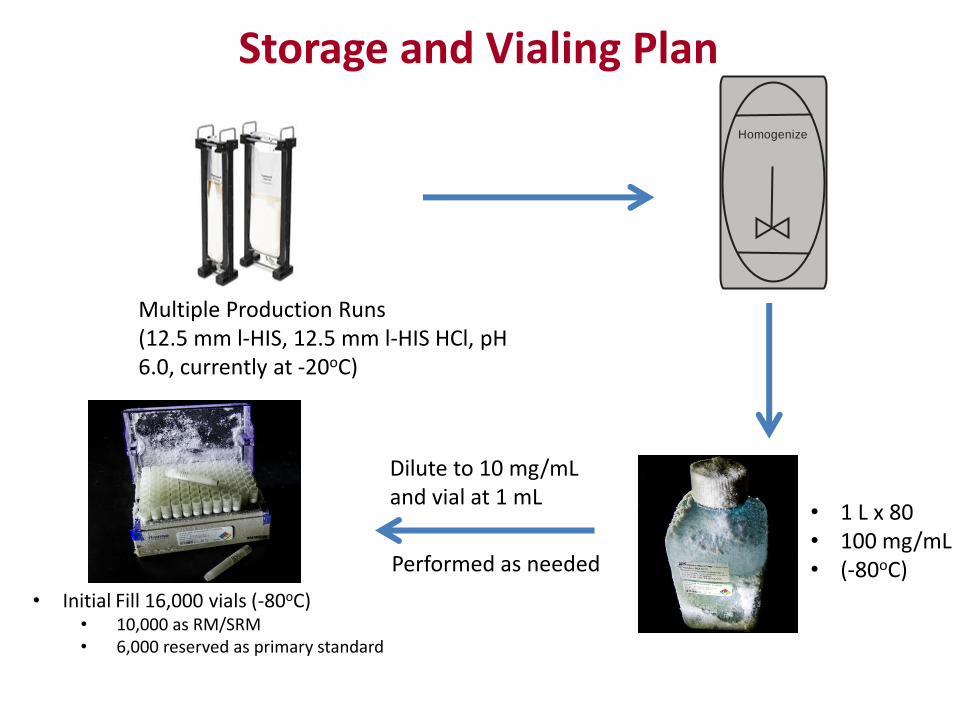
Homogenize
Storage and Vialing Plan
Multiple Production Runs (12.5 mm l-HIS, 12.5 mm l-HIS HCl, pH 6.0, currently at -20oC)
• 1 L x 80 • 100 mg/mL • (-80oC)
Dilute to 10 mg/mL and vial at 1 mL
Performed as needed
• Initial Fill 16,000 vials (-80oC) • 10,000 as RM/SRM • 6,000 reserved as primary standard
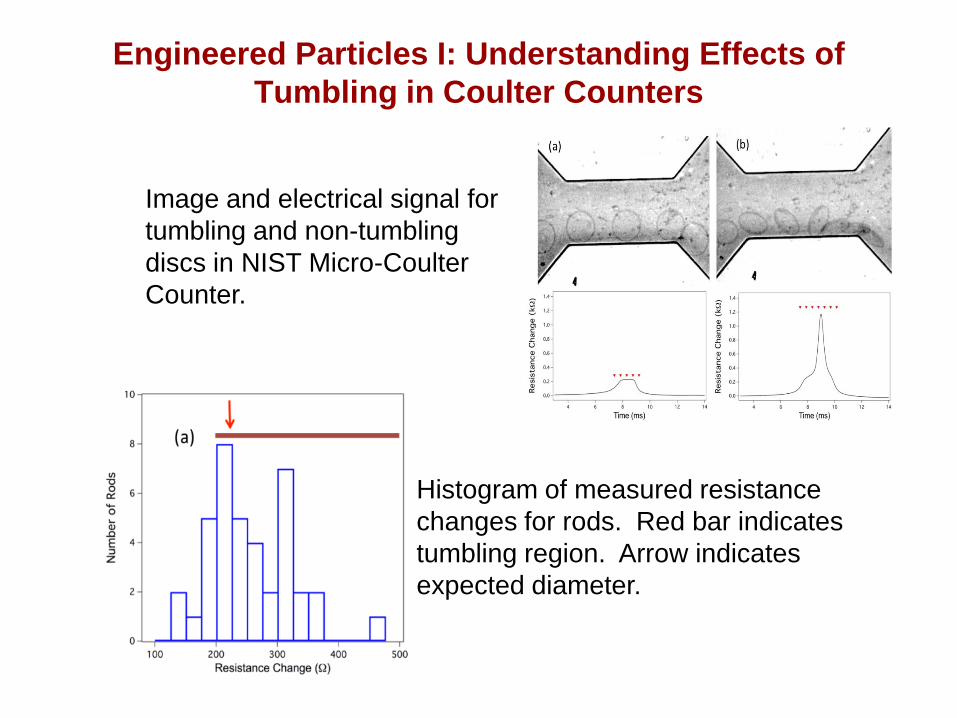
Image and electrical signal for
tumbling and non-tumbling
discs in NIST Micro-Coulter
Counter.
Histogram of measured resistance
changes for rods. Red bar indicates
tumbling region. Arrow indicates
expected diameter.
Engineered Particles I: Understanding Effects of
Tumbling in Coulter Counters
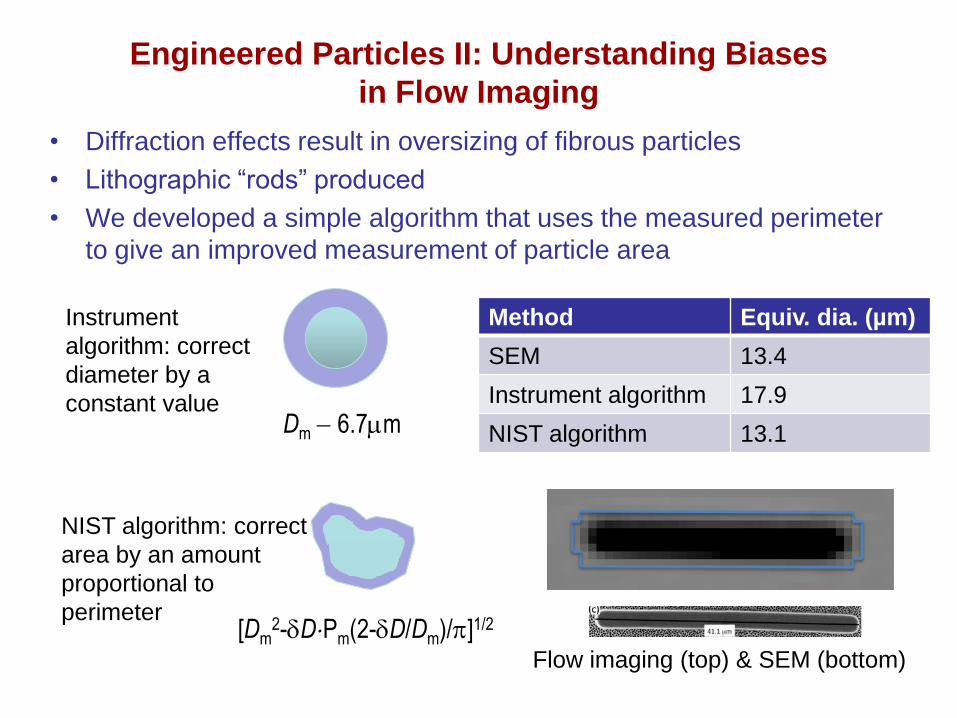
Engineered Particles II: Understanding Biases
in Flow Imaging
• Diffraction effects result in oversizing of fibrous particles
• Lithographic “rods” produced
• We developed a simple algorithm that uses the measured perimeter
to give an improved measurement of particle area
Dm 6.7mm
[Dm2-dDPm(2-dD/Dm)/p]1/2
Instrument
algorithm: correct
diameter by a
constant value
NIST algorithm: correct
area by an amount
proportional to
perimeter
Method Equiv. dia. (µm)
SEM 13.4
Instrument algorithm 17.9
NIST algorithm 13.1
Flow imaging (top) & SEM (bottom)

Flow Imaging: Instrument Model
Approach:
1. Measure diameters of silica beads suspended in water/glycerol mixtures
2. Adjust the measured diameter for protein particles by the bias measured
for silica beads
Transformation scales particle diameter, not count
Standard Measurements and Standard Materials
Testimony before the U.S. House of Representatives Committee on Science and Technology (2009) on the need for measurement standards by S. Kozlowski (CDER) , A. Mire-Sluis (Amgen), and Willie E. May (NIST).
“With the development of new analytical methods comes the need for new standards to evaluate them.”
S. Kozlowski, FDA
• Well characterized and certified standard is an ideal means to:
• Assess precision and accuracy across methods and labs
• Identify potential gaps and develop new technologies to fill them
• Assess capabilities of new analytical technologies
• Ease regulatory burden on reviewers and sponsors by allowing them to assess methods and demonstrate system suitability by evaluation of the standard
Need for a Well Characterized Reference Material
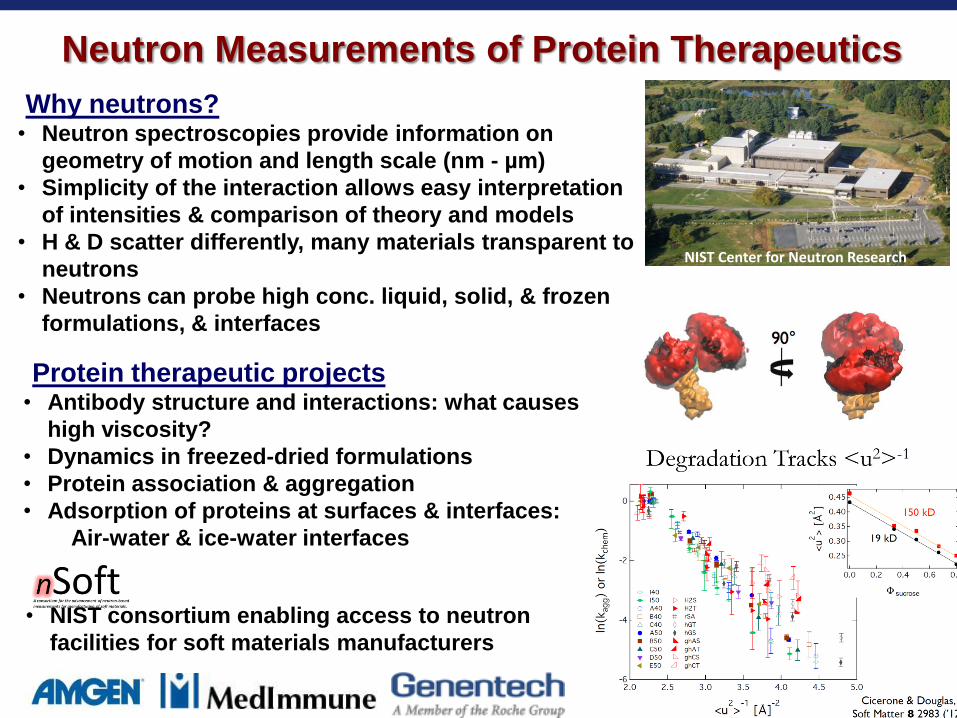
Neutron Measurements of Protein Therapeutics
NIST Center for Neutron Research
Protein in freeze-dried glass
• Neutron spectroscopies provide information on
geometry of motion and length scale (nm - µm)
• Simplicity of the interaction allows easy interpretation
of intensities & comparison of theory and models
• H & D scatter differently, many materials transparent to
neutrons
• Neutrons can probe high conc. liquid, solid, & frozen
formulations, & interfaces
Why neutrons?
Protein therapeutic projects • Antibody structure and interactions: what causes
high viscosity?
• Dynamics in freezed-dried formulations
• Protein association & aggregation
• Adsorption of proteins at surfaces & interfaces:
Air-water & ice-water interfaces
• NIST consortium enabling access to neutron
facilities for soft materials manufacturers
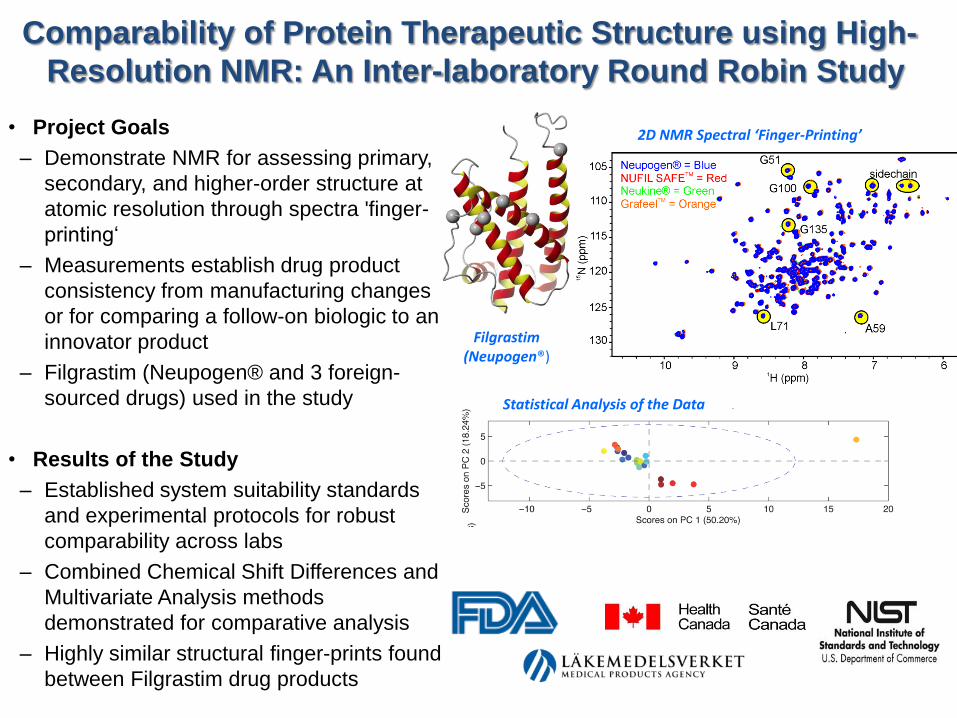
Comparability of Protein Therapeutic Structure using High-
Resolution NMR: An Inter-laboratory Round Robin Study
• Project Goals
– Demonstrate NMR for assessing primary,
secondary, and higher-order structure at
atomic resolution through spectra 'finger-
printing‘
– Measurements establish drug product
consistency from manufacturing changes
or for comparing a follow-on biologic to an
innovator product
– Filgrastim (Neupogen® and 3 foreign-
sourced drugs) used in the study
• Results of the Study
– Established system suitability standards
and experimental protocols for robust
comparability across labs
– Combined Chemical Shift Differences and
Multivariate Analysis methods
demonstrated for comparative analysis
– Highly similar structural finger-prints found
between Filgrastim drug products
Filgrastim (Neupogen®)
2D NMR Spectral ‘Finger-Printing’
Statistical Analysis of the Data
Utility of a NIST mAb Reference Material
• Used to distinguish analytical variability from product
variability and cross-check analytical methods
• Publically available, certified material with historical
characterization data representative of a large class
of biotherapeutic
• Used to reconcile differences between orthogonal
methods measuring same attribute
• Used in qualification or assessment of changing
analytical test methods
• Used to assess performance of new analytical
technologies
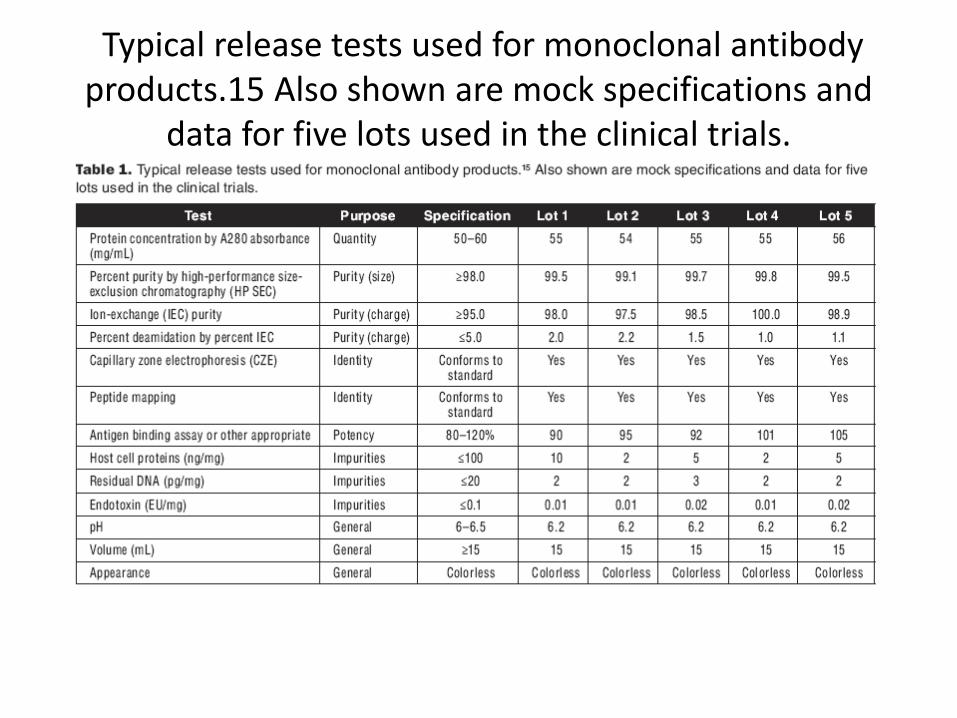
Typical release tests used for monoclonal antibody products.15 Also shown are mock specifications and
data for five lots used in the clinical trials.

Illustration of an approach for setting specifications for product quality attributes
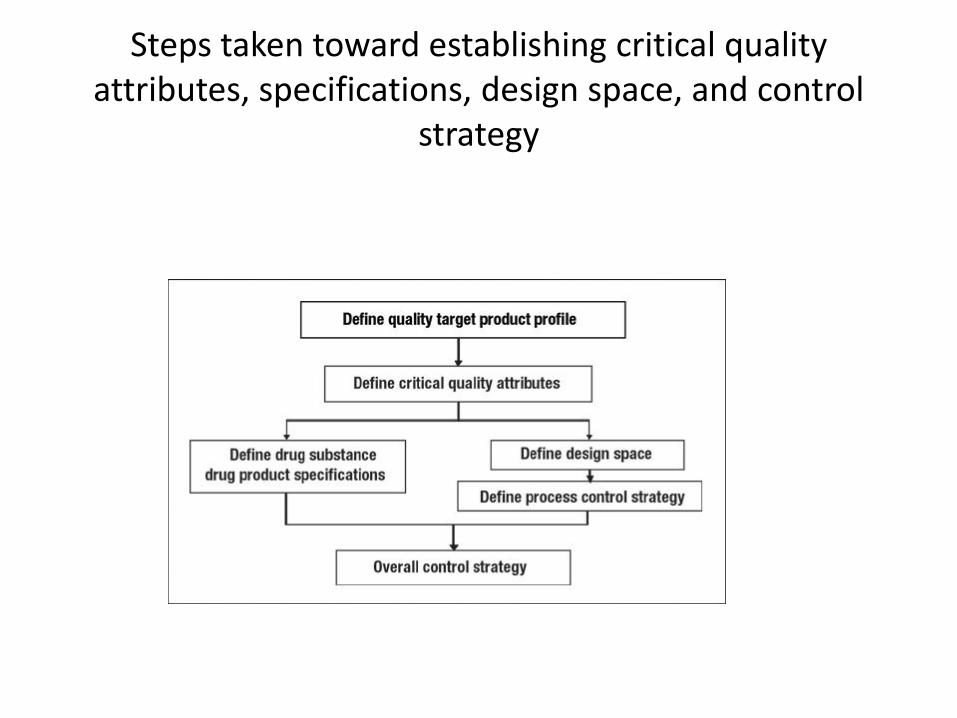
Steps taken toward establishing critical quality attributes, specifications, design space, and control
strategy
Courtesy Brent Kendrick, Amgen