Measurement report: Chemical characteristics of PM during ...
12
Atmos. Chem. Phys., 21, 3181–3192, 2021 https://doi.org/10.5194/acp-21-3181-2021 © Author(s) 2021. This work is distributed under the Creative Commons Attribution 4.0 License. Measurement report: Chemical characteristics of PM 2.5 during typical biomass burning season at an agricultural site of the North China Plain Linlin Liang 1 , Guenter Engling 2,a , Chang Liu 1 , Wanyun Xu 1 , Xuyan Liu 3 , Yuan Cheng 4 , Zhenyu Du 5 , Gen Zhang 1 , Junying Sun 1 , and Xiaoye Zhang 1 1 State Key Laboratory of Severe Weather & Key Laboratory for Atmospheric Chemistry, Chinese Academy of Meteorological Sciences, Beijing 100081, China 2 Division of Atmospheric Sciences, Desert Research Institute, Reno, NV 89512, USA 3 National Satellite Meteorological Center, Beijing 100081, China 4 School of Environment, Harbin Institute of Technology, Harbin 150001, China 5 National Research Center for Environmental Analysis and Measurement, Beijing 100029, China a now at: California Air Resources Board, El Monte, CA 91731, USA Correspondence: Linlin Liang ([email protected]) Received: 27 September 2020 – Discussion started: 9 October 2020 Revised: 21 January 2021 – Accepted: 21 January 2021 – Published: 3 March 2021 Abstract. Biomass burning activities are ubiquitous in China, especially in northern China, where there is a large ru- ral population and winter heating custom. Biomass burning tracers (i.e., levoglucosan, mannosan and potassium (K + )), as well as other chemical components, were quantified at a rural site (Gucheng, GC) in northern China from 15 October to 30 November, during a transition heating season, when the field burning of agricultural residue was becoming in- tense. The measured daily average concentrations of levoglu- cosan, mannosan and K + in PM 2.5 (particulate matter with aerodynamic diameters less than 2.5 μm) during this study were 0.79 ± 0.75, 0.03 ± 0.03 and 1.52 ± 0.62 μg m -3 , re- spectively. Carbonaceous components and biomass burning tracers showed higher levels during nighttime than daytime, while secondary inorganic ions were enhanced during day- time. An episode with high levels of biomass burning trac- ers was encountered at the end of October 2016, with high levoglucosan at 4.37 μg m -3 . Based on the comparison of chemical components during different biomass burning pol- lution periods, it appeared that biomass combustion can obvi- ously elevate carbonaceous component levels, whereas there was essentially no effect on secondary inorganic aerosols in the ambient air. Moreover, the levoglucosan / mannosan ra- tios during different biomass burning pollution periods re- mained at high values (in the range of 18.3–24.9); however, the levoglucosan / K + ratio was significantly elevated during the intensive biomass burning pollution period (1.67) when air temperatures were decreasing, which was substantially higher than in other biomass burning periods (averaged at 0.47). 1 Introduction Particulate air pollution is attracting more and more concern in China because of its obvious adverse impact on visibil- ity reduction, as well as health implications and regional or global climate change (Kanakidou et al., 2005; Pope and Dockery, 2006; Cheng et al., 2016). Carbonaceous species, i.e., organic carbon (OC) and elemental carbon (EC), and water-soluble inorganic ions, e.g., SO 2- 4 , NO - 3 and NH + 4 , are the major components of ambient aerosols (Liang et al., 2017; Du et al., 2014; Zheng et al., 2015; Tan et al., 2016). Biomass burning (BB) emissions constitute a large source of ambient particulate pollution, especially for carbonaceous components, i.e., primary organic carbon (POC) and black carbon (BC) on a global scale (Bond et al., 2004; Tang et al., 2018). As an important aerosol component, black car- bon from industrial and combustion emissions contributes Published by Copernicus Publications on behalf of the European Geosciences Union.
Transcript of Measurement report: Chemical characteristics of PM during ...

Atmos. Chem. Phys., 21, 3181–3192, 2021https://doi.org/10.5194/acp-21-3181-2021© Author(s) 2021. This work is distributed underthe Creative Commons Attribution 4.0 License.
Measurement report: Chemical characteristics of PM2.5 duringtypical biomass burning season at an agricultural siteof the North China PlainLinlin Liang1, Guenter Engling2,a, Chang Liu1, Wanyun Xu1, Xuyan Liu3, Yuan Cheng4, Zhenyu Du5, Gen Zhang1,Junying Sun1, and Xiaoye Zhang1
1State Key Laboratory of Severe Weather & Key Laboratory for Atmospheric Chemistry,Chinese Academy of Meteorological Sciences, Beijing 100081, China2Division of Atmospheric Sciences, Desert Research Institute, Reno, NV 89512, USA3National Satellite Meteorological Center, Beijing 100081, China4School of Environment, Harbin Institute of Technology, Harbin 150001, China5National Research Center for Environmental Analysis and Measurement, Beijing 100029, Chinaanow at: California Air Resources Board, El Monte, CA 91731, USA
Correspondence: Linlin Liang ([email protected])
Received: 27 September 2020 – Discussion started: 9 October 2020Revised: 21 January 2021 – Accepted: 21 January 2021 – Published: 3 March 2021
Abstract. Biomass burning activities are ubiquitous inChina, especially in northern China, where there is a large ru-ral population and winter heating custom. Biomass burningtracers (i.e., levoglucosan, mannosan and potassium (K+)),as well as other chemical components, were quantified at arural site (Gucheng, GC) in northern China from 15 Octoberto 30 November, during a transition heating season, whenthe field burning of agricultural residue was becoming in-tense. The measured daily average concentrations of levoglu-cosan, mannosan and K+ in PM2.5 (particulate matter withaerodynamic diameters less than 2.5 µm) during this studywere 0.79± 0.75, 0.03± 0.03 and 1.52± 0.62 µg m−3, re-spectively. Carbonaceous components and biomass burningtracers showed higher levels during nighttime than daytime,while secondary inorganic ions were enhanced during day-time. An episode with high levels of biomass burning trac-ers was encountered at the end of October 2016, with highlevoglucosan at 4.37 µg m−3. Based on the comparison ofchemical components during different biomass burning pol-lution periods, it appeared that biomass combustion can obvi-ously elevate carbonaceous component levels, whereas therewas essentially no effect on secondary inorganic aerosols inthe ambient air. Moreover, the levoglucosan /mannosan ra-tios during different biomass burning pollution periods re-mained at high values (in the range of 18.3–24.9); however,
the levoglucosan /K+ ratio was significantly elevated duringthe intensive biomass burning pollution period (1.67) whenair temperatures were decreasing, which was substantiallyhigher than in other biomass burning periods (averaged at0.47).
1 Introduction
Particulate air pollution is attracting more and more concernin China because of its obvious adverse impact on visibil-ity reduction, as well as health implications and regional orglobal climate change (Kanakidou et al., 2005; Pope andDockery, 2006; Cheng et al., 2016). Carbonaceous species,i.e., organic carbon (OC) and elemental carbon (EC), andwater-soluble inorganic ions, e.g., SO2−
4 , NO−3 and NH+4 ,are the major components of ambient aerosols (Liang et al.,2017; Du et al., 2014; Zheng et al., 2015; Tan et al., 2016).Biomass burning (BB) emissions constitute a large sourceof ambient particulate pollution, especially for carbonaceouscomponents, i.e., primary organic carbon (POC) and blackcarbon (BC) on a global scale (Bond et al., 2004; Tang etal., 2018). As an important aerosol component, black car-bon from industrial and combustion emissions contributes
Published by Copernicus Publications on behalf of the European Geosciences Union.

3182 L. Liang et al.: Chemical characteristics of PM2.5 during a typical biomass burning season
to the enhanced PM2.5 (particulate matter with aerodynamicdiameters less than 2.5 µm) mass concentrations and influ-ences regional radiative forcing (Chen et al., 2017). Freshbiomass burning aerosol was found to be mainly comprisedof carbonaceous species which typically constitute 50 %–60 % of the total particle mass (Hallquist et al., 2009). Yaoet al. (2016) identified approximately half of carbonaceousaerosols being contributed by biomass burning at Yucheng, arural site in the North China Plain.
Biomass burning emissions also represent a potentiallylarge source of secondary organic aerosol (SOA). The pre-cursors and formation pathways of SOA from biomass burn-ing emissions were investigated by extensive field obser-vations (e.g., Zhu et al., 2015, 2017; Adler et al., 2011;Zhang et al., 2010, 2015). Based on morphological parti-cle analysis, Yao et al. (2016) investigated the smoke emit-ted from biomass burning impacting SOA production. Sunet al. (2010) found that phenolic compounds, which wereemitted in large amounts from wood combustion, can formSOA at high yields in aqueous-phase reactions. In addition,smoke from biomass burning can be transported thousands ofkilometers downwind from the source areas. Biomass burn-ing aerosol from southeast Asia can be transported to China,Singapore and even further to North America (Liang et al.,2017, 2020; Hertwig et al., 2015; Peltier et al., 2008). Basedon molecular tracer measurements, synoptic data and air-mass back-trajectory analysis, a fire episode was captured ata background site of East China with smoke advected fromsoutheast Asia (Liang et al., 2017).
The North China Plain (NCP) is one of the most pollutedregions in China. Severe haze and fog of longer durationand more extensive coverage have occurred frequently in theNCP area, especially during the seasons of autumn and win-ter. NCP covers one-quarter of China’s cultivated land andyields 35 % of the agricultural products in China (Boreddyet al., 2017). The rural population in NCP is also large anddense, and biomass burning activities are common in this re-gion in the form of cooking and heating. Intense fire activitytypically occurs in October after the corn harvest. Abundantsmoke is emitted from agricultural burning, i.e., residentialbiofuel combustion, open field burns, etc. Various field obser-vations have investigated different aspects of biomass burn-ing, e.g., seasonal variations, chemical and physical proper-ties of smoke particles, spatial distribution, sources and trans-port, in the NCP region (Cheng et al., 2013; Shen et al., 2018;Sun et al., 2013; Boreddy et al., 2017; Xu et al., 2019). How-ever, these field investigations of the contribution of biomassburning to ambient aerosols in the NCP region were concen-trated on the city of Beijing (Cheng et al., 2013; Zheng etal., 2015; Duan et al., 2004; Liang et al., 2016). Little fieldresearch about biomass burning was reported for rural areasin the NCP. In fact, biomass burning activities are commonin the rural areas of the NCP region, and the resulting smokeaerosol can be transported to urban areas, e.g., the city ofBeijing, resulting in haze episodic events.
In order to characterize the biomass burning pollution sta-tus within rural areas of the NCP region, multiple biomassburning tracers, i.e., levoglucosan, mannosan and K+ inPM2.5, sampled at a heavily polluted rural site in the Hebeiprovince were quantified during a typical biomass burningseason, i.e., autumn–winter transition season, following thecorn harvest. Combined with the analysis of other chemi-cal components, it reveals different levels of biomass com-bustion pollution impacting different types of chemical com-ponents in ambient aerosol. Based on the multi-analysis ofbiomass burning molecular tracers, back-trajectory analysis,fire activity data and synoptic conditions, the results of thisstudy demonstrate the biomass burning pollution status, aswell as the formation process of severe biomass burning pol-lution episodes in the rural atmosphere of northern China.These results can provide valuable information about thebiomass burning activities in all of northern China.
2 Site description and experimental methods
2.1 Site description and sampling
Samples were collected at a rural site, Gucheng (GC,39◦09′ N, 115◦44′ E; 15.2 m a.s.l.), located on a platform atthe China Meteorological Administration farm in the town ofGucheng (GC site), approximately 110 km southwest of Bei-jing and 35 km north of the city of Baoding (population ofabout 5 million) in the Hebei province, as shown in Fig. S1.The station is surrounded by agricultural fields, with majorcrop species being corn and wheat. The dominant wind di-rection at GC is southwest and northeast during the studyperiod. This site is upwind of Beijing, when the wind blowsfrom the south or southwest, where heavily polluted citiesand regions of Hebei province, i.e., Baoding, Shijiazhuang,Xingtai and Handan, are located. Thus, it is an appropriatestation for representing the air pollution situation in the NCPregion (Chi et al., 2018; Xu et al., 2019, 2020; Kuang et al.,2020).
Daytime and nighttime PM2.5 samples were collectedfrom 15 October to 23 November 2016, by using a PM2.5high-volume (hi-vol) sampler (GUV-15HBL1, ThermoFisher Scientific Co., Ltd.) at the nominal flow rate of1.13 m3 min−1. The daytime samples were collected from07:00 to 19:00 LT, while nighttime samples were collectedfrom 19:00 to 07:00 LT of the next day. All PM2.5 sampleswere collected on quartz fiber filters, prebaked at 850 ◦C forat least 5 h to remove carbonaceous material. A total of 33couples of daytime–nighttime samples and six whole-daysamples as well as four field blank samples were collectedduring the sampling period. The filters were stored at−20 ◦Cafter sample collection.
Atmos. Chem. Phys., 21, 3181–3192, 2021 https://doi.org/10.5194/acp-21-3181-2021

L. Liang et al.: Chemical characteristics of PM2.5 during a typical biomass burning season 3183
2.2 Experimental methods
2.2.1 Anhydrosugar and water-soluble inorganic ionanalysis
The quartz filter samples were analyzed for biomass burn-ing anhydrosugar tracers, i.e., levoglucosan and mannosan,using an improved high-performance anion-exchange chro-matography (HPAEC) method with pulsed amperometric de-tection (PAD) on a Dionex ICS-5000+ system. Levoglu-cosan and mannosan were separated by a Dionex CarbopacMA1 analytical column and guard column with an aqueoussodium hydroxide (NaOH, 480 mM) eluent at a flow rate of0.4 mL min−1. The detection limit of levoglucosan and man-nosan was 0.002 and 0.005 mg L−1, respectively. More de-tails about the HPAEC-PAD method can be found elsewhere(Iinuma et al., 2009).
The quartz filter samples were also analyzed for water-soluble inorganic ions by a Dionex ICS-5000+ ion chro-matograph, including SO2−
4 , NO−3 , NH+4 , Cl−, Ca2+, Na+,K+ and Mg2+, and the method detection limits for the indi-vidual ionic species were 0.18 0.15, 0.03, 0.048, 0.08, 0.01,0.01 and 0.008 µg L−1, respectively. The cations were sepa-rated on an Ionpac CS12 analytical column and CG12 guardcolumn with a 20 mM methanesulfonic acid as eluent at aflow rate of 1.0 mL min−1, while the anions were separatedon an Ionpac AS11-HC column and AG11-HC guard columnwith 21.5 mM potassium hydroxide (KOH) eluent at a flowrate of 1.0 mL min−1. The water-soluble inorganic ion datawere corrected by field blanks.
2.2.2 Organic carbon / elemental carbon analysis
OC and EC were measured on a punch (0.526 cm2) ofeach quartz sample by a thermal–optical carbon analyzer(DRI model 2001, Desert Research Institute, USA), us-ing the Interagency Monitoring of Protected Visual Envi-ronments (IMPROVE) thermal evolution protocol with re-flectance charring correction. The analytical error of OC waswithin 10 %, and 1 sample of every 10 samples was selectedat random for duplicate analysis. The detection limit of OCwas 0.82 µgC cm−2 (Liang et al., 2017).
2.2.3 Gas online monitoring (i.e., NO, NO2, SO2, O3,CO and NH3)
During this campaign, commercial instruments from ThermoFisher Scientific Co., Ltd. were used to measure O3 (TE49C), NO /NO2 /NOx (model 42CTL), CO (TE 48CTL)and SO2 (TE43CTL), while NH3 was measured by an am-monia analyzer (DLT-100, Los Gatos Research, USA) at theGC station. All measurement data quality was controlled ac-cording to standard gases (Xu et al., 2019; Lin et al., 2011;Meng et al., 2018).
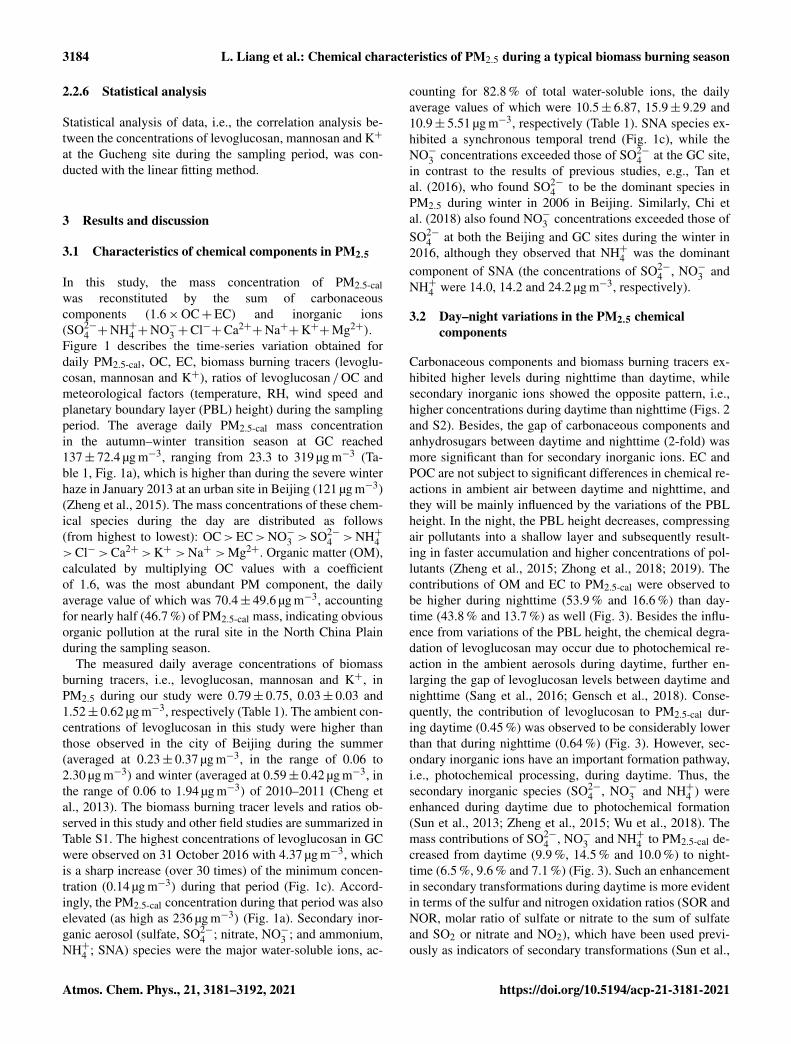
Figure 1. Time-series variation obtained for PM2.5-cal and its ma-jor components, biomass burning tracers and meteorological fac-tors at the GC site during the sampling period from 15 October to23 November 2016. (a) PM2.5-cal, (b) OC and EC, (c) secondaryinorganic aerosols, i.e., SO2−
4 , NO−3 and NH+4 , (d) levoglucosan,mannosan and K+, (e) ratios of levoglucosan to OC (LG /OC)and levoglucosan to EC (LG /EC), (f) PBL and wind speed (WS),(g) temperature (T ) and relative humidity (RH).
2.2.4 Meteorological parameters
The meteorological parameters, including air temperature,relative humidity (RH) and wind speed at a 24 h resolutionat the GC site, are presented in Fig. 1. During this campaign,the daily average RH value was observed at 77± 13%, with arange from 48 % to 99 %, while the daily wind speed was ob-served with an average value of 1.07± 1.14 m s−1, exhibitingmoist and stable synoptic conditions at this rural site duringthe autumn–winter transition season. Moreover, there wasrare precipitation during the sampling period at the GC site,except for two days, i.e., 20 and 27 October 2016 (Fig. 1).
2.2.5 Back-trajectory and fire spot analysis
To characterize the transport pathways of the aerosol at theGucheng site, back trajectories were calculated with theNOAA Hybrid Single-Particle Lagrangian Integrated Tra-jectory (HYSPLIT) model via the NOAA ARL READYwebsite (http://ready.arl.noaa.gov/HYSPLIT.php, last ac-cess: 7 November 2020).
To investigate the influence of biomass burning activi-ties in surrounding areas, fire hotspot counts were obtainedfrom the Fire Information for Resource Management System(FIRMS) (available at https://firms.modaps.eosdis.nasa.gov/download/, last access: 23 November 2020).
https://doi.org/10.5194/acp-21-3181-2021 Atmos. Chem. Phys., 21, 3181–3192, 2021
3184 L. Liang et al.: Chemical characteristics of PM2.5 during a typical biomass burning season
2.2.6 Statistical analysis
Statistical analysis of data, i.e., the correlation analysis be-tween the concentrations of levoglucosan, mannosan and K+
at the Gucheng site during the sampling period, was con-ducted with the linear fitting method.
3 Results and discussion
3.1 Characteristics of chemical components in PM2.5
In this study, the mass concentration of PM2.5-calwas reconstituted by the sum of carbonaceouscomponents (1.6×OC+EC) and inorganic ions(SO2−
4 +NH+4 +NO−3 +Cl−+Ca2++Na++K++Mg2+).
Figure 1 describes the time-series variation obtained fordaily PM2.5-cal, OC, EC, biomass burning tracers (levoglu-cosan, mannosan and K+), ratios of levoglucosan /OC andmeteorological factors (temperature, RH, wind speed andplanetary boundary layer (PBL) height) during the samplingperiod. The average daily PM2.5-cal mass concentrationin the autumn–winter transition season at GC reached137± 72.4 µg m−3, ranging from 23.3 to 319 µg m−3 (Ta-ble 1, Fig. 1a), which is higher than during the severe winterhaze in January 2013 at an urban site in Beijing (121 µg m−3)(Zheng et al., 2015). The mass concentrations of these chem-ical species during the day are distributed as follows(from highest to lowest): OC>EC>NO−3 >SO2−
4 >NH+4>Cl−>Ca2+>K+ >Na+ >Mg2+. Organic matter (OM),calculated by multiplying OC values with a coefficientof 1.6, was the most abundant PM component, the dailyaverage value of which was 70.4± 49.6 µg m−3, accountingfor nearly half (46.7 %) of PM2.5-cal mass, indicating obviousorganic pollution at the rural site in the North China Plainduring the sampling season.
The measured daily average concentrations of biomassburning tracers, i.e., levoglucosan, mannosan and K+, inPM2.5 during our study were 0.79± 0.75, 0.03± 0.03 and1.52± 0.62 µg m−3, respectively (Table 1). The ambient con-centrations of levoglucosan in this study were higher thanthose observed in the city of Beijing during the summer(averaged at 0.23± 0.37 µg m−3, in the range of 0.06 to2.30 µg m−3) and winter (averaged at 0.59± 0.42 µg m−3, inthe range of 0.06 to 1.94 µg m−3) of 2010–2011 (Cheng etal., 2013). The biomass burning tracer levels and ratios ob-served in this study and other field studies are summarized inTable S1. The highest concentrations of levoglucosan in GCwere observed on 31 October 2016 with 4.37 µg m−3, whichis a sharp increase (over 30 times) of the minimum concen-tration (0.14 µg m−3) during that period (Fig. 1c). Accord-ingly, the PM2.5-cal concentration during that period was alsoelevated (as high as 236 µg m−3) (Fig. 1a). Secondary inor-ganic aerosol (sulfate, SO2−
4 ; nitrate, NO−3 ; and ammonium,NH+4 ; SNA) species were the major water-soluble ions, ac-
counting for 82.8 % of total water-soluble ions, the dailyaverage values of which were 10.5± 6.87, 15.9± 9.29 and10.9± 5.51 µg m−3, respectively (Table 1). SNA species ex-hibited a synchronous temporal trend (Fig. 1c), while theNO−3 concentrations exceeded those of SO2−
4 at the GC site,in contrast to the results of previous studies, e.g., Tan etal. (2016), who found SO2−
4 to be the dominant species inPM2.5 during winter in 2006 in Beijing. Similarly, Chi etal. (2018) also found NO−3 concentrations exceeded those ofSO2−
4 at both the Beijing and GC sites during the winter in2016, although they observed that NH+4 was the dominantcomponent of SNA (the concentrations of SO2−
4 , NO−3 andNH+4 were 14.0, 14.2 and 24.2 µg m−3, respectively).
3.2 Day–night variations in the PM2.5 chemicalcomponents
Carbonaceous components and biomass burning tracers ex-hibited higher levels during nighttime than daytime, whilesecondary inorganic ions showed the opposite pattern, i.e.,higher concentrations during daytime than nighttime (Figs. 2and S2). Besides, the gap of carbonaceous components andanhydrosugars between daytime and nighttime (2-fold) wasmore significant than for secondary inorganic ions. EC andPOC are not subject to significant differences in chemical re-actions in ambient air between daytime and nighttime, andthey will be mainly influenced by the variations of the PBLheight. In the night, the PBL height decreases, compressingair pollutants into a shallow layer and subsequently result-ing in faster accumulation and higher concentrations of pol-lutants (Zheng et al., 2015; Zhong et al., 2018; 2019). Thecontributions of OM and EC to PM2.5-cal were observed tobe higher during nighttime (53.9 % and 16.6 %) than day-time (43.8 % and 13.7 %) as well (Fig. 3). Besides the influ-ence from variations of the PBL height, the chemical degra-dation of levoglucosan may occur due to photochemical re-action in the ambient aerosols during daytime, further en-larging the gap of levoglucosan levels between daytime andnighttime (Sang et al., 2016; Gensch et al., 2018). Conse-quently, the contribution of levoglucosan to PM2.5-cal dur-ing daytime (0.45 %) was observed to be considerably lowerthan that during nighttime (0.64 %) (Fig. 3). However, sec-ondary inorganic ions have an important formation pathway,i.e., photochemical processing, during daytime. Thus, thesecondary inorganic species (SO2−
4 , NO−3 and NH+4 ) wereenhanced during daytime due to photochemical formation(Sun et al., 2013; Zheng et al., 2015; Wu et al., 2018). Themass contributions of SO2−
4 , NO−3 and NH+4 to PM2.5-cal de-creased from daytime (9.9 %, 14.5 % and 10.0 %) to night-time (6.5 %, 9.6 % and 7.1 %) (Fig. 3). Such an enhancementin secondary transformations during daytime is more evidentin terms of the sulfur and nitrogen oxidation ratios (SOR andNOR, molar ratio of sulfate or nitrate to the sum of sulfateand SO2 or nitrate and NO2), which have been used previ-ously as indicators of secondary transformations (Sun et al.,
Atmos. Chem. Phys., 21, 3181–3192, 2021 https://doi.org/10.5194/acp-21-3181-2021

L. Liang et al.: Chemical characteristics of PM2.5 during a typical biomass burning season 3185
Table 1. Average concentrations and the range of PM2.5-cal and its chemical components, biomass burning tracers (µg m−3), gaseous species,ratios of OC /EC and levoglucosan /OC, as well as meteorological data observed at the GC site during daytime, nighttime and the wholeday, respectively, during the sampling period from 15 October to 23 November 2016.
Species Daytime (N = 34) Nighttime (N = 33) Whole period (N = 37)∗
Average Range Average Range Average Rangeconcentration concentration concentration
PM2.5-cal 117± 58.8 19.0–225 170± 116 21.1–465 137± 72.4 23.3–319OC 26.8± 15.7 3.78–64.8 61.6± 49.5 2.88–175 44.0± 31.0 4.13–117EC 13.4± 8.49 1.44–34.0 30.9± 28.5 2.21–129 21.7± 15.8 2.46–74.9TC 49.3± 27.6 5.76–124 92.5± 73.6 5.10–289 65.8± 44.1 7.36–192OC /EC 2.02± 1.26 1.09–3.31 2.25± 1.04 1.04–6.72 1.95± 0.60 0.83–3.10SO2−
4 12.1± 9.31 1.65–39.7 9.02± 6.22 1.55-23.2 10.5± 6.87 1.66–29.5NO−3 16.9± 9.96 1.85–41.2 13.1± 8.52 1.56–38.0 15.9± 9.29 2.40–45.2Cl− 4.33± 2.30 0.82–9.46 6.08± 4.00 0.62 – 16.0 4.90± 2.46 0.93–9.37NH+4 11.7± 6.76 1.84–26.0 10.0± 5.75 1.33–22.2 10.9± 5.51 1.99–25.4K+ 1.43± 0.54 0.20–2.64 1.78± 0.95 0.22–4.19 1.52± 0.62 0.50–2.96Mg2+ 0.26± 0.14 0.07-0.64 0.19± 0.09 0.06–0.38 0.14± 0.12 0.04–0.43Ca2+ 2.24± 1.01 1.02-4.75 1.56± 0.08 0.77–3.56 1.54± 0.90 0.49–3.84Na+ 0.44± 0.17 0.10–0.79 0.43± 0.24 0.10–1.31 0.42± 0.17 0.11–0.88NO−3 /SO2−
4 1.67± 0.82 0.75–5.52 1.54± 0.57 0.74–3.50 1.65± 0.62 0.78± 3.96Levoglucosan 0.57± 0.62 0.05–3.74 1.10± 0.99 0.05–4.82 0.79± 0.75 0.14–4.37Mannosan 0.024± 0.023 0.00–0.14 0.05± 0.04 0.00–0.21 0.03± 0.03 0.00–0.18Levoglucosan /OC 0.018± 0.011 0.005–0.067 0.020± 0.010 0.004–0.047 0.020± 0.009 0.006–0.045NO (ppb) 23.0± 14.7 2.07–56.0 45.9± 29.5 1.59–96.9 31.8± 18.3 1.81–68.5NO2 (ppb) 25.8± 10.4 8.18–51.6 29.3± 9.37 8.81–51.1 26.6± 8.74 8.62–51.4SO2 (ppb) 9.78± 4.96 3.11–22.5 9.63± 5.67 2.91–28.7 8.61± 4.04 3.37–20.4CO (ppm) 0.96± 0.73 0.03–2.49 1.29± 1.04 0.02–3.26 1.05± 0.76 0.12–2.48O3 (ppb) 13.0± 9.10 1.42–41.84 5.00± 5.73 1.60–24.30 9.25± 5.78 1.67–24.0NH3 (ppb) 16.4± 11.3 1.68–46.2 18.3± 10.7 1.03–42.7 17.1± 9.88 1.46–44.4Temperature (◦C) 7.71± 4.01 −2.07–15.9 3.30± 4.69 −6.60–14.5 6.95± 4.58 −4.33–15.4Relative humidity (%) 68± 17 31–98 85± 14 34–100 77± 13 48–99Wind speed (m s−1) 1.43± 1.17 0.09–5.65 0.79± 1.55 0.03–7.19 1.07± 1.14 0.04–5.02
∗ Six whole-day samples were included in the data analysis of the “whole period”.
2013; Zheng et al., 2015). Both SOR and NOR during day-time were higher than those during nighttime (Fig. S3), fur-ther confirming the elevated secondary formation of sulfateand nitrate during daytime.
In addition, the concentrations of other water-soluble inor-ganic ions, i.e., K+ and Cl−, during nighttime (1.78± 0.95and 6.08± 4.00 µg m−3) were higher than those in daytime(1.43± 0.54 and 4.33± 2.30 µg m−3), while their contribu-tions to PM2.5-cal were reversed, due to the significant ac-cumulation and higher concentrations of pollutants duringnighttime. As Ca2+, Mg2+ and Na+, which are mainly emit-ted from primary natural sources, such as dust, soil resuspen-sion and sea salt, are subject to more activity during the day-time and also influenced by the airflow dynamics, the contri-butions of those species in nighttime were lower than thoseduring daytime, especially for Ca2+, which decreased from2.2 % in daytime to 0.9 % during nighttime (Fig. 3).
Figure 2. Day and night distributions of mean concentrations ofthe main chemical components (OC, EC, SO2−
4 , NO−3 and NH+4 )and biomass burning tracers (levoglucosan and mannosan) in PM2.5observed at the GC site during the sampling period.
https://doi.org/10.5194/acp-21-3181-2021 Atmos. Chem. Phys., 21, 3181–3192, 2021

3186 L. Liang et al.: Chemical characteristics of PM2.5 during a typical biomass burning season
Figure 3. Percent contributions of individual component mass con-centrations to total estimated PM2.5-cal mass for daytime and night-time during the sampling period.
3.3 Biomass burning episodes and the impacts onchemical PM2.5 characteristics
An episode with high biomass burning tracer levels was en-countered on 31 October 2016. The concentrations of lev-oglucosan in PM2.5 during this 1 d episode (4.37 µg m−3)were significantly higher than those during the typical tran-sition season at the GC site (0.69± 0.47 µg m−3) (Fig. 1d).Meanwhile, there was significant change in the meteorolog-ical conditions; i.e., the wind direction changed from south-westerly to northerly winds (Fig. S4). Northerly winds ad-vected cold and dry air masses, with the lowest hourly tem-perature observed at −5.3 ◦C (Fig. S5). This notable tem-perature decline before the commencement of the operationof the central heating systems should have caused intensecombustion activities for heating purposes at the rural site.Moreover, the synoptic situation on 31 October 2016 was un-der weaker turbulence with low PBL height and small windspeeds (Fig. 1f). These worsened meteorological conditionswould further enhance aerosol accumulation.
Here, we mainly distinguish four subperiods based ondaily levoglucosan concentrations during the time framefrom 15 October to 23 November 2016. The four periodswere separated as follows: 15–30 October (period I: minorbiomass burning), 31 October (period II: intensive biomassburning), 1–14 November (period III: major biomass burn-ing) and 15–23 November (period IV: heating season). Ta-ble 2 compares the concentrations of PM2.5-cal mass, chem-ical components and gases at the GC site during these fourperiods, as well as the ratios between the intensive and ma-jor BB periods and heating season to the minor BB period.The level of levoglucosan during the intensive BB period (II)was about 12 times greater than that during the minor BBperiod (I). K+ and Cl−, the common biomass burning trac-ers utilized in many studies (Duan et al., 2004; Cheng et al.,2013), were also observed with increased abundance duringthe intensive BB period (II). When entering November, the
weather was becoming cold, and thus combustion activitiesfor heating in the rural areas commenced, resulting in the am-bient levels of levoglucosan increasing to 0.92± 0.47 µg m−3
during period III, about 3 times those in period I. The centralheating systems in northern Chinese cities were operated dur-ing period IV, and the ambient level of levoglucosan was ob-served at 0.96± 0.63 µg m−3, which was similar to that ob-served in period III.
The concentrations of OC and EC were also observed tobe strongly elevated in period II (Table 2), and especiallyOC levels increased to 96.3 µg m−3 during the intensive BBperiod (II), nearly 6 times those during the minor BB pe-riod (16.2± 7.52 µg m−3). The levoglucosan /OC ratio wasutilized to estimate the effect of biomass burning on am-bient organic aerosols. Accordingly, levoglucosan /OC ra-tios sharply increased to 0.045 during period II, which wasnoticeably higher than during other periods in this study(Fig. 1e). Moreover, this level is also higher than most ofthe published field observations, i.e., at urban sites (Zhang etal., 2008, 2014; Cheng et al., 2013), rural sites (Sang et al.,2013; Ho et al., 2014; Pietrogrande et al., 2015; Mkoma etal., 2013) and agricultural sites (Ho et al., 2014; Jung et al.,2014), yet lower than at an urban site in northern Italy dur-ing wintertime (in the range of 0.01 to 0.13) (Pietrogrande etal., 2015). This illustrates that biomass combustion played animportant role in organic aerosol pollution during the inten-sive BB period (II). However, due to other emissions of OCenhanced during the major BB episode (period III) and heat-ing season (period IV), i.e., combustion of coal and biofuelfor heating, OC increased to a higher level (55.2± 17.1 and69.4± 24.6 µgC m−3, respectively). Due to the abundanceof organic aerosols, the contribution from biomass burningemission was thereby reduced and the levoglucosan /OC ra-tios during periods III and IV decreased to 0.016± 0.005 and0.014± 0.006, respectively, even lower than those observedin the minor BB period (I) (0.025± 0.008).
Compared to the carbonaceous components, the concen-trations of secondary inorganic aerosol species (SO2−
4 , NO−3 ,NH+4 ) exhibited a different pattern, i.e., showing no obvi-ous differences between the minor BB period (I) and otherthree periods. The ratios of SO2−
4 , NO−3 and NH+4 during pe-riods II, III and IV to period I were all around 1.0 (Table 2),with no increasing trend. Moreover, the relationships be-tween levoglucosan and OC (and EC) were better than thosebetween levoglucosan and SNA during daytime and night-time (Fig. S3). The precursor gases of SNA, i.e., SO2, NO,NO2 and NH3, were observed to have an increasing trendwhen biomass burning was prevalent during periods III andIV, with the ratios to period I arranged from 1.13 to 1.90 (Ta-ble 2). The time-series variations of the gases (SO2, NOx ,NH3, CO and O3) and PBL during the sampling period areshown in Fig. S4. The primary emission gases exhibited neg-ative relationships with PBL, while O3 exhibited an obviouspositive relationship with PBL (Fig. S5). Combustion fromdifferent fossil fuels (coal, gasoline, diesel, etc.) and biomass
Atmos. Chem. Phys., 21, 3181–3192, 2021 https://doi.org/10.5194/acp-21-3181-2021

L. Liang et al.: Chemical characteristics of PM2.5 during a typical biomass burning season 3187
Table 2. Concentrations of chemical components in PM2.5 aerosols as well as their ratios and gaseous species collected at the GC site duringthe four biomass burning periods (i.e., minor, intensive, major BB and heating periods) from 15 October to 23 November 2016.
Species Period I (15–30 Oct) Period II (31 Oct) Period III (1–14 Nov) Period IV (15–23 Nov)Minor BB Intensive BB Major BB Heating period
Average Average Ratio∗ Average Ratio∗ Average Ratio∗
concentration concentration concentration concentration
PM2.5-cal 81.0± 44.5 235 2.91 163± 46.7 2.01 189± 83.0 2.33Levoglucosan 0.36± 0.14 4.37 12.1 0.90± 0.37 2.50 0.96± 0.63 2.67Mannosan 0.015± 0.005 0.18 12.0 0.038± 0.015 2.53 0.050± 0.026 3.33OC 16.2± 7.52 96.3 5.93 55.2± 17.1 3.41 69.4± 24.6 4.28EC 12.2± 5.85 36.0 2.96 25.5± 10.1 2.09 36.4± 21.5 2.98TC 28.4± 13.1 132 4.66 80.9± 34.6 2.85 106± 55.3 3.73SO2−
4 10.3± 8.96 4.56 0.44 11.8± 6.02 1.15 9.08± 3.87 0.88NO−3 16.6± 12.9 18.1 1.09 16.5± 6.42 0.99 12.6± 5.76 0.76NH+4 10.1± 7.40 10.0 0.99 12.0± 4.35 1.19 10.3± 3.62 1.02K+ 1.16± 0.36 2.61 2.25 1.76± 0.46 1.52 1.65± 0.84 1.42Cl− 3.46± 1.97 7.49 2.16 5.58± 2.16 1.61 6.27± 2.58 1.81OC /EC 1.53± 0.35 2.67 1.75 2.31± 0.59 1.51 2.04± 0.31 1.33NO−3 /SO2−
4 1.74± 0.60 3.96 2.28 1.50± 0.35 0.86 1.42± 0.47 0.82Levoglucosan /OC 0.025± 0.008 0.045 1.80 0.016± 0.005 0.64 0.014± 0.006 0.56Levoglucosan /EC 0.039± 0.019 0.121 3.10 0.038± 0.017 0.97 0.028± 0.013 0.72Levoglucosan /mannosan 24.9± 4.44 24.1 0.97 24.8± 6.46 1.00 18.3± 4.27 0.73Levoglucosan /K+ 0.36± 0.081 1.67 4.64 0.51± 0.16 1.42 0.53± 0.15 1.47NO (ppb) 21.7± 12.5 21.7 1.00 39.6± 15.4 1.82 39.3± 23.6 1.81NO2 (ppb) 21.8± 4.95 26.5 1.22 32.7± 7.27 1.50 24.6± 10.2 1.13NOx (ppb) 43.6± 16.3 48.2 1.11 72.4± 17.8 1.66 64.0± 33.4 1.47SO2 (ppb) 5.83± 2.46 8.04 1.38 11.1± 4.10 1.90 9.75± 3.31 1.67CO (ppm) 0.44± 0.33 0.70 1.59 1.65± 0.53 3.75 1.18± 0.83 2.68O3 (ppb) 9.79± 4.88 23.2 2.37 7.51± 3.87 0.77 9.59± 7.55 0.98NH3 (ppb) 14.3± 6.12 11.1 0.78 18.6± 8.03 1.30 21.2± 14.2 1.48
∗ indicates that the ratios of the heating period, intensive BB period or major BB period were divided by those from the minor BB period.
(straw, wood, leaves, etc.) can all emit CO into the atmo-sphere (Streets et al., 2003; Chantara et al., 2019; Mericoet al., 2020). Due to the more abundant combustion in thecolder weather, the concentrations of CO also increased to1.65± 0.53 and 1.18± 0.83 ppm during the major biomassburning (period III) and the heating season (period IV), re-spectively.
The combustion of biomass, especially of agriculturalresidue (e.g., wheat and corn straw), is very common in therural areas in northern China during the autumn–winter tran-sition period. During the autumn harvest season in northernChina, wheat and corn straw burning is common practice, re-sulting in more abundant fire spots when entering Novemberthan during period I (Fig. 4). The intense biomass burningevent on 31 October 2016 was also supported by air-massback-trajectory analysis (Fig. 5), performed with the TrajStatsoftware. Based on the 48 h back trajectories at the GC site at00:00 UTC on 1 November 2016, the air mass at the GC sitewas restricted in the region of Beijing–Tianjin–Hebei, thepolluted area where fire spots were numerous. However, onthe previous and following days of this episode, i.e., 31 Oc-
tober and 2 November onward, the air masses arriving atGC were advected from the northwest of Mongolia, wheremostly desert areas are present, with less farm land and rarebiomass burning activities (Fig. 5).
Mean percentiles of major components in PM2.5 with re-spect to different BB pollution periods at the GC site duringthe sampling time are shown in Fig. 6. With the variation ofBB pollution periods, the EC fraction seems to exhibit noobvious change during periods I, II and III, but it slightlyincreased during the heating season (period IV), while theOC fraction increased significantly from 34.0 % during theminor BB period (I) to 65.4 % during the intensive BB pe-riod (II). The contributions of sulfate, nitrate and ammoniumto PM2.5-cal all decreased sharply from the minor BB periodto the intensive period (Fig. 6). This suggests that organicaerosol species become more important during BB pollu-tion periods, concerning their contribution to the PM2.5-cal,while EC has no such character. The OM percentage duringintensive BB period (II) was 65.4 %, about double that dur-ing the minor biomass burning period (34.0 %), indicatingthat there was a large fraction of OM in PM2.5-cal originat-
https://doi.org/10.5194/acp-21-3181-2021 Atmos. Chem. Phys., 21, 3181–3192, 2021

3188 L. Liang et al.: Chemical characteristics of PM2.5 during a typical biomass burning season
Figure 4. Fire spots at the GC site and the surrounding provincesfrom (a) 15–30 October 2016 and (b) 1–23 November 2016, ob-served by MODIS Terra satellites (the blue dot represents the GCstation).
Figure 5. The 48 h back trajectories at 500 m at the GC site(39◦09′ N, 115◦44′ E) at 00:00 UTC from 31 October to 2 Novem-ber 2016.
ing from BB at the GC site during the intensive BB period(II). In contrast to OM, contributions of secondary inorganicions to PM2.5-cal significantly decreased with the BB pollu-tion becoming more severe. The contributions of SO2−
4 , NO−3and NH+4 to PM2.5-cal during the minor BB period (11.6 %,20.5 % and 12.5 %) obviously declined during the intensiveBB period (1.93 %, 7.67 % and 4.24 %).
Figure 6. Mean percentiles of major components in PM2.5 withrespect to different biomass burning pollution periods at the GC siteduring the sampling time.
3.4 Relationships among tracers during differentbiomass burning pollution periods
In addition to pollution level information of biomass burningmolecular tracers, the ratios between them could also be usedto identify the different biomass types or indicate the burn-ing formation processes of atmospheric aerosols. Levoglu-cosan and mannosan showed a good relationship during theentire sampling period (Fig. 7a, r = 0.97, p< 0.01). The lev-oglucosan /mannosan ratios during minor, intensive, majorbiomass pollution and heating season periods were observedat high values, i.e., 24.9, 24.1, 24.8 and 18.3, respectively(Table 2, Fig. 7). Compared to the former three episodes(24.1 to 24.9, averaged at 24.6), the levoglucosan /mannosanratio during the heating season period (18.3) decreasedby 25.6 %. Based on source emission studies, the levoglu-cosan /mannosan ratios from crop residue burning, i.e., ricestraw, wheat straw and corn straw, are similar and are char-acterized by high values (averaged at 29, in the range of 12to 55) (Zhang et al., 2007; Engling et al., 2009; Cheng etal., 2013; Jung et al., 2014), yet overlapping with those fromhardwood (averaged at 28, in the range of 11 to 146) (Bari etal., 2009; Jung et al., 2014) and grass burning (18.2± 10.2)(Sullivan et al., 2008), while softwood is characterized byrelatively lower levoglucosan /mannosan ratios (averaged at4.3, in the range of 2.5 to 4.7) (Engling et al., 2006; Chenget al., 2013; Jung et al., 2014). Subsequently, this decliningtrend in the levoglucosan /mannosan ratios during the heat-ing season period was partly caused by the higher proportionof softwood combustion, which is characterized by relativelylower levoglucosan /mannosan ratios. According to the localhabits, softwood, e.g., China fir and pine, is also commonlyused as biofuels for stove heating in northern China, since itallows for sustained heating duration.
Atmos. Chem. Phys., 21, 3181–3192, 2021 https://doi.org/10.5194/acp-21-3181-2021

L. Liang et al.: Chemical characteristics of PM2.5 during a typical biomass burning season 3189
Figure 7. Scatter plots of (a) levoglucosan versus mannosan,(b) levoglucosan versus K+. Statistical analysis of sampling datawas conducted with the linear fitting method.
The concentrations of levoglucosan and K+ during minorand major BB periods and the heating season were corre-lated well (Fig. 7b, r = 0.84, p< 0.01), while the red dotof period II is off from the fitted regression line. The lev-oglucosan /K+ ratios during periods III and IV (0.51 and0.53) were similar to those during a BB episode at an urbansite in Beijing during wintertime (levoglucosan /K+ = 0.51)(Cheng et al., 2013). However, the levoglucosan /K+ ratioduring the intensive BB period (II) increased to 1.67, whichwas significantly higher than that in typical straw combus-tion (< 1.0). Correspondingly, there was a significant dropin temperatures at the GC site during period II, with the av-erage daily temperature sharply decreasing from 7.5 ◦C on30 October to 0.31 ◦C on 31 October 2016, and the aver-age temperature at night on 31 October even decreasing to−3.4 ◦C (Fig. 1g). Hence, the combustion activities were ap-parently intense around the sampling site for heating pur-poses. Compared to K+, there is a large enrichment of lev-
oglucosan in wood-burning emissions, based on the resultsfrom previous biomass source combustion studies (Englinget al., 2006; Chantara et al., 2019). The influence of softwoodand/or other materials from softwood, which are commonlyused as biofuels for stove heating in northern China (Chenget al., 2013; Zhou et al., 2017), should be larger during thislow-temperature period. Moreover, levoglucosan /K+ ratiosalso can be influenced by combustion conditions, i.e., smol-dering versus flaming burns. Biofuels are typically subject tosmoldering combustion conditions in residential stoves forheating purposes in the rural areas in northern China, whichwas reflected in relatively higher levoglucosan /K+ ratiosthan during flaming combustion (Schkolnik et al., 2005; Leeet al., 2010).
4 Summary and conclusion
Anhydrosugars, including levoglucosan and mannosan, andwater-soluble potassium ions were employed as moleculartracers to investigate the characteristics of biomass burningactivities as well as chemical properties of ambient aerosolsunder different biomass burning pollution levels. The mea-sured daily average concentrations of levoglucosan, man-nosan and K+ in PM2.5 during a typical biomass burning sea-son from 15 October to 30 November 2016 were 0.79± 0.75,0.03± 0.03 and 1.52± 0.62 µg m−3, respectively. The con-centrations of carbonaceous components and biomass burn-ing tracers were observed to be higher during nighttimethan daytime, while the patterns of secondary inorganic ions(SO2−
4 , NO−3 and NH+4 ) were the opposite, since they wereenhanced by photochemical formation during daytime. Anepisode with extreme biomass burning tracer levels was en-countered on 31 October 2016, with concentrations of lev-oglucosan as high as 4.37 µg m−3. Comparing the chemicalcompositions between different biomass burning periods, itwas apparent that biomass burning can considerably elevatethe levels of organic components while not showing a sig-nificant effect on the production of secondary inorganic ions.Compared to the other biomass burning episodes, the lev-oglucosan /mannosan ratios during the heating season pe-riod slightly decreased, while levoglucosan /K+ ratio duringthe intensive BB period was unusually higher than those inthe other three biomass burning periods.
Data availability. The data used in this study can be ob-tained from the following open link: https://pan.baidu.com/s/1ZfPC17Bsa1KhjSrmTLIXcg#list/path=2F (Liang, 2016) (code:5aue). It is also available from the corresponding author upon re-quest ([email protected]).
https://doi.org/10.5194/acp-21-3181-2021 Atmos. Chem. Phys., 21, 3181–3192, 2021

3190 L. Liang et al.: Chemical characteristics of PM2.5 during a typical biomass burning season
Supplement. The supplement related to this article is available on-line at: https://doi.org/10.5194/acp-21-3181-2021-supplement.
Author contributions. LL designed and conducted all observationsand drafted the paper. GE revised and finalized the manuscript. XLdrew Figs. 4 and 5. CL, WX, YC, ZD, GZ, JS and XZ interpretedthe data and discussed the results. All authors approved the finalversion for publication.
Competing interests. The authors declare that they have no conflictof interest.
Acknowledgements. The authors would like to acknowledgeYingli Yu and Ye Kuang for their help with PM2.5 sample collectionand Hongbing Cheng for help with chemical analyses.
Financial support. This research has been supported by the Bei-jing Municipal Natural Science Foundation (grant no. 8192055),the State Environmental Protection Key Laboratory of Sources andControl of Air Pollution Complex (grant no. SCAPC201701), theChinese Academy of Meteorological Sciences Fundamental Re-search Funds (grant no. 2017Z011) and the National Natural Sci-ence Foundation of China (grant no. 41705109).
Review statement. This paper was edited by James Allan and re-viewed by three anonymous referees.
References
Adler, G., Flores, J. M., Abo Riziq, A., Borrmann, S., and Rudich,Y.: Chemical, physical, and optical evolution of biomass burn-ing aerosols: a case study, Atmos. Chem. Phys., 11, 1491–1503,https://doi.org/10.5194/acp-11-1491-2011, 2011.
Bari, M. A., Baumbach, G., Kuch, B., and Scheffknecht, G.:Wood smoke as a source of particle-phase organic com-pounds in residential areas, Atmos. Environ., 43, 4722–4732,https://doi.org/10.1016/j.atmosenv.2008.09.006, 2009.
Bond, T. C., Streets, D. G., Yarber, K. F., Nelson, S. M., Woo, J. H.,and Klimont, Z.: A technology-based global inventory of blackand organic carbon emissions from combustion, J. Geophys.Res., D14, D14203, https://doi.org/10.1029/2003JD003697,2004.
Boreddy, S. K. R., Kawamura, K., Okuzawa, K., Kanaya,Y., and Wang, Z.: Temporal and diurnal variations ofcarbonaceous aerosols and major ions in biomass burn-ing influenced aerosols over Mt. Tai in the North ChinaPlain during MTX2006, Atmos. Environ., 154, 106–117,https://doi.org/10.1016/j.atmosenv.2017.01.042, 2017.
Chantara, S., Thepnuan, D., Wiriya, W., Prawan, S., and Tsai,Y.I.: Emissions of pollutant gases, fine particulate matters andtheir significant tracers from biomass burning in an open-
system combustion chamber, Chemosphere, 224, 407–416,https://doi.org/10.1016/j.chemosphere.2019.02.153, 2019.
Chen, J., Li, C., Ristovski, Z., Milic, A., Gu, Y., Islam, M.S., Wang, S., Hao, J., Zhang, H., He, C., Guo, H., Fu, H.,Miljevic, B., Morawska, L., Thai, P., Lam, Y. F., Pereira,G., Ding, A., Huang, X., and Dumka, U. C.: A review ofbiomass burning: Emissions and impacts on air quality, healthand climate in China, Sci. Total Environ., 579, 1000–1034,https://doi.org/10.1016/j.scitotenv.2016.11.025, 2017.
Cheng, Y., He, K. B., Du, Z. Y., Engling, G., Liu, J. M., Ma, Y. L.,Zheng, M., and Weber, R. J.: The characteristics of brown carbonaerosol during winter in Beijing, Atmos. Environ., 127, 355–364,https://doi.org/10.1016/j.atmosenv.2015.12.035, 2016.
Cheng, Y., Engling, G., He, K.-B., Duan, F.-K., Ma, Y.-L., Du, Z.-Y., Liu, J.-M., Zheng, M., and Weber, R. J.: Biomass burningcontribution to Beijing aerosol, Atmos. Chem. Phys., 13, 7765–7781, https://doi.org/10.5194/acp-13-7765-2013, 2013.
Chi, X., He, P., Jiang, Z., Yu, X., Yue, F., Wang, L., Li, B., Kang,H., Liu, C., and Xie, Z.: Acidity of aerosols during winter heavyhaze events in Beijing and Gucheng, China, J. Meteorol. Res.,32, 14–25, https://doi.org/10.1007/s13351-018-7063-4, 2018.
Du, Z. Y., He, K. B., Cheng, Y., Duan, F. K., Ma, Y. L., Liu, J.M., Zhang, X. L., Zheng, M., and Weber, R.: A yearlong studyof water-soluble organic carbon in Beijing I: Sources and itsprimary vs. secondary nature, Atmos. Environ., 92, 514–521,https://doi.org/10.1016/j.atmosenv.2014.04.060, 2014.
Duan, F., Liu, X., Yu, T., and Cachier, H.: Identification and estimateof biomass burning contribution to the urban aerosol organic car-bon concentrations in Beijing, Atmos. Environ., 38, 1275–1282,https://doi.org/10.1016/j.atmosenv.2003.11.037, 2004.
Engling, G., Carrico, C. M., Kreidenweis, S. M., CollettJr, J. L., Day, D. E., Malm, W. C., Lincoln, L., Hao,W. M., Iinuma, Y., and Herrmann, H.: Determination oflevoglucosan in biomass combustion aerosol by high-performance anion-exchange chromatography with pulsedamperometric detection, Atmos. Environ., 40, S299–S311,https://doi.org/10.1016/j.atmosenv.2005.12.069, 2006.
Engling, G., Lee, J. J., Tsai, Y. W., Lung, S. C. C.,Chou, C. C. K., and Chan, C. Y.: Size resolved anhydro-sugar composition in smoke aerosol from controlled fieldburning of rice straw, Aerosol Sci. Tech., 43, 662–672,https://doi.org/10.1080/02786820902825113, 2009.
Gensch, I., Sang-Arlt, X. F., Laumer, W., Chan, C. Y., Engling, G.,Rudolph, J., and Kiendler-Scharr, A.: Using δ13C of levoglu-cosan as a chemical clock, Environ. Sci. Tech., 52, 11094–11101,https://doi.org/10.1021/acs.est.8b03054, 2018.
Hallquist, M., Wenger, J. C., Baltensperger, U., Rudich, Y., Simp-son, D., Claeys, M., Dommen, J., Donahue, N. M., George,C., Goldstein, A. H., Hamilton, J. F., Herrmann, H., Hoff-mann, T., Iinuma, Y., Jang, M., Jenkin, M. E., Jimenez, J. L.,Kiendler-Scharr, A., Maenhaut, W., McFiggans, G., Mentel, Th.F., Monod, A., Prévôt, A. S. H., Seinfeld, J. H., Surratt, J. D.,Szmigielski, R., and Wildt, J.: The formation, properties and im-pact of secondary organic aerosol: current and emerging issues,Atmos. Chem. Phys., 9, 5155–5236, https://doi.org/10.5194/acp-9-5155-2009, 2009.
Hertwig, D., Burgin, L., Gan, C., Hort, M., Jones, A., Shaw,F., Witham, C., and Zhang, K.: Development and demonstra-tion of a Lagrangian dispersion modeling system for real-time
Atmos. Chem. Phys., 21, 3181–3192, 2021 https://doi.org/10.5194/acp-21-3181-2021

L. Liang et al.: Chemical characteristics of PM2.5 during a typical biomass burning season 3191
prediction of smoke haze pollution from biomass burning inSoutheast Asia, J. Geophys. Res.-Atmos., 120, 12605–12630,https://doi.org/10.1002/2015JD023422, 2015.
Ho, K. F., Engling, G., Sai Hang Ho, S., Huang, R., Lai, S., Cao, J.,and Lee, S. C.: Seasonal variations of anhydrosugars in PM2.5in the Pearl River Delta Region, China, Tellus B, 66, 22577,https://doi.org/10.3402/tellusb.v66.22577, 2014.
Iinuma, Y., Engling, G., Puxbaum, H., and Herrmann, H.: A highlyresolved anion-exchange chromatographic method for determi-nation of saccharidic tracers for biomass combustion and primarybio-particles in atmospheric aerosol, Atmos. Environ., 43, 1367–1371, https://doi.org/10.1016/j.atmosenv.2008.11.020, 2009.
Jung, J., Lee, S., Kim, H., Kim, D., Lee, H., and Oh, S.: Quan-titative determination of the biomass-burning contribution toatmospheric carbonaceous aerosols in Daejeon, Korea, dur-ing the rice-harvest period, Atmos. Environ., 89, 642–650,https://doi.org/10.1016/j.atmosenv.2014.03.010, 2014.
Kanakidou, M., Seinfeld, J. H., Pandis, S. N., Barnes, I., Dentener,F. J., Facchini, M. C., Van Dingenen, R., Ervens, B., Nenes, A.,Nielsen, C. J., Swietlicki, E., Putaud, J. P., Balkanski, Y., Fuzzi,S., Horth, J., Moortgat, G. K., Winterhalter, R., Myhre, C. E.L., Tsigaridis, K., Vignati, E., Stephanou, E. G., and Wilson, J.:Organic aerosol and global climate modelling: a review, Atmos.Chem. Phys., 5, 1053–1123, https://doi.org/10.5194/acp-5-1053-2005, 2005.
Kuang, Y., Xu, W. Y., Lin, W. L., Meng, Z. Y., Zhao, H. R., Ren,S. X. Zhang, G., Liang, L. L., and Xu, X. B.: Explosive morninggrowth phenomena of NH3 on the North China Plain: Causesand potential impacts on aerosol formation, Environ. Pollut., 257,11362, https://doi.org/10.1016/j.envpol.2019.113621, 2020.
Lee, T., Sullivan, A. P., Mack, L., Jimenez, J. L., Kreidenweis, S.M., Onasch, T. B., Worsnop, D. R., Malm, W., Wold, C. E.,Hao, W. M., and Collett Jr., J. L.: Chemical smoke marker emis-sions during flaming and smoldering phases of laboratory openburning of wildland fuels, Aerosol Sci. Technol., 44, 499884,https://doi.org/10.1080/02786826.2010.499884, 2010.
Liang, L.: Gucheng biomass burning data, available at: https://pan.baidu.com/s/1ZfPC17Bsa1KhjSrmTLIXcg#list/path=%2F (lastaccess: 23 February 2021), 2016.
Liang, L., Engling, G., Du, Z., Cheng, Y., Duan, F., Liu,X., and He, K.: Seasonal variations and source esti-mation of saccharides in atmospheric particulate mat-ter in Beijing, China, Chemosphere, 150, 365–377,https://doi.org/10.1016/j.chemosphere.2016.02.002, 2016.
Liang, L., Engling, G., Zhang, X., Sun, J., Zhang, Y., Xu, W.,Liu, C., Zhang, G., Liu, X., and Ma, Q.: Chemical charac-teristics of PM 2.5 during summer at a background site ofthe Yangtze River Delta in China, Atmos. Res., 198, 163–172,https://doi.org/10.1016/j.atmosres.2017.08.012, 2017.
Liang, L., Engling, G., Cheng, Y., Liu, X., Du, Z., Ma, Q., Zhang,X., Sun, J., Xu, W., Liu, C., Zhang, G., and Xu, H.: Biomassburning impacts on ambient aerosol at a background site in EastChina: Insights from a yearlong study, Atmos. Res., 231, 104660,https://doi.org/10.1016/j.atmosres.2019.104660, 2020.
Lin, W. L., Xu, X. B., Sun, J. Y., Liu, X. W., and Wang, Y.: Back-ground concentrations of reactive gases and the impacts of long-range transport at the jinsha regional atmospheric backgroundstation, Sci. China Earth Sci., 54, 1604–1613, 2011.
Meng, Z., Xu, X., Lin, W., Ge, B., Xie, Y., Song, B., Jia, S., Zhang,R., Peng, W., Wang, Y., Cheng, H., Yang, W., and Zhao, H.: Roleof ambient ammonia in particulate ammonium formation at a ru-ral site in the North China Plain, Atmos. Chem. Phys., 18, 167–184, https://doi.org/10.5194/acp-18-167-2018, 2018.
Merico, E., Grasso, F.M., Cesari, D., Decesari, S., Belosi, F., Ma-narini, F., De Nuntiis, P., Rinaldi, M., Gambaro, A., Morabito,E., and Contini, D.: Characterisation of atmospheric pollutionnear an industrial site with a biogas production and combus-tion plant in southern Italy, Sci. Total Environ., 717, 137220,https://doi.org/10.1016/j.scitotenv.2020.137220, 2020.
Mkoma, S. L., Kawamura, K., and Fu, P. Q.: Contributionsof biomass/biofuel burning to organic aerosols and partic-ulate matter in Tanzania, East Africa, based on analysesof ionic species, organic and elemental carbon, levoglu-cosan and mannosan, Atmos. Chem. Phys., 13, 10325–10338,https://doi.org/10.5194/acp-13-10325-2013, 2013.
Peltier, R. E., Hecobian, A. H., Weber, R. J., Stohl, A., Atlas, E.L., Riemer, D. D., Blake, D. R., Apel, E., Campos, T., and Karl,T.: Investigating the sources and atmospheric processing of fineparticles from Asia and the Northwestern United States mea-sured during INTEX B, Atmos. Chem. Phys., 8, 1835–1853,https://doi.org/10.5194/acp-8-1835-2008, 2008.
Pietrogrande, M. C., Bacco, D., Ferrari, S., Kaipainen, J., Ric-ciardelli, I., Riekkola, M.-L., Trentini, A., and Visentin, M.:Characterization of atmospheric aerosols in the Po valley dur-ing the supersito campaigns – Part 3: Contribution of woodcombustion to wintertime atmospheric aerosols in Emilia Ro-magna region (Northern Italy), Atmos. Environ., 122, 291–305,https://doi.org/10.1016/j.atmosenv.2015.09.059, 2015
Pope, C. A. and Dockery, D. W.: Health effects of fine particulate airpollution: lines that connect, JAPCA J. Air Waste Ma., 56, 709–742, https://doi.org/10.1080/10473289.2006.10464485, 2006.
Sang, X. F., Zhang, Z. S., Chan, C. Y., and Engling, G.: Sourcecategories and contribution of biomass smoke to organic aerosolover the southeastern Tibetan plateau, Atmos. Environ., 78, 113–123, https://doi.org/10.1016/j.atmosenv.2012.12.012, 2013.
Sang, X. F., Gensch, I., Kammer, B., Khan, A., Kleist, E., Laumer,W., Schlag, P., Schmitt, S. H., Wildt, J., Zhao, R., Mungall, E.L., Abbatt, J. P. D., and Kiendler-Scharr, A.: Chemical stabilityof levoglucosan: An isotopic perspective, J. Geophys. Res., 43,5419–5424, https://doi.org/10.1002/2016GL069179, 2016.
Schkolnik, G., Falkovich, A. H., Rudich, Y., Maenhaut, W., and Ar-taxo, P.: New analytical method for the determination of levoglu-cosan, polyhydroxy compounds, and 2-methylerythritol and itsapplication to smoke and rainwater samples, Environ. Sci. Tech-nol., 39, 2744–2752, https://doi.org/10.1021/es048363c, 2005.
Shen, X. J., Sun, J. Y., Zhang, X. Y., Zhang, Y. M., Wang, Y. Q.,Tan, K. Y., Wang, P., Zhang, L., Qi, X. F., Che, H. Z., Zhang, Z.,Zhong, J. T., Zhao, H. R., and Ren, S. X.: Comparison of submi-cron particles at a rural and an urban site in the North China Plainduring the December 2016 heavy pollution episodes, J. Meteo-rol. Res., 32, 14–25, https://doi.org/10.1007/s13351-018-7060-7,2018.
Streets, D. G., Bond, T. C., Carmichael, G. R., Fernandes, S. D., Fu,Q., He, D., Klimont, Z., Nelson, S. M., Tsai, N. Y., Wang, M.Q., Woo, J. H., and Yarber, K. F.: An inventory of gaseous andprimary aerosol emissions in Asia in the year 2000, J. Geophys.Res., 108, 8809, https://doi.org/10.1029/2002JD003093, 2003.
https://doi.org/10.5194/acp-21-3181-2021 Atmos. Chem. Phys., 21, 3181–3192, 2021

3192 L. Liang et al.: Chemical characteristics of PM2.5 during a typical biomass burning season
Sullivan, A. P., Holden, A. S., Patterson, L. A., McMeeking, G.R., Kreidenweis, S. M., Malm, W. C., Hao, W. M., Wold, C.E., and Collett Jr., J. L.: A method for smoke marker measure-ments and its potential application for determining the contribu-tion of biomass burning from wildfires and prescribed fires toambient PM2.5 organic carbon, J. Geophys. Res., 113, D22302,https://doi.org/10.1029/2008JD010216, 2008.
Sun, Y. L., Wang, Z. F., Fu, P. Q., Yang, T., Jiang, Q., Dong, H. B.,Li, J., and Jia, J. J.: Aerosol composition, sources and processesduring wintertime in Beijing, China, Atmos. Chem. Phys., 13,4577–4592, https://doi.org/10.5194/acp-13-4577-2013, 2013.
Sun, Y. L., Zhang, Q., Anastasio, C., and Sun, J.: Insightsinto secondary organic aerosol formed via aqueous-phase re-actions of phenolic compounds based on high resolutionmass spectrometry, Atmos. Chem. Phys., 10, 4809–4822,https://doi.org/10.5194/acp-10-4809-2010, 2010.
Tan, J. H., Duan, J. C., Zhen, N. J., He, K. B., and Hao, J. M.:Chemical characteristics and source of size-fractionated atmo-spheric particle in haze episode in Beijing, Atmos. Res., 167,24–33, https://doi.org/10.1016/j.atmosres.2015.06.015, 2016.
Tang, R., Wu, Z., Li, X., Wang, Y., Shang, D., Xiao, Y., Li, M.,Zeng, L., Wu, Z., Hallquist, M., Hu, M., and Guo, S.: Primaryand secondary organic aerosols in summer 2016 in Beijing, At-mos. Chem. Phys., 18, 4055–4068, https://doi.org/10.5194/acp-18-4055-2018, 2018.
Wu, Y., Ge, X., Wang, J., Shen, Y., Ye, Z., Ge, S., Wu, Y., Yu,H., and Chen, M.: Responses of secondary aerosols to rela-tive humidity and photochemical activities in an industrializedenvironment during late winter, Atmos. Environ., 193, 66–78,https://doi.org/10.1016/j.atmosenv.2018.09.008, 2018.
Xu, W., Kuang, Y., Zhao, C., Tao, J., Zhao, G., Bian, Y., Yang,W., Yu, Y., Shen, C., Liang, L., Zhang, G., Lin, W., andXu, X.: NH3-promoted hydrolysis of NO2 induces explosivegrowth in HONO, Atmos. Chem. Phys., 19, 10557–10570,https://doi.org/10.5194/acp-19-10557-2019, 2019.
Xu, W., Kuang, Y., Liang, L., He, Y., Cheng, H., Bian, Y., Tao, J.,Zhang, G., Zhao, P., Ma, N., Zhao, H., Zhou, G., Su, H., Cheng,Y., Xu, X., Shao, M., and Sun, Y.: Dust-Dominated Coarse Par-ticles as a Medium for Rapid Secondary Organic and InorganicAerosol Formation in Highly Polluted Air, Environ. Sci. Tech-nol., 54, 15710–15721, https://doi.org/10.1021/acs.est.0c07243,2020.
Yao, L., Yang, L. X., Chen, J. M., Wang, X. F., Xue, L. K.,Li, W. J., Sui, X., Wen, L., Chi, J. W., Zhu, Y. H., Zhang,J. M., Xu, C. H., Zhu, T., and Wang, W. X.: Characteris-tics of carbonaceous aerosols: Impact of biomass burning andsecondary formation in summertime in a rural area of theNorth China Plain, Sci. Total Environ., 557–558, 520–530,https://doi.org/10.1016/j.scitotenv.2016.03.111, 2016.
Zhang, T., Claeys, M., Cachier, H., Dong, S. P., Wang, W., Maen-haut, W., and Liu, X. D.: Identification and estimation of thebiomass burning contribution to Beijing aerosol using levoglu-cosan as a molecular marker, Atmos. Environ., 42, 7013–7021,https://doi.org/10.1016/j.atmosenv.2008.04.050, 2008.
Zhang, T., Cao, J. J., Chow, J. C., Shen, Z. X., Ho, K.F., Ho, S. S. H., Liu, S. X., Han, Y. M., Watson, J. G.,Wang, G. H., and Huang, R. J.: Characterization and sea-sonal variations of levoglucosan in fine particulate matter
in Xi’an, China, JAPCA J. Air Waste Ma., 64, 1317–1327,https://doi.org/10.1080/10962247.2014.944959, 2014.
Zhang, Y. X., Shao, M., Zhang, Y. X., Zeng, L.-M., He, L. Y.,Zhu, B., Wei, Y. J., and Zhu, X. L.: Source profiles of par-ticulate organic matters emitted from cereal straw burnings,J. Environ. Sci., 19, 167–175, https://doi.org/10.1016/s1001-0742(07)60027-8, 2007.
Zhang, Z., Engling, G., Lin, C.-Y., Chou, C. C. K., Lung,S.-C. C., Chang, S.-Y., Fan, S., Chan, C.-Y., and Zhang,Y.-H.: Chemical speciation, transport and contribution ofbiomass burning smoke to ambient aerosol in Guangzhou,a mega city of China, Atmos. Environ., 44, 3187–3195,https://doi.org/10.1016/j.atmosenv.2010.05.024, 2010.
Zhang, Z., Gao, J., Engling, G., Tao, J., Chai, F., Zhang, L., Zhang,R., Sang, X., Chan, C. Y., Lin, Z., and Cao, J.: Characteristicsand applications of size-segregated biomass burning tracers inChina’s Pearl River Delta region, Atmos. Environ., 102, 290–301, https://doi.org/10.1016/j.atmosenv.2014.12.009, 2015.
Zheng, G. J., Duan, F. K., Su, H., Ma, Y. L., Cheng, Y., Zheng,B., Zhang, Q., Huang, T., Kimoto, T., Chang, D., Pöschl, U.,Cheng, Y. F., and He, K. B.: Exploring the severe winter haze inBeijing: the impact of synoptic weather, regional transport andheterogeneous reactions, Atmos. Chem. Phys., 15, 2969–2983,https://doi.org/10.5194/acp-15-2969-2015, 2015.
Zhong, J. T., Zhang, X. Y., and Wang, Y. Q.: Reflections on thethreshold for PM2.5 explosive growth in the cumulative stage ofwinter heavy aerosol pollution episodes (HPEs) in Beijing, Tel-lus B, 71, 1–7, https://doi.org/10.1080/16000889.2018.1528134,2019.
Zhong, J. T., Zhang, X. Y., Wang, Y. Q., Liu, C., and Dong, Y. S.:Heavy aerosol pollution episodes in winter Beijing enhanced byradiative cooling effects of aerosols, Atmos. Res., 209, 59–64,https://doi.org/10.1016/j.atmosres.2018.03.011, 2018.
Zhou, Y., Xing, X., Lang, J., Chen, D., Cheng, S., Wei, L., Wei,X., and Liu, C.: A comprehensive biomass burning emission in-ventory with high spatial and temporal resolution in China, At-mos. Chem. Phys., 17, 2839–2864, https://doi.org/10.5194/acp-17-2839-2017, 2017.
Zhu, C., Kawamura, K., and Kunwar, B.: Effect of biomass burn-ing over the western North Pacific Rim: wintertime maximaof anhydrosugars in ambient aerosols from Okinawa, Atmos.Chem. Phys., 15, 1959–1973, https://doi.org/10.5194/acp-15-1959-2015, 2015.
Zhu, Y. H., Yang, L. X., Kawamura, K., Chen, J. M., Ono, K., Wang,X. F., Xue, L. K., and Wang, W. X.: Contributions and sourceidentification of biogenic and anthropogenic hydrocarbons tosecondary organic aerosols at Mt. Tai in 2014, Environ. Pollut.,220, 863–872, https://doi.org/10.1016/j.envpol.2016.10.070,2017.
Atmos. Chem. Phys., 21, 3181–3192, 2021 https://doi.org/10.5194/acp-21-3181-2021