Measurement of RyR permeability reveals a role of ...Casq) is essential in the mechanism of channel...
20
Article The Rockefeller University Press $30.00 J. Gen. Physiol. Vol. 138 No. 2 231–247 www.jgp.org/cgi/doi/10.1085/jgp.201010592 231 INTRODUCTION The intracellular signal for contraction of skeletal mus- cle is the rapid increase in free cytosolic [Ca 2+ ]. This increase requires coordinated opening of a substantial fraction of intracellular Ca 2+ release channels of the SR, which allows for a large flux of Ca 2+ from stores to cytosol. This flux must terminate rapidly as well to allow for the fast decay of [Ca 2+ ] required for mechanical relaxation. The mechanisms that terminate Ca 2+ release flux may include both a reduction in the openness of the release channels and a reduction in the current per channel, as the SR depletes and the driving force for Ca 2+ flux is reduced. The relative contribution of such gating and depletion processes is not known quantitatively for skel- etal muscle. In cardiac muscle, where more is known, an interaction has been demonstrated whereby depletion re- duces flux both directly, by reducing the [Ca 2+ ] gradient, Correspondence to Eduardo Ríos: eriosrush.edu L. Royer’s present address is Institut Francois Magendie, Institut des neurosciences de Bordeaux, 33077 Bordeaux, France. Abbreviations used in this paper: Casq, calsequestrin; CDI, Ca 2+ -dependent inactivation; EC coupling, excitation–contraction coupling; FDB, flexor digitrorum brevis; FRET, Forster resonant energy transfer; RyR, ryanodine receptor; WT, wild type. and indirectly, through an effect on channel gating (e.g., Györke and Terentyev, 2008). The depletion–gating interaction appears to require the presence of proteins of the junctional complex, calsequestrin (Casq), and its junction-anchoring proteins triadin and junctin. One of the difficulties found in defining these mecha- nisms in skeletal muscle is the lack of reliable methods to accurately monitor free intra-SR [Ca 2+ ], [Ca 2+ ] SR , which is required for the identification of changes in driving gradients and their separation from changes in channel openness. The companion paper in this issue (Sztretye et al.) validated a novel method to monitor [Ca 2+ ] SR . In this study, we report results obtained with this method, which was applied to living cells in parallel with conven- tional measurements of cytosolic Ca transients. The flux of Ca release, Re lt • () , was derived from the measured transients of [Ca 2+ ] c and combined with the measured Measurement of RyR permeability reveals a role of calsequestrin in termination of SR Ca 2+ release in skeletal muscle Monika Sztretye, 1 Jianxun Yi, 1 Lourdes Figueroa, 1 Jingsong Zhou, 1 Leandro Royer, 1 Paul Allen, 2 Gustavo Brum, 3 and Eduardo Ríos 1 1 Section of Cellular Signaling, Department of Molecular Biophysics and Physiology, Rush University, Chicago, IL 60612 2 Department of Anesthesia, Perioperative, and Pain Medicine, Brigham and Women’s Hospital, Harvard Medical School, Boston, MA 02115 3 Departamento de Biofísica, Facultad de Medicina, Universidad de la República, 11800 Montevideo, Uruguay The mechanisms that terminate Ca 2+ release from the sarcoplasmic reticulum are not fully understood. D4cpv- Casq1 (Sztretye et al. 2011. J. Gen. Physiol. doi:10.1085/jgp.201010591) was used in mouse skeletal muscle cells under voltage clamp to measure free Ca 2+ concentration inside the sarcoplasmic reticulum (SR), [Ca 2+ ] SR , simultaneously with that in the cytosol, [Ca 2+ ] c , during the response to long-lasting depolarization of the plasma membrane. The ratio of Ca 2+ release flux (derived from [Ca 2+ ] c (t)) over the gradient that drives it (essentially equal to [Ca 2+ ] SR ) provided directly, for the first time, a dynamic measure of the permeability to Ca 2+ of the releas- ing SR membrane. During maximal depolarization, flux rapidly rises to a peak and then decays. Before 0.5 s, [Ca 2+ ] SR stabilized at 35% of its resting level; depletion was therefore incomplete. By 0.4 s of depolarization, the measured permeability decayed to 10% of maximum, indicating ryanodine receptor channel closure. Inactiva- tion of the t tubule voltage sensor was immeasurably small by this time and thus not a significant factor in channel closure. In cells of mice null for Casq1, permeability did not decrease in the same way, indicating that calsequestrin (Casq) is essential in the mechanism of channel closure and termination of Ca 2+ release. The absence of this mech- anism explains why the total amount of calcium releasable by depolarization is not greatly reduced in Casq-null muscle (Royer et al. 2010. J. Gen. Physiol. doi:10.1085/jgp.201010454). When the fast buffer BAPTA was introduced in the cytosol, release flux became more intense, and the SR emptied earlier. The consequent reduction in perme- ability accelerated as well, reaching comparable decay at earlier times but comparable levels of depletion. This ob- servation indicates that [Ca 2+ ] SR , sensed by Casq and transmitted to the channels presumably via connecting proteins, is determinant to cause the closure that terminates Ca 2+ release. © 2011 Sztretye et al. This article is distributed under the terms of an Attribution– Noncommercial–Share Alike–No Mirror Sites license for the first six months after the publi- cation date (see http://www.rupress.org/terms). After six months it is available under a Creative Commons License (Attribution–Noncommercial–Share Alike 3.0 Unported li- cense, as described at http://creativecommons.org/licenses/by-nc-sa/3.0/). The Journal of General Physiology on July 29, 2011 jgp.rupress.org Downloaded from Published July 25, 2011 http://jgp.rupress.org/content/suppl/2011/07/22/jgp.201010592.DC1.html Supplemental Material can be found at:
Transcript of Measurement of RyR permeability reveals a role of ...Casq) is essential in the mechanism of channel...

A r t i c l e
The Rockefeller University Press $30.00J. Gen. Physiol. Vol. 138 No. 2 231–247www.jgp.org/cgi/doi/10.1085/jgp.201010592 231
I N T R O D U C T I O N
The intracellular signal for contraction of skeletal mus-cle is the rapid increase in free cytosolic [Ca2+]. This increase requires coordinated opening of a substantial fraction of intracellular Ca2+ release channels of the SR, which allows for a large flux of Ca2+ from stores to cytosol. This flux must terminate rapidly as well to allow for the fast decay of [Ca2+] required for mechanical relaxation.
The mechanisms that terminate Ca2+ release flux may include both a reduction in the openness of the release channels and a reduction in the current per channel, as the SR depletes and the driving force for Ca2+ flux is reduced. The relative contribution of such gating and depletion processes is not known quantitatively for skel-etal muscle. In cardiac muscle, where more is known, an interaction has been demonstrated whereby depletion re-duces flux both directly, by reducing the [Ca2+] gradient,
Correspondence to Eduardo Ríos: erios@rush.eduL. Royer’s present address is Institut Francois Magendie, Institut des
neurosciences de Bordeaux, 33077 Bordeaux, France.Abbreviations used in this paper: Casq, calsequestrin; CDI, Ca2+-dependent
inactivation; EC coupling, excitation–contraction coupling; FDB, flexor digitrorum brevis; FRET, Forster resonant energy transfer; RyR, ryanodine receptor; WT, wild type.
and indirectly, through an effect on channel gating (e.g., Györke and Terentyev, 2008). The depletion–gating interaction appears to require the presence of proteins of the junctional complex, calsequestrin (Casq), and its junction-anchoring proteins triadin and junctin.
One of the difficulties found in defining these mecha-nisms in skeletal muscle is the lack of reliable methods to accurately monitor free intra-SR [Ca2+], [Ca2+]SR, which is required for the identification of changes in driving gradients and their separation from changes in channel openness.
The companion paper in this issue (Sztretye et al.) validated a novel method to monitor [Ca2+]SR. In this study, we report results obtained with this method, which was applied to living cells in parallel with conven-tional measurements of cytosolic Ca transients. The flux of Ca release, Rel t
•( ) , was derived from the measured
transients of [Ca2+]c and combined with the measured
Measurement of RyR permeability reveals a role of calsequestrin in termination of SR Ca2+ release in skeletal muscle
Monika Sztretye,1 Jianxun Yi,1 Lourdes Figueroa,1 Jingsong Zhou,1 Leandro Royer,1 Paul Allen,2 Gustavo Brum,3 and Eduardo Ríos1
1Section of Cellular Signaling, Department of Molecular Biophysics and Physiology, Rush University, Chicago, IL 606122Department of Anesthesia, Perioperative, and Pain Medicine, Brigham and Women’s Hospital, Harvard Medical School, Boston, MA 02115
3Departamento de Biofísica, Facultad de Medicina, Universidad de la República, 11800 Montevideo, Uruguay
The mechanisms that terminate Ca2+ release from the sarcoplasmic reticulum are not fully understood. D4cpv-Casq1 (Sztretye et al. 2011. J. Gen. Physiol. doi:10.1085/jgp.201010591) was used in mouse skeletal muscle cells under voltage clamp to measure free Ca2+ concentration inside the sarcoplasmic reticulum (SR), [Ca2+]SR, simultaneously with that in the cytosol, [Ca2+]c, during the response to long-lasting depolarization of the plasma membrane. The ratio of Ca2+ release flux (derived from [Ca2+]c(t)) over the gradient that drives it (essentially equal to [Ca2+]SR) provided directly, for the first time, a dynamic measure of the permeability to Ca2+ of the releas-ing SR membrane. During maximal depolarization, flux rapidly rises to a peak and then decays. Before 0.5 s, [Ca2+]SR stabilized at 35% of its resting level; depletion was therefore incomplete. By 0.4 s of depolarization, the measured permeability decayed to 10% of maximum, indicating ryanodine receptor channel closure. Inactiva-tion of the t tubule voltage sensor was immeasurably small by this time and thus not a significant factor in channel closure. In cells of mice null for Casq1, permeability did not decrease in the same way, indicating that calsequestrin (Casq) is essential in the mechanism of channel closure and termination of Ca2+ release. The absence of this mech-anism explains why the total amount of calcium releasable by depolarization is not greatly reduced in Casq-null muscle (Royer et al. 2010. J. Gen. Physiol. doi:10.1085/jgp.201010454). When the fast buffer BAPTA was introduced in the cytosol, release flux became more intense, and the SR emptied earlier. The consequent reduction in perme-ability accelerated as well, reaching comparable decay at earlier times but comparable levels of depletion. This ob-servation indicates that [Ca2+]SR, sensed by Casq and transmitted to the channels presumably via connecting proteins, is determinant to cause the closure that terminates Ca2+ release.
© 2011 Sztretye et al. This article is distributed under the terms of an Attribution– Noncommercial–Share Alike–No Mirror Sites license for the first six months after the publi-cation date (see http://www.rupress.org/terms). After six months it is available under a Creative Commons License (Attribution–Noncommercial–Share Alike 3.0 Unported li-cense, as described at http://creativecommons.org/licenses/by-nc-sa/3.0/).
The
Jour
nal o
f G
ener
al P
hysi
olo
gy
on July 29, 2011jgp.rupress.org
Dow
nloaded from
Published July 25, 2011
http://jgp.rupress.org/content/suppl/2011/07/22/jgp.201010592.DC1.html Supplemental Material can be found at:

232 A channel-gating role of calsequestrin
procedures) was explored in separate experiments in which one of the monitors was absent. No evidence of such interference was found. Various acquisition frequencies were used, depending on the duration of the pulses, so that resolution ranged from 1.25 to 5 ms per line (the alternate illumination resulting in actual inter-vals of 2.5–10 ms per line in the individual images). Spatial resolu-tion was 0.24 µm/pixel. Line scanning was always parallel to the fiber axis at 10–15 µm from the glass coverslip.
The Forster resonant energy transfer (FRET) ratio R was calcu-lated as (F2 Background2)/(F1 Background1) without correc-tion for non-FRET components in F2. Fj could be a pixel value or an average. Backgroundi was measured with lasers off. [Ca2+]SR was calculated from the ratio by a generalization of the equilib-rium equation (Eq. 1 in Sztretye et al. [2011]) derived in the Appendix as
(1)
[ ] min
max
max min
max
Ca dON
2+ =-
-+
-
- +
æèççç
öø÷÷÷b
b
bK
R R
R R k
dR
dt
R R
R R RR R R R- -( )[ ]( )min max
.
Here = F1 Ca2+-free/F1 Ca2+-saturated. The parameter values of Rmin (0.505), Rmax (1.74), Kd (222 µM), and (0.554) were deter-mined in calibrations in situ described in the companion paper (Sztretye et al., 2011). In 11 cells in which [Ca2+]SR was followed dynamically, Rmin was individually determined. This set of values was not significantly different from that found in the companion paper (Sztretye et al., 2011). Therefore, all calculations of [Ca2+]SR were performed with the same set of parameter values. The stoi-chiometry factor n was set to 1 (as justified by Sztretye et al. [2011]). kON was assumed to be 3.6 × 10⁶ M1s1, the value deter-mined in solution at room temperature for the similar cameleon D1 (Palmer et al., 2004). Eq. 1 is identical to Eq. 6 in Wetzel and Gros (1998), which was applied in a study of Ca2+ transients moni-tored with fura-2.
Determination of free cytosolic [Ca2+]: a calibration of X-rhod-1Average cytosolic [Ca2+](t) is calculated from averaged fluores-cence F(t) as
[ ] ( ) .min
max
Ca cOFF
ON
2+ =-( ) +
-( )t
F F k d F dt
F F k (2)
Fmax and Fmin are derived from Eq. 2 applied to the resting condi-tion, in which [Ca2+]c(0) ≡ [Ca2+]R is assumed equal to that in the pipette (0.1 µM; an assumption based on results by Royer et al. [2010]). Eq. 2 then becomes 0.1 µM = (F Fmin) Kd/(Fmax F).
In droplets of internal solution, Fmax/Fmin was measured in our experimental setup as 157 for X-rhod-1 and 222 for Rhod-2. Affin-ity and kinetics were derived from dual line scans of fluorescence transients with X-rhod-1 and Rhod-2 in the same cell, releasing Ca2+ under a large and brief voltage clamp pulse. Line-averaged F(t)/F0 in one such experiment is plotted in Fig. 1 A. Fluorescence of Rhod-2 was excited at 514 nm and collected in the range 540–570 nm; that of X-rhod-1 was as described in the previous subsec-tion. Fig. 1 B plots with solid trace [Ca2+]c(t) calculated from the fluorescence of Rhod-2 using Eq. 2, with Fmax/Fmin determined in our experimental setup, Fmin derived from F0, the resting cytosolic [Ca2+] as
F FK
K F Fminmax min
[ ] ( )[ ] ( ) /
,=+
+ ´
+
+0
2
2
00
d c
d c
CaCa
(3)
and kinetic parameters provided by Escobar et al. (1997), includ-ing Kd = 1.58 µM and kOFF = 130 s1. In the dashed trace is the cor-responding calculation from the fluorescence of X-rhod-1, using
[Ca2+]SR for a direct calculation of permeability of the release pathway, a variable which has not been evalu-ated directly until now.
Such direct measurement allowed us to observe that prolonged Ca2+ release results in major depletion of SR content, sharply reducing free [Ca2+]SR. This is accom-panied by a reduction in SR permeability during Ca2+ release. To test the hypothesis that the change in per-meability is determined by the reduction in [Ca2+]SR, we substituted a fast exogenous buffer, BAPTA, for the con-ventionally used EGTA, which drastically changed the speed of depletion and the timing of the decrease in SR permeability. To determine whether the changes in per-meability require the presence of Casq as previously suggested for cardiac muscle, the measurements were repeated in muscles of mice null for the skeletal muscle isoform of Casq.
M AT E R I A L S A N D M E T H O D S
The methods used in the present study were largely described in the companion paper (Sztretye et al., 2011). In this study, de-scribed in addition are simultaneous imaging using the monitor of [Ca2+]SR, D4cpv (Palmer et al., 2006) fused to Casq1 or its Asp variant, and the high affinity indicator X-rhod-1 (Invitrogen) placed in the cytosol by diffusion from a patch pipette.
All experiments described here were performed on cells under voltage clamp. The intramembranous charge displacement Qm (Vm), integral over time of the charge movement current IQ, reflecting the responses of the transverse tubule voltage sensor, was measured as described in the companion paper (Sztretye et al., 2011). Its Boltzmann parameters were not different than in earlier work (Royer et al., 2008, 2010), with the exception of the group of cells studied with BAPTA in the internal solution, which had a transition voltage, VT, shifted by 11 mV in the posi-tive direction. All dynamic responses shown in this paper were obtained with depolarizing pulses to 30 mV, thus ensuring essen-tially full activation, regardless of the shift in transition voltage. The pulses were of a duration well in excess of that needed to reach a steady level of cytosolic Ca concentration ([Ca2+]c), namely 400–500 ms in experiments using BAPTA or 1–1.5 s in experiments with EGTA.
In a separate series of experiments, we investigated whether a depolarization to 30 mV lasting 400 ms could cause inactivation of the t tubule voltage sensor. In these experiments (see Fig. 6), Qm was measured during brief depolarizations to voltages Vm, and the effects therein of a preceding conditioning depolarization (of 400 ms to 30 mV; see Fig. 6 A) were evaluated.
Compositions of solutions “External,” “BAPTA,” “EGTA,” and “Depletion Cocktail” are given in the companion paper (Sztretye et al., 2011). All experiments were performed at room tempera-ture (20–22°C).
Confocal scanning and determination of [Ca2+]SR
Images F1 and F2 of fluorescence of D4cpv-Casq1 and D4cpv-Asp and F3 of X-rhod-1 were acquired in a laser-scanning confocal sys-tem equipped with acousto-optical tunable filters and dichroic beam splitters (SP2; Leica), which allowed excitation of X-rhod-1 (at 594 nm, with emission collected between 610 and 700 nm) al-ternating line by line with the excitation for D4cpv (at 458 nm, with emission collected between 470 and 510 nm for F1 and 520 and 580 nm for F2); therefore, images were effectively simultane-ous. Interference between the two monitors (or their excitation
on July 29, 2011jgp.rupress.org
Dow
nloaded from
Published July 25, 2011

Sztretye et al. 233
in its reaction with Ca2+ (or if it does, the changes are similar to those undergone by Rhod-2). This is different in the case of Fluo-4, the fluorescence transients of which could not be reconciled with those of Rhod-2 under the assumption of a binary Ca2+:dye reac-tion of simple stoichiometry (Royer et al., 2008). Finally, it is worth noting that the derivation assumed a Kd of Rhod-2 deter-mined in aqueous solution. If the affinity of Rhod-2 was lower inside cells, Kd of X-rhod-1 would be >3.9 µM.
The calculation of release fluxCa2+ release flux Rel t
•( ) was derived from [Ca2+]c(t) by the removal
method (Melzer et al., 1984, 1987), which calculates release flux as that necessary to account for the evolution of [Ca2+](t) in a sin-gle-compartment model that includes quantitatively specified processes of removal. Provided that [EGTA] or [BAPTA] are suffi-ciently high, only three removal processes must be considered: binding to the monitoring dye, binding to EGTA/BAPTA, and movement into the SR. This was performed here using the follow-ing parameter values: [Dye]total, [EGTA]total, and [BAPTA]total were set proportionally to the concentrations in the pipette and an ex-ponential entry function of time described in the next subsection. As justified by Royer et al. (2008) and Schuhmeier and Melzer (2004), the kinetic constants of EGTA:Ca were kON = 15 (M s)1 and kOFF = 7.5 s1. For BAPTA:Ca, they were kON = 1,000 (M s)1 and kOFF = 200 s1 (Wu et al., 1996). kuptake, the proportionality constant linking the rate of pump removal to [Ca2+]c, was allowed to vary among cells for best fit of [Ca2+]c(t). The best fit value varied in the range 3.5–26 ms1, with an average of 10.1 ms1 (SEM = 1.37 ms1 in 51 cells).
The images were obtained at 2.5 –10 ms/line. The peak value of release flux was corrected for the blunting effect of these low sampling rates using empirical factors derived as described by Royer et al. (2008), who also showed that measures of the ampli-tude of release flux at more slowly varying milestones during a long-lasting depolarization do not change with acquisition rate. Given the large blunting effect of the low frequencies used for scanning, the values of peak flux, even after correction, should be viewed as rough approximations.
Entry of buffers into cellsThe quantitative analysis of flux requires knowledge of the con-centration of the main buffer at any point in time. Strictly, the cy-tosolic concentrations of BAPTA or EGTA remain unknown. For an objective estimate, we assumed an entry function that depends exponentially on time since whole-cell patching. Namely,
[ ]( ) ([ ] )( ),/Buffer t a Buffer a et= + - -pipette 1 t
where a is a small negative constant of convenience and equals 37.5 min for BAPTA and 34.8 min for EGTA. These values were adapted from an average estimate of EGTA entry by Schuhmeier et al. (2005). The slight difference between time constants of BAPTA and EGTA was calculated assuming inverse proportional-ity between and diffusion coefficient D and inverse proportion-ality between D and molecular radius, which was calculated from the molecular weight.
It should be stressed that any binding of the buffer to cellular structures will increase the asymptotic value of [Buffer] above [Buffer]pipette and will also change its effective diffusion coefficient. Binding might additionally change reaction kinetics and Kd. Therefore, the values of flux and amount of Ca2+ released will re-main subject to an error of scale, roughly proportional to the error in [Buffer]. If the diffusion of the buffer or its kinetics is substantially different than assumed here, the error will be time dependent. The present work focuses on the differences introduced by ge-netic modification; thus, the possible errors of scale or kinetics should not severely qualify the main conclusions and outcomes.
measured Fmax/Fmin, Fmin derived by Eq. 3, and kinetic parameters adjusted for best fit of the [Ca2+]c waveform derived from Rhod-2 fluorescence. The best fit values were kON = 2.6 107 M1s1 and kOFF = 100 s1 (for Kd = 3.9 µM).
In summary, X-rhod-1 proved to have both advantages and drawbacks compared with Rhod-2. Its spectra make it a good choice for joint use with fluorophores in the mid-wavelength range; it has a somewhat lower dynamic range (Fmax/Fmin), but its lower affinity results in a fairly linear relationship between signal and increase in [Ca2+] when millimolar concentrations of EGTA or BAPTA are present. Although its kON is substantially lower than that of Rhod-2, the good agreement between the waveforms of [Ca2+]c derived from both dyes suggests that the interaction with cellular components does not introduce major qualitative changes
Figure 1. Kinetic parameters of X-rhod-1. (A) Baseline-normalized and line-averaged fluorescence F/F0 of Rhod-2 and X-rhod-1 in a WT muscle cell subjected to a voltage clamp pulse of 50 ms to 30 mV. Fluorescence of Rhod-2 was excited at 514 nm and col-lected between 540 and 570 nm. The corresponding wavelengths for X-rhod-1 were 594, 610, and 700 nm. The excitation lights were interspersed line by line. (B, solid trace) [Ca2+]c calculated from the fluorescence trace of Rhod-2 in A using Eq. 2, with Fmax/Fmin determined in our laboratory and kinetic parameters provided by Escobar et al. (1997), including Kd = 1.58 µM and kOFF = 130 s1. (dashed trace) [Ca2+]c calculated from the fluorescence trace of X-rhod-1 using Eqs. 2 and 3, with Fmax/Fmin determined in our labo-ratory and kinetic parameters adjusted for best fit to the function derived from Rhod-2. Best fit values were kON = 2.6 107 M1s1 and kOFF = 100 s1. ID: 031611b series 35.
on July 29, 2011jgp.rupress.org
Dow
nloaded from
Published July 25, 2011
234 A channel-gating role of calsequestrin
Online supplemental materialThe supplemental text includes an example cell in which SR de-pletion results in a signal of dynamic range (R/Rmin) much greater than in published observations and also contains an analy-sis of causes of error in a previous estimate of the change in evacu-ability during a depleting depolarization. Fig. S1 shows the signal with high dynamic range. Fig. S2 examines the error in the esti-mation of evacuability. Online supplemental material is available at http://www.jgp.org/cgi/content/full/jgp.201010592/DC1.
R E S U LT S
In this section, we present direct measurements of the changes in cytosolic [Ca2+] elicited by voltage clamp de-polarization of skeletal muscle cells, together with si-multaneous measurements of [Ca2+] in the SR lumen. The cytosolic transients are used to derive Ca2+ release flux and its evolution during depolarizations that last a time sufficient to reach a steady [Ca2+]c (and pre-sumably a steady level of depletion of Ca2+ in the SR).
Amount releasedFrom Rel t
•( ), which is the flux calculated to exit exclusively
through release channels, a magnitude R tnet
•( ) quantifying the
net flux leaving the SR is derived by subtraction of the pump re-moval flux, namely
R t l t k tnet
· ·+= -( ) ( ) [ ] ( ).Re uptake cCa2
The difference between Rel•
and Rnet
·, which is proportional to
[Ca2+]c, is almost negligible in the highly buffered conditions of this study. The integral, from the beginning of the pulse until time t, defines Rel(t), the amount released at time t.
Rel t R u dunett
( ) ( ) .º·
ò0 (4)
This integral, extended to the time when net flux vanishes by deple-tion, defines Rel(), the SR content releasable by depolarization.
Transgenic animalsMice lacking Casq1 (Paolini et al., 2007) were raised at Charles River and used at 6–10 wk of age.
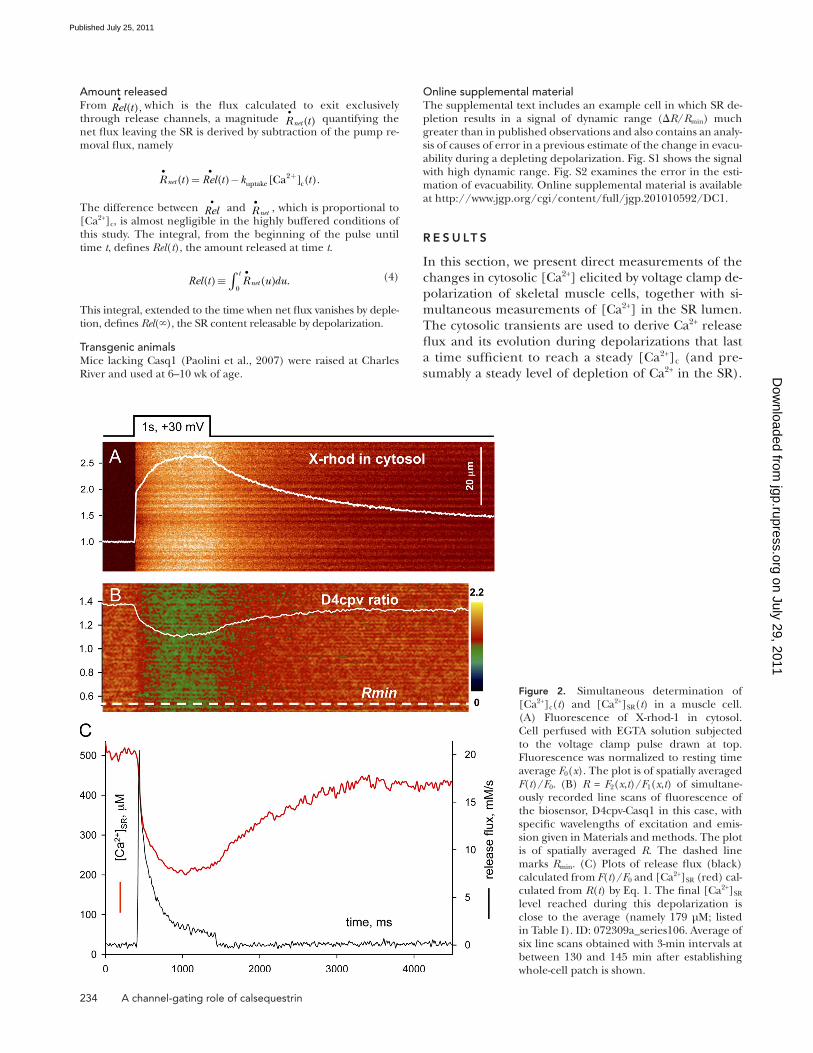
Figure 2. Simultaneous determination of [Ca2+]c(t) and [Ca2+]SR(t) in a muscle cell. (A) Fluorescence of X-rhod-1 in cytosol. Cell perfused with EGTA solution subjected to the voltage clamp pulse drawn at top. Fluorescence was normalized to resting time average F0(x). The plot is of spatially averaged F(t)/F0. (B) R = F2(x,t)/F1(x,t) of simultane-ously recorded line scans of fluorescence of the biosensor, D4cpv-Casq1 in this case, with specific wavelengths of excitation and emis-sion given in Materials and methods. The plot is of spatially averaged R. The dashed line marks Rmin. (C) Plots of release flux (black) calculated from F(t)/F0 and [Ca2+]SR (red) cal-culated from R(t) by Eq. 1. The final [Ca2+]SR level reached during this depolarization is close to the average (namely 179 µM; listed in Table I). ID: 072309a_series106. Average of six line scans obtained with 3-min intervals at between 130 and 145 min after establishing whole-cell patch is shown.
on July 29, 2011jgp.rupress.org
Dow
nloaded from
Published July 25, 2011
Sztretye et al. 235
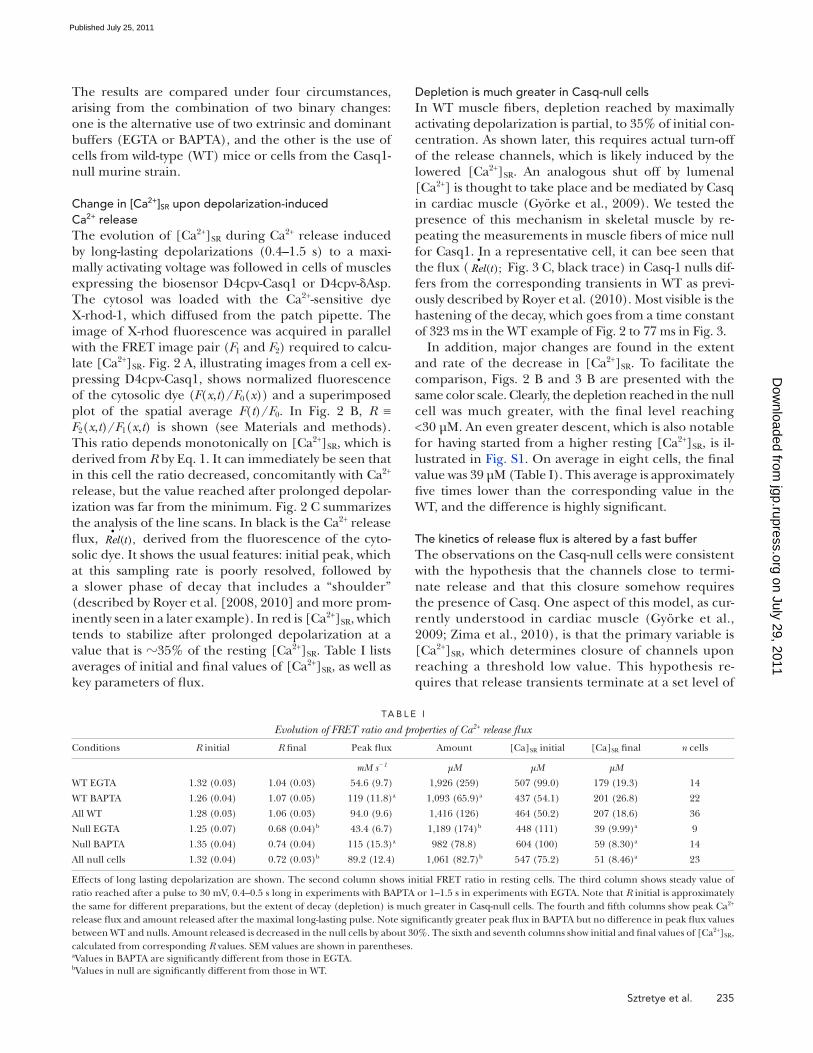
Depletion is much greater in Casq-null cellsIn WT muscle fibers, depletion reached by maximally activating depolarization is partial, to 35% of initial con-centration. As shown later, this requires actual turn-off of the release channels, which is likely induced by the lowered [Ca2+]SR. An analogous shut off by lumenal [Ca2+] is thought to take place and be mediated by Casq in cardiac muscle (Györke et al., 2009). We tested the presence of this mechanism in skeletal muscle by re-peating the measurements in muscle fibers of mice null for Casq1. In a representative cell, it can bee seen that the flux ( Rel t
•( ); Fig. 3 C, black trace) in Casq-1 nulls dif-
fers from the corresponding transients in WT as previ-ously described by Royer et al. (2010). Most visible is the hastening of the decay, which goes from a time constant of 323 ms in the WT example of Fig. 2 to 77 ms in Fig. 3.
In addition, major changes are found in the extent and rate of the decrease in [Ca2+]SR. To facilitate the comparison, Figs. 2 B and 3 B are presented with the same color scale. Clearly, the depletion reached in the null cell was much greater, with the final level reaching <30 µM. An even greater descent, which is also notable for having started from a higher resting [Ca2+]SR, is il-lustrated in Fig. S1. On average in eight cells, the final value was 39 µM (Table I). This average is approximately five times lower than the corresponding value in the WT, and the difference is highly significant.
The kinetics of release flux is altered by a fast bufferThe observations on the Casq-null cells were consistent with the hypothesis that the channels close to termi-nate release and that this closure somehow requires the presence of Casq. One aspect of this model, as cur-rently understood in cardiac muscle (Györke et al., 2009; Zima et al., 2010), is that the primary variable is [Ca2+]SR, which determines closure of channels upon reaching a threshold low value. This hypothesis re-quires that release transients terminate at a set level of
The results are compared under four circumstances, arising from the combination of two binary changes: one is the alternative use of two extrinsic and dominant buffers (EGTA or BAPTA), and the other is the use of cells from wild-type (WT) mice or cells from the Casq1-null murine strain.
Change in [Ca2+]SR upon depolarization-induced Ca2+ releaseThe evolution of [Ca2+]SR during Ca2+ release induced by long-lasting depolarizations (0.4–1.5 s) to a maxi-mally activating voltage was followed in cells of muscles expressing the biosensor D4cpv-Casq1 or D4cpv-Asp. The cytosol was loaded with the Ca2+-sensitive dye X-rhod-1, which diffused from the patch pipette. The image of X-rhod fluorescence was acquired in parallel with the FRET image pair (F1 and F2) required to calcu-late [Ca2+]SR. Fig. 2 A, illustrating images from a cell ex-pressing D4cpv-Casq1, shows normalized fluorescence of the cytosolic dye (F(x,t)/F0(x)) and a superimposed plot of the spatial average F(t)/F0. In Fig. 2 B, R ≡ F2(x,t)/F1(x,t) is shown (see Materials and methods). This ratio depends monotonically on [Ca2+]SR, which is derived from R by Eq. 1. It can immediately be seen that in this cell the ratio decreased, concomitantly with Ca2+ release, but the value reached after prolonged depolar-ization was far from the minimum. Fig. 2 C summarizes the analysis of the line scans. In black is the Ca2+ release flux, Rel t
•( ), derived from the fluorescence of the cyto-
solic dye. It shows the usual features: initial peak, which at this sampling rate is poorly resolved, followed by a slower phase of decay that includes a “shoulder” (described by Royer et al. [2008, 2010] and more prom-inently seen in a later example). In red is [Ca2+]SR, which tends to stabilize after prolonged depolarization at a value that is 35% of the resting [Ca2+]SR. Table I lists averages of initial and final values of [Ca2+]SR, as well as key parameters of flux.
TA B L E I
Evolution of FRET ratio and properties of Ca2+ release flux
Conditions R initial R final Peak flux Amount [Ca]SR initial [Ca]SR final n cells
mM s1 µM µM µM
WT EGTA 1.32 (0.03) 1.04 (0.03) 54.6 (9.7) 1,926 (259) 507 (99.0) 179 (19.3) 14
WT BAPTA 1.26 (0.04) 1.07 (0.05) 119 (11.8)a 1,093 (65.9)a 437 (54.1) 201 (26.8) 22
All WT 1.28 (0.03) 1.06 (0.03) 94.0 (9.6) 1,416 (126) 464 (50.2) 207 (18.6) 36
Null EGTA 1.25 (0.07) 0.68 (0.04)b 43.4 (6.7) 1,189 (174)b 448 (111) 39 (9.99)a 9
Null BAPTA 1.35 (0.04) 0.74 (0.04) 115 (15.3)a 982 (78.8) 604 (100) 59 (8.30)a 14
All null cells 1.32 (0.04) 0.72 (0.03)b 89.2 (12.4) 1,061 (82.7)b 547 (75.2) 51 (8.46)a 23
Effects of long lasting depolarization are shown. The second column shows initial FRET ratio in resting cells. The third column shows steady value of ratio reached after a pulse to 30 mV, 0.4–0.5 s long in experiments with BAPTA or 1–1.5 s in experiments with EGTA. Note that R initial is approximately the same for different preparations, but the extent of decay (depletion) is much greater in Casq-null cells. The fourth and fifth columns show peak Ca2+ release flux and amount released after the maximal long-lasting pulse. Note significantly greater peak flux in BAPTA but no difference in peak flux values between WT and nulls. Amount released is decreased in the null cells by about 30%. The sixth and seventh columns show initial and final values of [Ca2+]SR, calculated from corresponding R values. SEM values are shown in parentheses.aValues in BAPTA are significantly different from those in EGTA.bValues in null are significantly different from those in WT.
on July 29, 2011jgp.rupress.org
Dow
nloaded from
Published July 25, 2011

236 A channel-gating role of calsequestrin
fibers, after 1 h of equilibration with BAPTA in the patching pipette. Under this condition, Rel t
•( ) became
greater and faster changing. Although in EGTA it takes 200 ms for flux to decay to half-value in its quasi-steady phase (Royer et al., 2010), this decay took <50 ms in BAPTA. For this reason, the duration of the pulses was reduced to 400 ms, which left more time for recovery and signal averaging, and the display time scales were adjusted accordingly. As can be seen in the flux record (Fig. 4 C, black trace) and confirmed in Table I, with BAPTA in the pipette, Rel t
•( ) peaked at a more than two-
fold greater value than in the presence of EGTA and displayed a prominent shoulder at 25–40 mM/s, a shoulder which was often pinched in the shape of a hump or secondary increase. The most prominent dif-ference in BAPTA, though, was the very rapid decay of Rel t
•( ) to a low steady level, decay which in most cases
took <100 ms.
[Ca2+]SR, regardless of the release history or kinetics whereby such level was reached (a prediction that was recently tested in cardiac muscle by Zima et al. [2010], with positive results). The hypothesis was tested in this study through the introduction of a different exoge-nous Ca2+ buffer.
BAPTA has an affinity for Ca2+ similar to that of EGTA and two orders of magnitude faster kinetics of reaction (e.g., Wu et al., 1996). Its substitution for EGTA is a well established test for the presence of Ca2+-dependent inactivation (CDI), which may be reduced in the presence of BAPTA at high concentrations. In these tests, we used 5 mM BAPTA, which under cur-rent estimates of Kd results in an equilibrium buffer power similar to that of 10 mM EGTA present in our reference medium.
Fig. 4 shows Ca2+ transients recorded in the same manner as in the previous experiments in WT muscle
Figure 3. Simultaneous determination of [Ca2+]c(t) and [Ca2+]SR(t) in a Casq1-null cell. (A) Fluorescence of cytosolic monitor in cell perfused with EGTA. (B) R(x,t) and (in white trace) its line average R(t). The dashed line marks Rmin. (C) Release flux (black) and [Ca2+]SR(t) (red). Details of description were given in legend of Fig. 2. Note the greatly increased degree of depletion by the end of the pulse. Also note the continued decrease of R(t) during the pulse, contrasting with sta-bilization in the WT (Fig. 2). ID: 062410a _s34. Average of eight line scans obtained 31–51 min after establishing whole-cell patch is shown.
on July 29, 2011jgp.rupress.org
Dow
nloaded from
Published July 25, 2011

Sztretye et al. 237
approximately by a Boltzmann function with transi-tion voltage VT = 14 mV, and flux depended on volt-age in a similar way, but its transition voltage was 6 mV more positive.
In voltage clamped flexor digitrorum brevis (FDB) cells, we recorded charge movement current IQ and computed Qm to evaluate the effects of a prior depolar-ization. The results are illustrated in Fig. 6. At the top is IQ in test depolarizations to a variable level Vm, applied from rest or after a conditioning depolarization of 400 ms, which is a duration chosen to be in excess of the times of interest. Fig. 6 B plots Qm versus Vm in the range 0–40 mV for the same cell, with QON represented by closed symbols, QOFF by open symbols, and the conditioned values in red. QOFF values, which are similar to QON for pulses up to 0 mV, become progressively greater at Vm > 0 mV, which is an indication that large test voltages activate ionic cur-rents that interfere with the measurement of Qm.
The conditioning depolarization (currents and sym-bols in red) caused changes in the distribution, includ-ing a decrease by 20% of Qmax, the maximum of the Boltzmann fit to QON. However, Qm values were actually affected only at voltages >0 mV. This suggests that the
In correspondence with the faster flux, [Ca2+]SR decayed more abruptly in BAPTA but did not reach substantially lower levels than when EGTA was used as buffer (Table I). In the Casq-null cells, illustrated in Fig. 5, BAPTA had a similar effect: it enhanced Rel t
•( ) and accelerated de-
pletion of the SR, but the final [Ca2+]SR reached was similar to that in the null cells in EGTA, as was the case for WT cells.
Voltage-dependent inactivation of the voltage sensorThe results of the previous section show that release flux decreases substantially after partial SR depletion, with half-times of 50–200 ms (depending on the buffer present intracellularly). One of the possible causes of reduction of Ca2+ release is inactivation of the t tubule voltage sensor, the dihydropyridine receptor, which in addition to disabling the release response manifests itself by substantial reduction of the amount of intra-membranous charge mobile in the voltage range in which the functional response is elicited. In mouse fast-twitch muscle, intramembranous charge displacement Qm and release flux were first measured in detail by Ursu et al. (2005), who found that Qm (Vm) was described
Figure 4. [Ca2+]c(t) and [Ca2+]SR(t) in a WT cell with BAPTA. (A) Fluorescence of X-rhod-1. (B) R(x,t) and (in white trace) its line average R(t). (C) Plots of release flux and [Ca2+]SR(t) as in Figs. 2 and 3. Internal solution was BAPTA. Note the radical changes in ampli-tude and kinetics of flux compared with Fig. 2, most notably an increase in peak and inter-mediate level, with a reduction in duration of the intermediate stage and the appearance of a hump (arrow). Also note a greatly expanded temporal scale, to better display the hastened kinetics. ID: 051209b _s43. Average of 13 line scan images taken 47–72 min after patching is shown.
on July 29, 2011jgp.rupress.org
Dow
nloaded from
Published July 25, 2011

238 A channel-gating role of calsequestrin
with little interference by asymmetric ionic currents. The charge displaced by test pulses preceded by the conditioning depolarization (red symbols) was statisti-cally not different from the reference values at any po-tential within this range. Considering that the transition voltages of both charge movement and release activa-tion are <0 mV (e.g., Ursu et al., 2005), the results imply
effects observed at positive Vm reflect an alteration of ionic currents more than a true inactivation of volt-age sensors.
Qm averaged over 10 experiments at test voltages of 0 mV or lower is plotted in Fig. 6 C. In this range of Vm, the averages of QON and QOFF are not significantly different; this suggests that the displacements are well determined,
Figure 5. [Ca2+] in cytosol and SR in a Casq-null cell with BAPTA. (A) Fluorescence of X-rhod. (B) R(x,t) and (in white trace) its line average R(t). (C) Release flux (black) and [Ca2+]SR(t) (red). Details of description were given in legend of Fig. 2. Note the rapid sta-bilization of fluorescence in the cytosol and rapid decay of release flux to very low levels, which is a consequence of the presence of BAPTA. Also note the lack of any shoulder or hump in the evolution of release flux and the drastic decay of [Ca2+]SR to nearly 0, which is a consequence of the absence of Casq. ID: 082009b_s34. Average of 10 line scan images taken 48–68 min after patching is shown.
TA B L E I I
Testing whether EC coupling properties are altered by exogenous Casq
Conditions R initial R final Peak flux Amount [Ca]SR initial [Ca]SR final n cells
mM s1 µM µM µM
WT EGTA Casq 1.33 (0.05) 1.06 (0.04) 61.2 (12.8) 2,197 (320) 547 (138) 183 (25.8) 10
WT EGTA Asp 1.29 (0.02) 1.04 (0.06) 38.0 (8.44) 1,246 (185) 407 (23.0) 170 (24.7) 4
WT BAPTA Casq 1.29 (0.04) 1.05 (0.05) 123 (12.8) 1,191 (76.5) 448 (58.9) 201 (26.8) 14
WT BAPTA Asp 1.22 (0.08) 1.12 (0.07) 113 (24.5) 920 (101) 416 (113) 263 (59.7) 8
Null EGTA Casq 1.16 (0.18) 0.63 (0.08) 46.3 (15.2) 947 (88.6) 404 (259) 27.7 (18.7) 3
Null EGTA Asp 1.31 (0.06) 0.71 (0.05) 41.7 (7.39) 1,334 (265) 475 (117) 45.3 (12.1) 6
Null BAPTA Casq 1.38 (0.06) 0.70 (0.08) 86.3 (19.8) 1,139 (70.6) 658 (144) 51.6 (24.6) 6
Null BAPTA Asp 1.33 (0.05) 0.78 (0.03) 137 (19.9) 848 (114) 564 (144) 65.7 (9.27) 8
Definitions of values in columns are as in Table I. Groupings of cells in Table I are further separated depending on the Casq variant fused to the biosensor. No significant differences were found in the properties of [Ca2+]SR and release flux between cells expressing D4cpv-Casq1 and D4cpv-Asp. SEM values are shown in parentheses.
on July 29, 2011jgp.rupress.org
Dow
nloaded from
Published July 25, 2011

Sztretye et al. 239
that charge movement of the voltage sensor is minimally affected. In conclusion, voltage-dependent inactivation cannot be a major determinant of the drastic decay in flux demonstrated in the previous sections. These re-sults are therefore compatible with every component of the working hypothesis: channels close during long- lasting Ca2+ release, the change is brought about by re-duction of [Ca2+]SR below a certain threshold, and this effect requires the presence of Casq, presumably as an allosteric transducer of the change in [Ca2+]SR.
Effects of the presence of the biosensorA major advantage of the present approach to measur-ing [Ca2+]SR is the almost perfectly selective targeting of the biosensor to the SR, provided by the fused Casq1. This approach has, of course, the disadvantage of adding exogenous, fused Casq1 to the native SR endowment. We tested for effects of the extrinsic Casq in two ways: using D4cpv fused to a variant of Casq1 with impaired Ca2+ binding (Shin et al., 2000) and using the naturally occurring intracell heterogeneity in density of biosen-sor expression, which results in changes in local bio-sensor concentration by up to 10-fold.
All aforementioned experimental combinations be-tween WT and null cells, as well as between cells per-fused with EGTA and cells with BAPTA, were performed as two sets of experiments, one using D4cpv-Casq1, with the native Casq sequence, and another using D4cpv- Asp. The averaged results for all sets are listed in Table II. The database presented in both Tables I and II is the same, the single difference being the separation by bio-sensor variant in Table II. Therefore, all differences al-ready described between WT and null and between flux characteristics in the two buffers are also contained in Table II and are not marked. Data in Table II reveal virtually no differences in either flux or depletion characteristics attributable to the use of different variants of the biosensor. Thus, this analysis validates the approach used in Table I of grouping results ob-tained with both variants of the biosensor. Other im-plications of this negative result will be described in the Discussion.
The second evaluation of potential buffering effects of the extrinsic Casq is illustrated in Fig. 7. In Fig. 7 A is the invariant image of biosensor in a cell, obtained by combination of F1 and F2 according to Eq. A6 of Sztretye et al. (2011). The intensity of this image is proportional Figure 6. Effects of a conditioning depolarization on the t tubule
voltage sensor. (A) Intramembranous charge movement currents IQ in test depolarizations to a variable level Vm applied from rest or after a conditioning depolarization (diagram at top). (B) Charge displacement Qm versus Vm in the range 0–40 mV for the same cell, with displacement during the ON (QON) represented by closed sym-bols, QOFF values by open symbols, and the conditioned values in red. QOFF values become progressively greater than QON at Vm > 0 mV, which is an indication that large test voltages activate ionic cur-rents that interfere with the measurement of Qm. The continuous curves plot Boltzmann fits QON = Qmax/(1 + exp((Vm VT)/K)). In reference (black), the parameter values were Qmax = 24.0 nC/F,
VT = 16.4 mV, and K = 16.5 mV. After conditioning (red) Qmax = 19.0 nC/F, VT = 20.3 mV, and K = 16.3 mV. ID: 1066E. (C) Qm averaged over 10 experiments at test voltages up to 0 mV. Symbols and colors are as described for B. Error bars represent SEM. In this range, the averages of QON and QOFF were not significantly dif-ferent, and the changes induced by the conditioning depolariza-tion were not significantly different from zero. ID: 1059E through 1069E (excludes 1062E).
on July 29, 2011jgp.rupress.org
Dow
nloaded from
Published July 25, 2011

240 A channel-gating role of calsequestrin
The functional properties of regions with different concentrations of the fusion protein were compared in simultaneous line scans of fluorescence of biosensor and cytosolic dye, which in the example were obtained at or near the dashed line in Fig. 7 A. Two regions of the line scans, marked as “a” and “b” by segments below Fig. 7 A, were averaged and processed separately, with results plotted in the figure. The average concentrations of bi-osensor were 1.54 µM and 7.54 µM, respectively, in a and b. The observations with the cytosolic monitor are illustrated in Fig. 7 (E and F); Rel t
•( ) was essentially iden-
tical in the two regions. The evolution of amount released,
to biosensor concentration, scaled according to the color table in micromoles of protein per liter of cell. In Fig. 7 B is the ratio image, R(x,y), at rest. The histogram of this image, in Fig. 7 C, is narrow, which is consistent with a FRET ratio that is nearly constant and therefore essentially independent of biosensor concentration. (An exception is the perinuclear area, where biosensor concentration is extremely high and R is slightly lower, a trend evaluated by our companion paper [Sztretye et al., 2011], in which we showed that the slight varia-tion was probably related to local changes in the prop-erties of the biosensor, rather than in [Ca2+]SR).
Figure 7. Release flux and FRET ratio in a cell with spatially heterogeneous biosensor expression. (A) Biosensor concentration (invari-ant image) calculated as described in Eq. A6 of Sztretye et al. (2011). (B) FRET ratio R. (C) Histogram of pixel values of R. The distribu-tion is narrow, which is consistent with a lack of effect on R of the variation in [biosensor]. (D) R(t) in line scans along dashed line in A, averaged over regions a (high [biosensor]) and b (low) indicated by line segments at the bottom of A. The average concentration of biosensor was 7.54 µM and 1.54 µM, respectively, in a and b. Note slightly greater R in region b. (E and F) R tnet
•( ) and its integral Rel(t)
(Eq. 4) in regions a and b. No difference is visible in spite of the large change in biosensor concentration. ID: 072309a image 29.
on July 29, 2011jgp.rupress.org
Dow
nloaded from
Published July 25, 2011

Sztretye et al. 241
Two aspects of this mechanism were tested in this study. Depletion measured under the same protocol was found to be much more complete in Casq1-null mice than in the WT. The final level of [Ca2+]SR reached after prolonged depolarization in the null muscles was measured at between 10 and 60 µM.
An additional prediction was tested, that release must terminate at a fixed level of [Ca2+]SR, regardless of the path or history of Ca2+ release that caused [Ca2+]SR to reach that level. The prediction was tested by substitu-tion of BAPTA for EGTA in the internal solution, a ma-neuver predicted to change release flux by interfering with CDI of the release channels. This had the expected effect, making Rel t
•( ) substantially greater, both at its
peak and its intermediate or shoulder stage.As a consequence of the increase in Rel t
•( ), the [Ca2+]SR
level associated with release termination in EGTA was reached much sooner in BAPTA. Termination of re-lease occurred at this much earlier time, in agreement with the hypothesis that the trigger for termination is the attainment of a certain value of SR lumenal [Ca2+]. All observations are therefore consistent with the notion that [Ca2+]SR reduction below 150 µM results in a sig-nal for channel closure, a signal which requires the presence inside the SR of Casq, presumably acting as an allosteric sensor of the fall in [Ca2+]SR.
Permeability to Ca2+ of the SR membrane decreases upon depletionA quantitative representation of the changes induced by depletion is provided by the evaluation of permeabil-ity to Ca2+ of the SR membrane, an evaluation which the new tool allows us to do directly, without resorting to model-dependent guesses about the evolution of the Ca2+ gradient. The algebra of the measurement is simple. Membrane permeability is defined as
Pt A
º( )
-+ +
amount
Ca CaSR
SR c
.
[ ] [ ],2 2
(5)
where ASR represents SR membrane area, the numera-tor is flux per unit area, and the denominator is the [Ca2+] gradient. Then the ratio of measured flux to measured gradient is proportional to P, namely
Re Rel l
A
A t V
·
+ +
·
+-» =
=
[ ] [ ] [ ]
. . .[
Ca Ca Ca
.amount
Ca
SR c SR
SR
SR c
2 2 2
2++ =] .
.SR
SRAV
P0 7
Here the free cytosolic Ca concentration [Ca2+]c has been neglected by comparison with [Ca2+]SR, and the cytosolic volume Vc has been equated to 0.7 of the cell volume V (0.865 is the fraction of mouse fiber volume
Rel(t), in Fig. 7 F, was also nearly identical in regions a and b. This similarity is especially meaningful because Rel(t), which is the integral of net flux (Eq. 4), should reveal any significant difference better than the noisy Rel t
•( ) records. Evidently none existed in this case.
As described in the companion paper (Sztretye et al., 2011) and exemplified in the present case by the graph in Fig. 7 D, a small difference in R, of 0.03 in the example, was frequently observed in favor of the regions of lower biosensor concentration. As shown, the differ-ence was essentially constant during concentration transients, suggesting a shift in optical properties of the biosensor.
Based on different observations, it therefore ap-pears that the fusion of Casq1 and biosensor, ex-pressed within the present concentration range in WT cells, does not interfere with the Ca2+ movements of excitation–contraction coupling (EC coupling). This conclusion does not exclude the possibility of buffering effects of the biosensor when it is expressed in Casq-null cells.
D I S C U S S I O N
In this study, the flux of voltage-induced release of Ca2+ into the cytosol and the free SR [Ca2+] were simultane-ously monitored in skeletal muscle cells. Because this is to our knowledge the first study to date that com-bines both measurements in skeletal muscle, its focus has been narrowly defined, leaving for future work many other questions that can be addressed with the present techniques.
The first observation made was that the depletion of SR Ca2+ caused by membrane depolarization is limited in WT cells. Specifically, the release of Ca2+ induced by continuous membrane depolarization at levels that maximally activate the release process resulted in the free [Ca2+] of the SR stabilizing at 35% of the initial value, measured in the cells at rest. Roughly, [Ca2+]SR started at 500 µM, or a bit less, and stabilized at between 150 and 200 µM, after continued release for 0.5 s. The observation implies that release channels close before depletion is complete. Measurement of intramembra-nous charge movement, which is largely a manifestation of the voltage-sensing function of the dihydropyridine receptor, failed to show a significant reduction of charge displacement by the depolarizations, which rules out in-activation of the voltage sensor as a major determinant of the channel closure.
The observation is consistent with prevailing ideas of control of Ca2+ release in cardiac muscle (as recently elaborated by Zima et al. [2010]), whereby ryanodine receptor (RyR) channels close and terminate Ca2+ re-lease when [Ca2+]SR reaches a threshold value in a con-trol process mediated by Casq and perhaps requiring other junctional proteins.
on July 29, 2011jgp.rupress.org
Dow
nloaded from
Published July 25, 2011

242 A channel-gating role of calsequestrin
As already stated in the companion paper (Sztretye et al., 2011), the measurement of steady [Ca2+]SR agrees well with the average values obtained in mice muscle by Rudolf et al. (2006) using D1ER. In their work, it was found that a single twitch resulted in a variable reduc-tion of R, corresponding to a change in [Ca2+]SR of be-tween 5 and 30% of its resting value. Although these numbers are imprecise and we have not measured de-pletion during twitches, the decay in [Ca2+]SR that we measure after 5 ms of depolarization ranged between 5 and 10% of the resting value, in rough agreement with those measurements and also with existing esti-mates of the amounts of Ca2+ that can be released in a twitch (for instance, by Jong et al. [1993]).
The studies by Rudolf et al. (2006) and Canato et al. (2010) with D1ER included a measure of the reduction in R caused by tetanic field stimulation, a reduction which in the first study reached no more than 25% of the initial R Rmin value and in the more recent study was of the order of 30% of the initial value (specifically, 0.1 in Fig. 2 of Canato et al. [2010]). All of these esti-mates of depletion are therefore in rough agreement with the present ones, allowing for the difference in duty cycle of activation.
outside mitochondria and SR [Eisenberg, 1983]; Baylor et al. [1982] calculate the water content of frog muscle fibers as 0.810 gm/cm3; an approximate number for the fractional volume of water outside the SR and mito-chondria is therefore 0.865 0.810 gm/cm3 = 0.701). The measurable variable is Rel
•+[ ] ,Ca SR
2 with dimensions of inverse time (units are s1). Following common usage, this measurable variable will be loosely referred to as “permeability,” with the underlying assumption that the factor relating it to actual permeability (ASR/(0.7V)) remains constant.
Permeability, thus calculated for the four experi-mental example cases, is plotted in Fig. 8. The records for WT are in black trace, and those of null muscle cells are in red. In both EGTA (Fig. 8 A) and BAPTA solu-tions (Fig. 8 B), permeability in WT cells decays mark-edly during the pulse but does so much more rapidly in BAPTA (Table I). The corresponding records in Casq-null cells evolve either without the marked decrease (Fig. 8 A) or show a decay in permeability that is tran-sient (Fig. 8 B). In every Casq1-null cell examined, the final level of permeability was several times greater than that in the WT cells at comparable times.
The striking difference in the evolution of permeabil-ity between WT and nulls could have been predicted from the different final degree of depletion. Indeed, it has already been shown that the final (steady or cycling) levels of flux are similar in WT and Casq-null cells (Royer et al., 2010). Therefore, the approximately equal flux requires greater permeability in the nulls given their greater degree of depletion.
It is noteworthy that the difference in P between WT and null is reflected in the final level of [Ca2+]SR but not in the final flux level. This result suggests that the main contributors to the steady movements of Ca2+ after a long-lasting depolarization are SR to cytosol flux through RyRs and removal by SERCA. In turn, this re-moval flux is largely determined by the steady cytosolic [Ca2+] level, which does not differ substantially between WT and null cells. The release flux through RyRs, which must be equal and opposite in the steady situation, set-tles at the same value as in the WT, a value resulting from a smaller gradient and a greater permeability.
Measurements with cameleon biosensors are in qualitative agreementThe present results can be compared with earlier studies. Working on toad muscle, Kabbara and Allen (2001) used SR-loaded fluo-5N to dynamically moni-tor for the first time the evolution of [Ca2+]SR during the EC coupling process. They reported a 33% reduc-tion in [Ca2+]SR upon field stimulation at 100 Hz, a number which seems not inconsistent with our find-ings (that is, a reduction by 65%), allowing for the lesser duty cycle of tetanic stimulation compared with con-tinuous depolarization.
Figure 8. Ca2+ release permeability. Permeability, calculated as defined in Eq. 5, during a long-lasting, supramaximal pulse is shown. (A) For cells shown in Figs. 2 and 3, in which the solution in the pipette was EGTA. (B) For cells in Figs. 4 and 5, in which the solution in the pipette was BAPTA. Note how the permeability decays sharply during a pulse in the WT; it either remains elevated or recovers after initially decaying in the Casq KO.
on July 29, 2011jgp.rupress.org
Dow
nloaded from
Published July 25, 2011

Sztretye et al. 243
who also showed that the deletion mutant does not polymerize in aqueous solutions upon Ca2+ binding as the native form does. The differences in release flux and degree of depletion between WT and Casq nulls or in the presence of BAPTA were also observed with the deletion variant. However, these properties did not change significantly when measured with one or the other form of the fused biosensor.
In another demonstration of at most modest effects of the extrinsic buffer, we found no visible differences between Ca2+ transients and the underlying flux in areas of the same cell expressing the biosensor at different densities. The lack of substantial effects was to be ex-pected, given the concentrations at which the protein was expressed. For example, in the test illustrated by Fig. 7, the concentration of biosensor in the area of high expression was 7.54 µM. Considering that a Casq molecule may provide 60 Ca2+ binding sites and that it is probably <50% saturated at rest, the areas of high con-centration may have had 180 µM of additional Ca2+. This is much less than the amount believed to be bound to native Casq, thus justifying the absence of measur-able differences in Ca2+ release. It is also possible that Casq in fusion with the biosensor cannot engage cor-rectly in the polymerization believed to be needed to attain its high buffering power (Park et al., 2004).
Regulation by lumenal Ca2+ has been controversialAlthough in the case of cardiac muscle a consensus is emerging regarding the nature of control of Ca2+ re-lease channels by lumenal Ca2+, in skeletal muscle the evidence is contradictory. Meissner (1986) showed in SR vesicle preparations that increasing lumenal Ca2+ shifts the dependence of flux activation to lower cyto-solic [Ca2+]. Likewise, Donoso et al. (1995) found that increasing [Ca2+]SR promoted flux from vesicles. Tripathy and Meissner (1996) provided evidence that the pro-motion was, at least partially, caused by flow-through ef-fects, actions of the increased lumenal Ca2+ on the cytosolic regulation sites. Pape et al. (1995, 1998) and Pape and Carrier (1998) described in frog muscle a large increase in release permeability with decreasing SR content, an increase which Pizarro and Ríos (2004) confirmed but evaluated at a much lower value relative to the initial permeability. Interestingly, they also showed that the discrepancy resulted from different estimates of the initial and final values of [Ca2+]SR, which nei-ther laboratory could measure at the time. Both groups found evidence to indicate that the increase in permea-bility with depletion reflects relief from inhibition by Ca2+ acting on cytosolic sites. Therefore, none of those works could pin down a truly lumenal regulatory effect of Ca2+.
Also working on frog muscle, Launikonis et al. (2006) studied the effects of changes in [Ca2+]SR (which were measured using shifted excitation and emission ratioing
The study of mouse FDB fibers under voltage clamp by Jiménez-Moreno et al. (2010) also showed that R de-creased with increasing duration of depolarizations, stabilizing after 150 ms. This decay was again consistent with partial depletion. The magnitude of the decay measured by this group during a long-lasting depolar-ization averaged only 6% of the available range, whereas it was close to 65% in our case. One possible explana-tion of the discrepancy is that the sensor was closer to saturation in the earlier paper, and therefore the mod-est changes in R reflected a disproportionately greater reduction in [Ca2+]SR.
Canato et al. (2010) provided a first comparison of the evolution of [Ca2+]SR in WT and Casq1 or Casq1/2-null cells upon physiological activation. They showed that tetanic trains of action potentials caused a much greater depletion in nulls than in WT cells, a result which fully agrees with the present observations under voltage clamp depolarization. The two sets of results demonstrate that these cameleon biosensors can reach close to Rmin in living cells depleted by depolarization and therefore suggest that the limited decay in R fea-tured in the WT is caused by an actual difference in the evolution of [Ca2+]SR between WT and Casq-null cells.
The four works cited are in qualitative agreement with the present results in showing that prolonged de-polarization or tetanic stimulation can only release part of the SR Ca2+ content. This is in contrast with the ob-servations of Ziman et al. (2010). Using Fluo-5N loaded preferentially in the SR, these authors found 90% re-duction of [Ca2+]SR in mouse FDB fibers tetanically stim-ulated at 50 Hz. Although this is by far the greatest depletion reported in any study, it may also be the most reliable measurement, as the work included precise cali-brations of the signal in every individual cell. The tech-nique requires loading the buffer BAPTA in AM form, which results in the establishment of a substantial but unknown concentration of active buffer in the cytosol and other compartments of the cells. Although this condition marks a variance with what others have done, our present results suggest that the sole presence of BAPTA in the cytosol does not explain the greater de-gree of depletion. In any case, Ziman et al. (2010) estab-lished that the SR of their WT cells can release more and deplete to a fuller extent than it does in the present experiments. More work is clearly needed to under-stand the discrepancies.
Casq in the biosensor does not alter Ca2+ releaseThe possible interference by Casq added as part of the biosensor was tested in two ways. Measurements per-formed with Casq1-fused biosensor were repeated under every condition using Casq with the C-terminal stretch of aspartate residues deleted. This variant was shown to have a greatly reduced ability to bind Ca2+ (Shin et al., 2000), a property confirmed by Park et al. (2004),
on July 29, 2011jgp.rupress.org
Dow
nloaded from
Published July 25, 2011

244 A channel-gating role of calsequestrin
The termination mechanisms in amphibians and mammalsWorking on frog skeletal muscle, Shirokova and Ríos (1996) combined long-lasting depolarization under voltage clamp and caffeine applications to demonstrate properties that are strikingly different from those now observed for the mouse. Indeed, the amount of Ca2+ re-leasable by depolarizing pulses was always equal to the amount present in the caffeine-releasable pool. In other words, the depolarization was capable of emptying the SR (or its caffeine-releasable content). Given this prop-erty, it was possible to compute a permeability from measured quantities (as the ratio of flux to total Ca2+ content in the SR), which was found to increase with progressive depletion of the SR. This essentially direct evaluation of permeability indicates that the Casq- mediated termination mechanism now reported for the mouse is absent in the frog. Fig. 9, combining data from studies by Rengifo et al. (2002) and Royer et al. (2008), clearly demonstrates qualitative differences in the time course of release flux for frogs (green) and mice (black). The much more abrupt decay in the mouse, after the brief shoulder, can now be as-cribed to the fall in permeability that operates in the mammal, reflecting an essential difference in the mechanisms that underlie termination of flux in these species. Specifically, the shoulder was described as a stage where flux decays at a rate of order greater than one (Royer et al., 2008). The present study clari-fies the reasons for such rapid decay, attributing it both to depletion, which reduces the driving force, and closure of release channels.
of Mag-Indo-1) on the properties of Ca2+ sparks. Increas-ing [Ca2+]SR from 250 to 400 µM resulted in a reversible rise in spark frequency by 70%. Although the effect was statistically significant, it was of much lesser magnitude than the increases observed in cardiomyocytes under similar changes of [Ca2+]SR.
From this collected evidence, Ríos et al. (2006) concluded that the termination mechanism for skele-tal muscle was uncertain. Since that time, evidence has strengthened for a Casq-dependent termination role of [Ca2+]SR in heart cells (most notably with the contribution by Zima et al. [2010]). Two new sets of papers are directly relevant to the role of lumenal Ca2+ in skeletal muscle, but they are still contradic-tory. Qin et al. (2008, 2009) found a clear difference in the behavior of bilayer-reconstituted RyR channels from skeletal and cardiac muscle. Although cardiac channels displayed high sensitivity to [Ca2+]trans (i.e., on the SR lumenal side of the bilayers) when either Casq1 or Casq2 were present (Qin et al., 2008, 2009), skeletal RyR channels did not show such sensitivity (Qin et al., 2009). The observations appeared to rule out a physiological modulation of RyR1 channel gat-ing by Ca2+ inside the SR. In contrast, Protasi et al. (2009) and Dainese et al. (2009) demonstrated ma-lignant hyperthermia susceptibility in the Casq1-null mouse and attributed it to a dysregulated RyR1 in the absence of Casq.
Against this backdrop of contradictory findings, the present measurements of permeability, for being direct and reaching repeatable results under varied conditions, strongly support the presence of regula-tion by lumenal Ca2+ mediated by Casq. Canato et al. (2010) added to this picture the observation of simi-lar consequences of the absence of Casq under more physiological stimulation. These results support a dual involvement of store depletion in termination of Ca2+ release: a direct reduction of flux as the result of decay in the [Ca2+] gradient and RyR unitary cur-rent, plus a mechanism similar to that of cardiac muscle, whereby reduction of [Ca2+]SR below a certain level constitutes a channel-closing signal transduced by Casq.
The present experiments used BAPTA as a tool to hasten release and SR depletion, presumably by inhibit-ing CDI of the RyRs. There is clear evidence of CDI in frog muscle (Baylor et al., 1983; Melzer et al., 1984; Pape et al., 1995; Pizarro and Ríos, 2004), and the pres-ent results support its operation in the mouse. The pro-motion of release flux by BAPTA demonstrates that CDI is operative in the mouse. Moreover, its observation in both WT and Casq1-null muscles indicates that CDI does not require the presence of Casq. It remains to be tested whether and in what ways Casq, and indirectly [Ca2+]SR, modulates the inhibitory effects of cytosolic Ca, changing their extent or time course.
Figure 9. The time course of flux is different in frogs and mice. The black trace shows release flux in a WT mouse FDB cell, ac-tivated by the voltage clamp pulse represented at the top. The green trace shows a comparable record for a cell from frog semi-tendinosus muscle voltage clamped in a Vaseline gap. Records are scaled to match the levels reached after the early peak. Note in the mouse the more complex decay, described as a shoulder. Cells are in similar but not identical solutions designed to block ionic currents. Both internal solutions had 10 mM EGTA. The mouse cell was studied by Royer et al. (2008). The frog cell was studied by Rengifo et al. (2002).
on July 29, 2011jgp.rupress.org
Dow
nloaded from
Published July 25, 2011

Sztretye et al. 245
membrane. This change requires the presence of Casq be-cause it is absent or strongly modified in Casq1-null mice. It is directly related to the attainment of a set low [Ca2+]SR because it occurs at the same [Ca2+]SR in spite of drastic changes in release kinetics induced by the presence of dif-ferent Ca2+ buffers in the cytosol. Such mechanism is simi-lar to one currently favored to explain the termination of Ca2+ sparks of cardiac muscle (e.g., Györke and Terentyev, 2008), which suggests a commonality of devices for con-trol of Ca signals in striated muscles. Finally, the study con-tributed evidence for CDI of the release channels. In conclusion, [Ca2+]c, [Ca2+]SR, and Casq act together to control release termination in mouse muscle.
A P P E N D I X
[Ca2+] derived kinetically from a ratio signalThe goal of this appendix is to derive the relationship between concentration of a monitored species (rep-resented by C or [Ca2+]) and the signal of a ratiomet-ric indicator, sensor, with 1:1 stoichiometry without the usual assumption of instantaneous equilibrium. Such relationship may be considered a kinetic gener-alization of the Grynkiewicz equation (Grynkiewicz et al., 1985),
[ ] ,min
max
Ca d2+ =( ) -
-bK
R RR R
which is Eq. 1 in the companion paper (Sztretye et al., 2011) in the case of n = 1. Although this derivation uses the language of fluorescence, the expression derived is valid for any property or signal that depends linearly on indicator concentration and changes when the indica-tor binds to the monitored substance.
Here indicator ratio R is defined as F2/F1, where F1 (also donor) and F2 (or acceptor) fluorescence satisfies the following:
F D CD CD
F D CD CDC
C
1 1 1
2 2 2
= -( ) + ´
= -( ) + ´T
T
e e
e e . (A1)
DT is total sensor concentration, CD is concentration of sensor bound to the monitored species, and j is the intensity of fluorescence per micromolar at stan-dard excitation and gain settings. A subindex j equal to 1 or 2 represents, respectively, fluorescence in the donor or acceptor range, with free sensor; j equal to 1C or 2C represents the corresponding intensity with bound sensor. From Eq. A1 and the definition of R, it follows that
CDD R
R C C
=-( )
-( )- -( )T e e
e e e e2 1
1 1 2 2
. (A2)
SR permeability versus evacuabilityA recurrent goal of the studies of Ca2+ release is to sepa-rate the two mechanisms that determine its evolution, namely, changes in driving force (depletion) and changes in gating, or channel properties. Until the present work, such parsing was hampered because data were limited to Ca2+ release flux and its time integral, from which in-ferences were made about what was left inside the SR. Given those limitations, the traditional approach has been to take as the measure of permeability the depletion-corrected flux (Schneider et al., 1987), defined as
Re Rel
lC
··
ºCaSR
,
where CaSR represents total Ca remaining inside the SR. This remainder had to be estimated, which was done as-suming that it reaches a low or negligible value after a long depolarization.
Royer et al. (2008, 2010) demonstrated that RelC•
is proportional to P/B, where is the ratio of SR surface over volume, P is SR Ca2+ permeability, and B is SR Ca2+ buffering power. Royer et al. (2008) named this prod-uct the evacuability, E, and showed that under some cir-cumstances E could be approximated by the normalized flux rate of change, NFRC, an index derived from Rel t
•( )
(see Supplemental material). Using this approxima-tion, they concluded that E increases during long last-ing pulses, as the SR is depleted. Barring shape changes in the SR, an increase in E implies that P increases, B decreases, or that both changes take place.
The present results, specifically the direct measure-ment of a decreasing P, are difficult to reconcile with an increase in E. We now believe, as argued in the Supple-mental material, that E in fact decreases, consistent with the decrease in P. Fig. S2 shows that the error term, sep-arating E from its estimator, NFRC, becomes large if some assumptions are not upheld, thus explaining the earlier, wrong conclusion.
SummaryThe present two papers demonstrate that the novel tool D4cpv-Casq1 and its variant D4cpv-Asp provide a cali-brated ratiometric measure of [Ca2+] inside the SR of adult mice muscle cells. They yield a measure of stable [Ca2+]SR that on average is not different from earlier es-timates and is significantly <1 mM. In agreement with in vitro measurements of the kinetics of the sensor-Ca2+ re-action, the changing [Ca2+]SR can be followed dynami-cally during EC coupling. When this is done in parallel with measurements of [Ca2+]c and Ca2+ release flux, it is revealed that the built-in termination process observed upon depletion of the SR is largely caused by closing of the release channels, which is translated at the cellular level as reduction of the permeability to Ca2+ of the SR
on July 29, 2011jgp.rupress.org
Dow
nloaded from
Published July 25, 2011

246 A channel-gating role of calsequestrin
Eisenberg, B.R. 1983. Quantitative ultrastructure of muscle. In Handbook of Physiology: Skeletal Muscle. L.D. Peachey, editor. Lippincott Williams and Wilkins. 73–112.
Escobar, A.L., P. Velez, A.M. Kim, F. Cifuentes, M. Fill, and J.L. Vergara. 1997. Kinetic properties of DM-nitrophen and calcium indicators: rapid transient response to flash photolysis. Pflugers Arch. 434:615–631. doi:10.1007/s004240050444
Grynkiewicz, G., M. Poenie, and R.Y. Tsien. 1985. A new generation of Ca2+ indicators with greatly improved fluorescence properties. J. Biol. Chem. 260:3440–3450.
Györke, S., and D. Terentyev. 2008. Modulation of ryanodine re-ceptor by luminal calcium and accessory proteins in health and cardiac disease. Cardiovasc. Res. 77:245–255. doi:10.1093/cvr/ cvm038
Györke, S., S.C. Stevens, and D. Terentyev. 2009. Cardiac calseques-trin: quest inside the SR. J. Physiol. 587:3091–3094. doi:10.1113/ jphysiol.2009.172049
Jiménez-Moreno, R., Z.M. Wang, M.L. Messi, and O. Delbono. 2010. Sarcoplasmic reticulum Ca2+ depletion in adult skeletal muscle fibres measured with the biosensor D1ER. Pflugers Arch. 459:725–735. doi:10.1007/s00424-009-0778-4
Jong, D.S., P.C. Pape, W.K. Chandler, and S.M. Baylor. 1993. Reduc-tion of calcium inactivation of sarcoplasmic reticulum calcium release by fura-2 in voltage-clamped cut twitch fibers from frog muscle. J. Gen. Physiol. 102:333–370. doi:10.1085/jgp.102.2.333
Kabbara, A.A., and D.G. Allen. 2001. The use of the indicator fluo-5N to measure sarcoplasmic reticulum calcium in single muscle fibres of the cane toad. J. Physiol. 534:87–97. doi:10.1111/j.1469-7793.2001.00087.x
Launikonis, B.S., J. Zhou, L. Royer, T.R. Shannon, G. Brum, and E. Ríos. 2006. Depletion “skraps” and dynamic buffering inside the cellular calcium store. Proc. Natl. Acad. Sci. USA. 103:2982–2987. doi:10.1073/pnas.0511252103
Meissner, G. 1986. Ryanodine activation and inhibition of the Ca2+ release channel of sarcoplasmic reticulum. J. Biol. Chem. 261:6300–6306.
Melzer, W., E. Ríos, and M.F. Schneider. 1984. Time course of cal-cium release and removal in skeletal muscle fibers. Biophys. J. 45:637–641. doi:10.1016/S0006-3495(84)84203-4
Melzer, W., E. Ríos, and M.F. Schneider. 1987. A general procedure for determining the rate of calcium release from the sarcoplasmic reticulum in skeletal muscle fibers. Biophys. J. 51:849–863. doi:10 .1016/S0006-3495(87)83413-6
Palmer, A.E., C. Jin, J.C. Reed, and R.Y. Tsien. 2004. Bcl-2-mediated alterations in endoplasmic reticulum Ca2+ analyzed with an im-proved genetically encoded fluorescent sensor. Proc. Natl. Acad. Sci. USA. 101:17404–17409. doi:10.1073/pnas.0408030101
Palmer, A.E., M. Giacomello, T. Kortemme, S.A. Hires, V. Lev-Ram, D. Baker, and R.Y. Tsien. 2006. Ca2+ indicators based on computation-ally redesigned calmodulin-peptide pairs. Chem. Biol. 13:521–530. doi:10.1016/j.chembiol.2006.03.007
Paolini, C., M. Quarta, A. Nori, S. Boncompagni, M. Canato, P. Volpe, P.D. Allen, C. Reggiani, and F. Protasi. 2007. Reorganized stores and impaired calcium handling in skeletal muscle of mice lacking calsequestrin-1. J. Physiol. 583:767–784. doi:10.1113/ jphysiol.2007.138024
Pape, P.C., and N. Carrier. 1998. Effect of sarcoplasmic reticulum (SR) calcium content on SR calcium release elicited by small voltage- clamp depolarizations in frog cut skeletal muscle fibers equili-brated with 20 mM EGTA. J. Gen. Physiol. 112:161–179. doi:10. 1085/jgp.112.2.161
Pape, P.C., D.S. Jong, and W.K. Chandler. 1995. Calcium release and its voltage dependence in frog cut muscle fibers equilibrated with 20 mM EGTA. J. Gen. Physiol. 106:259–336. doi:10.1085/ jgp.106.2.259
C, the free concentration of the monitored species, satisfies
C
d CD dt k CD
k D CD=
( ) +-( )
OFF
ON T
.
(A3)
An expression of C as a function of R is reached by substitution of the value of CD from Eq. A2 into Eq. A3:
(A4)
Ck
dR
dt R RK
R RC C
C C C C
=-
- - + -+
-
( )[ ]( )1 2 1 2 1
1 1 2 2 1 2ON
d
e e e e
e e e e e eb minn
max
,R R-
where ≡ 1/1C, Rmax = 2C/1C, and Rmin = 2/1.Eq. A4 can be expressed in terms of indicator ratio by
dividing numerator and denominator by 11C
Ck
dR
dt
R R
R R R R R RK
R R
R=
-
- + - -+
-
( ) ( )[ ]( )b
bb
ON
dmax min
max min max
min
mmax
,- R
which is Eq. 2.
We are grateful to R.Y. Tsien (University of California, San Diego, La Jolla, CA) and A.E. Palmer (University of Colorado Boulder, Boulder, CO) for the gift of D4cpv, to D.-H. Kim (Gwangju Insti-tute of Science and Technology, Gwangju, South Korea) for Casq-1 and Casq1-Asp, and to D. Terentyev and S. Györke (both Ohio State University, Columbus, OH) for pEYFP-N1-dogCasq2. We thank S. Pouvreau for criticism and C. Manno for criticism and self-less help with various stages of preparation of the manuscript.
This work was supported by grants from the National Institute of Arthritis and Musculoskeletal and Skin Diseases (AR049184 and AR032808 to E. Ríos, AR044750 and AR43140 to P. Allen, and AR057404 to J. Zhou) and the Muscular Dystrophy Association of America (MDA-4351 to J. Zhou).
Richard L. Moss served as editor.
Submitted: 22 December 2010Accepted: 28 June 2011
R E F E R E N C E SBaylor, S.M., W.K. Chandler, and M.W. Marshall. 1982. Use of metal-
lochromic dyes to measure changes in myoplasmic calcium dur-ing activity in frog skeletal muscle fibres. J. Physiol. 331:139–177.
Baylor, S.M., W.K. Chandler, and M.W. Marshall. 1983. Sarcoplasmic reticulum calcium release in frog skeletal muscle fibres estimated from Arsenazo III calcium transients. J. Physiol. 344:625–666.
Canato, M., M. Scorzeto, M. Giacomello, F. Protasi, C. Reggiani, and G.J. Stienen. 2010. Massive alterations of sarcoplasmic reticulum free calcium in skeletal muscle fibers lacking calsequestrin re-vealed by a genetically encoded probe. Proc. Natl. Acad. Sci. USA. 107:22326–22331. doi:10.1073/pnas.1009168108
Dainese, M., M. Quarta, A.D. Lyfenko, C. Paolini, M. Canato, C. Reggiani, R.T. Dirksen, and F. Protasi. 2009. Anesthetic- and heat-induced sudden death in calsequestrin-1-knockout mice. FASEB J. 23:1710–1720. doi:10.1096/fj.08-121335
Donoso, P., H. Prieto, and C. Hidalgo. 1995. Luminal calcium regulates calcium release in triads isolated from frog and rab-bit skeletal muscle. Biophys. J. 68:507–515. doi:10.1016/S0006- 3495(95)80212-2
on July 29, 2011jgp.rupress.org
Dow
nloaded from
Published July 25, 2011

Sztretye et al. 247
Schneider, M.F., B.J. Simon, and G. Szucs. 1987. Depletion of cal-cium from the sarcoplasmic reticulum during calcium release in frog skeletal muscle. J. Physiol. 392:167–192.
Schuhmeier, R.P., and W. Melzer. 2004. Voltage-dependent Ca2+ fluxes in skeletal myotubes determined using a removal model analysis. J. Gen. Physiol. 123:33–51. doi:10.1085/jgp.200308908
Schuhmeier, R.P., E. Gouadon, D. Ursu, N. Kasielke, B.E. Flucher, M. Grabner, and W. Melzer. 2005. Functional interac-tion of CaV channel isoforms with ryanodine receptors studied in dysgenic myotubes. Biophys. J. 88:1765–1777. doi:10.1529/ biophysj.104.051318
Shin, D.W., J. Ma, and D.H. Kim. 2000. The asp-rich region at the carboxyl-terminus of calsequestrin binds to Ca(2+) and inter-acts with triadin. FEBS Lett. 486:178–182. doi:10.1016/S0014- 5793(00)02246-8
Shirokova, N., and E. Ríos. 1996. Activation of Ca2+ release by caffeine and voltage in frog skeletal muscle. J. Physiol. 493: 317–339.
Sztretye, M., J. Yi, L. Figueroa, J. Zhou, L. Royer, P.D. Allen, and E. Ríos. 2011. D4cpv-calsequestrin: a sensitive ratiometric biosensor accurately targeted to the calcium store of skeletal muscle. J. Gen. Physiol. 138:211–229. doi:10.1085/jgp.201010591
Tripathy, A., and G. Meissner. 1996. Sarcoplasmic reticulum lume-nal Ca2+ has access to cytosolic activation and inactivation sites of skeletal muscle Ca2+ release channel. Biophys. J. 70:2600–2615. doi:10.1016/S0006-3495(96)79831-4
Ursu, D., R.P. Schuhmeier, and W. Melzer. 2005. Voltage-controlled Ca2+ release and entry flux in isolated adult muscle fibres of the mouse. J. Physiol. 562:347–365. doi:10.1113/jphysiol.2004 .073882
Wetzel, P., and G. Gros. 1998. Decay of Ca2+ and force transients in fast- and slow-twitch skeletal muscles from the rat, mouse and Etruscan shrew. J. Exp. Biol. 201:375–384.
Wu, Y.C., T. Tucker, and R. Fettiplace. 1996. A theoretical study of calcium microdomains in turtle hair cells. Biophys. J. 71:2256–2275. doi:10.1016/S0006-3495(96)79429-8
Zima, A.V., E. Bovo, D.M. Bers, and L.A. Blatter. 2010. Ca²+ spark-dependent and -independent sarcoplasmic reticulum Ca²+ leak in normal and failing rabbit ventricular myocytes. J. Physiol. 588: 4743–4757. doi:10.1113/jphysiol.2010.197913
Ziman, A.P., C.W. Ward, G.G. Rodney, W.J. Lederer, and R.J. Bloch. 2010. Quantitative measurement of Ca²(+) in the sarcoplasmic reticulum lumen of mammalian skeletal muscle. Biophys. J. 99: 2705–2714. doi:10.1016/j.bpj.2010.08.032
Pape, P.C., D.S. Jong, and W.K. Chandler. 1998. Effects of partial sar-coplasmic reticulum calcium depletion on calcium release in frog cut muscle fibers equilibrated with 20 mM EGTA. J. Gen. Physiol. 112:263–295. doi:10.1085/jgp.112.3.263
Park, H., I.Y. Park, E. Kim, B. Youn, K. Fields, A.K. Dunker, and C. Kang. 2004. Comparing skeletal and cardiac calsequestrin struc-tures and their calcium binding: a proposed mechanism for cou-pled calcium binding and protein polymerization. J. Biol. Chem. 279:18026–18033. doi:10.1074/jbc.M311553200
Pizarro, G., and E. Ríos. 2004. How source content determines intra-cellular Ca2+ release kinetics. Simultaneous measurement of [Ca2+] transients and [H+] displacement in skeletal muscle. J. Gen. Physiol. 124:239–258. doi:10.1085/jgp.200409071
Protasi, F., C. Paolini, and M. Dainese. 2009. Calsequestrin-1: a new candidate gene for malignant hyperthermia and exertional/en-vironmental heat stroke. J. Physiol. 587:3095–3100. doi:10.1113/ jphysiol.2009.171967
Qin, J., G. Valle, A. Nani, A. Nori, N. Rizzi, S.G. Priori, P. Volpe, and M. Fill. 2008. Luminal Ca2+ regulation of single cardiac ryanodine receptors: insights provided by calsequestrin and its mutants. J. Gen. Physiol. 131:325–334. doi:10.1085/jgp.200709907
Qin, J., G. Valle, A. Nani, H. Chen, J. Ramos-Franco, A. Nori, P. Volpe, and M. Fill. 2009. Ryanodine receptor luminal Ca2+ regu-lation: swapping calsequestrin and channel isoforms. Biophys. J. 97:1961–1970. doi:10.1016/j.bpj.2009.07.030
Rengifo, J., R. Rosales, A. González, H. Cheng, M.D. Stern, and E. Ríos. 2002. Intracellular Ca(2+) release as irreversible Markov process. Biophys. J. 83:2511–2521. doi:10.1016/S0006-3495(02)75262-4
Ríos, E., B.S. Launikonis, L. Royer, G. Brum, and J. Zhou. 2006. The elusive role of store depletion in the control of intracellular calcium release. J. Muscle Res. Cell Motil. 27:337–350. doi:10.1007/ s10974-006-9082-5
Royer, L., S. Pouvreau, and E. Ríos. 2008. Evolution and modula-tion of intracellular calcium release during long-lasting, deplet-ing depolarization in mouse muscle. J. Physiol. 586:4609–4629. doi:10.1113/jphysiol.2008.157990
Royer, L., M. Sztretye, C. Manno, S. Pouvreau, J. Zhou, B.C. Knollmann, F. Protasi, P.D. Allen, and E. Ríos. 2010. Paradoxical buffering of calcium by calsequestrin demonstrated for the calcium store of skele-tal muscle. J. Gen. Physiol. 136:325–338. doi:10.1085/jgp.201010454
Rudolf, R., P.J. Magalhães, and T. Pozzan. 2006. Direct in vivo moni-toring of sarcoplasmic reticulum Ca2+ and cytosolic cAMP dynam-ics in mouse skeletal muscle. J. Cell Biol. 173:187–193. doi:10.1083/ jcb.200601160
on July 29, 2011jgp.rupress.org
Dow
nloaded from
Published July 25, 2011

JGP
TH
E J
OU
RN
AL
OF
GE
NE
RA
L P
HY
SIO
LO
GY
Sztretye et al. S1
mains constant, becomes very large. Therefore, the esti-
mate afforded by the NFRC leads to the conclusion that
E increases, when it probably does the opposite.
Example of a signal with high dynamic range Fig. S1 A has the FRET ratio derived (as described in
Materials and methods) in a Casq1-null cell subjected to
the pulse protocol indicated at the top. The pipette so-
lution was EGTA. Note that R went from 1.465 at rest to
0.530 at the end of the second pulse, for � R / R min = 1.86.
Note also that the fi nal R level is consistent with essen-
tially full depletion, as it corresponds to [Ca 2+ ] SR = 4
μM.
Errors in an estimation of evacuability This section compares the conclusions of the present
paper with diverging conclusions arrived at earlier,
through a study of the evacuability ( Royer et al., 2008 ).
The fi rst estimate of Ca 2+ release permeability was intro-
duced by Schneider et al. (1987) in the form of the de-
pletion-corrected release fl ux:
Re Rel
lR tC
··
º-CaSR( ) ( )
.0
(S1)
Royer et al. (2008) demonstrated that the depletion-
corrected fl ux depends not just on the permeability but
also on the buffering power of the SR for Ca.
Specifi cally,
Rel PB
EC
·= ºj , (S2)
where P is permeability (defi ned as Ca 2+ fl ux per unit
area and unit Ca 2+ concentration gradient), B is Ca buff-
ering power of the SR, and � is the area to volume ratio
of the SR. Royer et al. (2008) also showed that an index
named the NFRC , calculated from the time course of
the release fl ux, has the following relationship with E :
NFRC
l dtl
El
l
d P B
dtnet net
º = -( )
· ·dReRe
ReRe
ln.
j
(S3)
Under conditions that make the second term in the
right-hand side of this equation small, the NFRC be-
comes an estimator of E ; Royer et al. (2008) proposed
that such conditions apply for most of the time when
release fl ux decays during a long depolarization. Cru-
cially, one of the conditions is that E not be small. The
present work now shows that this condition is not met.
Therefore, the main observation is that P decreases,
and unless B decreases even faster, E will also decrease.
As shown in Fig. S2 for the experimental example of
Fig. 2 (a WT cell perfused by the EGTA solution), the
error term, calculated under the hypothesis that B re-
S U P P L E M E N TA L M AT E R I A L
Sztretye et al., http://www.jgp.org/cgi/content/full/jgp.201010592/DC1
R E F E R E N C E S Royer , L. , S. Pouvreau , and E. Ríos . 2008 . Evolution and modula-
tion of intracellular calcium release during long-lasting, deplet-
ing depolarization in mouse muscle . J. Physiol. 586 : 4609 – 4629 .
doi:10.1113/jphysiol.2008.157990
Schneider , M.F. , B.J. Simon , and G. Szucs . 1987 . Depletion of cal-
cium from the sarcoplasmic reticulum during calcium release in
frog skeletal muscle . J. Physiol. 392 : 167 – 192 .
on July 29, 2011jgp.rupress.org
Dow
nloaded from
Published July 25, 2011

S2 A channel-gating role of calsequestrin
Figure S1. Example of a signal with high dynamic range. (A) R = F 2 ( x , t )/ F 1 ( x , t ) of simultaneously recorded line scans of fl uores-cence of the biosensor in a Casq-null cell perfused with EGTA so-lution subjected to the pulse protocol indicated schematically at the top. (B) Spatially averaged ratio, R ( t ). (C) [Ca 2+ ] SR . Note also that the fi nal R level is consistent with essentially full depletion, as it corresponds to [Ca 2+ ] SR = 4 μM. ID: 082009a, average of images 46–48.
on July 29, 2011jgp.rupress.org
Dow
nloaded from
Published July 25, 2011

Sztretye et al. S3
Figure S2. An error in the estimation of evacuability. The black trace shows evacu-ability, calculated from its defi nition (Eq. S1), for the line scans in Fig. 2 . E decreases with time, which is consistent with a de-creasing P . The red trace shows the NFRC , calculated from the release fl ux and its defi nition (Eq. S2). Note that E and NFRC evolve differently. The green trace shows the error term, which is the difference be-tween NFRC and E (Eq. S3). The error term is large and grows larger with time. An assumption in Royer et al. (2008) , re-quired for the error to be small, was that E should not be decreasing. A decreasing E makes the logarithmic term in Eq. S3 large and negative, explaining the increasing error.
on July 29, 2011jgp.rupress.org
Dow
nloaded from
Published July 25, 2011