Measurement of micro burr and slot widths through image ...
18
Edith Cowan University Edith Cowan University Research Online Research Online Research outputs 2014 to 2021 2021 Measurement of micro burr and slot widths through image Measurement of micro burr and slot widths through image processing: Comparison of manual and automated processing: Comparison of manual and automated measurements in micro‐milling measurements in micro milling Fatih Akkoyun Ali Ercetin Kubilay Aslantas Danil Yurievich Pimenov Khaled Giasin See next page for additional authors Follow this and additional works at: https://ro.ecu.edu.au/ecuworkspost2013 Part of the Engineering Commons 10.3390/s21134432 Akkoyun, F., Ercetin, A., Aslantas, K., Pimenov, D. Y., Giasin, K., Lakshmikanthan, A., & Aamir, M. (2021). Measurement of micro burr and slot widths through image processing: Comparison of manual and automated measurements in micro‐milling. Sensors, 21(13), article 4432. https://doi.org/10.3390/s21134432 This Journal Article is posted at Research Online. https://ro.ecu.edu.au/ecuworkspost2013/10737
Transcript of Measurement of micro burr and slot widths through image ...
Edith Cowan University Edith Cowan University
Research Online Research Online
Research outputs 2014 to 2021
2021
Measurement of micro burr and slot widths through image Measurement of micro burr and slot widths through image
processing: Comparison of manual and automated processing: Comparison of manual and automated
measurements in micro‐milling measurements in micro milling
Fatih Akkoyun
Ali Ercetin
Kubilay Aslantas
Danil Yurievich Pimenov
Khaled Giasin
See next page for additional authors
Follow this and additional works at: https://ro.ecu.edu.au/ecuworkspost2013
Part of the Engineering Commons
10.3390/s21134432 Akkoyun, F., Ercetin, A., Aslantas, K., Pimenov, D. Y., Giasin, K., Lakshmikanthan, A., & Aamir, M. (2021). Measurement of micro burr and slot widths through image processing: Comparison of manual and automated measurements in micro‐milling. Sensors, 21(13), article 4432. https://doi.org/10.3390/s21134432 This Journal Article is posted at Research Online. https://ro.ecu.edu.au/ecuworkspost2013/10737

Authors Authors Fatih Akkoyun, Ali Ercetin, Kubilay Aslantas, Danil Yurievich Pimenov, Khaled Giasin, Avinash Lakshmikanthan, and Muhammad Aamir
This journal article is available at Research Online: https://ro.ecu.edu.au/ecuworkspost2013/10737

sensors
Article
Measurement of Micro Burr and Slot Widths through ImageProcessing: Comparison of Manual and AutomatedMeasurements in Micro-Milling
Fatih Akkoyun 1, Ali Ercetin 2,* , Kubilay Aslantas 3 , Danil Yurievich Pimenov 4 , Khaled Giasin 5 ,Avinash Lakshmikanthan 6 and Muhammad Aamir 7
�����������������
Citation: Akkoyun, F.; Ercetin, A.;
Aslantas, K.; Pimenov, D.Y.; Giasin,
K.; Lakshmikanthan, A.; Aamir, M.
Measurement of Micro Burr and Slot
Widths through Image Processing:
Comparison of Manual and
Automated Measurements in
Micro-Milling. Sensors 2021, 21, 4432.
https://doi.org/10.3390/s21134432
Academic Editor: Rodolfo Haber
Received: 27 May 2021
Accepted: 26 June 2021
Published: 28 June 2021
Publisher’s Note: MDPI stays neutral
with regard to jurisdictional claims in
published maps and institutional affil-
iations.
Copyright: © 2021 by the authors.
Licensee MDPI, Basel, Switzerland.
This article is an open access article
distributed under the terms and
conditions of the Creative Commons
Attribution (CC BY) license (https://
creativecommons.org/licenses/by/
4.0/).
1 Department of Mechanical Engineering, Faculty of Engineering, Adnan Menderes University, Aydın 09010,Turkey; [email protected]
2 Department of Mechanical Engineering, Faculty of Engineering and Architecture, Bingol University,Bingol 12000, Turkey
3 Department of Mechanical Engineering, Faculty of Technology, Afyon Kocatepe University,Afyonkarahisar 03200, Turkey; [email protected]
4 Department of Automated Mechanical Engineering, South Ural State University, Lenin Prosp. 76,454080 Chelyabinsk, Russia; [email protected]
5 School of Mechanical and Design Engineering, University of Portsmouth, Portsmouth PO1 3DJ, UK;[email protected]
6 Department of Mechanical Engineering, Nitte Meenakshi Institute of Technology, Bengaluru 560064, India;[email protected]
7 School of Engineering, Edith Cowan University, Joondalup, WA 6027, Australia; [email protected]* Correspondence: [email protected]; Tel.: +90-4262160013 (ext. 1972)
Abstract: In this study, the burr and slot widths formed after the micro-milling process of Inconel718 alloy were investigated using a rapid and accurate image processing method. The measurementswere obtained using a user-defined subroutine for image processing. To determine the accuracyof the developed imaging process technique, the automated measurement results were comparedagainst results measured using a manual measurement method. For the cutting experiments, Inconel718 alloy was machined using several cutting tools with different geometry, such as the helix angle,axial rake angle, and number of cutting edges. The images of the burr and slots were captured usinga scanning electron microscope (SEM). The captured images were processed with computer visionsoftware, which was written in C++ programming language and open-sourced computer library(Open CV). According to the results, it was determined that there is a good correlation betweenautomated and manual measurements of slot and burr widths. The accuracy of the proposed methodis above 91%, 98%, and 99% for up milling, down milling, and slot measurements, respectively.The conducted study offers a user-friendly, fast, and accurate solution using computer vision (CV)technology by requiring only one SEM image as input to characterize slot and burr formation.
Keywords: computer vision; image processing; micro-machining; slot and burrs; measurement; char-acterization
1. Introduction
Workpiece optimization is an important procedure in micro-machining applications [1–4].Today, micro-machining is widely used in the manufacturing of micro-sized parts for vari-ous applications, such as electronics, optics, automotive, aerospace, and biomedical [5–8].Despite the high performance of the micro-machining process, the quality of micro-sizedparts is related to the burr formation [5,6,9,10]. Especially in studies on micro-machiningprocesses and working piece analyses, the precision measurement on slot and burr widthsis necessary for better investigation of the micro-machining process and optimization ofthe machining conditions [11–14]. In the micro-machining process, cutting conditionsand cutting parameters significantly affect the burr formation [15–18]. To minimize burr
Sensors 2021, 21, 4432. https://doi.org/10.3390/s21134432 https://www.mdpi.com/journal/sensors

Sensors 2021, 21, 4432 2 of 16
formation, new cutting conditions are determined by measuring burr dimensions after themicro-machining process. Before the micro-machining process, finite element modelingor mathematical modeling based on response surface methodology (RSM) are applied todecrease burr size [19–24]. Considering the complex geometrical shapes of the slot andburr on a machined workpiece, accurate, rapid, and practical measurement of slot and burrparameters using SEM images is a worthwhile utility for fundamental research [5,25–27].Some characteristics make IN−718 difficult to cut, such as high strength, high degree ofwork hardening, poor thermal conductivity, and the high tendency of a built-up edge. Burrformation changes significantly due to these characterizations. The burr formation andsurface quality need to be examined quickly by new methods [28].
Various methods are often used by researchers for slot and burr measureme-nts [2,15,19,29,30]. One of them is to use a screen caliper to measure the slot and burrwidths of an image that is captured using SEM [31,32]. In this approximation, an SEM imagemeasured with a screen caliper using pixel information is used to determine the parametersof the working piece, which highly depends on the user-related error [32–34]. This methodis inconvenient and manual measurement is required for each image, which is a longtime process for investigating a large number of SEM images [31,32]. The next procedurefor slot and burr widths measurement is to use a three-dimensional optical profilometer,which is commercially available from technology labs or various companies [11,35,36].Although the profilometer instruments make the measurement very practical and precise,these are mostly present in well-funded labs because of their relatively higher costs. Inaddition, it is necessary to wait a few minutes for the result for each sample [31,32]. Anartificial neural network (ANN) is another method to predict the formation of burrs inmicro-drilling [37,38]. Ahn et al. [37] conducted a study to predict the burr formation inmicro-drilling of ductile metals, which was found to have around an 80% accuracy. Theother approach is to use image processing software to measure the slot and burr widthsof micro-milling [5,39,40]. Tuiran et al. [39] analyzed burrs formed in micro-milling usingimage processing. An averaged 84.46% accuracy was found between spindle speed andburr formation. The image processing technology is a well-known technique with highaccuracy and the ability to measure two-dimensional distances with different propertiesexpressed mathematically for a large number of images. However, due to the license costsof the advanced image processing software, such as Neural Wear, and the lack of pinpointsolutions, these are not available in many research facilities [41,42]. There are also few open-sourced approaches for measuring slot borders and burr lengths on a machined workpieceusing computer vision technology for example, ImageJ, which was released by the NationalInstitute of Health of the United States of America [43]. It is published as free software thatcan be used to measure the slot and burrs widths from a captured image. Nevertheless, theimage processing tools are limited and not proper for situations that may need multiplethreshold operations for measuring complex SEM output in the same image. In laboratorieswith limited resources, the screen caliper method is one of the widely used methods forinvestigating slot and burr parameters [31,32]. Using various optical systems, burrs canbe determined, and their dimensions can be measured. Camera systems, SEM, confocalmicroscopy, and laser triangulation are among the most important optical systems [44].Methods, such as the triangulation method, the conoscopic holography method, and theinterferometry method, have been developed for the measurement of micro burr geometryin the micro-drilling process [45]. A measurement system based on a contour detectionalgorithm has been designed and aims to detect burrs and environmental defects in castparts. However, the machine vision system developed was limited to macro dimensionalburr measurements [5]. Medeossi et al. [5] found 87% for the maximum accuracy of burrwidth evaluation in micro-milling. A laser-based measuring system is designed for thecharacterization and control of micro burr parameters [46]. Despite all these developments,obtaining measurement results is not fast enough. Therefore, there is a requirement for anopen-sourced, user-friendly, high speed, automated, and accurate procedure for measuringslot and burr. Recently, computer vision and feature extraction are continuously evolving

Sensors 2021, 21, 4432 3 of 16
and their popularity is increasing with the help of advanced technology [47–50]. Table 1shows a summary of previous image processing techniques used in different machiningprocesses.
Table 1. Summary of previous image processing techniques used in different machining processes.
Machining Process Quality Assessment Scope Ref.
Milling
Tool wear [51]Burrs [40]Burrs [52]
Surface finish [53]
DrillingSurface [54]Burrs [55]Burrs [56]
Turning Surface roughness [57]Tool wear [58]
Grinding Surface finish [59]
Shaping Surface finish [60]
There are numerous studies for data extracting related to processing still imagesusing CV technology. This technology offers fast, user-friendly, and accurate solutionsfor many research areas. Today, most of the studies on obtaining burr formation dataand characterization by evaluating SEM images are conducted manually. A screen caliperor an image processing software, such as ImageJ, are common options for manual mea-surements [32,61–63]. However, user abilities and diligence are important parameters toobtain an accurate result from the SEM images. In this field, there are limited studiesand resources to extract data from still images using CV technology, which is used forevaluating milling burr formation. Applying this technology to process still SEM imagesdirectly without additional steps offers an easy and effective solution while eliminatingadditional skills required for measuring SEM images. The present study offers a fast anduser-friendly solution for measuring slot and burr formation at the micro-scale as well asrequiring only one SEM image as input to characterize slot and burr formation with highaccuracy. Due to the high speed of the CV technology, the process takes milliseconds foran image and is suitable for evaluating thousands of images in minutes. In addition, theoutputs of the solution are suitable for drawing a chart from the obtained data directly. Tothe best of our knowledge from the literature, the presented method was applied for thefirst time in the micro-milling process for slot and burr characterization. The accuracy ofthe proposed method is above 91.26% (minimum accuracy), the processing time for eachimage is below 0.1 s, and was justified with 7 sample measurements. The approach offeredhere is an accurate and robust method for precisely measuring slot and burr widths andcan be used for slot and burr evaluation in micro-machining applications in the researchand industry domains.
2. Materials and Methods2.1. Machining Parameters
In this study, IN−718 alloy was chosen as the workpiece material and chemical com-position is given in Table 2. Cutting tools with different geometries were used to provideburr formation in different sizes and to determine the success of the image processingmethod (Table 3). The diameter of each cutting tool was 1 mm. The machining parametersare also given in Table 3. Micro-milling tests were performed under dry conditions. InTable 3, slots A, B, and C belong to the cutting process applied with cutting tools that havethe same geometric properties (helix angle 35◦, the axial rake angle is −5◦, and the numberof cutting edges is 3). Slot A is the SEM image captured from the start of the milling process.Slots B and C are the SEM images captured after the cutting lengths of 45 and 135 mm.

Sensors 2021, 21, 4432 4 of 16
Other slots correspond to the different tool geometries specified in Table 3. The spindlespeed, feed rate, and depth of cut parameters were kept constant for each micro-millingtests. Slots E, F, and G were subjected to a micro-milling process using the same cuttinglength (10 mm).
Table 2. The chemical composition of IN−718 alloy.
Elements Cr Fe Mo Nb Al Ti C Ni
Weight percent wt.% 17–21 16–20 2.8–3.3 4.75–5.5 0.2–0.8 0.65–1.15 0.08 max Balance
Table 3. The properties of cutting tools and machining parameters of the slots.
Slot No Helix Angle(◦)
Axial RakeAngle (◦)
Number ofCutting Edges
Spindle Speed(rev/min)
Feed Rate(µm/tooth)
Depth of Cut(µm)
Cutting Length(mm)
Slot A 35 −5 3 10Slot B 35 −5 3 45Slot C 35 −5 3 360Slot D 35 0 3 10,000 3 100 45Slot E 45 0 4 10Slot F 35 0 4 10Slot G 35 −5 4 10
For the micro-milling tests, a CNC vertical machining center (AKÜ Micro-MachiningLaboratory, Afyonkarahisar, Turkey) with a maximum power of 2.2 kW and maximumspindle speed of 24,000 rev/min was used. The experimental setup for the micro-millingprocess and the details of the micro-end mill, spindle, and workpiece system are given inFigure 1. The workpiece can be connected to the workbench with 4 bolts and the systemcan be controlled precisely by a computer. The cutting tool is composed of 90% WC and10% Co. Before the cutting tests, precursory checks were conducted on the axial run out onthe spindle and it was determined that the size of the run-out was around 2 µm.
Figure 1. Experimental setup for the micro-milling process.

Sensors 2021, 21, 4432 5 of 16
2.2. Image Processing Stages
An automated slot and burr measuring software to calculate the borders of the slotand lengths of the burr on a machined workpiece was demonstrated. The software wasdeveloped using C++ programming language and the OpenCV library based on computervision technology. The software algorithm is designed to process SEM images to measureslot and burr using peak points and ROI of the image and a reference scale coefficient in pix-els for the predefined filtering parameters. The slot and burr measuring software requiresan SEM image, a metric reference coefficient in pixel and predefined threshold parametersfor the hue saturation value (HSV), and black-white (BW) transforming operations. Theresult from the software is the slot and bur parameters using an input SEM image. A blockdiagram that represents the algorithm of software is presented in Figure 2. Measuring withimage processing takes below 0.1 s, which is quite fast when manual measurements onSEM images are considered.
Figure 2. The block diagram of the slot and burr measuring software shows the image input, pre-defined parameters forprocessing the image, and measurement outputs.
The measuring process is initiated with an SEM image input. At first, the SEM imageobtained by the software was colored. Next, the image is converted to HSV values, anda threshold is applied concerning the pre-defined threshold parameters by the user. TheBGR image is masked using the thresholded HSV image. In the next stage, the image isconverted to the BW. The Gaussian filter, a blur filter, and a second threshold are appliedfor minimizing the effect of the background. Then, BGR values are calculated by summingcolor indents for each column, which is used for finding the vertical peak values. Detectedpeaks are considered as vertical lines, which represent slot borders. In the next stage, twoROIs are determined according to the slot borders on the up milling side (left side) anddown milling side (right side) of the image for calculating the burrs. The ROIs for the upand down milling sides of the images indicate the burrs. These two ROIs are reprocessedusing previous steps from the beginning for determining burr lengths using the peakvalues, but horizontal peak values are considered. A pre-defined coefficient is used tocalculate the distances in the metric unit before processing the results. In the result stage,each peak value is used to indicate the determined borders of the slot and length of theburrs for the up and down milling sides of the image. The flowchart of the solution isindicated in Figure 3.

Sensors 2021, 21, 4432 6 of 16
Figure 3. The flowchart of the measuring process.
The slot and burr evaluation process is divided into three main parts by processingthe image with three steps. The vertical peak values are determined in the first step andborders are determined with respect to these peaks using the actual image. In the nextsteps, cropped images are processed for investigating the burr parameters. These imagesare limited with the slot borders for both burrs of up and down milling sides. The burrparameters related to the peaks are investigated using horizontal peak values from thecropped images (Figure 4).
Figure 4. Slot and micro burr segmentation of sample (1) and sample (2): (a) micro burrs at the upmilling side (left side), (b) slots, (c) micro burrs at the down milling side (right side).
The slot determining stage starts after processing the image with respect to the givenimage processing procedures, vertical peak values are considered for slot length andhorizontal peaks for burrs. These peaks are determined by summing the BGR values ofeach column, which is the vertical and horizontal sum of the pixel indents. The image isdivided into two parts for determining the slot borders for the up and down milling sidesof the image. The calculated peaks are the maximum values for both the up milling anddown milling sides considered as slot borders. The pixel difference of the slot for the x-axisgives the length of the slot and the result is converted to metric units by multiplying thedifference with a metric coefficient (Figures 5b and 6b).

Sensors 2021, 21, 4432 7 of 16
Figure 5. Sample (1): (a) automated burr measurement method at the up milling side according to the horizontal peakvalues, (b) automated measurement between the slot borders according to the vertical peak values, and (c) the automatedburr measurement method at the down milling side according to the horizontal peak values.
Figure 6. Sample (2): (a) automated burr measurement method at the up milling side according to the horizontal peakvalues, (b) automated measurement between the slot borders according to the vertical peak values, and (c) the automatedburr measurement method at the down milling side according to the horizontal peak values.
Sensors 2021, 21, 4432 8 of 16
In the next stage, the ROIs are determined by referencing the detected borders of theslot. Two vertical imaginary lines are drawn on the image to extract the ROIs for the upand down milling sides considering the slot borders. The ROIs mainly include the dataabout burr parameters. In the ROI extracting step, the maximum X value for the up millingside ROI and the minimum X value for the down milling side ROI was referenced and thelimits of the image: the minimum X value and the maximum X value, are used for the upmilling and down milling sides ROI, respectively. In the sequel, the two ROIs are generatedconsidering the slot borders and image limits. The ROIs are processed for determining thebiggest burr from the peaks and the integral of the chart is used to investigate the burr area.Example results of a processed image for the biggest burr detected from the peaks and burrarea for the up milling (Figures 5a and 6a) and down milling (Figures 5c and 6c) sides of theimage are shown. In Figures 5 and 6, green and blue colors refer to the vertical peak valuesfor each pixel column that were automatedly calculated by the CV software as indicated inFigure 2. Both figures show that the peak values are increasing with respect to the densityof burr formation. The example figure indicates that there is a positive correlation betweenthe determined peak values and burr formation.
In the present study, the mean absolute percentage error (MAPE) was used to deter-mine errors for automated measurement with respect to the manual measurements. There-fore, the success rate is obtained by determining errors for each measurement (Equation (1)),where n is the number of fitted points, At is the actual value, Ft is the forecast value, and ∑is summation notation:
Averaged Accuracy (%) = 100 −[
1n
n
∑t=1
∣∣∣∣At − FtAt
∣∣∣∣ ∗ 100
](1)
2.3. Manual Measurement
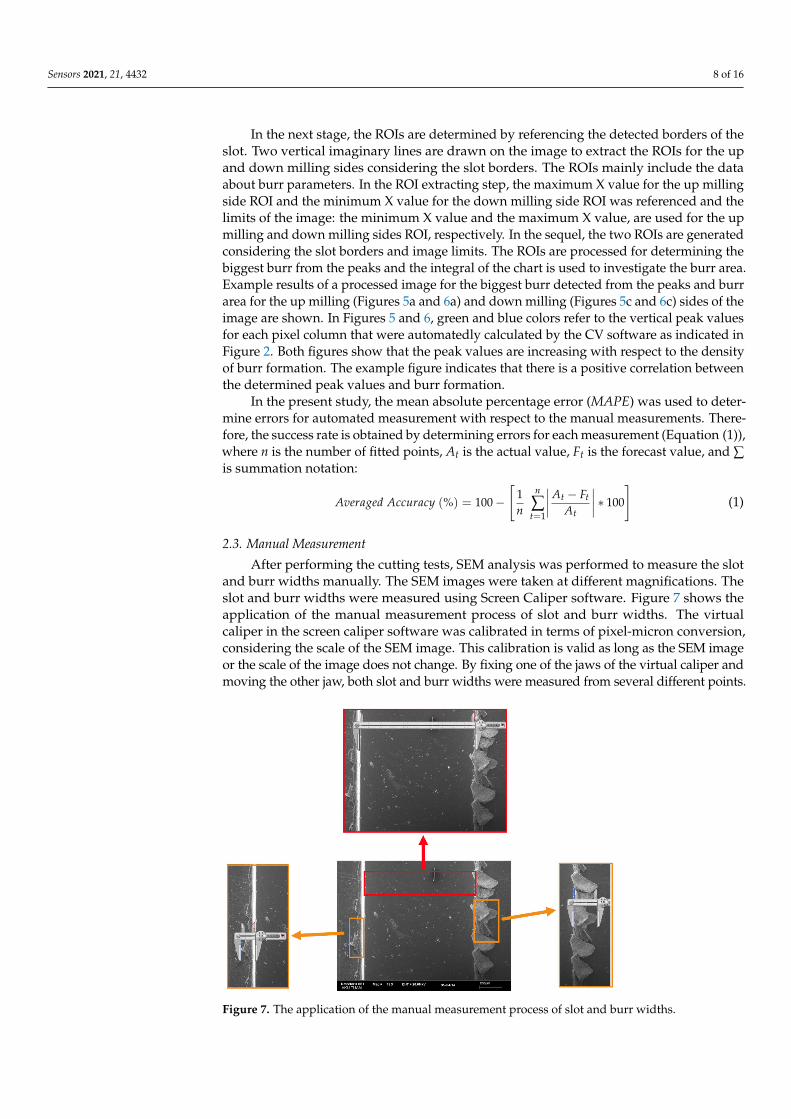
After performing the cutting tests, SEM analysis was performed to measure the slotand burr widths manually. The SEM images were taken at different magnifications. Theslot and burr widths were measured using Screen Caliper software. Figure 7 shows theapplication of the manual measurement process of slot and burr widths. The virtualcaliper in the screen caliper software was calibrated in terms of pixel-micron conversion,considering the scale of the SEM image. This calibration is valid as long as the SEM imageor the scale of the image does not change. By fixing one of the jaws of the virtual caliper andmoving the other jaw, both slot and burr widths were measured from several different points.
Figure 7. The application of the manual measurement process of slot and burr widths.

Sensors 2021, 21, 4432 9 of 16
3. Results and Discussions3.1. SEM Images of Slots
Figure 8 shows the SEM images of the slots. The SEM images were captured at differentmagnifications to determine the chances of success rates. The radius of the tool edge andits sharpness decrease as a result of the abrasive wear. The wear of the micro-cutting toolincreases due to the cutting length for the same cutting tool and parameters. For all reasonsabove, the burr widths on the machined slot sides (Figure 8a–c) increased with respect tothe cutting length. It was also observed that the burr widths increased due to the effect ofthe increasing number of cutting edges and helix angles (Figure 8d,e). Additionally, thereis no clear effect of the axial rake angle on the burr width. The other prominent findingin Figure 8 is that the burr widths are larger on the down milling sides. However, it ispossible to see similar burr widths on the down and up milling sides, which is a possibleoutput of the cutting tool wear. In similar studies, a high correlation is observed for theslot width due to the cutting tool wear [2,31,32,64,65].
Figure 8. The SEM images of slots; (a) Slot-A, (b) Slot-B, (c) Slot-C, (d) Slot-D, (e) Slot-E, (f) Slot-F,and (g) Slot-G.

Sensors 2021, 21, 4432 10 of 16
3.2. Micro Burr Widths for Up Milling and Down Milling Sides
The up milling and down milling results are shown in Figures 9 and 10. Measurementsof micro burr widths at the up milling and down milling sides were evaluated using bothmanual and automated methods. Slots A, B, and C belong to the cutting process appliedwith cutting tools that have the same geometric properties. However, cutting length valuesfor slots A, B, and C are different. Therefore, the effect of cutting length on the burr andslot widths could also be evaluated. In Figures 9 and 10, it is seen that in the micro-millingprocess of slots A, B, and C, the burr widths measured manually and automatically increasedue to the increased cutting lengths. The obtained results from both measurement methodsare very close. For slots E, F, and G, the effects of the axial rake angle and number of cuttingedges on burr widths are seen. The applied cutting lengths (10 mm) for these slots areminimal in all micro-milling parameters. Therefore, at the beginning of the micro-milling,it is expected that the burr widths are minimal. However, the burr widths for slots E, F, andG are wider than the other slots. The occurrence of this situation is related to the change inthe cutting tool geometry used. The axial rake angle and number of cutting edge values forslots E, F, and G are higher than the slots A, B, and C. In a similar study [66], it was predictedsimilarly to the present study that after the cutting tool used in micro-milling is changed, acutting tool with higher axial rake angle values is replaced, and the micro-milling processis continued, the burr widths on the up and down milling edges increase.
Figure 9. Automated and manual measurements of up milling sides.
Figure 10. Automated and manual measurements of down milling sides.
The results indicate that there is a high correlation between automated and manualmeasurement results. The obtained results from the experiments show the accuracy of theautomated measurements is close to that obtained from the manual measurements. It isobserved that the accuracy rates are found to be above 91.3% and 98.2% for up-millingand down-milling, respectively. Mostly, in cutting tests, the down milling side has moreburrs compared to the up milling side [32,61,67]. It is understood that the down-millingside burr width is higher than the up-milling side. The same difference is seen from

Sensors 2021, 21, 4432 11 of 16
the visual observation on SEM images for the burr widths. In a similar study about themilling process and burr detection, workpieces with different thicknesses and hardnesswere used. While burrs can be measured very easily after milling thick workpieces, theburrs formed in workpieces less than 2.5 mm thick could not be measured completely byimage processing [52]. In the present study, the burrs are in micron sizes and all of theburrs could be measured with over approximately 90% accuracy.
3.3. Micro Slot Width
Figure 11 shows the micro slot widths measured by manual and automated withimage process figures. Slot borders between green lines (all figures from A to G) indicatethe automated measured slot widths. Slot widths are directly dependent on the cuttingtool diameter. Therefore, greater wear of the cutting tool is expected due to the increasedcutting length. Since the slot width measurement values of E, F, and G in Figure 11 arethe values taken from the region close to the starting point, the corresponding slot widthvalues are the closest values to the tool diameter. It is also predicted that in the micro-milling process where the slot width is reduced, there is sign of wear on the cutting tool.In our previous studies [11,31,32,61], it was certainly determined that there is a negativecorrelation between the cutting tool wear and slot width. In the experiments, cutting toolswith approximately a 1000 µm diameter were used with different helix and axial rakeangles and number of cutting edges. According to the slot width determining stage results,the accuracy is independent of the tool parameters (indicated in Table 3). The conductedmeasurements show the accuracy of the automated measurement for determining the slotwidth is very close to the manual measurement with 99.6% (Figure 11).
Figure 11. Micro slot widths measured by manual and automated with image process figures;(A) slot-A, (B) slot-B, (C) slot-C, (D) slot-D, (E) slot-E, (F) slot-F, (G) slot-G.

Sensors 2021, 21, 4432 12 of 16
3.4. Success Rate (%) of Automated and Manual Measurements
In Figure 12, the averaged accuracy (%), which was calculated according to Equa-tion (1), is shown for the up milling, down milling sides, and slots from seven SEM images.According to the conducted experiments, both the manual and automated measurementsaddressed accurate results. The measurement results obtained from the up-milling sideshowed a good correlation with the manual measurements. The result for the up-millingside was 91.26% and a better result was obtained from the down milling side with 98.18%.The slot measurements indicate very close results (99.58%) to the known manual measur-ing method. The study conducted using the ANN method by Ahn et al. [37] offers a lowaccuracy of around 80% on the prediction of burr formation in the micromachining process.In another study implemented by Tuiran et al. [39], the burrs resulting from micro-millingwere analyzed with the help of an image processing technology, and the accuracy wasfound to be around 84.46%, which gives the correlation between the spindle speed and burrformation. Medeossi et al. [5] studied burr width evaluation in micro-milling using opticalmicroscopy, and a maximum accuracy was found at 87%. The method used in the presentstudy offers approximately 12%, 8%, and 5% more accuracy compared to the studiesimplemented by Ahn et al. [37], Tuiran et al. [39], and Medeossi et al. [5], respectively.
Figure 12. Averaged accuracy for slot and burr widths.
In machinability studies, when the measurements are carried out manually, they arecompleted in a very long time period [68]. In addition, image processing studies couldonly be carried out based on the results where manual measurement was not performedand machinability tests were carried out on a macro scale [40]. Moreover, there is a lowaccuracy result of a study in which the measurement of all burrs could not be performeddespite the macro-scale milling process [52]. In the present study, in micron-scale, themeasurement of the burrs could be carried out precisely and with high accuracy.
4. Conclusions
In micro-machining applications, obtaining data from a still SEM image by referencinga scale bar requires multiple image evaluation stages. A screen caliper or an image process-ing software, such as ImageJ, are common options for manual measurements. However,user abilities and diligence are important parameters to obtain an accurate result from theSEM images. On the other hand, today, CV is a widely used technology in many fields.Applying this technology by processing still SEM images directly without additional stepsoffers an easy, user-friendly, fast, and accurate solution while eliminating the additionalskills required for measuring SEM images. Most of the studies related to image processing

Sensors 2021, 21, 4432 13 of 16
techniques require multiple image inputs. The proposed approach can obtain results usinga random image input. In the present study, an image processing method was proposedthat was compared with a widely used manual burr and slot measurement method. Anopen-sourced image processing library was used for processing SEM images. The burrand slot measurement software showed a good correlation with the manual measurements.It is a swift, accurate, and time-saving alternative method for slot and burr investigationexperiments. The accuracy of the proposed method was above 91%, 98%, and 99% for upmilling, down milling, and slot measurements, respectively. Moreover, the accuracy of theresults was independent of the SEM images at different magnification and specific toolproperties, such as the helix angle, axial rake angle, and number of cutting edges. Theproposed image processing method has the potential to investigate the surface quality ofmicro-machined parts swiftly and accurately.
Using the slot width measurement method, a study can be performed on the compari-son of the cutting tool wear rate with the actual measurement results.
Author Contributions: Conceptualization, F.A., A.E., K.A.; Methodology, F.A., A.E., K.A.; Software,F.A.; Manual Measurement, A.E.; Investigation, F.A., A.E.; Writing—Review and Editing, F.A., A.E.,K.A., D.Y.P., K.G., A.L., M.A.; Visualization, F.A., A.E., K.A.; Funding Acquisition, D.Y.P., K.G. Allauthors have read and agreed to the published version of the manuscript.
Funding: This research received no external funding.
Institutional Review Board Statement: Not applicable.
Informed Consent Statement: Not applicable.
Data Availability Statement: Experimental data can be obtained by requesting from F.A., A.E. orK.A.
Acknowledgments: The authors would like to thank the Technology Application and ResearchCenter of Afyon Kocatepe University (AKUTUAM) for their support in the SEM analysis.
Conflicts of Interest: The authors declare no conflict of interest.
Nomenclature
SEM Scanning Electron MicroscopeOpen CV Open-sourced Computer VisionRSM Response Surface MethodologyANN Artificial Neural NetworkCV Computer VisionAKÜ Afyon Kocatepe UniversityHSV Hue Saturation ValueMAPE Mean Absolute Percentage ErrorBW Black-White
References1. Kuram, E.; Ozcelik, B. Optimization of machining parameters during micro-milling of Ti6Al4V titanium alloy and Inconel 718
materials using Taguchi method. Proc. Inst. Mech. Eng. Part B J. Eng. Manuf. 2017, 231, 228–242. [CrossRef]2. Eraslan, D.; Balcı, A.; Çetin, B.; Uçak, N.; Çiçek, A.; Yılmaz, O.D.; Davut, K. Machinability evaluations of austempered ductile iron
and cast steel with similar mechanical properties under eco-friendly milling conditions. J. Mater. Res. Technol. 2021. [CrossRef]3. Giasin, K. Machining Fibre Metal Laminates and Al2024-T3 Aluminium Alloy. Ph.D. Thesis, University of Sheffield, Sheffield,
UK, 2017.4. Kus, A.; Isik, Y.; Cakir, M.C.; Coskun, S.; Özdemir, K. Thermocouple and infrared sensor-based measurement of temperature
distribution in metal cutting. Sensors 2015, 15, 1274–1291. [CrossRef] [PubMed]5. Medeossi, F.; Sorgato, M.; Bruschi, S.; Savio, E. Novel method for burrs quantitative evaluation in micro-milling. Precis. Eng. 2018,
54, 379–387. [CrossRef]6. Li, W.; Liu, M.; Ren, Y.H.; Chen, Q. A high-speed precision micro-spindle use for mechanical micro-machining. Int. J. Adv. Manuf.
Technol. 2019, 102, 3197–3211. [CrossRef]

Sensors 2021, 21, 4432 14 of 16
7. Akkoyun, F.; Ozcelik, A. A simple approach for controlling an open-source syringe pump. Eur. Mech. Sci. 2020, 4, 166–170.[CrossRef]
8. Jung, W.C.; Heo, Y.M.; Yoon, G.S.; Shin, K.H.; Chang, S.H.; Kim, G.H.; Cho, M.W. Micro machining of injection mold inserts forfluidic channel of polymeric biochips. Sensors 2007, 7, 1643–1654. [CrossRef]
9. Lin, Y.S.; Yang, C.H.; Wang, C.Y.; Chang, F.R.; Huang, K.S.; Hsieh, W.C. An aluminum microfluidic chip fabrication usinga convenient micromilling process for fluorescent poly(DL-lactide-co-glycolide) microparticle generation. Sensors 2012, 12,1455–1467. [CrossRef]
10. Lauro, C.H.; Brand, L.C.; Panzera, T.H.; Davim, J.P. Surface integrity in the micromachining: A review. Rev. Adv. Mater. Sci. 2015,40, 227–234.
11. Aslantas, K.; Alatrushi, L.K.H. Experimental study on the effect of cutting tool geometry in micro-milling of Inconel 718. Arab. J.Sci. Eng. 2020, 1–16. [CrossRef]
12. Bhuvanesh Kumar, M.; Sathiya, P.; Parameshwaran, R. Parameters optimization for end milling of Al7075–ZrO2–C metal matrixcomposites using GRA and ANOVA. Trans. Indian Inst. Met. 2020, 73, 2931–2946. [CrossRef]
13. Sun, Q.; Cheng, X.; Zhao, G.; Yang, X.; Zheng, G. Experimental study of micromilling burrs of 304 stainless steel. Int. J. Adv.Manuf. Technol. 2019, 105, 4651–4662. [CrossRef]
14. Kuntoglu, M.; Aslan, A.; Pimenov, D.Y.; Usca, Ü.A.; Salur, E.; Gupta, M.K.; Mikolajczyk, T.; Giasin, K.; Kapłonek, W.; Sharma, S.A review of indirect tool condition monitoring systems and decision-making methods in turning: Critical analysis and trends.Sensors 2021, 21, 1–33.
15. Perçin, M.; Aslantas, K.; Ucun, I.; Kaynak, Y.; Çicek, A. Micro-drilling of Ti−6Al−4V alloy: The effects of cooling/lubricating.Precis. Eng. 2016, 45, 450–462. [CrossRef]
16. Kumar, M.B.; Parameshwaran, R.; Deepandurai, K.; Senthil, S.M. Influence of milling parameters on surface roughness ofAl–SiC–B4C composites. Trans. Indian Inst. Met. 2020, 73, 1171–1183. [CrossRef]
17. Li, M.; Huang, M.; Jiang, X.; Kuo, C.L.; Yang, X. Study on burr occurrence and surface integrity during slot milling of multidirec-tional and plain woven CFRPs. Int. J. Adv. Manuf. Technol. 2018, 97, 163–173. [CrossRef]
18. Wojciechowski, S.; Matuszak, M.; Powałka, B.; Madajewski, M.; Maruda, R.W.; Królczyk, G.M. Prediction of cutting forces duringmicro end milling considering chip thickness accumulation. Int. J. Mach. Tools Manuf. 2019, 147, 103466. [CrossRef]
19. Yadav, A.K.; Kumar, M.; Bajpai, V.; Singh, N.K.; Singh, R.K. FE modeling of burr size in high- speed micro-milling of Ti6Al4V.Precis. Eng. 2017, 49, 287–292. [CrossRef]
20. Khanghah, S.P.; Boozarpoor, M.; Lotfi, M.; Teimouri, R. Optimization of micro-milling parameters regarding burr size minimiza-tion via RSM and simulated annealing algorithm. Trans. Indian Inst. Met. 2015, 68, 897–910. [CrossRef]
21. Jeong, H.; Ha, J.; Hwang, J.; Lee, H.; Kim, D.; Kim, N. A study on the shearing process and the burr formation of zircaloy−4 sheetby using GTN model. Int. J. Precis. Eng. Manuf. 2014, 15, 2167–2175. [CrossRef]
22. Yoon, H.S.; Wu, R.; Lee, T.M.; Ahn, S.H. Geometric optimization of micro drills using Taguchi methods and response surfacemethodology. Int. J. Precis. Eng. Manuf. 2011, 12, 871–875. [CrossRef]
23. Aamir, M.; Tu, S.; Tolouei-Rad, M.; Giasin, K.; Vafadar, A. Optimization and modeling of process parameters in multi-holesimultaneous drilling using taguchi method and fuzzy logic approach. Materials 2020, 13, 680. [CrossRef] [PubMed]
24. Aamir, M.; Tolouei-Rad, M.; Vafadar, A.; Raja, M.N.A.; Giasin, K. Performance analysis of multi-spindle drilling of Al2024 withTiN and TiCN coated drills using experimental and artificial neural networks technique. Appl. Sci. 2020, 10, 8633. [CrossRef]
25. Liu, C.; Shi, B.; Zhou, J.; Tang, C. Quantification and characterization of microporosity by image processing, geometric measure-ment and statistical methods: Application on SEM images of clay materials. Appl. Clay Sci. 2011, 54, 97–106. [CrossRef]
26. Abdallah, R.; Soo, S.L.; Hood, R. The influence of cut direction and process parameters in wire electrical discharge machining ofcarbon fibre–reinforced plastic composites. Int. J. Adv. Manuf. Technol. 2021, 1–18. [CrossRef]
27. Giasin, K.; Barouni, A.; Dhakal, H.N.; Featherson, C.; Redouane, Z.; Morkavuk, S.; Koklu, U. Microstructural investigation andhole quality evaluation in S2/FM94 glass-fibre composites under dry and cryogenic conditions. J. Reinf. Plast. Compos. 2021, 40,273–293. [CrossRef]
28. Yin, Q.; Liu, Z.; Wang, B.; Song, Q.; Cai, Y. Recent progress of machinability and surface integrity for mechanical machiningInconel 718: A review. Int. J. Adv. Manuf. Technol. 2020, 109, 215–245. [CrossRef]
29. Aslantas, K.; Ekici, E.; Çiçek, A. Optimization of process parameters for micro milling of Ti−6Al−4V alloy using Taguchi-basedgray relational analysis. Measurement 2018, 128, 419–427. [CrossRef]
30. Krolczyk, G.M.; Maruda, R.W.; Krolczyk, J.B.; Nieslony, P.; Wojciechowski, S.; Legutko, S. Parametric and nonparametricdescription of the surface topography in the dry and MQCL cutting conditions. Meas. J. Int. Meas. Confed. 2018, 121, 225–239.[CrossRef]
31. Erçetin, A.; Aslantas, K.; Perçin, M. Micro milling of tungsten-copper composite materials produced through powder metallurgymethod: Effect of composition and sintering temperature. J. Fac. Eng. Archit. Gazi Univ. 2018, 33, 1369–1381. [CrossRef]
32. Erçetin, A.; Aslantas, K.; Özgün, Ö. Micro-end milling of biomedical TZ54 magnesium alloy produced through powder metallurgy.Mach. Sci. Technol. 2020, 24, 924–947. [CrossRef]
33. Koklu, U.; Morkavuk, S.; Featherston, C.; Haddad, M.; Sanders, D.; Aamir, M.; Pimenov, D.Y.; Giasin, K. The effect of cryogenicmachining of S2 glass fibre composite on the hole form and dimensional tolerances. Int. J. Adv. Manuf. Technol. 2021, 1–16.[CrossRef]
Sensors 2021, 21, 4432 15 of 16
34. Ercetin, A. Application of the hot press method to produce new Mg alloys: Characterization, mechanical properties, and effect ofAl addition. J. Mater. Eng. Perform. 2021. [CrossRef]
35. Varatharajulu, M.; Duraiselvam, M.; Arun Kumar, K.; Gabrial Kanniyan, C.; Sathiyamurthy, R. Experimental investigation of theeffect of independent parameters in the face milling of aluminum 6082 alloy. Trans. Indian Inst. Met. 2021, 1–19. [CrossRef]
36. Kapłonek, W.; Nadolny, K.; Krolczyk, G.; Królczyk, G.M. The use of focus-variation microscopy for the assessment of activesurfaces of a new generation of coated abrasive tools. Meas. Sci. Rev. 2016, 16, 42–53. [CrossRef]
37. Ahn, Y.; Lee, S.H. Classification and prediction of burr formation in micro drilling of ductile metals. Int. J. Prod. Res. 2017, 55,4833–4846. [CrossRef]
38. Giasin, K.; Ayvar-Soberanis, S.; French, T.; Phadnis, V. 3D finite element modelling of cutting forces in drilling fibre metallaminates and experimental hole quality analysis. Appl. Compos. Mater. 2017, 24, 113–137. [CrossRef]
39. Tuirán, R.; Oñate, J.; Romero, N. Analysis of burr formation by image processing in micro-milling of Ti. Contemp. Eng. Sci. 2018,11, 2297. [CrossRef]
40. Sharan, R.V.; Onwubolu, G.C. Measurement of end-milling burr using image processing techniques. Proc. Inst. Mech. Eng. Part BJ. Eng. Manuf. 2011, 225, 448–452. [CrossRef]
41. Mikołajczyk, T.; Nowicki, K.; Bustillo, A.; Pimenov, D.Y. Predicting tool life in turning operations using neural networks andimage processing. Mech. Syst. Signal Process. 2018, 104, 503–513. [CrossRef]
42. Mikołajczyk, T.; Nowicki, K.; Kłodowski, A.; Pimenov, D.Y. Neural network approach for automatic image analysis of cuttingedge wear. Mech. Syst. Signal Process. 2017, 88, 100–110. [CrossRef]
43. Schneider, C.A.; Rasband, W.S.; Eliceiri, K.W. NIH image to imageJ: 25 years of image analysis. Nat. Methods 2012, 9, 671–675.[CrossRef] [PubMed]
44. Aurich, J.C.; Dornfeld, D.; Arrazola, P.J.; Franke, V.; Leitz, L.; Min, S. Burrs-Analysis, control and removal. CIRP Ann. Manuf.Technol. 2009, 58, 519–542. [CrossRef]
45. Ko, S.L.; Park, S.W. Development of an effective measurement system for burr geometry. Proc. Inst. Mech. Eng. Part B J. Eng.Manuf. 2006, 220, 507–512. [CrossRef]
46. Toropov, A. An Effective Visualization and Analysis Method for Edge Measurement. In Computational Science and Its Applications;Lecture Notes in Computer Science; Springer: Berlin/Heidelberg, Germany, 2007; Volume 4706, pp. 941–950.
47. Sardogan, M.; Özen, Y.; Tuncer, A. Detection of apple leaf diseases using faster R-CNN. Düzce Univ. J. Sci. Technol. 2020, 8,1110–1117. [CrossRef]
48. Hiçdurmaz, A.; Tuncer, A. Real-time obstacle avoidance based on floor detection for mobile robots. Sak. Univ. J. Sci. 2020.[CrossRef]
49. Xi, T.; Benincá, I.M.; Kehne, S.; Fey, M.; Brecher, C. Tool wear monitoring in roughing and finishing processes based on machineinternal data. Int. J. Adv. Manuf. Technol. 2021, 1–12. [CrossRef]
50. Li, J.; Lu, J.; Chen, C.; Ma, J.; Liao, X. Tool wear state prediction based on feature-based transfer learning. Int. J. Adv. Manuf.Technol. 2021, 1–19. [CrossRef]
51. Dai, Y.; Zhu, K. A machine vision system for micro-milling tool condition monitoring. Precis. Eng. 2018, 52, 183–191. [CrossRef]52. Chen, X.; Shi, G.; Xi, C.; Zhong, L.; Wei, X.; Zhang, K. Design of Burr Detection Based on Image Processing. In Journal of Physics:
Conference Series; IOP Publishing: Bristol, UK, 2019; Volume 1237, p. 32075.53. Kumar, R.; Kulashekar, P.; Dhanasekar, B.; Ramamoorthy, B. Application of digital image magnification for surface roughness
evaluation using machine vision. Int. J. Mach. Tools Manuf. 2005, 45, 228–234. [CrossRef]54. Liu, W.; Zheng, X.; Liu, S.; Jia, Z. A roughness measurement method based on genetic algorithm and neural network for
microheterogeneous surface in deep-hole parts. J. Circuits Syst. Comput. 2012, 21, 1250005–1250019. [CrossRef]55. Yoon, H.S.; Chung, S.C. Vision inspection of micro-drilling processes on the machine tool. Trans. N. Am. Manuf. Res. Inst. SME
2004, 32, 391–398.56. Nakao, Y.; Watanabe, Y. Measurements and evaluations of drilling burr profile. Proc. Inst. Mech. Eng. Part B J. Eng. Manuf. 2006,
220, 513–523. [CrossRef]57. Sarma, P.M.M.S.; Karunamoorthy, L.; Palanikumar, K. Surface roughness parameters evaluation in machining GFRP composites
by PCD tool using digital image processing. J. Reinf. Plast. Compos. 2009, 28, 1567–1585. [CrossRef]58. Dutta, S.; Datta, A.; Chakladar, N.D.; Pal, S.K.; Mukhopadhyay, S.; Sen, R. Detection of tool condition from the turned surface
images using an accurate grey level co-occurrence technique. Precis. Eng. 2012, 36, 458–466. [CrossRef]59. Vesselenyi, T.; Dzitac, I.; Dzitac, S.; Vaida, V. Surface roughness image analysis using quasi-fractal characteristics and fuzzy
clustering methods. Int. J. Comput. Commun. Control 2008, 3, 304–316. [CrossRef]60. Priya, P.; Ramamoorthy, B. Machine Vision for Surface Roughness Assessment of Inclined Components. In Key Engineering
Materials; Trans Tech Publications Ltd.: Bäch, Switzerland, 2010; Volume 437, pp. 141–144.61. Erçetin, A.; Aslantas, K. The effect of different cutting parameters on cutting force, tool wear and burr formation in micro milling
WCu composite material fabricated via powder metallurgy. Turk. J. Nat. Sci. 2016, 5, 1–5.62. García-Ordás, M.T.; Alegre-Gutiérrez, E.; Alaiz-Rodríguez, R.; González-Castro, V. Tool wear monitoring using an online,
automatic and low cost system based on local texture. Mech. Syst. Signal Process. 2018, 112, 98–112. [CrossRef]63. D’Addona, D.M.; Ullah, A.M.M.S.; Matarazzo, D. Tool-wear prediction and pattern-recognition using artificial neural network
and DNA-based computing. J. Intell. Manuf. 2017, 28, 1285–1301. [CrossRef]

Sensors 2021, 21, 4432 16 of 16
64. Uçak, N.; Aslantas, K.; Çiçek, A. The effects of Al2O3 coating on serrated chip geometry and adiabatic shear banding in orthogonalcutting of AISI 316L stainless steel. J. Mater. Res. Technol. 2020, 9, 10758–10767. [CrossRef]
65. Gao, Q.; Guo, G.Y.; Cai, M. Wear mechanism and experimental study of a tool used for micro-milling single-crystal nickel-basedsuperalloys. Int. J. Adv. Manuf. Technol. 2021, 113, 117–129. [CrossRef]
66. Afazov, S.M.; Zdebski, D.; Ratchev, S.M.; Segal, J.; Liu, S. Effects of micro-milling conditions on the cutting forces and processstability. J. Mater. Process. Technol. 2013, 213, 671–684. [CrossRef]
67. Kuntoglu, M.; Acar, O.; Gupta, M.K.; Saglam, H.; Sarikaya, M.; Giasin, K.; Pimenov, D.Y. Parametric optimization for cuttingforces and material removal rate in the turning of AISI 5140. Machines 2021, 9, 90. [CrossRef]
68. Erçetin, A.; Usca, Ü.A. An experimental investigation of effect of turning AISI 1040 steel at low cutting speed on tool wear andsurface roughness. Turk. J. Nat. Sci. 2016, 5, 29–36.