Measurement of In-plane Capillary Water Flow of Fabrics by · PDF file ·...
5
Measurement of In-plane Capillary Water Flow of Fabrics by Thermocouples CHUNHONG ZHU 1 , MASAYUKI TAKATERA 2 1 Interdisciplinary Graduate School of Science and Technology 2 Faculty of Textile Science and Technology Shinshu University 3-15-1, Tokida, Ueda, Nagano, 386-8567 JAPAN 1 [email protected], 2 [email protected] http://www.shinshu-u.ac.jp Abstract: - A new wicking test for measuring the in-plane capillary water flow in fabrics was developed, and three different types of woven fabrics were examined. The method is based on the temperature changes, when fabric absorbs water, the temperature will be decreased. The equipment is composed of the thermocouple array, measurement equipment and PC. The thermocouple array was set on the foam polystyrene, with the space of each measurement point of 1cm. Due to the wicking of water, the temperature changes of appointed distance of fabric can be measured as function of time. Plain woven fabric samples with different cotton and polyester blending ratios were examined. Compared with the result measured by the Byreck method, it confirmed the feasibility of developed temperature measurement. The device is suitable for measurement of in-plane capillary water flow automatically by recording the temperature change. Key-Words: - Wicking; In-plane capillary; Water flow; Thermocouple; Measurement; Fabric 1 Introduction Liquid transport in textiles is relevant for a number of applications, such as sports wears, industrial uniforms, dyeing, finishing and filtration. In general, wicking takes place when a liquid travels along the surface of the fiber but is not absorbed into the fiber. Physically, wicking is the spontaneous flow of a liquid in a porous substrate, driven by capillary forces. The type of flow in any porous medium, caused by capillary action, is governed by the properties of the liquid, liquid-medium surface interactions, and geometric configurations of the pore structure in the medium[1,2]. There are many test methods for wicking test [3]. The longitudinal wicking is to measure the height of rise of water in a fabric strip, which can be taken as a direct indication of the wickability of fabric. The transverse wicking plate test is to record the position of the meniscus along the capillary tube at various time intervals to calculate the mass transfer rate of water into the fabric. The areal wicking spot test is to measure the elapsed time of reflection before it disappeared by a drop of liquid delivered onto a horizontal specimen of fabric. The syphon test is to weigh the collecting beaker to determine the amount of liquid transferred at successive time intervals. The traditional test method for liquid flow is Byreck method, which is visual investigation decided by the height of dyes. There are some disadvantages of Byreck method, for example, the influence of the dyes on the liquid absorption of fabric, the variances of water front of different observers, the effect of gravity. Considerable effort has been channeled into the development of meaningful test methods to determine the absorptive properties of the fabrics. The methods developed generally fall into two broad categories, i.e. absorption and wicking [4]. The previous measurements of wicking were mostly based on the visual observations of dye-water penetration [5], electrical capacitance techniques [6], the mass of liquid retained in the sample [7], and electrical resistance technique [8]. Yoneda[9] developed the dew sensor array for water flow measurement of thin fabric, by monitoring the relative humidity of the microclimate around the sensor point. However, the relative humidity of microclimate would be affected by adjacent space when fabric sample absorbed a lot amount of water, or in low humidity. Wicking of liquid into fabrics is a very complicated problem with big significance and is much dependent on fabric porosity. It is important to investigate on the relationship between wicking and fabric porosity. In this paper, based on the Seebeck effect, the thermocouple has been fabricated and used for measurement of in-plane capillary water flow of Recent Researches in Mechanical Engineering ISBN: 978-1-61804-153-1 116
Transcript of Measurement of In-plane Capillary Water Flow of Fabrics by · PDF file ·...

Measurement of In-plane Capillary Water Flow of Fabrics by
Thermocouples
CHUNHONG ZHU1, MASAYUKI TAKATERA
2
1Interdisciplinary Graduate School of Science and Technology
2Faculty of Textile Science and Technology
Shinshu University
3-15-1, Tokida, Ueda, Nagano, 386-8567
JAPAN [email protected],
[email protected] http://www.shinshu-u.ac.jp
Abstract: - A new wicking test for measuring the in-plane capillary water flow in fabrics was developed, and
three different types of woven fabrics were examined. The method is based on the temperature changes, when
fabric absorbs water, the temperature will be decreased. The equipment is composed of the thermocouple array,
measurement equipment and PC. The thermocouple array was set on the foam polystyrene, with the space of
each measurement point of 1cm. Due to the wicking of water, the temperature changes of appointed distance of
fabric can be measured as function of time. Plain woven fabric samples with different cotton and polyester
blending ratios were examined. Compared with the result measured by the Byreck method, it confirmed the
feasibility of developed temperature measurement. The device is suitable for measurement of in-plane capillary
water flow automatically by recording the temperature change.
Key-Words: - Wicking; In-plane capillary; Water flow; Thermocouple; Measurement; Fabric
1 Introduction Liquid transport in textiles is relevant for a number
of applications, such as sports wears, industrial
uniforms, dyeing, finishing and filtration. In general,
wicking takes place when a liquid travels along the
surface of the fiber but is not absorbed into the fiber.
Physically, wicking is the spontaneous flow of a
liquid in a porous substrate, driven by capillary
forces. The type of flow in any porous medium,
caused by capillary action, is governed by the
properties of the liquid, liquid-medium surface
interactions, and geometric configurations of the
pore structure in the medium[1,2].
There are many test methods for wicking test [3].
The longitudinal wicking is to measure the height of
rise of water in a fabric strip, which can be taken as
a direct indication of the wickability of fabric. The
transverse wicking plate test is to record the position
of the meniscus along the capillary tube at various
time intervals to calculate the mass transfer rate of
water into the fabric. The areal wicking spot test is
to measure the elapsed time of reflection before it
disappeared by a drop of liquid delivered onto a
horizontal specimen of fabric. The syphon test is to
weigh the collecting beaker to determine the amount
of liquid transferred at successive time intervals.
The traditional test method for liquid flow is
Byreck method, which is visual investigation
decided by the height of dyes. There are some
disadvantages of Byreck method, for example, the
influence of the dyes on the liquid absorption of
fabric, the variances of water front of different
observers, the effect of gravity. Considerable effort
has been channeled into the development of
meaningful test methods to determine the absorptive
properties of the fabrics. The methods developed
generally fall into two broad categories, i.e.
absorption and wicking [4]. The previous
measurements of wicking were mostly based on the
visual observations of dye-water penetration [5],
electrical capacitance techniques [6], the mass of
liquid retained in the sample [7], and electrical
resistance technique [8]. Yoneda[9] developed the
dew sensor array for water flow measurement of
thin fabric, by monitoring the relative humidity of
the microclimate around the sensor point. However,
the relative humidity of microclimate would be
affected by adjacent space when fabric sample
absorbed a lot amount of water, or in low humidity.
Wicking of liquid into fabrics is a very complicated
problem with big significance and is much
dependent on fabric porosity. It is important to
investigate on the relationship between wicking and
fabric porosity.
In this paper, based on the Seebeck effect, the
thermocouple has been fabricated and used for
measurement of in-plane capillary water flow of
Recent Researches in Mechanical Engineering
ISBN: 978-1-61804-153-1 116

fabrics automatically by measuring temperature of
fabric with the sensor array.
2 Basic Theory According to the Washburn equation [10], capillary
penetration rate depends on the rheological
properties of the liquid such as surface tension,
viscosity, density, fiber wetting characteristics, and
geometry of the capillary spaces, as shown in Fig.1.
Fig.1. Capillary water flow in cylindrical capillary
The horizontal wicking distance of water is given
by
trL 2cos2 (1)
Where L is the liquid advancing distant, γ is the
liquid vapor surface tension, θ is the contact angle
of solid liquid system, η is the viscosity of liquid, t
is time, and r is the equivalent radius of capillary
spaces. This equation has been widely applied by
many researchers to evaluate the wicking behavior
in fibrous assemblies [11].
If the horizontal wicking length, which is already
measured, is plotted vs. the square root of wicking
time, the slope of this plot dL/dt0.5 is defined as the
wicking rate Wc:
tddLWc / (2)
Wc can be calculated directly from experimental
data.
3 Experimental Method
3.1 Description of Test Equipment and
Method The measurement device is shown in Fig.2. The 9
points of temperature sensor, which can be seemed
as sensor array, have been set on the foam
polystyrene for heat insulation, and the distance
between the adjacent measurement points is 10mm.
The water level of fluid reservoir is always keeps
the same, for a slight hole is drilled in the reservoir.
The originating end of the fabric strip was clipped
by tension of 5.0gf/cm to keep the fabric end
immersed in the fluid and keep the fabric strip
contact with the sensor array. It is important that the
tension be no larger than needed since it could affect
the size of fabric and therefore the wicking
performance. The other end of the fabric is fixed to
keep it taut throughout the whole experiment.
Experiment was conducted on fabric strips of
3cm width and about 25cm length. The fabric strip
was carefully cut with long axes parallel to weft.
The fabric strip sample is shown in Fig.3. The
originating end is 5cm, and then the next 9cm was
lined in each centimeter.
(a) The Testing equipment
(b) The block diagram of the system
Fig.2. Testing equipment
Fig.3. Fabric strip before and during experiment
The T-type thermocouple has been used, with
copper and constantan as materials for the
temperature measurement. The circles in Fig.2
represent the measurement points of thermocouple.
As hygroscopicity fabric, the temperature of the
fabric rises slightly once because of heat generation
by absorbing water. Afterwards, because of
evaporation which brings heat from fabric, the
temperature of fabric at the measurement point will
be decrease straightly. In this experiment,
temperature changes of the 9 points occur in turn. In
order to analyze, the time when it reaches to the
peak value of temperature is seemed as the
absorbing starting time. One of the temperature
change of the fabric by the influence of the water as
a sample is shown in Fig.4. The temperature
decreasing time marked with circle in Fig.4 can be
seemed as the moment for the liquid flow to the
appointed point. In this experiment, the time t is
calculated by:
(3)
Where, tn+1 is the time at the distance of n+1, tn is
the time at the distance of n.
Recent Researches in Mechanical Engineering
ISBN: 978-1-61804-153-1 117
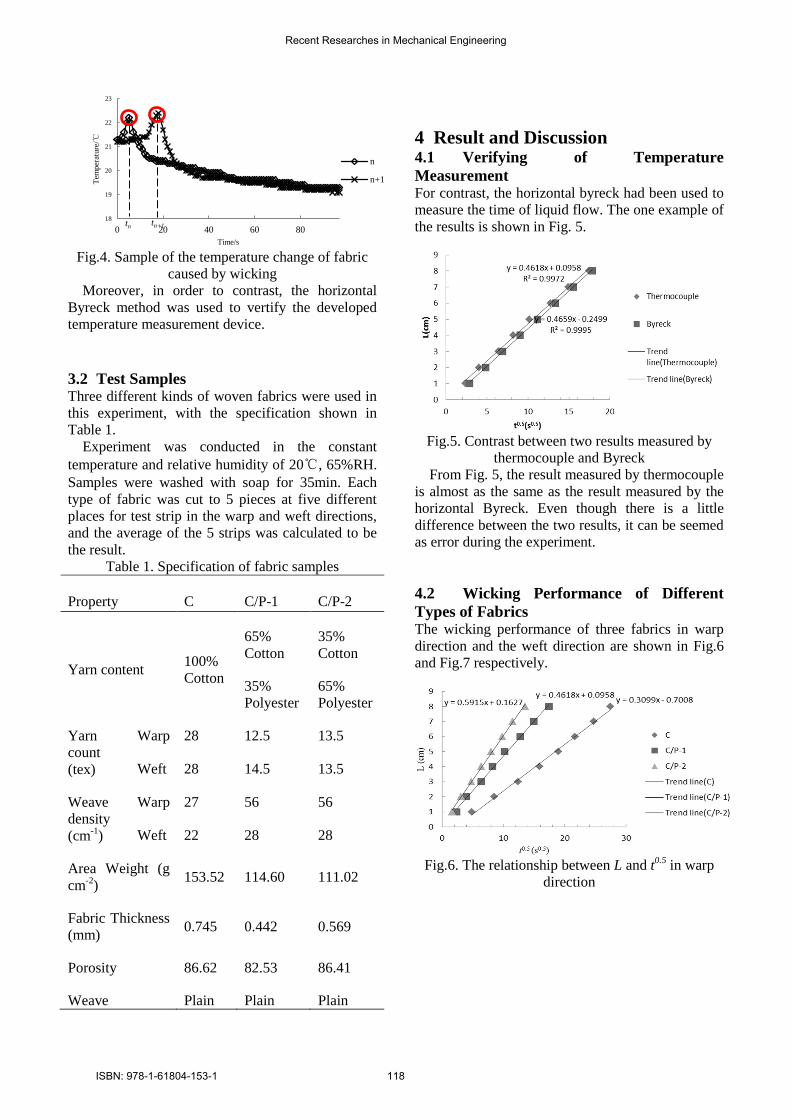
Fig.4. Sample of the temperature change of fabric
caused by wicking
Moreover, in order to contrast, the horizontal
Byreck method was used to vertify the developed
temperature measurement device.
3.2 Test Samples Three different kinds of woven fabrics were used in
this experiment, with the specification shown in
Table 1.
Experiment was conducted in the constant
temperature and relative humidity of 20℃, 65%RH.
Samples were washed with soap for 35min. Each
type of fabric was cut to 5 pieces at five different
places for test strip in the warp and weft directions,
and the average of the 5 strips was calculated to be
the result.
Table 1. Specification of fabric samples
Property C C/P-1 C/P-2
Yarn content 100%
Cotton
65%
Cotton
35%
Polyester
35%
Cotton
65%
Polyester
Yarn
count
(tex)
Warp 28 12.5 13.5
Weft 28 14.5 13.5
Weave
density
(cm-1
)
Warp 27 56 56
Weft 22 28 28
Area Weight (g
cm-2
) 153.52 114.60 111.02
Fabric Thickness
(mm) 0.745 0.442 0.569
Porosity 86.62 82.53 86.41
Weave Plain Plain Plain
4 Result and Discussion 4.1 Verifying of Temperature
Measurement For contrast, the horizontal byreck had been used to
measure the time of liquid flow. The one example of
the results is shown in Fig. 5.
Fig.5. Contrast between two results measured by
thermocouple and Byreck
From Fig. 5, the result measured by thermocouple
is almost as the same as the result measured by the
horizontal Byreck. Even though there is a little
difference between the two results, it can be seemed
as error during the experiment.
4.2 Wicking Performance of Different
Types of Fabrics The wicking performance of three fabrics in warp
direction and the weft direction are shown in Fig.6
and Fig.7 respectively.
Fig.6. The relationship between L and t
0.5 in warp
direction
18
19
20
21
22
23
0 20 40 60 80
Tem
per
ature
/℃
Time/s
n
n+1
tn tn+1
Recent Researches in Mechanical Engineering
ISBN: 978-1-61804-153-1 118

Fig.7. The relationship between L and t
0.5 in weft
direction.
From the slopes of Fig.6 and Fig.7, the wicking
rate of the three fabrics in two different directions
can be received, listed in Table 2.
Table 2. Wicking rate of three fabrics
Fabric C C/P-1 C/P-2
Warp 0.3099 0.4618 0.5915
Weft 0.2463 0.3202 0.5618
During the three fabric samples, wicking rate of
cotton is the lowest, whenever in warp or weft
directions. The fabric woven with cotton/polyester
blending fiber as 35/65 has the highest wicking rate.
This may be caused by the bending ratio and the
count of fibers which affected the different porosity.
As the same fabric, the wicking rate in warp
direction is higher than in the weft direction; this is
mainly because of the different weave density,
which causes different porosity.
4.2 Application on the wicking rate The horizontal wicking rate of fabric can be applied
for liquid flow estimation on fabric.
As the cotton fabric shown in Table 1, in the warp
direction, the function of liquid advancing distant as
the square root of time elapsed is
L=0.3099t0.5
-0.7008.
From this formula, the square root of time elapsed
can be calculated in a confirmed distance. For
example, L is 1.5cm, then t can be calculated to be
about 50s; if L is 3cm, t is about 143s. It takes 93s
for liquid flow from 1.5cm to 3cm on fabric.
Fig.8. Temperature changes around dropped point
for cotton fabric
In this experiment, the thermocouple cotton fabric
as introduced in other paper [12], was investigated
at 20℃ , 65%RH, with a drop of liquid (0.5ml)
dropped on the cotton fabric, and at the same time,
recorded the temperature of every point. As a
hygroscopicity fiber, the contact angle between
cotton fabric and the liquid is small, so it can be
ignored. Meanwhile, the point which is 1.5cm away
from the dropped point can be seemed as the basic
point, shown in Fig.8 of L=0. By recording and
calculating the past time, it can get the data for
liquid flow from L=1.5cm to L=3cm, and the time is
90s, which is almost the same as the calculated data
by the in-plane capillary liquid flow. It
demonstrated that the results of in-plane capillary
measured by thermocouple can be used for liquid
flow estimation of fabric.
5 Conclusion The developed temperature measurement-
thermocouple array can be used for in-plane
capillary measurement of water flow on fabric
automatically. Different from the Byreck method,
the develop method can be used without dyes, and it
can get objective results. Moreover, it can be used
not only for thin fabrics, but also for thick fabrics,
by setting two rows of sensor array on and under the
fabric sample. It makes the device flexible by
setting measurement points of sensors to investigate
on the liquid flow of two or more layers of fabrics.
The distance L and the square root time t0.5
is
linear, and the slope can be applied to evaluate the
wicking rate of fabric. The result of wicking rate of
cotton and cotton-polyester blend fabric showed that
cotton-polyester (35/65) had the highest wicking
rate; however, cotton is the lowest. This is mainly
because of the different types of fibers and the
porosity. The wicking rate in warp and weft
direction is different from each other. It can be
presumed that yarn is the unit of liquid flow in
fabric.
The result of dropped test verified that the
function of distance L and the square root time t0.5
of
cotton fabric can be applied to estimate the liquid
flow of fabric.
Acknowledgements This work was supported by Grant-in-Aid for
Global COE Program by the Ministry of Education,
Recent Researches in Mechanical Engineering
ISBN: 978-1-61804-153-1 119

Culture, Sports, Science, and Technology of Japan
and the support of Shinshu University, Japan.
References:
[1] Hsieh You-Lo, Liquid Transport in Fabric
Structures, Textile Research Journal, Vol.65,
No.5, 1995, pp. 299-307.
[2] Dilip Rajagopalan, Arun P. Aneja, Jean-Marie
Marchal, Modeling Capillary Flow in Complex
Geometries, Textile Research Journal, Vol.71,
No.9, 2001, pp. 813-821.
[3] P. R. Harnett, P. N. Mehta, A Survey and
Comparison of Laboratory Test Methods for
Measuring Wicking, Textile Research Journal,
Vol.54, No.7, 1984, pp. 471-478.
[4] Silva, A.P., Greenwood, C., Anand, S.C.,
Holmes, D.H., Whatmough, N, Concurrent
determination of absorption and wickability of
fabrics: A new test method, Journal of Textile
Institute, Vol.91, No.3, 2000, pp. 383-396.
[5] Hollies, N.R.S., Martha, M.M., Kaessinger, M.,
Watson, B.S., & Bogaty, H, Water transport
mechanisms in textile materials. Part II:
Capillary type penetration in yarns and fabrics.
Textile Research Journal, Vol.27, No.1, 1957,
pp. 8-13.
[6] IIto, H., Muraoka, Y, Water transport along
textile fibers as measured by an electrical
capacitance technique. Textile Research
Journal, Vol.63, No.7, 1993, pp. 414-420.
[7] Hsieh, Y.L., Yu, B, Liquid wetting, transport
and retention properties of fibrous assemblies.
Textile Research Journal, Vol.62, No.11, 1992,
pp.677-685.
[8] Ansari, N., Kish M.H, The wicking of water in
yarn as measured by an electrical resistance
technique. Journal of Textile Institute, Vol.91,
No.3, 2000, pp. 410-419.
[9] Morihiro Yoneda, Masako Niwa, Measurement
of in-plane capillary water flow of fabrics. Sen-
I Gakkaishi, Vol.48, No.6, 1992, pp. 288-298.
[10] Washburn, E.W. The dynamic of capillary flow
[J]. Physical Review, Vol.17, No.3, 1921, pp.
273-283.
[11] Kissa, E, Wetting and wicking. Textile
Research Journal, Vol.66, No.10, 1996, pp.
660-668.
[12] Chun-Hong Zhu, Masayuki Takatera, Change
of temperature of cotton and polyester fabrics
in wetting and drying process. The 5th Textile
Bioengineering and Informatics Symposium,
Ueda, Japan, 2012.
Recent Researches in Mechanical Engineering
ISBN: 978-1-61804-153-1 120


![Capillary thermostatting in capillary electrophoresis · Capillary thermostatting in capillary electrophoresis ... 75 µm BF 3 Injection: ... 25-µm id BF 5 capillary. Voltage [kV]](https://static.fdocuments.net/doc/165x107/5c176ff509d3f27a578bf33a/capillary-thermostatting-in-capillary-electrophoresis-capillary-thermostatting.jpg)