MEASUREMENT OF HARMONICS AND SAGS IN GRID VOLTAGES...
28
MEASUREMENT OF HARMONICS AND SAGS IN GRID VOLTAGES WHEN CHARGING ELECTRIC VEHICLES Paper #127 1st E-mobility Power System Integration Symposium October 23, 2017 Berlin, Germany Jonas Persson, Jonas Wetterström, Ying He Vattenfall R&D, Dep. Power Technology, Stockholm, Sweden
Transcript of MEASUREMENT OF HARMONICS AND SAGS IN GRID VOLTAGES...

MEASUREMENT OF HARMONICS AND SAGS IN GRID VOLTAGES WHEN CHARGING
ELECTRIC VEHICLES
Paper #127
1st E-mobility Power System Integration Symposium
October 23, 2017
Berlin, Germany
Jonas Persson, Jonas Wetterström, Ying He
Vattenfall R&D, Dep. Power Technology, Stockholm, Sweden

Introduction, a new clever load which can help the grid Sags, Harmonics, and Total Harmonic Distortion Four measurement campaigns Conclusions and Distribution challenges
PROGRAM
2

A NEW WAY TO FUEL YOUR CAR Ch
arge
at h
ome Charge at w
ork Charge at the road
Char
ge d
urin
g le
isur
e tim
e
Charging happens at ”new” places
Charging happens at many different sites
At home and at work it can be enough with 2.3 - 3.7 kW (one-phase, 10-16 A)
Destination charging 11-22 kW (three-phase, 16-32 A)
Fast charging > 50 kW
3

New characters of this new load They are relatively large loads connected to weak points in the power system. Equipped with power electronics which produce harmonics. But, they are equipped with communication possibilities which make them
possible to control; when the vehicle should be charged/not charged. A clever load.
A NEW LOAD
4

The idea: Controlling and coordinating the use of local electrical equipment opens possibilities for both more efficient use of the local installation and benefits for society by interaction with the external electricity system (distribution grid, generation, market).
ANNEX D IN STANDARD IEC61851-1 ED3, 2017 LOCAL CHARGING CONTROL FOR BETTER POWER QUALITY AND GRID STABILITY
5
Benefits for: • Customer (EV user, site owner)
Maximize the use of the electricity subscription • EV manufacturer
Convenient, quick, at-time charging • Distribution grid
Peak shaving & grid support • Generation
Production planning, frequency control • Services supporting EV introduction
For convenience, safety and economy

Industry Households
´Transmission grid
Distribution grid
Storage
Wind
Customer
Solar
CHP
eCar
Today: From Production to Consumer Constant Production
Tomorrow: Multi-directional flow Volatile Production
THE POWER SYSTEM IS UNDERGOING A CHANGE
6

SAGS, HARMONICS, AND THD IN GRID VOLTAGES
7
In the paper we have measured the following quantities: Grid voltages. Sags happens when the rms voltage decreases between 10 and 90
percent of nominal voltage for one-half cycle to one minute (Wikipedia) Harmonics from power electronics, multiples of the fundamental frequency (50
Hz). Total Harmonic Distortion, THD,

The paper summarizes four different measurement campaigns on four different cases;
• Charge of one electric car (one-phase, 16 A, 3.7 kW peak).
• Charge of seventeen electric cars within one three-phase group in an office garage (one-phase, 16 A each, 35 kW peak).
• Fast charge of one electric car (three-phase, 70 A, 48 kW peak).
• Fast charge of electric plug-in hybrid bus #73 in Stockholm (three-phase, 100 kW peak).
MEASUREMENTS
8

MEASUREMENT #1 BEFORE THE CAR IS CHARGED (ONE-PHASE, 16 A, 3.7 KW PEAK)
The THD in the phase voltage is calculated to 1.6% which is background harmonics.

MEASUREMENT #1 CHARGE OF ONE ELECTRIC CAR (ONE-PHASE, 16 A, 3.7 KW PEAK)
The THD in the phase voltage is still 1.6%.

MEASUREMENT #1 CHARGE OF ONE ELECTRIC CAR (ONE-PHASE, 16 A, 3.7 KW PEAK)
The low magnitudes of the harmonic currents in combination with the high short-circuit power in the grid explains why the THD of the phase voltage is not influenced by the charging of the car.
[mA
]

Charge of 17 electric cars within one three-phase group in an office garage in Stockholm
• Each car has one-phase charging with 16 A each (230 V)
• All 17 cars distributed on one three-phase group
• A 35 kW peak distributed on all phases once
12
MEASUREMENT #2

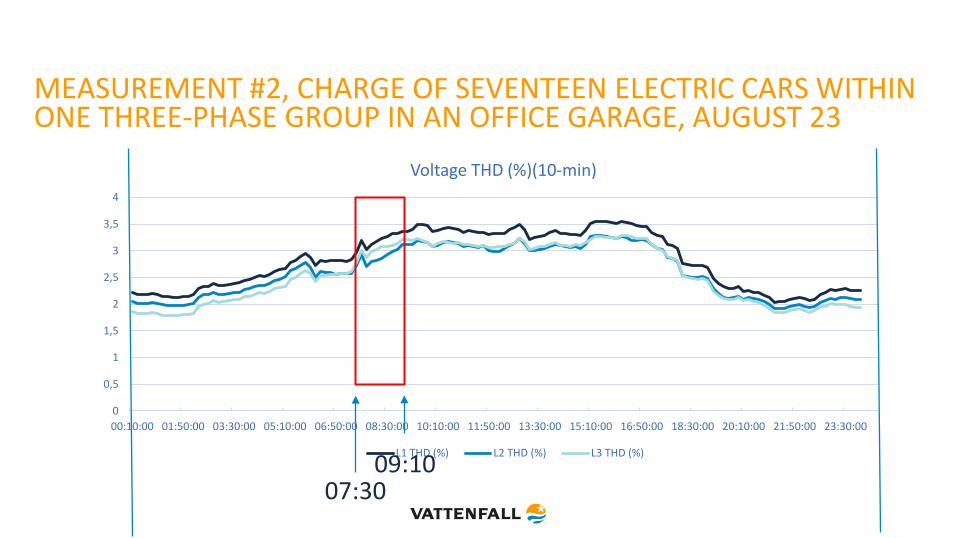
MEASUREMENT #2, CHARGE OF SEVENTEEN ELECTRIC CARS WITHIN ONE THREE-PHASE GROUP IN AN OFFICE GARAGE, AUGUST 23
0
10
20
30
40
50
60
70
80
00:10:00 01:50:00 03:30:00 05:10:00 06:50:00 08:30:00 10:10:00 11:50:00 13:30:00 15:10:00 16:50:00 18:30:00 20:10:00 21:50:00 23:30:00
Current (10-min)
L1 (A) L2 (A) L3 (A)
07:30 09:10

232
233
234
235
236
237
238
239
240
241
242
00:10:00 01:50:00 03:30:00 05:10:00 06:50:00 08:30:00 10:10:00 11:50:00 13:30:00 15:10:00 16:50:00 18:30:00 20:10:00 21:50:00 23:30:00
Voltage (10-min)
L1-N (V) L2-N (V) L3-N (V)
MEASUREMENT #2, CHARGE OF SEVENTEEN ELECTRIC CARS WITHIN ONE THREE-PHASE GROUP IN AN OFFICE GARAGE, AUGUST 23
07:30 09:10
0
0,5
1
1,5
2
2,5
3
3,5
4
00:10:00 01:50:00 03:30:00 05:10:00 06:50:00 08:30:00 10:10:00 11:50:00 13:30:00 15:10:00 16:50:00 18:30:00 20:10:00 21:50:00 23:30:00
Voltage THD (%)(10-min)
L1 THD (%) L2 THD (%) L3 THD (%)
MEASUREMENT #2, CHARGE OF SEVENTEEN ELECTRIC CARS WITHIN ONE THREE-PHASE GROUP IN AN OFFICE GARAGE, AUGUST 23
07:30 09:10

MEASUREMENT #2, CHARGE OF SEVENTEEN ELECTRIC CARS WITHIN ONE THREE-PHASE GROUP IN AN OFFICE GARAGE, AUGUST 24
0
10
20
30
40
50
60
70
80
00:10:00 01:50:00 03:30:00 05:10:00 06:50:00 08:30:00 10:10:00 11:50:00 13:30:00 15:10:00 16:50:00 18:30:00 20:10:00 21:50:00 23:30:00
Current (10-min)
L1 (A) L2 (A) L3 (A)
07:20 09:00

MEASUREMENT #2, CHARGE OF SEVENTEEN ELECTRIC CARS WITHIN ONE THREE-PHASE GROUP IN AN OFFICE GARAGE, AUGUST 24
232
233
234
235
236
237
238
239
240
241
242
00:10:00 01:50:00 03:30:00 05:10:00 06:50:00 08:30:00 10:10:00 11:50:00 13:30:00 15:10:00 16:50:00 18:30:00 20:10:00 21:50:00 23:30:00
Voltage (10-min)
L1-N (V) L2-N (V) L3-N (V)
07:20 09:00

MEASUREMENT #2, CHARGE OF SEVENTEEN ELECTRIC CARS WITHIN ONE THREE-PHASE GROUP IN AN OFFICE GARAGE, AUGUST 24
0
0,5
1
1,5
2
2,5
3
3,5
4
00:10:00 01:50:00 03:30:00 05:10:00 06:50:00 08:30:00 10:10:00 11:50:00 13:30:00 15:10:00 16:50:00 18:30:00 20:10:00 21:50:00 23:30:00
Voltage THD (%)(10-min)
L1 THD (%) L2 THD (%) L3 THD (%)
07:20 09:00

THE POWER ISSUE IS NATIONAL, REGIONAL AND LOCAL – NATIONAL NO PROBLEM
• Sweden had in year 2005 a power need as described in the Figure
• If 25% of all electric cars (2016: 4 700 000 cars) needs to be charged as in the Office garage, then they will peak with 2.4 GW at 9:20
• 400 MW corresponds to one (1) degree in outdoor temperature (2.4 GW = 6 degrees)
• Available over-capacity needed in our networks
19

REGIONAL NETWORK CAN BE INFLUENCED – MORE ANALYSIS NEEDED
An increased demand of 2.5 % (1 MW in this example) Load-shift the charging of the car to after 7 PM Local incentive can have a big impact!
Existing evening-peak
New evening-peak
20

DEMAND IN ENERGY The demand in energy during a year with the same assumptions
as above will for 4 700 000 of electric cars where only half of them are used during one day and charged twice (charging at work during the day and charging at home during night) will be 100*2*4 700 000/2/17*365/1 000 000 000 = 10 TWh annually. This gives a rough idea of what energy that will be needed in the future power system for electric vehicles in Sweden. The energy demand in Sweden was 140 TWh in year 2016.

LOCALLY THERE IS A NEED OF LOAD-SHIFT – TARIFFS CAN CREATE INCENTIVE
Cloth dryer 2000 W
Oven 1500 W TV 140 W
Floor heating 1000 W (10 sqm)
Local load-shift is always integrated in our charging stations today and these stations will be more advanced
Load-shift has been tested in Smart Grid Gotland with good result
22
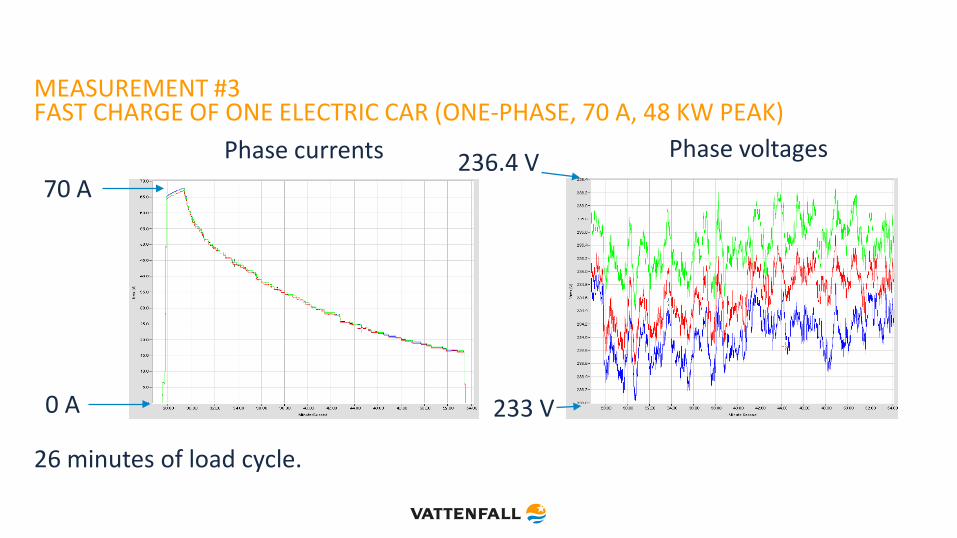
MEASUREMENT #3 FAST CHARGE OF ONE ELECTRIC CAR (ONE-PHASE, 70 A, 48 KW PEAK)
26 minutes of load cycle.
70 A
Phase currents
Phase voltages
233 V
236.4 V
0 A

MEASUREMENT #3 FAST CHARGE OF ONE ELECTRIC CAR (ONE-PHASE, 70 A, 48 KW PEAK)
The THD of the phase voltages increase only with some 0.1% during the electric charge of the car.
1.16%
0.84%

MEASUREMENT #4, FAST CHARGING OF BUS 73 IN STOCKHOLM • Fast charging of 100 kW at Ropsten and Karolinska
Institutet
• Demands 6 minutes of charging time
• The loading sequence starts automatically when the driver has parked and put on the parking brake
• Electro-Magnetic Field (EMF)
Fast charging at end stations
The charging station has been procured and installed by Vattenfall. Vattenfall is also operating the stations during the project period incl. First Line Service. 25

ZEEUS – PLUG-IN ELECTRIC HYBRID BUSES AT LINE 73 VOLTAGE THD (%) VS CHARGING
26
Current in ampere (one phase) during Bus charging, 07-20. Current raise to 100 A during
charge sequence (6 min) but due to use of same scale as Voltage THD only the lower value has
been showed in the graph
Voltage THD in % of nominal voltage. The value do not follow the charge sequence described
above. This shows that the THD value origins from all other loads in the area. Max THD is 8%.
Charging station power down 15 min. (off)10:00-10:15
Study made by Jonas Wetterström at Vattenfall R&D, Power Technology.

Possible challenges
• Analyse bottlenecks (kW-MW), how to use available capacity
• Analyse differences in strong/weak networks
• Unsymmetries, currents in return conductors, harmonics in return conductors
• Voltage drops, methods for fast analysis, might be problems in weak grids
• Harmonics, might be problems in weak grids
• Electro-Magnetic Fields (EMF)/Environment
Beneficial to discuss challenges in cooperation with other network companies, car producers, as well as manufacturers of charging equipment.
CONCLUSIONS AND DISTRIBUTION CHALLENGES
27