
Measurement of diesel solid nanoparticle emissions using · PDF fileFinal Report . ARB...
65
Final Report ARB Contract 08-302 Measurement of Diesel Solid Nanoparticle Emissions Using a Catalytic Stripper for Comparison to Europe's PMP Protocol Prepared f or: Seungju Y oon California Air Resources Board 1001 I Street P.O. Box 2815 Sacramento, CA 95812 November 2012 Submitted by: Heejung Jung Thomas D. Durbin Kent Johnson Zhongqing Zheng University of California CE-CERT Riverside, CA 92521 951-781-5791 951-781-5790 (fax)
Transcript of Measurement of diesel solid nanoparticle emissions using · PDF fileFinal Report . ARB...

Final Report ARB Contract 08-302
Measurement of Diesel Solid Nanoparticle Emissions Using a Catalytic Stripper for Comparison to Europe's PMP Protocol
Prepared for: Seungju Yoon
California Air Resources Board 1001 I Street P.O. Box 2815
Sacramento, CA 95812
November 2012
Submitted by:
Heejung Jung Thomas D. Durbin
Kent Johnson Zhongqing Zheng
University of California CE-CERT Riverside,
CA 92521 951-781-5791
951-781-5790 (fax)

i
Disclaimer The statements and conclusions in this report are those of the contractor and not necessarily those of California Air Resources Board. The mention of commercial products, their source, or their use in connection with material reported herein is not to be construed as actual or implied endorsement of such products.
Acknowledgements
The authors acknowledge California Air Resources Board (CARB) for funding (08-302) and lend- ing instruments for this study. H.S.J. would like to thank Drs. Alberto Ayala and Jorn Herner for encouragement. The authors also would like to thank former project managers Drs. Shaohua Hu and Tao Huai for insightful advice.
The authors acknowledge Dr. David Kittelson of the University of Minnesota for his assistance in developing the test plan procedures, in carrying out the experiments, and in analysis of the data.
The authors gratefully acknowledge AVL LIST GmbH for providing us an AVL particle counter and technical support. Drs. Barouch Giechaskiel, Richard Frazee, Linke Manfred, Siegfried Roeck, and William Silvis from AVL are particularly appreciated. We appreciate the help of Mr. Zhihua Liu, Mr. Donald Pacocha, Mr. Joe Valdez, and Mr. Edward O'Neil in conducting the tests. We thank Dr. Akua Asa-Awuku for lending us a CPC. Authors acknowledge Dr. Jacob Swanson for thoughtful comments on chassis dynamometer test. H.S.J. acknowledges Dr. David Cocker for the fast-SMPS.

ii
Contents
Disclaimer . . . . . . . . . . . . . . . . . . . . . . . . . . . . . . . . . . . . . . . . . . i Table of Contents . . . . . . . . . . . . . . . . . . . . . . . . . . . . . . . . . . . . . . ii List of Figures. . . . . . . . . . . . . . . . . . . . . . . . . . . . . . . . . . . . . . . . iv List of Tables. . . . . . . . . . . . . . . . . . . . . . . . . . . . . . . . . . . . . . . . vi Executive Summary . . . . . . . . . . . . . . . . . . . . . . . . . . . . . . . . . . . . . vii
1 Background 1
2 Experimental procedures for laboratory tests 4
2.1 Solid particle measurement systems . . . . . . . . . . . . . . . . . . . . . . . . . 4 2.1.1 PMP measurement system . . . . . . . . . . . . . . . . . . . . . . . . . . 4
2.1.2 Catalytic stripper . . . . . . . . . . . . . . . . . . . . . . . . . . . . . . . 4 2.2 Test aerosols . . . . . . . . . . . . . . . . . . . . . . . . . . . . . . . . . . . . . . 4 2.3 Experimental setup . . . . . . . . . . . . . . . . . . . . . . . . . . . . . . . . . . 6
3 Experimental procedures for chassis dynamometer tests 7
3.1 Experimental setup . . . . . . . . . . . . . . . . . . . . . . . . . . . . . . . . . . 7 3.2 Test vehicles, fuels, lubricants . . . . . . . . . . . . . . . . . . . . . . . . . . . . 8 3.3 Test cycles . . . . . . . . . . . . . . . . . . . . . . . . . . . . . . . . . . . . . . . 9
3.3.1 Cruise. . . . . . . . . . . . . . . . . . . . . . . . . . . . . . . . . . . . . 9 3.3.2 UDDS. . . . . . . . . . . . . . . . . . . . . . . . . . . . . . . . . . . . . 9
4 Experimental procedures for on-road tests 10
4.1 Experimental setup . . . . . . . . . . . . . . . . . . . . . . . . . . . . . . . . . . 10 4.2 Test vehicles, fuels, lubricants . . . . . . . . . . . . . . . . . . . . . . . . . . . . 10 4.3 Test routes . . . . . . . . . . . . . . . . . . . . . . . . . . . . . . . . . . . . . . . 10 4.4 PM emissions calculation . . . . . . . . . . . . . . . . . . . . . . . . . . . . . . . 10
5 Laboratory tests results 13 6 Steady state chassis dynamometer test results 17
6.1 Particle Measurements from the CVS . . . . . . . . . . . . . . . . . . . . . . . . 17 6.2 Particle number emissions under the APC and CS . . . . . . . . . . . . . . . . . . 20
7 On-road and UDDS chassis dynamometer test results 29
7.1 Real-time PN emissions . . . . . . . . . . . . . . . . . . . . . . . . . . . . . . . . 29 7.2 Integrated PM and PN emissions . . . . . . . . . . . . . . . . . . . . . . . . . . . 32 7.3 Test repeatability . . . . . . . . . . . . . . . . . . . . . . . . . . . . . . . . . . . 35
8 Summary and discussion 38 A CPC calibrations A-1
A.1 Calibration experimental setup . . . . . . . . . . . . . . . . . . . . . . . . . . . . A-1
iii
A.2 Calibration procedures . . . . . . . . . . . . . . . . . . . . . . . . . . . . . . . . A-1 A.3 Results . . . . . . . . . . . . . . . . . . . . . . . . . . . . . . . . . . . . . . . . . B-1
B CPC time response tests B-1
B.1 Experimental setup . . . . . . . . . . . . . . . . . . . . . . . . . . . . . . . . . . B-1 B.2 Typical signal change graphs . . . . . . . . . . . . . . . . . . . . . . . . . . . . . B-1 B.3 Results . . . . . . . . . . . . . . . . . . . . . . . . . . . . . . . . . . . . . . . . . B-1
C Additional data for laboratory tests C-1 C.1 Sulfuric acid aerosol . . . . . . . . . . . . . . . . . . . . . . . . . . . . . . . . . C-1 C.2 Tetracosane aerosol . . . . . . . . . . . . . . . . . . . . . . . . . . . . . . . . . . C-1 C.3 Sulfuric acid and tetracosane aerosol . . . . . . . . . . . . . . . . . . . . . . . . . C-2
D Catalytic stripper data for the on-road tests D-6

iv
List of Figures
2.1 Schematic of the APC from the instrument manual. . . . . . . . . . . . . . . . . . 5 2.2 Schematic of the CS. . . . . . . . . . . . . . . . . . . . . . . . . . . . . . . . . . 5 2.3 Schematic of laboratory test setup . . . . . . . . . . . . . . . . . . . . . . . . . . 6
3.1 Schematic of chassis dynamometer test setup . . . . . . . . . . . . . . . . . . . . 8
4.1 Schematic of experimental setup for the on-road test. . . . . . . . . . . . . . . . . 11 4.2 Map and elevation variation of the on-road test . . . . . . . . . . . . . . . . . . . 12
5.1 Particle size distributions from the laboratory test. . . . . . . . . . . . . . . . . . . 13
6.1 Contour plots of real-time particle size distributions measured by the EEPS in the
CVS at the 74% engine load. . . . . . . . . . . . . . . . . . . . . . . . . . . . . . 17 6.2 Total particle number concentrations in the CVS at the 74% engine load. . . . . . . 18 6.3 Total particle number concentrations in the CVS at the 26% engine load. . . . . . . 18 6.4 PM and PN concentrations of nucleation mode and accumulation modes in the CVS. . 19 6.5 Real-time particle number concentrations measured by different CPCs at the 74%
engine load. . . . . . . . . . . . . . . . . . . . . . . . . . . . . . . . . . . . . . . 21 6.6 Real-time particle number concentrations measured by different CPCs at the 26% engine load. . . . . . . . . . . . . . . . . . . . . . . . . . . . . . . . . . . . . . . 23 6.7 Integrated particle number emissions for the chassis dynamometer test. . . . . . . . 25 6.8 Particle size distributions downstream of the APC and CS at the 74% engine load. . 25 6.9 Particle size distributions downstream of the APC and CS at the 26% engine load. . 26 6.10 Real-time ET wall temperature and CPC concentrations for the laboratory test. . . 27 6.11 Real-time ET wall temperature and CPC concentrations for the chassis dynamome-
ter test at the 74% load. . . . . . . . . . . . . . . . . . . . . . . . . . . . . . . . .
28
7.1 Real-time PN concentrations during the UDDS test. . . . . . . . . . . . . . . . . . 29 7.2 Particle size distributions contour in the CVS during the UDDS test. . . . . . . . . 30 7.3 Real-time PN concentrations for the on-road flow-of-traffic diriving test. . . . . . . 31 7.4 Particle size distributions contour in the CVS during the on-road test. . . . . . . . . 32 7.5 Average engine loads and exhaust temperatures for the UDDS and on-road tests. . . 34 7.6 Integrated PM and PN emissions for the UDDS and on-road tests. . . . . . . . . . 35 7.7 Integrated PM and PN emissions for the UDDS and on-road tests on a distance basis. 36 7.8 Coefficients of variations for the UDDS and on-road tests. . . . . . . . . . . . . . 37
A.1 Schematic of CPC calibration experiment conducted in MEL. . . . . . . . . . . . . A-1 A.2 Particle size distribution of source aerosol measured by EEPS, fastSMPS, and nanoSMPS. . . . . . . . . . . . . . . . . . . . . . . . . . . . . . . . . . . . . . . B-1 A.3 Particle number concentration difference of other CPC with CPC 3776. . . . . . . B-2
B.1 Schematic of CPC time alignment test. . . . . . . . . . . . . . . . . . . . . . . . . B-1 B.2 Signal change example of the time response testing. . . . . . . . . . . . . . . . . . B-2
v
B.3 Signal change example of the time response testing. . . . . . . . . . . . . . . . . . B-3 B.4 Signal change example of the time response testing. . . . . . . . . . . . . . . . . . B-3
C.1 Sulfuric acid particle size distributions measured upstream and downstream of CS. C-1 C.2 Sulfuric acid particle size distributions measured upstream and downstream of APC. C-2 C.3 Tetracosane particle size distributions upstream and downstream of CS. . . . . . . C-3 C.4 Tetracosane particle size distributions upstream and downstream of APC and CS. . C-3 C.5 Sulfuric acid and tetracosane size distributions upstream and downstream of CS. . . C-4 C.6 Sulfuric acid and tetracosane size distributions upstream and downstream of APC
and CS measured with regular SMPS. . . . . . . . . . . . . . . . . . . . . . . . . C-4 C.7 Sulfuric acid and tetracosane size distributions upstream and downstream of APC
and CS measured with nanoSMPS. . . . . . . . . . . . . . . . . . . . . . . . . . . C-5 D.1 Real-time particle number concentrations downstream of the CS for the UDDS test. D-6 D.2 Real-time particle number concentrations downstream of the CS for the on-road test.D-7
vi
List of Tables
3.1 Specifications of instruments used in this study. . . . . . . . . . . . . . . . . . . . 9
5.1 Summary of laboratory test results. . . . . . . . . . . . . . . . . . . . . . . . . . . 15
A.1 Predicted and measured percentage differences of different CPCs. . . . . . . . . . B-1
B.1 CPC time constants on when on the APC side . . . . . . . . . . . . . . . . . . . . B-2 B.2 CPC time constants on when on the CS side . . . . . . . . . . . . . . . . . . . . . B-2

vii
Executive Summary Background and Motivation As diesel particulate matter emissions have declined due to more stringent regulations and the implementation of diesel particle filters (DPFs), they have become more difficult to accurately measure using the traditional gravimetric method, even with the improved protocols issued by the Environmental Protection Agency (EPA, 2011). In Europe, the Particle Measurement Programme (PMP) working group has developed a methodology to quantify the number of solid particles larger than 23 nm in order to supplement or replace the existing gravimetric method. For this protocol, solid particles are operationally defined by the PMP as particles that can survive after passing through an evaporation tube (ET) that has a wall temperature of 300–400°C (UNECE, 2011a,b). While this method offers the potential to enhance the repeatability of the particle measurements, potentially solid sub-23 nm particles have been found downstream of the PMP volatile particle remover under a variety of conditions (Filippo and Maricq, 2008; Giechaskiel et al., 2009; Herner et al., 2007; Johnson et al., 2009; Kittelson et al., 2006; Lahde et al., 2009, 2010; Ronkko et al., 2007).
It is important to investigate whether these sub-23 nm particles observed downstream of the PMP system are solid or volatile, and if they are solid, whether they come from the exhaust or are artifacts of the measurement system. The goal of this study was to investigate and characterize particles found downstream of the PMP system, with an emphasis on sub-23 nm particles. A PMP-compliant system, namely the AVL advanced particle counter (APC), and an alternative volatile particle removal system utilizing a catalytic stripper (CS) were evaluated and compared for measuring solid particle number emissions in this study. Method The evaluations and comparisons were conducted using sulfuric acid and hydrocarbon particles as model volatile particles in laboratory tests, and diluted exhaust from a diesel particle filter (DPF)-equipped heavy-duty diesel vehicle operated on a heavy-duty chassis dynamometer under steady speed conditions at two different engine loads. A number of different real-time particle number counters were used to make measurements of particle number (PN) with different particle size cuts. For comparison with laboratory findings, field comparison tests of a heavy-duty diesel vehicle were conducted on a chassis dynamometer over the urban dynamometer driving schedule (UDDS) cycle and on the highweay in flow-of-traffic driving conditions, including two uphill (phases 1 and 2) and two downhill (phases 3 and 4) segments.
Results o Lab test
In the laboratory testing, both the PMP system and CS removed more than 99% of the volatile particles in terms of PN when using aerosols composed of pure sulfuric acid or hydrocarbons. When using laboratory test aerosols consisting of mixtures of sulfuric acid and hydrocarbons, more than 99% of the particles were removed by the PMP evaporator, but the surviving particles were no longer entirely volatile, with 12–14% being solid. Similar artifact particles were not found for the CS. These experiments showed at a fundamental level that the presence of sulfuric acid in conjunction with hydrocarbons facilitates the formation of solid artifact particles in the PMP instrument.

vii
o Chassis dynamometer test (for steady state conditions)
For the steady state chassis dynamometer testing, it was found that the majority of the particles downstream of the PMP system were below the 23 nm size cut, and that these smaller particles were formed as an artifact via the PMP. PN emissions of particles between 3 and 10 nm downstream of the PMP were ~2 and 7 times higher than the PN emissions of particles above 10 nm at the 74 and 26% engine load, respectively. At the 26% engine load, PN level of the 3 to 10 nm particles downstream of the PMP were significantly higher than that in the dilution tunnel, demonstrating that the PMP was making 3 to 10 nm particles. The PN emissions of 3 to 10 nm particles downstream of the PMP were related to the heating temperature of the PMP evaporation tube, suggesting these particles are artifacts formed by renucleation of semivolatiles. Considerably fewer particles between 3 to 10 nm were seen downstream of the CS for both engine loads due mainly to removal of semivolatile material by the catalytic substrates, although some of this difference could be attributed to diffusion and thermophoretic losses.
o On-road test in comparison with transient chassis dynamometer test For the UDDS chassis dynamometer and on-road testing, PN emissions results also showed the presence of re-nucleated sub 10 nm particles downstream of the PMP system, but negligible numbers of particles between 10 and 23 nm, for both the UDDS and on-road tests. For the uphill driving conditions of the on-road test, the re-nucleated particles downstream of the PMP system can even grow to larger than 10 nm by condensation of volatile vapors. All the re-nucleated particles downstream of the PMP system were smaller than 10 nm for the UDDS and downhill driving conditions of the on-road test. The variability of the PN emissions of particles larger than 23 nm ranged from 10 to 40% for the UDDS and on-road tests, which is comparable to that found in the European PMP study. Conclusions This study confirmed the presence sub-23 nm particles below the PMP that have been seen in previous studies and provided evidence that the majority of these were artifact particles formed by renucleation of semivolatiles. The presence of sub-23 nm particles downstream of the PMP poses challenges if the cut off diameter for the PMP protocol were to be reduced to count ash particles or if the PMP were to be applied more broadly to other sectors for measuring solid particles. Based on the current study, these artifact particles are mainly present below 10 nm, suggesting that artifact formation would not be a significant problem if the cut off diameter of the PMP was only lowered to 10 nm. These artifact particles were considerably reduced for the CS, which eliminated the artifact particles via catalytic reaction.

1
1 Background As regulation of diesel particulate matter mass gets more stringent, the current gravimetric method for the legal determination of emissions will have difficulty accurately quantifying particulate matter mass emissions. Although the United States (U.S.) Environmental Protection Agency (EPA) issued an improved protocol for the gravimetric method (EPA, 2011), accuracy will continue to be an issue at the very low emission levels of new diesel vehicles equipped with aftertreatment systems. At the Euro IV heavy-duty engine limit of 0.02 g/kWh, for example, the variabilities of the repeatability and reproducibility of the current gravimetric method are more than 20 and 50%, respectively (Burtscher, 2005).
Diesel particles (a.k.a., diesel particulate matter) are emitted in three usually distinct, but overlap- ping, size modes: the nucleation mode, typically 3–30 nm diameter, containing most of the particle number; the accumulation mode, roughly 30–500 nm, containing most of the particle mass; and the coarse mode consisting of larger particles and usually comprising less than 10% of the mass (Kittelson, 1998). Diesel particulate filters (DPFs) that are essential to meet current emission standards typically reduce emissions of accumulation and coarse mode particles, but it has been reported that the contribution of nanoparticles to the total emissions may become more important for newer DPF-equipped engines.
Progress in regulating diesel particle emissions by non-gravimetric means has been made in Europe. The United Nations Economic Commission for Europe-Group of Experts on Pollution and Energy (UNECE-GRPE) initiated the Particle Measurement Programme (PMP) working group to develop new particle measurement techniques to supplement or replace the current gravimetric method. The PMP protocol specifies measuring solid particles larger than 23 nm. Solid particles are operationally defined by the PMP as particles that can survive after passing through an evaporation tube (ET) that has a wall temperature of 300–400°C (UNECE, 2011a,b). A solid particle number concentration limit of 6 × 10¹¹ particles/km has been included in the Euro 5/6 standards for light-duty diesel vehicles (EC, 2008). The Euro VI standard for heavy-duty diesel vehicles includes a solid particle number concentration limit as well, with the proposed limits of 8 × 10¹¹ particles/kWh for stationary cycles and 6 × 10¹¹ particles/kWh for transient cycles (EC, 2011).
Volatile particles in the nucleation mode can be very difficult to measure in a repeatable manner (Kittelson, 1998; Shi and Harrison, 1999). To enhance the repeatability and accuracy of particle number measurements, the PMP methodology was designed to eliminate the volatile particles and measure only solid particle number emissions. The PMP protocol also specifies that only particles larger than 23 nm are measured to try to eliminate any contribution from nucleation mode particles.
Exclusion of sub-23 nm particles may have some potential issues, since not all sub-23 nm or nucleation mode size range particles are volatile. Some studies have found solid particles in the nucleation mode from heavy-duty diesel vehicles operating at idle or low loads (Filippo and Maricq, 2008; Kittelson et al., 2006). Even at high load operating conditions, solid particles in the nucleation mode have been observed for heavy-duty diesel vehicles (Lahde et al., 2009, 2010; Ronkko et al., 2007). These references (Filippo and Maricq, 2008; Kittelson et al., 2006; Lahde et al., 2009, 2010; Ronkko et al., 2007) also define non-volatile or solid particles as

2
particles that can survive after passing through a thermodenuder (Burtscher et al., 2001), but with a slightly larger temperature operating range of 270–400°C compared with the PMP. By excluding these sub-23 nm solid particles, the full impact of solid particles is not characterized by the PMP standard (Martini et al., 2009). Regulating particle number emissions for other sectors (aviation, off-road) is under discussion (Giechaskiel et al., 2010a). If the current PMP protocol were applied to other sectors, further caution should be taken in excluding sub-23 nm solid particles. For example, solid nucleation mode particles have been found for a gasoline vehicle, when some anti-knock metal additives were used (Gidney et al., 2010). Lead anti-knock additives are also still used in gasoline for general aviation. Czerwinski et al. (2006) even found solid particles below 23 nm emitted from 2-stroke mopeds.
It is also reported that the PMP can remove almost all volatile components of diesel vehicle emissions, and that no nucleation can occur downstream of the PMP (Giechaskiel et al., 2010a). However, during previous California Air Resource Board(CARB)/University of California Riverside (UCR) studies of the PMP, a significant number of appeared-to-be solid sub-23 nm particles were found downstream of the PMP volatile particle remover under conditions that were thought to be unlikely to form sub-23 nm solid particles (Herner et al., 2007; Johnson et al., 2009). In the exploratory work for applying the current PMP protocol to heavy-duty diesel engines, Giechaskiel et al. (2009) also found apparently non-volatile sub-23 nm particles downstream of the PMP sys- tem. Thus, it is important to investigate whether these sub-23 nm particles observed downstream of the PMP system are solid or volatile, and if they are solid, whether they come from the exhaust or are artifacts of the measurement system.
An alternative system commonly used by researchers to remove volatile particles is a catalytic stripper (CS) (Abdul-Khalek and Kittelson, 1995; Kittelson et al., 2005; Park et al., 2003; Swanson and Kittelson, 2010a,b). In contrast to the PMP system, the CS uses a different approach to remove volatile particles. It removes all volatile hydrocarbon components and sulfur components by catalytic reactions at an elevated temperature. Therefore, renucleation will not occur downstream the CS. A study comparing the volatile removal efficiency of a CS with a thermal denuder, which is another type of volatile particle remover, showed that the CS had a higher efficiency for removing volatile particles (Swanson and Kittelson, 2010a). However, no studies have been conducted to compare the PMP system with a CS in terms of volatile particle removing efficiency.
In Europe, particle number (PN) emissions are measured under the same testing cycles as particle mass (PM) emissions and other gaseous emissions (UNECE, 2011a,b), using cycles such as the world harmonized steady cycle (WHSC) and the world harmonized transient cycle (WHTC). These testing cycles were designed to represent on-road driving emission levels. It is uncertain, though, whether laboratory testing cycles reflect on-road driving conditions, especially for the newly regulated PN emissions. Currently, there is no PN regulation in the United States (U.S.). In the on-road testing part of previous CARB/UCR PMP study (Johnson et al., 2009; Zheng et al., 2012), a very high level of solid larger than 23 nm particles was reported downstream of the PMP under an aggressive on-road flow-of-traffic driving condition. In that study, however, the elevated engine load, on-road flow-of-traffic driving was performed only once. Therefore, no statistical comparisons could be made.
3
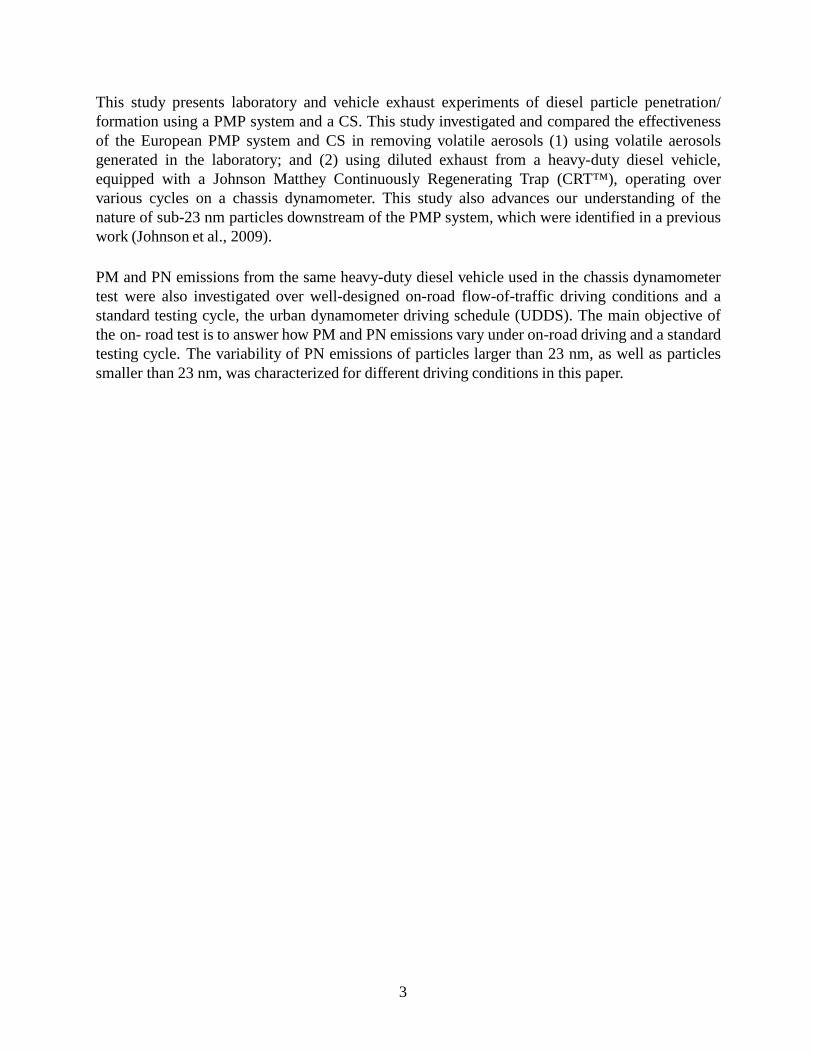
This study presents laboratory and vehicle exhaust experiments of diesel particle penetration/ formation using a PMP system and a CS. This study investigated and compared the effectiveness of the European PMP system and CS in removing volatile aerosols (1) using volatile aerosols generated in the laboratory; and (2) using diluted exhaust from a heavy-duty diesel vehicle, equipped with a Johnson Matthey Continuously Regenerating Trap (CRT™), operating over various cycles on a chassis dynamometer. This study also advances our understanding of the nature of sub-23 nm particles downstream of the PMP system, which were identified in a previous work (Johnson et al., 2009).
PM and PN emissions from the same heavy-duty diesel vehicle used in the chassis dynamometer test were also investigated over well-designed on-road flow-of-traffic driving conditions and a standard testing cycle, the urban dynamometer driving schedule (UDDS). The main objective of the on- road test is to answer how PM and PN emissions vary under on-road driving and a standard testing cycle. The variability of PN emissions of particles larger than 23 nm, as well as particles smaller than 23 nm, was characterized for different driving conditions in this paper.

4
2 Experimental procedures for laboratory tests
2.1 Solid particle measurement systems
2.1.1 PMP measurement system The PMP system used in the current study was an AVL particle counter advanced (APC), a commercial solid particle measuring system developed by AVL LIST GmbH. A schematic of the APC is shown in Figure 2.1. The APC fulfills the most recent requirements of the PMP protocol (UN- ECE, 2011a, b). A brief description of the APC is provided here. More detailed schematics and descriptions of the APC can be found in reference (Giechaskiel et al., 2010b) and the manual of the APC. The sample enters the system with a typical flow rate of 5 Lpm (liters per minute) and is diluted by a primary chopper diluter, which has a rotating disk diluter with a dilution ratio ranging from 10 to 1000. The diluted sample has a flow rate of 1 Lpm, and is transferred to the ET through a 2 m line. The dilution air, the primary chopper diluter, and the 2 m line are all operating at 150°C. The ET has a wall temperature of 350°C. A secondary, perforated, tube diluter that dilutes the sample with ambient temperature air follows the ET. The secondary dilution ratio is usually set at 10. A TSI 3790 condensation particle counter (CPC), with a lower 50% cut off diameter (D50) of 23 nm, then measures the particle number concentration of the sample. The outlet flow rate of the APC was ~8.5 Lpm.
2.1.2 Catalytic stripper The catalytic stripper (CS) used in the current study is similar to others described elsewhere (Abdul-Khalek and Kittelson, 1995; Stenitzer, 2003). Stenitzer (2003) provides a more complete description of the theory, design, and operation of the CS. A brief description of the CS is pro- vided here and a schematic of the CS is shown in Figure 2.2. The CS uses two different catalysts, provided by Johnson Matthey, to remove sulfur components and hydrocarbon components, respectively, from the diesel exhaust. The catalyst that removes hydrocarbon components by oxidation is called an Oxicat and the catalyst that adsorbs sulfur components is called a S-trap. The sample passes by the Oxicat first and then S-trap. Both the S-trap and Oxicat are heated to 300°C. Afterwards, a cooling coil cools down the sample to ambient temperature. There are no specific requirements on the flow rate through the CS. In the current study, a flow rate of 10 Lpm was used.
2.2 Test aerosols For the laboratory tests, aerosols with four different compositions were utilized to evaluate the response of the APC and CS systems under controlled conditions. The aerosol compositions included pure sulfuric acid, pure tetracosane (C24 n-alkane), a mixture of sulfuric acid and tetracosane, and a mixture of sulfuric acid and tetracontane (C40 n-alkane). These aerosols were chosen as model aerosols to allow comparisons with the PMP protocol for determining volatile removal efficiency, and to mimic real diesel particulate filter (DPF)-out semivolatile diesel particles. The PMP protocol specifies tetracontane (C40 n-alkane) particles as the model aerosol

5
Figure 2.1: Schematic of the APC from the instrument manual. to evaluate the volatile removal efficiency of PMP compliant systems (Giechaskiel et al., 2010b). Biswas et al. (2009) re- ported semivolatile particles downstream of a DPF are mainly composed of sulfate, hydrocarbons, and some ammonium, the source of which could not be identified. It was expected that the particles seen downstream of the continuously regenerating trap (CRT™) in the chassis dynamometer tests here would also have a similar composition. Sulfuric acid and hydrocarbons are model aerosols that have been used by other researchers to evaluate the volatile removal efficiencies of PMP-like systems (Giechaskiel and Drossinos, 2010; Swanson and Kittelson, 2010a).
Figure 2.2: Schematic of the CS.
6
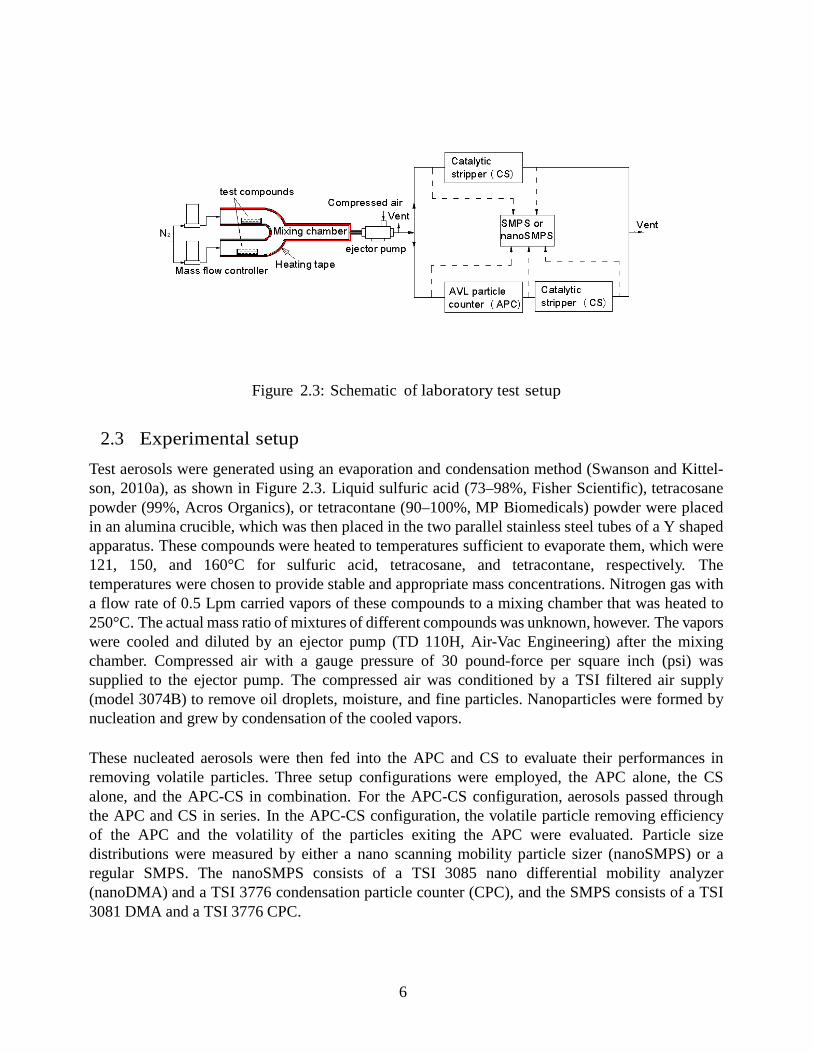
Figure 2.3: Schematic of laboratory test setup
2.3 Experimental setup Test aerosols were generated using an evaporation and condensation method (Swanson and Kittel- son, 2010a), as shown in Figure 2.3. Liquid sulfuric acid (73–98%, Fisher Scientific), tetracosane powder (99%, Acros Organics), or tetracontane (90–100%, MP Biomedicals) powder were placed in an alumina crucible, which was then placed in the two parallel stainless steel tubes of a Y shaped apparatus. These compounds were heated to temperatures sufficient to evaporate them, which were 121, 150, and 160°C for sulfuric acid, tetracosane, and tetracontane, respectively. The temperatures were chosen to provide stable and appropriate mass concentrations. Nitrogen gas with a flow rate of 0.5 Lpm carried vapors of these compounds to a mixing chamber that was heated to 250°C. The actual mass ratio of mixtures of different compounds was unknown, however. The vapors were cooled and diluted by an ejector pump (TD 110H, Air-Vac Engineering) after the mixing chamber. Compressed air with a gauge pressure of 30 pound-force per square inch (psi) was supplied to the ejector pump. The compressed air was conditioned by a TSI filtered air supply (model 3074B) to remove oil droplets, moisture, and fine particles. Nanoparticles were formed by nucleation and grew by condensation of the cooled vapors.
These nucleated aerosols were then fed into the APC and CS to evaluate their performances in removing volatile particles. Three setup configurations were employed, the APC alone, the CS alone, and the APC-CS in combination. For the APC-CS configuration, aerosols passed through the APC and CS in series. In the APC-CS configuration, the volatile particle removing efficiency of the APC and the volatility of the particles exiting the APC were evaluated. Particle size distributions were measured by either a nano scanning mobility particle sizer (nanoSMPS) or a regular SMPS. The nanoSMPS consists of a TSI 3085 nano differential mobility analyzer (nanoDMA) and a TSI 3776 condensation particle counter (CPC), and the SMPS consists of a TSI 3081 DMA and a TSI 3776 CPC.
7
3 Experimental procedures for chassis dynamometer tests
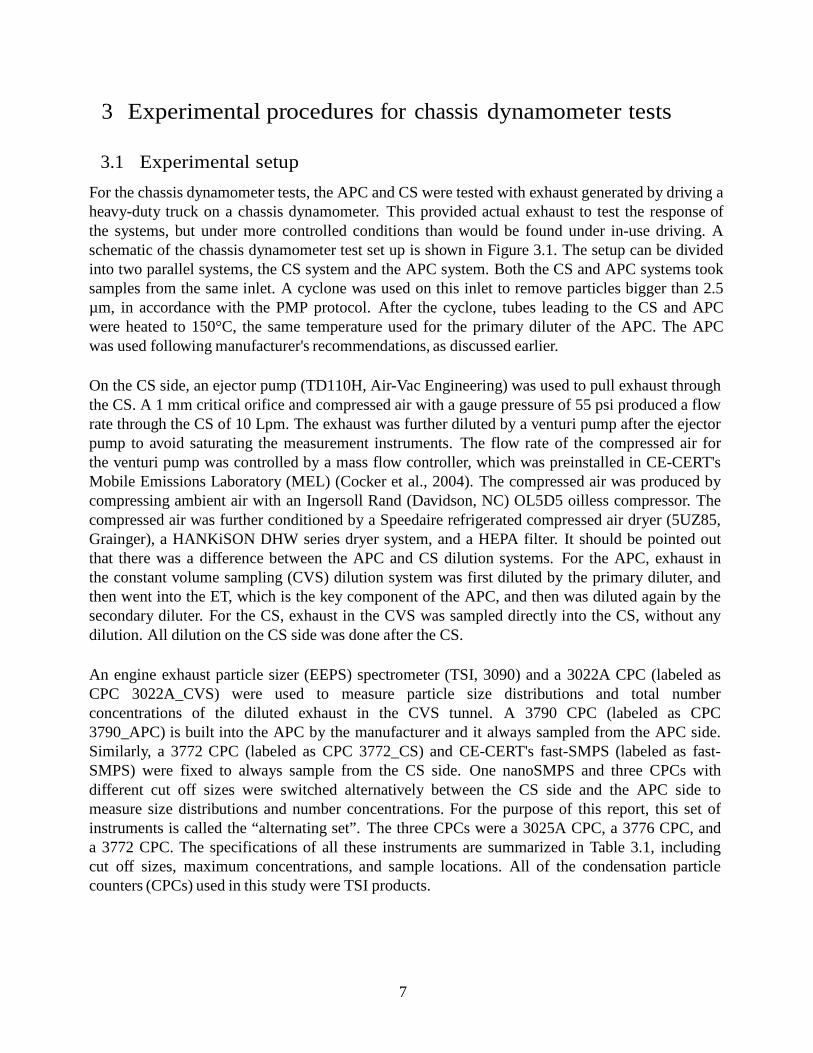
3.1 Experimental setup For the chassis dynamometer tests, the APC and CS were tested with exhaust generated by driving a heavy-duty truck on a chassis dynamometer. This provided actual exhaust to test the response of the systems, but under more controlled conditions than would be found under in-use driving. A schematic of the chassis dynamometer test set up is shown in Figure 3.1. The setup can be divided into two parallel systems, the CS system and the APC system. Both the CS and APC systems took samples from the same inlet. A cyclone was used on this inlet to remove particles bigger than 2.5 µm, in accordance with the PMP protocol. After the cyclone, tubes leading to the CS and APC were heated to 150°C, the same temperature used for the primary diluter of the APC. The APC was used following manufacturer's recommendations, as discussed earlier.
On the CS side, an ejector pump (TD110H, Air-Vac Engineering) was used to pull exhaust through the CS. A 1 mm critical orifice and compressed air with a gauge pressure of 55 psi produced a flow rate through the CS of 10 Lpm. The exhaust was further diluted by a venturi pump after the ejector pump to avoid saturating the measurement instruments. The flow rate of the compressed air for the venturi pump was controlled by a mass flow controller, which was preinstalled in CE-CERT's Mobile Emissions Laboratory (MEL) (Cocker et al., 2004). The compressed air was produced by compressing ambient air with an Ingersoll Rand (Davidson, NC) OL5D5 oilless compressor. The compressed air was further conditioned by a Speedaire refrigerated compressed air dryer (5UZ85, Grainger), a HANKiSON DHW series dryer system, and a HEPA filter. It should be pointed out that there was a difference between the APC and CS dilution systems. For the APC, exhaust in the constant volume sampling (CVS) dilution system was first diluted by the primary diluter, and then went into the ET, which is the key component of the APC, and then was diluted again by the secondary diluter. For the CS, exhaust in the CVS was sampled directly into the CS, without any dilution. All dilution on the CS side was done after the CS.
An engine exhaust particle sizer (EEPS) spectrometer (TSI, 3090) and a 3022A CPC (labeled as CPC 3022A_CVS) were used to measure particle size distributions and total number concentrations of the diluted exhaust in the CVS tunnel. A 3790 CPC (labeled as CPC 3790_APC) is built into the APC by the manufacturer and it always sampled from the APC side. Similarly, a 3772 CPC (labeled as CPC 3772_CS) and CE-CERT's fast-SMPS (labeled as fast-SMPS) were fixed to always sample from the CS side. One nanoSMPS and three CPCs with different cut off sizes were switched alternatively between the CS side and the APC side to measure size distributions and number concentrations. For the purpose of this report, this set of instruments is called the “alternating set”. The three CPCs were a 3025A CPC, a 3776 CPC, and a 3772 CPC. The specifications of all these instruments are summarized in Table 3.1, including cut off sizes, maximum concentrations, and sample locations. All of the condensation particle counters (CPCs) used in this study were TSI products.

8
Figure 3.1: Schematic of chassis dynamometer test setup To minimize the effects of diffusion losses on the comparison between systems, efforts were made to equalize the diffusion losses among all the instruments. The EEPS and CPC 3022A_CVS shared one sample line and the split point was connected as close to the instrument’s inlets as possible. The same plumbing configuration was applied to the CPC 3772_CS and fast-SMPS. A stainless steel manifold with six equal distance outlets was used in connecting the alternating set of instruments, so that the CPC 3776 and CPC 3025A had the same sample line lengths and flow rates. As mentioned earlier, the outlet flow rate of the APC was 8.5 Lpm, which was also the flow rate passing through the manifold. The flow rate through the manifold was controlled to 8.5 Lpm on both the APC and CS sides, which is the same as the outlet flow rate of the APC. For the CS, which uses a flow rate of 10 Lpm, 1.5 Lpm was vented to bring the flow rate through the manifold down to 8.5 Lpm.
3.2 Test vehicles, fuels, lubricants The vehicle and aftertreatment system used for the chassis dynamometer tests were the same as those used for the on-road test in CARB/UCR's previous study (Johnson et al., 2009). It was a 14.6 liter, 2000 Caterpillar C-15 engine equipped, Freightliner class 8 truck. A Johnson Matthey continuously regenerating trap (CRT™) was installed on the vehicle. The CRT™ is a passive DPF system that had previously been shown to provide sufficient levels of particles over driving conditions similar to those used in this experiment (Johnson et al., 2009). The truck was tested at a load of 65,000 lbs, which corresponds to the same load as for the on-road testing. The truck had a mileage of 41,442 miles at the beginning of the testing. CARB Ultra Low Sulfur Diesel (ULSD) fuel (S = 8 ppmw) and standard lubricating oil with sulfur level of 0.29% were used.
9
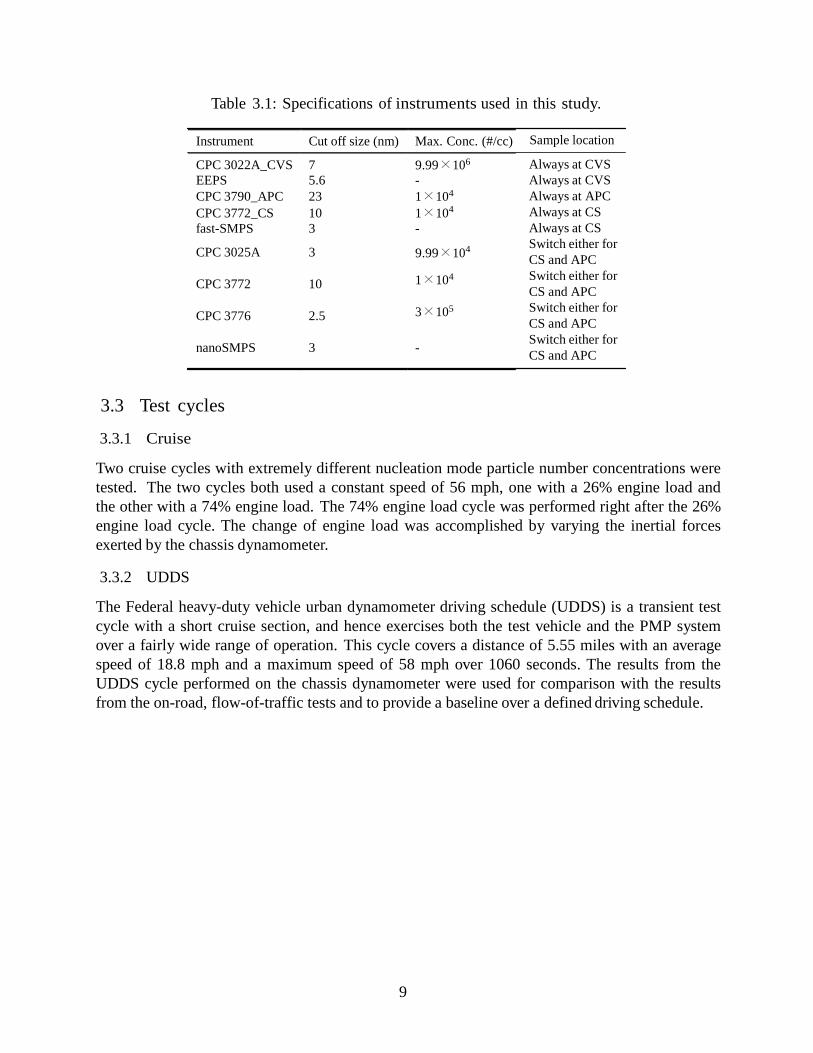
Instrument Cut off size (nm) Max. Conc. (#/cc) CPC 3022A_CVS 7 9.99 × 10⁶ EEPS 5.6 - CPC 3790_APC 23 1 × 10⁴ CPC 3772_CS 10 1 × 10⁴ fast-SMPS 3 - CPC 3025A 3 9.99 × 10⁴
CPC 3772 10 1 × 10⁴
CPC 3776 2.5 3 × 10⁵
nanoSMPS 3 -
Table 3.1: Specifications of instruments used in this study.
Sample location
Always at CVS Always at CVS Always at APC Always at CS Always at CS Switch either for CS and APC Switch either for CS and APC Switch either for CS and APC Switch either for CS and APC
3.3 Test cycles
3.3.1 Cruise Two cruise cycles with extremely different nucleation mode particle number concentrations were tested. The two cycles both used a constant speed of 56 mph, one with a 26% engine load and the other with a 74% engine load. The 74% engine load cycle was performed right after the 26% engine load cycle. The change of engine load was accomplished by varying the inertial forces exerted by the chassis dynamometer.
3.3.2 UDDS
The Federal heavy-duty vehicle urban dynamometer driving schedule (UDDS) is a transient test cycle with a short cruise section, and hence exercises both the test vehicle and the PMP system over a fairly wide range of operation. This cycle covers a distance of 5.55 miles with an average speed of 18.8 mph and a maximum speed of 58 mph over 1060 seconds. The results from the UDDS cycle performed on the chassis dynamometer were used for comparison with the results from the on-road, flow-of-traffic tests and to provide a baseline over a defined driving schedule.

10
4 Experimental procedures for on-road tests
4.1 Experimental setup The experimental setup is similar to that of the chassis dynamometer test, as shown in Figure 4.1.
4.2 Test vehicles, fuels, lubricants
The test vehicles, fuels, and lubricants used in the on-road test were same as those used for the chassis dynamometer test. The MEL trailer and truck combined have a weight of approximately 65,000 lbs, including all emission measuring instruments. This served as the load for the on-road testing.
4.3 Test routes The on-road flow-of-traffic tests were performed by driving the CE-CERT's MEL at 45 to 70 miles per hour (mph) on the U.S. Interstate-10 (I-10) freeway near Palm Springs, California at flow-of- traffic conditions (Figure 4.2). The driving route consisted of four distinct phases, with average engine loads ranging from 20 to 80%. Phases 1 and 2 were east bound on the I-10, which was mostly uphill providing high engine loads. The overall road grades of phases 1 and 2 are about 2.2 and 1%, respectively, which are calculated as the ratio of rise to run for each phase. Phases 3 and 4 were west bound on the I-10, which was mostly downhill providing light engine loads, and were the return trips corresponding to phases 2 and 1, respectively. The overall road grades of phases 3 and 4 were about -1 and -2.2%, respectively. As shown in Figure 4.2, phase 1 began at point A, where the MEL was accelerated to above 45 mph after it was driven on to the freeway via the ramp at point E. Phase 2 began at point B right after phase 1 ended. The end location of phase 2 was at point C, before the MEL went off-ramp. After being turned around at point D, the MEL was accelerated to above 45 mph, and then phase 3 began at the same location where phase 2 ended, point C. Following phase 3, phase 4 began at the same location where phase 1 ended, point B. Phase 4 ended at point A, the same location where phase 1 began. After the ending of phase 4, the MEL was turned around at point E to start another repeat. The on-road flow of traffic test was repeated 4 times.
4.4 PM emissions calculation
There were no stops between different phases to keep the on-road flow-of-traffic driving continuous, as discussed in the previous section, Thus, only one filter sample was taken for each on-road driving test (i.e., including phases 1, 2, 3, and 4). In order to compare PM emissions for different phases, PM emissions were calculated from the EEPS particle size distributions measured in the CVS, using the Integrated Particle Size Distribution (IPSD) method. The IPSD method was introduced by Liu et al. (2009), who showed good agreement between the IPSD and gravimetric

11
Figure 4.1: Schematic of experimental setup for the on-road test. filter sample measurements. The IPSD calculates total particle mass from measured particle size distributions using Equation 4.1.
ii
ipieffIPSD n
DM ⋅
⋅⋅= ∑
3,
, 234πρ (4.1)
where MIPSD is the total suspended PM, i is the particle size channel, ρeff ,i the effective density of particles falling in the size channel i, Dp,i is the mid-particle diameter of the size channel i, and ni is the total number of particles in size channel i.
The effective density correlation for the accumulation mode (soot) particles was adopted from Maricq and Xu (2004) and is defined in Equation 4.2.
3
0
,0,
−
⋅=
fd
ep
ipieff D
Dρρ (4.2)
where ρ0 is the primary particle density, Dp0e is the effective primary particle diameter, and df is the fractal dimension. Values of ρ0, Dp0e, and df were 2 g/cm3, 16 nm, and 2.35, respectively. It is worth noting that these values are more appropriate for converting SMPS measured particle size distributions into particle mass. Due to the difference in the inversion algorithm new values need to be obtained to better convert EEPS measured particle size distribution into particle mass, which is beyond the scope of this study. The accumulation mode particles were chosen to be particles larger than 30 nm, which is the cut point between the nucleation mode and accumulation mode defined by Kittelson et al. (2002). For the nucleation mode particles, a density of 1.46 g/cm3 was used (Zheng et al., 2011), assuming they are composed of mostly spherical hydrated sulfuric acid at an ambient relative humidity (25±3%) and temperature (33±1ºC).

12
Figure 4.2: Map and elevation variation of the on-road test

13
5 Laboratory tests results The laboratory experiments are an important part of this study, because they allow the formation process of sub-23 nm particle to be investigated using model aerosols under well-controlled conditions. This provides an important link to the vehicle exhaust testing with the chassis dynamometer and on-road flow-of-traffic testing portions in this study, and to the on-road testing in our previous study (Johnson et al., 2009), both of which showed that a significant fraction of the particles downstream of the PMP were in the sub-23 nm size range.
Figure 5.1: Particle size distributions from the laboratory test using mixture of sulfuric acid (H2SO4) and tetracontane (C40 n-alkane).
The number concentrations with 95% confidence limits for all the laboratory tests are summarized in Table 5.1. Total particle number concentrations were obtained by integrating the particle size distributions overall size bins. The size ranges were 3–70 nm and 7–191 nm for nanoSMPS and SMPS, respectively. For all the tests, the upstream aerosol mass concentrations were on the order of 100 µg/m3, assuming a particle density of 1 g/cm3. The upstream particle size distributions had peaks around 15, 60, and 40 nm, respectively, for aerosols composed of pure sulfuric acid, pure tetracosane, and the mixture of sulfuric acid and tetracosane. Particle size distributions for the APC-CS test using a mixture of sulfuric acid and tetracontane are also shown in Figure 5.1.
14
Background concentrations for the laboratory test were checked by turning the heater off and measuring the particle size distributions. No particles were seen under this condition for either the CS or APC-CS configurations.
When aerosol composed of pure sulfuric acid was used, both the APC and CS removed more than 99.9% particles by number concentration. When using aerosols composed of pure tetracosane, the APC and CS removed 98.9 and 99.9% particles, respectively. When aerosol composed of a mixture of sulfuric acid and tetracosane was used, the APC and CS removed 99.8 and 99.4% particles, respectively. For the APC-CS test, no particles were seen downstream of the APC-CS when an aerosol composed of pure sulfuric acid or pure tetracosane was used. When using aerosol composed of a mixture of sulfuric acid and tetracosane for the APC-CS test, a small number of particles were found downstream of both the APC and the APC-CS. As discussed above, the APC removes 99.8% of these particles. Of the remaining 0.2% that is then put through the CS, 14.2%, on a number concentration basis, were also observed downstream of the CS or APC-CS combination. This suggested that at least 14.2% of those particles downstream of the APC were non-volatile for the following reasons. First, the concentration of volatile material in the gas phase downstream of the APC was greatly reduced by dilution. Secondly, volatile particles that survive the APC will be reduced in size and easier to evaporate than the upstream particles. Thirdly, the CS has been shown to remove volatile materials effectively even with high inlet concentrations (Swanson and Kittelson, 2010a). Finally, the penetration of solid particles through the CS is less than 100%, so that if 14.2% of the particles penetrate, the actual solid fraction must be greater than that. The remaining 85.8% of the particles downstream of the APC, were likely predominately volatile, and could be due to renucleation of volatile particles in the APC.
The APC-CS test was also carried out using an aerosol composed of a mixture of sulfuric acid and tetracontane. Like the mixture of sulfuric acid and tetracosane test, the APC removed nearly all of the particles, in this case 99.4%. Particles exiting the APC were then fed into the CS and of these, 12.4% penetrated through the CS, indicating at least 12.4% of those particles exiting the APC were non-volatile. The fact that non-volatile particles were observed downstream of the APC when aerosols composed of mixtures of sulfuric acid and hydrocarbons, which are both volatile, were used suggests that non-volatile particles were formed in the APC from volatile species. This result was similar to what Swanson and Kittelson (2010a) reported in their thermal denuder and CS study, where they found solid particles were formed in the thermal denuder from sulfuric acid and hydrocarbons. In our previous study (Johnson et al., 2009), the majority of particles downstream of the PMP were in the sub-23nm size range. Based on the operational definition of solid particles for the PMP method, this means the PMP method is not counting the majority of solid particles, which could be problematic. The laboratory tests show that solid particles are formed with mixtures of sulfuric acid and hydrocarbons that are likely found in real exhaust, but would not be characterized in the tetracontane only volatile removal efficiency tests that are currently in the PMP legislation (Giechaskiel et al., 2010b). The results from the lab experiments also showed that a majority

15
Table 1 Summary of laboratory tests results, particle number concentrations are shown with 95% confidence limits.
Aerosol Config.
Concentration (particles/cm3) Dilution ratio
Instrument Upstream
Downstream
APC
Downstream
CS
Downstream
APC+CS Primary Total
H2SO4 CS 3.4×10⁷±2.5×10⁵ - 2.3×10²±2.2×10² - - 1 SMPS
APC-CS 2.4×10⁷±2.3×10⁶ 1.9×10³±3.7×10³ - 0.0×100±0.0×100 50 500 SMPS
C24 CS 5.3×10⁶±3.4×10⁶ - 4.4×10³±3.8×10³ - - 1 SMPS
APC-CS 8.9×10⁵±5.4×10⁵ 1.3×10⁴±1.3×10⁴ - 0.0×100±0.0×100 50 500 SMPS
H2SO4
+ C24
CS 9.3×10⁶±3.1×10⁵ - 5.7×10⁴±3.0×10⁴ - - 1 SMPS
APC-CS 3.3×10⁷±7.9×10⁶ 2.5×10⁴±2.4×10⁴ - 9.2×10³±3.8×10³ 20 120 SMPS
APC-CS 2.6×10⁷±1.3×10⁷ 5.0×10⁴±1.8×10⁴ - 7.2×10³±3.9×10³ 20 120 nanoSMPS
H2SO4
+ C40 APC-CS 2.7×10⁷±2.4×10⁶ 1.5×10⁵±4.4×10⁴
- 1.9×10⁴±5.8×10³ 20 120 nanoSMPS

16
of sub-23 nm particles below the APC are likely re-nucleated semivolatile particles, with some non-volatile solid particles, based on the APC-CS study.
The nature of the solid particles found by using the CS to treat the aerosol downstream the APC is worth more discussion. The mechanism of this type of solid particle formation is not clear yet. It is known that n-alkanes, such as tetracontane and tetracosane, do not react well with sulfuric acid in gas phase (Burwell et al., 1954), but Swanson and Kittelson (2010a) have proposed such reactions to explain this type of solid particle formation. Another hypothesis is that n-alkanes were oxidized on the hot metal tube walls heterogeneously and then reacted with sulfuric acid to produce a non-volatile salt. More studies are needed to thoroughly understand the mechanism of particle formation in the ET of the APC.

17
6 Steady State chassis dynamometer test results This chapter discusses the results of the chassis dynamometer testing. Two cruise cycles with engine loads of 26 and 74%, respectively, were tested. Both cycles had a constant speed of 56 mph.
6.1 Particle Measurements from the CVS As the aerosol in the CVS was the source aerosol being fed into the APC and CS, it is important to characterize the CVS aerosol. Contour plots of particle size distributions in the CVS, as shown in Figure 6.1, showed a distinctive bimodal pattern of accumulation mode and nucleation mode particles for the 74% engine load condition. The number concentrations of both nucleation mode and accumulation mode particles were stable at the 74% engine load, while particle number concentrations were near the EEPS's detection limit for the 26% engine load. The observation of higher number concentrations of nucleation mode particles at the higher engine load is consistent with previous studies (Herner et al., 2011), which have shown the formation of nucleation mode particles for vehicles with aftertreatment is a strong function of temperature.
Figure 6.1: Contour plots of real-time particle size distributions measured by the EEPS in the CVS at the 74% engine load. It shows a distinctive bimodal pattern of the accumulation and nucleation mode particles. The number concentrations of both mode particles were stable during the test.

18
Figure 6.2: Total particle number concentrations in the CVS at the 74% engine load.
Figure 6.3: Total particle number concentrations in the CVS at the 26% engine load.
19
Total particle number concentrations in the CVS measured by the CPC 3022A and the EEPS are shown in Figure 6.2 for the 74% engine load. Since the EEPS and CPC 3022A have similar cut off sizes, 5.6 and 7 nm, similar total particle number concentrations were expected. The two instruments tracked closely up to about particles/cm3 4 x 10⁵ particles/c m3, but diverged above that concentration. Above 1 x 10⁴ particles/cm3, the CPC 3022A utilizes a photometric particle counting method that becomes increasingly non-linear as concentration increases. We attribute the discrepancy in particle concentrations above 4 x 10⁵ particles/cm3 to the fact that the CPC 3022A was not calibrated for these high concentrations before the test. Thus, the EEPS should be considered more accurate at the higher concentrations in Figure 6.2. Figure 6.3 shows particle concentrations at the 26% engine load. EEPS data is not shown, as the concentrations were near the detection limit. Particle concentrations at the 26% engine load were steady and lower by three orders of magnitude compared to 74% load.
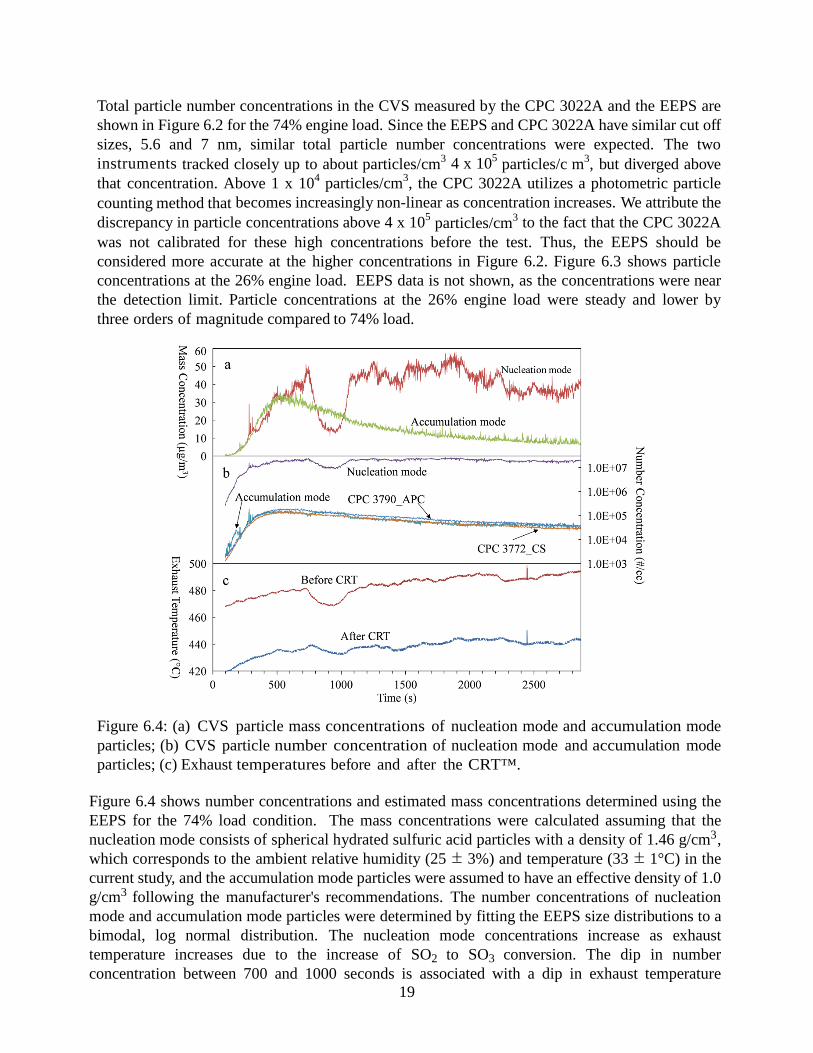
Figure 6.4: (a) CVS particle mass concentrations of nucleation mode and accumulation mode particles; (b) CVS particle number concentration of nucleation mode and accumulation mode particles; (c) Exhaust temperatures before and after the CRT™.
Figure 6.4 shows number concentrations and estimated mass concentrations determined using the EEPS for the 74% load condition. The mass concentrations were calculated assuming that the nucleation mode consists of spherical hydrated sulfuric acid particles with a density of 1.46 g/cm3, which corresponds to the ambient relative humidity (25 ± 3%) and temperature (33 ± 1°C) in the current study, and the accumulation mode particles were assumed to have an effective density of 1.0 g/cm3 following the manufacturer's recommendations. The number concentrations of nucleation mode and accumulation mode particles were determined by fitting the EEPS size distributions to a bimodal, log normal distribution. The nucleation mode concentrations increase as exhaust temperature increases due to the increase of SO2 to SO3 conversion. The dip in number concentration between 700 and 1000 seconds is associated with a dip in exhaust temperature

20
related to a change in engine coolant temperature, which is utilized as a heat exchanger for engine intake air. This only influences the nucleation mode, and does not impact the accumulation mode concentration. The decrease in accumulation mode particle concentrations as a function of time suggests the CRT™ is becoming more efficient as it loads with soot, although the exhaust temperatures are high enough for passive regeneration to be occurring simultaneously.
6.2 Particle number emissions under the APC and CS
Figures 6.5 and 6.6 show the number concentrations measured by various means plotted against time for the two engine operating conditions. Number concentrations have been corrected for dilution ratio (DR) to reflect the concentrations that would be seen in CVS. The APC DR used for the concentration correction was the ratio of the total sample plus dilution air mass flow rate to the sample flow rate based on the settings of the APC mass flow controller. The actual DR of the APC varied only about 1% due to flow and pressure variations during the test. The primary and secondary DRs of the APC were 50 and 10 for a total DR of 500, and 10 and 10 for a total DR of 100. Based on our preliminary tests, a DR of ~20 on the CS side was necessary to avoid saturating the particle counting instruments. The actual CS DR was determined by two independent methods, a flow rate measurement and CO2 measurement. These two methods agreed well, and the CS DR was monitored continuously during the test. It had an average value of 21, and the variations over a test were less than 1%. Therefore, the average value of 21 was used for all calculations. For both engine loads, the tests with the “alternating set” of instruments (i.e., the 3025A CPC, the 3776 CPC, the 3772 CPC, and the nanoSMPS) were performed in the following sequence; the APC with a DR of 500, the APC with a DR of 100, and the CS. At the 26% engine load, this test sequence was conducted twice and then the instruments were directly connected to the CVS. At the 74% engine load, this test sequence was conducted three times without directly connecting to the CVS. The direct connection to the CVS was done for the 26% engine load, but not for the 74% engine load, because the particle number concentrations were much lower at the 26% engine load. When the CPCs were switched to the CS side or the CVS, the APC DR was set at 500. As discussed previously, the CPC 3772_CS and the CPC 3790_APC were dedicated to the CS and APC, respectively. Figure 6.5 shows the results for the 74% load condition. The load was increased rapidly to 74% after the vehicle was started. Number concentrations rise rapidly after the load is increased as the engine and CRT™ adjust to the new operating condition. Several things are happening simultaneously: engine out emissions are adjusting to the new operating condition, and the CRT™ is simultaneously loading and undergoing passive regeneration. After the operation is stabilized at the 74% engine load, the exhaust temperatures are well over 400°C. The catalysts used for passive regeneration not only oxidize NO to NO2 but also oxidize SO2 formed from sulfur in the fuel or lubricating oil to SO3, especially at temperatures above 350°C (Cooper and Thoss, 1989). The SO3 emissions are likely associated with the increase in nucleation mode particles seen in Figure 6.4. “Solid” particle emissions measured with the CPC 3790_APC and CPC 3772_CS follow a smooth trend of increases and decreases very much like that of accumulation mode particles in Figure 6.4b.
21
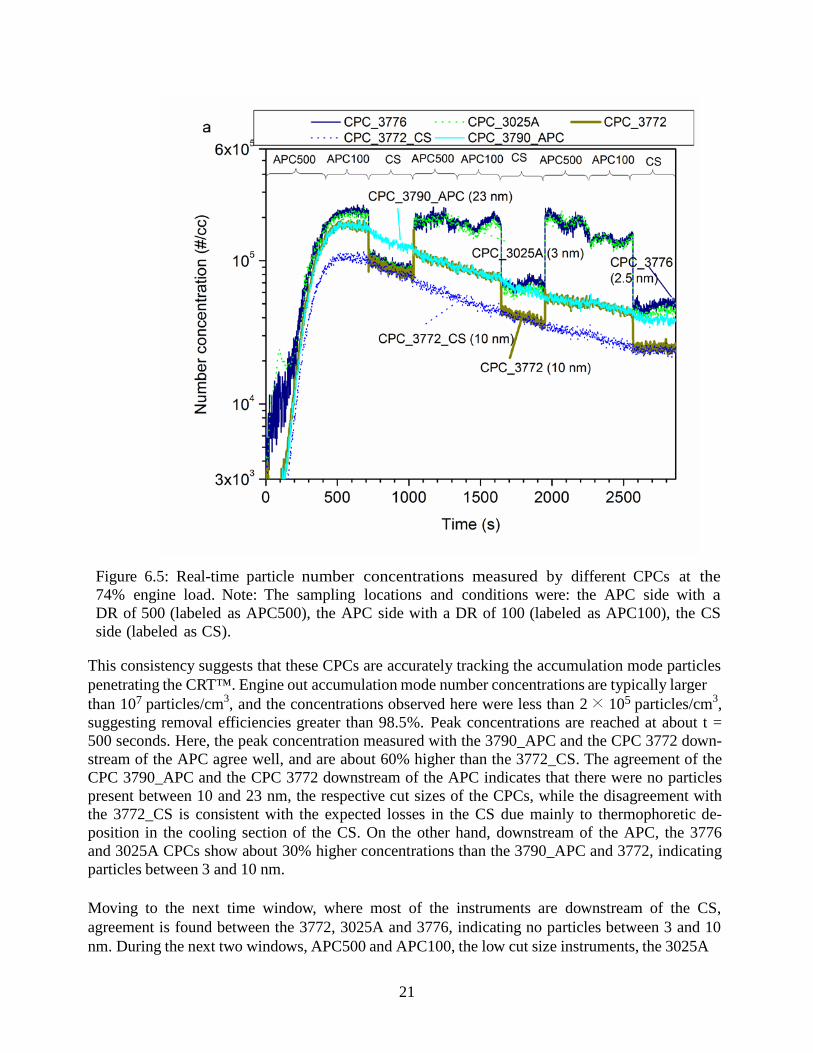
Figure 6.5: Real-time particle number concentrations measured by different CPCs at the 74% engine load. Note: The sampling locations and conditions were: the APC side with a DR of 500 (labeled as APC500), the APC side with a DR of 100 (labeled as APC100), the CS side (labeled as CS).
This consistency suggests that these CPCs are accurately tracking the accumulation mode particles penetrating the CRT™. Engine out accumulation mode number concentrations are typically larger than 107 particles/cm3, and the concentrations observed here were less than 2 × 10⁵ particles/cm3, suggesting removal efficiencies greater than 98.5%. Peak concentrations are reached at about t = 500 seconds. Here, the peak concentration measured with the 3790_APC and the CPC 3772 down- stream of the APC agree well, and are about 60% higher than the 3772_CS. The agreement of the CPC 3790_APC and the CPC 3772 downstream of the APC indicates that there were no particles present between 10 and 23 nm, the respective cut sizes of the CPCs, while the disagreement with the 3772_CS is consistent with the expected losses in the CS due mainly to thermophoretic de- position in the cooling section of the CS. On the other hand, downstream of the APC, the 3776 and 3025A CPCs show about 30% higher concentrations than the 3790_APC and 3772, indicating particles between 3 and 10 nm.
Moving to the next time window, where most of the instruments are downstream of the CS, agreement is found between the 3772, 3025A and 3776, indicating no particles between 3 and 10 nm. During the next two windows, APC500 and APC100, the low cut size instruments, the 3025A

22
and 3776, essentially agree as do the higher cut size instruments, the 3790 and 3772, but the ratio of low cut to high cut number count grows. The agreement between the 3790 and 3772 suggests that there are few particles between 10 and 23 nm so that the increasing ratio is primarily due to relatively more particles between 3 and 10 nm. During the next window when the instruments are switched downstream of the CS, particles below 10 nm begin to appear, as the 3025A and 3776 show higher concentrations than the 3772. The trend of increasing fractions of particles below 10 nm continues both downstream of the APC and CS in subsequent time windows. The last time windows downstream of the APC and CS show, respectively, 70 and 50% of the observed particles between 3 and 10 nm. It is not likely that these particles represent penetration through the CRT™. The most penetrating particle size for typical filters ranges from 100 to 300 nm, with particles either larger or smaller than that size removed more efficiently. In the case of sub-23 nm particles, although there is some evidence that under some conditions tiny solid nanoparticles are emitted, there is no evidence in the literature of formation of high enough concentrations of these particles to offset the decreased penetration through the DPF. The only exception to this might be the case when an excess of a metallic fuel additive, like a fuel borne catalyst, is used. Thus, it is extremely unlikely that these particles are due to penetration of solid particles through the DPF. Rather they are likely formed by renucleation downstream of the APC and CS. The question is why the fraction of these particles increases during the run. The accumulation mode particle concentrations, and corresponding solid particle concentrations, decrease continuously after 500 s, while the fractions below 10 nm increase, although the absolute concentration between 3 and 10 nm changes little. These particles could be formed by nucleation of sulfuric acid. In which case, it would require conversion of only 0.02% of the sulfur in the fuel to account for all the particles observed between 3 and 10 nm below the APC, even making the worst assumption that they are all 10 nm in diameter. Figure 6.6 shows the results of particle number measurements at the 26% load condition. Here, particle number concentrations are much lower than for the higher load condition and the structure is even more complex. As with the high load, measurements are made below the APC at two overall dilution ratios, 100 and 500. The first time window is APC500, i.e., instruments below the APC with a dilution ratio of 500. Here we see the 3772 and 3790 in good agreement but the 3025A and 3776 read more than 15 and 6 times higher, respectively, indicating that most of the particles are below 10 nm. All these instruments have been calibrated and agree well for calibration aerosols, so the difference between the 3025A and 3776 is likely due to slight differences in the lower cutoff behavior of the two instruments. The cutoff diameter of a CPC is usually specified by D50, which is the particle diameter at which the counting efficiency is 50%. The CPC 3025A and 3776 have D50s of 3.0 and 2.5 nm, respectively. Although it would be expected that the 3776 would read higher than the 3025A, actual instrument cut points may vary from manufacturers' specifications, especially at the extremes of the operating range. In any case, these differences suggest that most of the particles are below the lower counting limits of these instruments, about 3 nm. The large swings in concentrations seen with the 3025A and 3776 are associated with temperature swings in the evaporation tube. This is discussed later in this chapter of the report. The results are even more difficult to understand when the APC dilution ratio is reduced to 100. Here, we see a relatively sharp drop in the CPC 3776 and CPC 3025A counts when normalized to

23
Figure 6.6: Real-time particle number concentrations measured by different CPCs at the 26% engine load. Note: The sampling locations and conditions were: the APC side with a DR of 500 (labeled as APC500), the APC side with a DR of 100 (labeled as APC100), the CS side (labeled as CS), and the CVS directly (labeled as CVS).
the CVS concentrations. This can probably be attributed to differences in nucleation between the two different dilution ratios. In this regard, it should be noted that the particle concentrations in the evaporation tube are a factor of 5 higher at the lower dilution ratio than the higher dilution ratio. It would be expected that the lower dilution ratio would lead to more particle nucleation and growth downstream of the evaporation tube, but this is only partly true. Actually, there is apparently less nucleation as indicated by the reduced concentrations for the 3025A and 3776, but more growth as indicated by agreement between the 3025A and 3776, showing that the particles have grown to well beyond 3 nm, and the increase in the particle concentration indicated by the 3772 and 3790, showing that some particles have even grown above 23 nm. One might argue that the combination of a lower concentration of very small particles and overall growth is due to coagulation, but the low concentration in the evaporation tube, a few hundred particles/cm3, makes this unlikely.
In the first time window, comparing the CPCs 3025A, 3776, and 3772 below the CS, the 3025A and 3776 are about 20% higher than the 3772 and 3772_CS, indicating some particle formation between 3 and 10 nm, while the 3772s below the CS are about 40% lower than the 3790_APC. This is the difference expected from thermophoretic losses in the CS. If the 3772s were less than 40% lower than the 3790, it would suggest particles between 10 and 23 nm below the CS, but this is
24
not the case. The same trends continue for the rest of the run until the last condition, where all the instruments, except the 3772_CS and the 3790_APC, are connected directly to the dilution tunnel, so that all particles, both solid and volatile, are being counted. Under these conditions, the 3025A and 3776 are in good agreement, suggesting that most of the particles are above 3 nm. These two instruments also show about 7 times higher concentrations than the 3772, suggesting that most of the particles are between 3 and 10 nm. The average concentration measured by the 3025A during the last APC500 time window case (1200–1500 second) is more than 5 times higher than for the same CPC sampling directly from the CVS. This is further evidence significant creation of sub 10 nm particles below the APC. The results for the 26% load condition are quite surprising, and are hard to understand in terms of aerosol physics and chemistry. The concentration of sulfuric acid downstream of the CRT™ would be expected to be lower because of lower exhaust temperatures, and thus less oxidation of SO2 to SO3. Fuel is being burned at a lower rate so the concentration of SO2 should also be lower. All of this should lead to a lower driving force for the nucleation of sulfuric acid. On the other hand, the total “solid” particle concentrations are also very low, about one and one half orders of magnitude lower than for the high load case, so that there is less surface area available to suppress nucleation by adsorption. Other species may be involved in the nucleation process. Arnold (2006) has shown that nucleation downstream of catalyzed DPFs is sometimes associated with organic acids. Of course questions could be raised about the accuracy of the dilution ratio measurements and the calibration of the CPCs at very low concentrations. In most cases, particle concentrations downstream of the APC and CS were below 100 particles/cm3, and they were often below 10 particles/cm3. However, great care was taken in calibrations of the CPCs and in dilution ratio determinations. Clearly, more work needs to be done to understand PMP type measurements for heavy-duty diesel engines. The results indicate great care should be taken in interpreting the results of so-called solid particle measurements, especially if the measurements are to be extended to sizes below 23 nm.
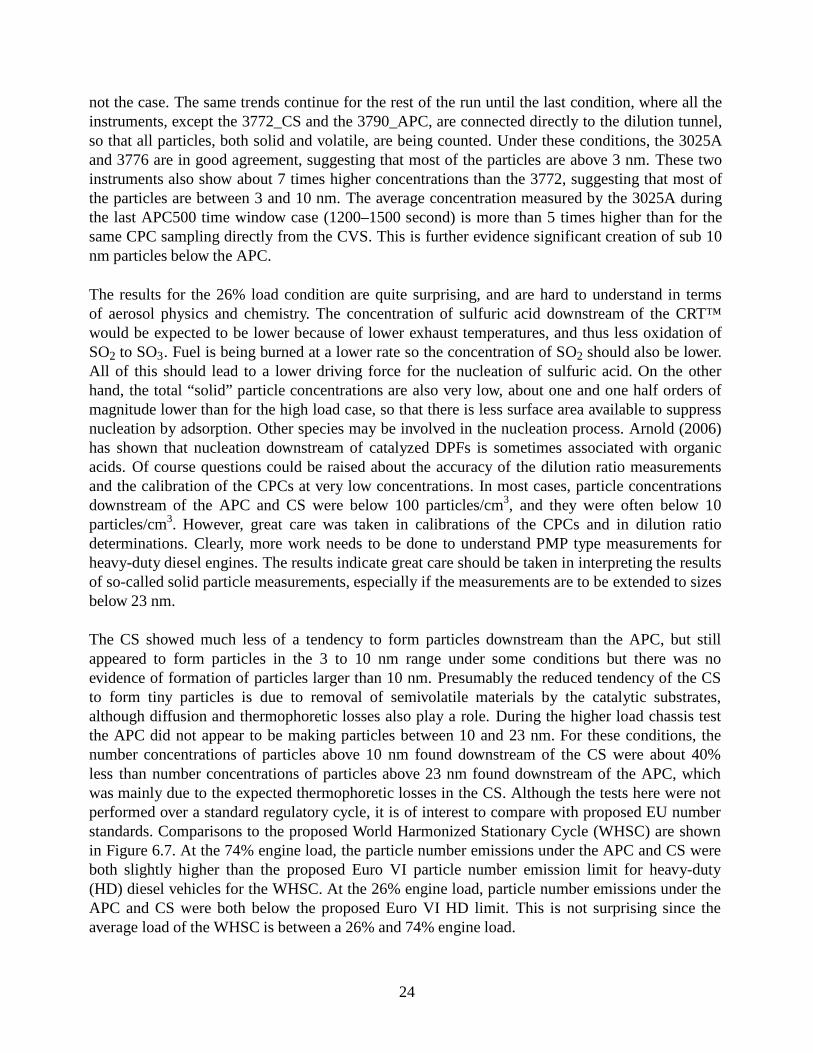
The CS showed much less of a tendency to form particles downstream than the APC, but still appeared to form particles in the 3 to 10 nm range under some conditions but there was no evidence of formation of particles larger than 10 nm. Presumably the reduced tendency of the CS to form tiny particles is due to removal of semivolatile materials by the catalytic substrates, although diffusion and thermophoretic losses also play a role. During the higher load chassis test the APC did not appear to be making particles between 10 and 23 nm. For these conditions, the number concentrations of particles above 10 nm found downstream of the CS were about 40% less than number concentrations of particles above 23 nm found downstream of the APC, which was mainly due to the expected thermophoretic losses in the CS. Although the tests here were not performed over a standard regulatory cycle, it is of interest to compare with proposed EU number standards. Comparisons to the proposed World Harmonized Stationary Cycle (WHSC) are shown in Figure 6.7. At the 74% engine load, the particle number emissions under the APC and CS were both slightly higher than the proposed Euro VI particle number emission limit for heavy-duty (HD) diesel vehicles for the WHSC. At the 26% engine load, particle number emissions under the APC and CS were both below the proposed Euro VI HD limit. This is not surprising since the average load of the WHSC is between a 26% and 74% engine load.
25
Figure 6.7: Integrated particle number emissions for the chassis dynamometer test.
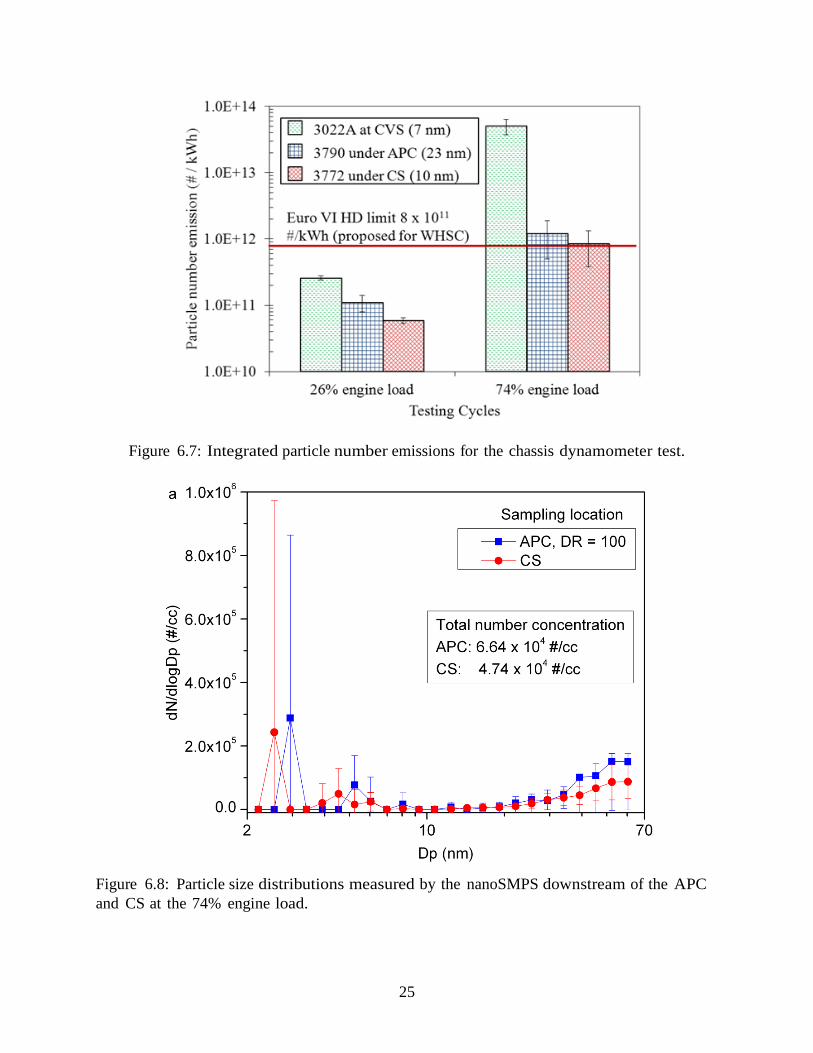
Figure 6.8: Particle size distributions measured by the nanoSMPS downstream of the APC and CS at the 74% engine load.
26
Figure 6.9: Particle size distributions measured by the nanoSMPS downstream of the APC and CS at the 26% engine load.
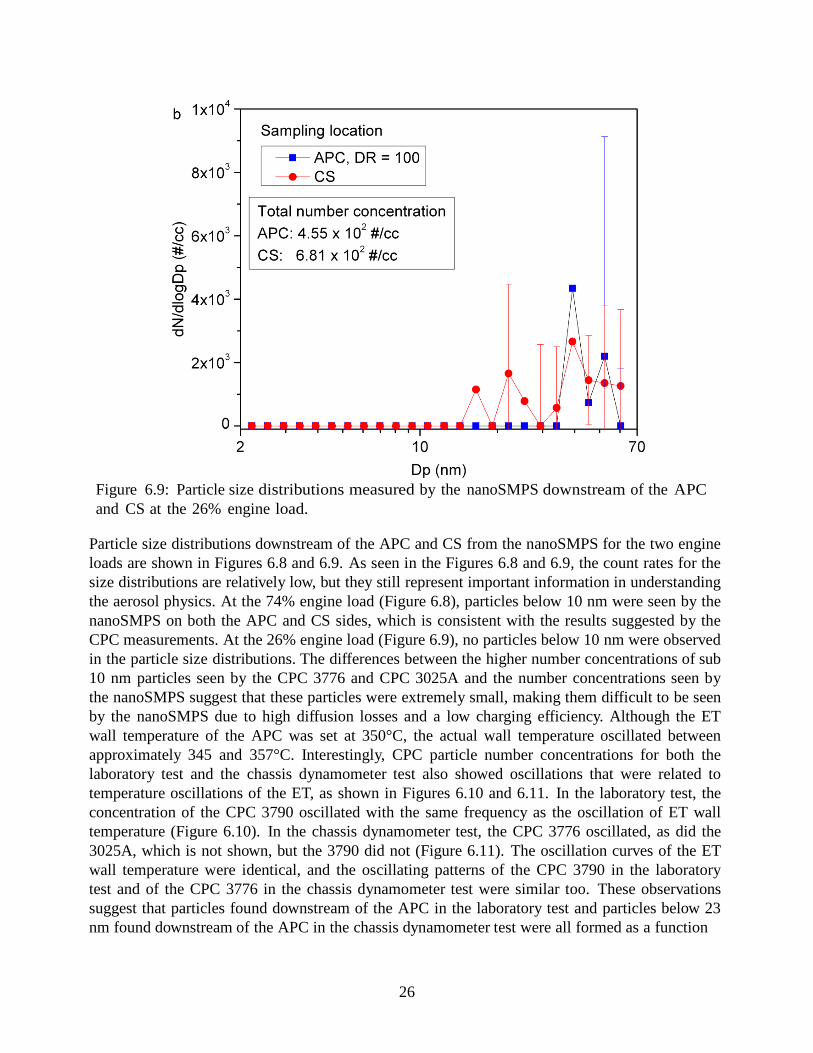
Particle size distributions downstream of the APC and CS from the nanoSMPS for the two engine loads are shown in Figures 6.8 and 6.9. As seen in the Figures 6.8 and 6.9, the count rates for the size distributions are relatively low, but they still represent important information in understanding the aerosol physics. At the 74% engine load (Figure 6.8), particles below 10 nm were seen by the nanoSMPS on both the APC and CS sides, which is consistent with the results suggested by the CPC measurements. At the 26% engine load (Figure 6.9), no particles below 10 nm were observed in the particle size distributions. The differences between the higher number concentrations of sub 10 nm particles seen by the CPC 3776 and CPC 3025A and the number concentrations seen by the nanoSMPS suggest that these particles were extremely small, making them difficult to be seen by the nanoSMPS due to high diffusion losses and a low charging efficiency. Although the ET wall temperature of the APC was set at 350°C, the actual wall temperature oscillated between approximately 345 and 357°C. Interestingly, CPC particle number concentrations for both the laboratory test and the chassis dynamometer test also showed oscillations that were related to temperature oscillations of the ET, as shown in Figures 6.10 and 6.11. In the laboratory test, the concentration of the CPC 3790 oscillated with the same frequency as the oscillation of ET wall temperature (Figure 6.10). In the chassis dynamometer test, the CPC 3776 oscillated, as did the 3025A, which is not shown, but the 3790 did not (Figure 6.11). The oscillation curves of the ET wall temperature were identical, and the oscillating patterns of the CPC 3790 in the laboratory test and of the CPC 3776 in the chassis dynamometer test were similar too. These observations suggest that particles found downstream of the APC in the laboratory test and particles below 23 nm found downstream of the APC in the chassis dynamometer test were all formed as a function

27
Figure 6.10: Real-time ET wall temperature and CPC concentrations for the laboratory test using aerosol composed of mixture of sulfuric acid and tetracontane. Wide solid lines are the polynomial fits to the individual curves. of ET temperature, through similar, if not the same, mechanisms. The difference in the CPC particle number concentrations at ET temperatures of 346 and 357°C is probably due to different supersaturation conditions at these two temperatures (Seinfeld and Pandis, 2006). The CPC 3790 did not oscillate in the chassis dynamometer test because it only measured solid particles above 23 nm, which were mostly accumulation mode soot particles that had passed through the CRT™ that were not influenced by the ET temperature. The number concentrations of accumulation mode particles are also shown in Figure 6.11 for comparison. The accumulation mode particle concentrations were determined by fitting the EEPS size distributions assuming lognormal bimodal size distribution. Although the aerosol mass concentration upstream the APC of the laboratory test was about 10 times higher than that of the chassis test, the number concentration measured by the CPC 3790 for the laboratory test was about 2 orders of magnitude lower than the number concentration measured by the CPC 3776 in the chassis test. This was because only a small portion of particles were measured by the CPC 3790 due to its large cut off size, i.e., the 3790 was only seeing the upper edge of the size distribution that was moving back and forth with temperature changes. The integrated nanoSMPS number concentration downstream the APC for the same test was about 2 orders of magnitude higher than the CPC 3790 concentration (Figure 5.1 and Table 5.1).

28
Figure 6.11: Real-time ET wall temperature and CPC concentrations for the chassis dynamometer test at the 74% engine load, time scale is the same as Figure 6.5. Wide solid lines are the polynomial fits to the individual curves.

29
7 On-road and UDDS chassis dynamometer test results
7.1 Real-time PN emissions PN emissions from the flow-of-traffic on-road test were compared with those from the UDDS test performed on a chassis dynamometer. Typical real-time PN concentrations downstream of the PMP system for the UDDS test are shown in Figure 7.1. Vehicle speed, engine load, and exhaust temperature are also plotted in Figure 7.1. The CPC 3772_10 tracked closely with the CPC 3790_23, indicating a negligible number of particles between 10 and 23 nm present downstream of the PMP system, consistent with the other parts of this study. The CPC 3776_2.5 concentrations were always higher than the concentrations of the other two CPCs, indicating the existence of sub 10 nm particles downstream of the PMP system. This is consistent with results from the steady state chassis tests.
Figure 7.1: Real-time PN concentrations during the UDDS test. When the concentrations of the two high cut-off diameter CPCs, the CPC 3772_10 and CPC 3790_23, were relatively high, the differences between the CPC 3776_2.5 and the high cut-off diameter CPCs were generally small. This is due to the competing process between the nucleation of volatile vapors to form new particles and the condensation of volatile vapors onto existing solid soot particles downstream of the PMP system. When more solid soot particles are available (as indicated by the relatively high concentrations of the CPC 3772_10 and CPC 3790_23), more condensation onto existing soot particles will occur, resulting in lower volatile vapor concentrations and hence less re-nucleated sub 10 nm particles (as indicated by the relatively small differences between the CPC 3776_2.5 concentrations and the CPC 3772_10 and CPC 3790_23 concentrations).
30
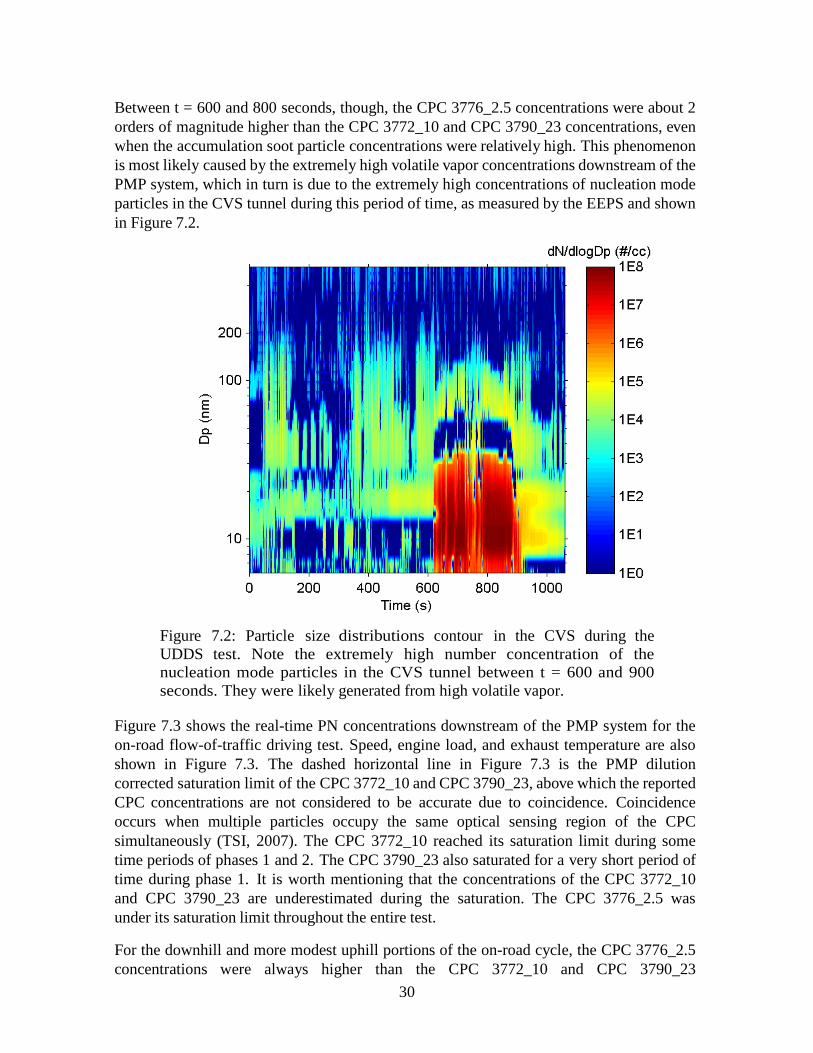
Between t = 600 and 800 seconds, though, the CPC 3776_2.5 concentrations were about 2 orders of magnitude higher than the CPC 3772_10 and CPC 3790_23 concentrations, even when the accumulation soot particle concentrations were relatively high. This phenomenon is most likely caused by the extremely high volatile vapor concentrations downstream of the PMP system, which in turn is due to the extremely high concentrations of nucleation mode particles in the CVS tunnel during this period of time, as measured by the EEPS and shown in Figure 7.2.
Figure 7.2: Particle size distributions contour in the CVS during the UDDS test. Note the extremely high number concentration of the nucleation mode particles in the CVS tunnel between t = 600 and 900 seconds. They were likely generated from high volatile vapor.
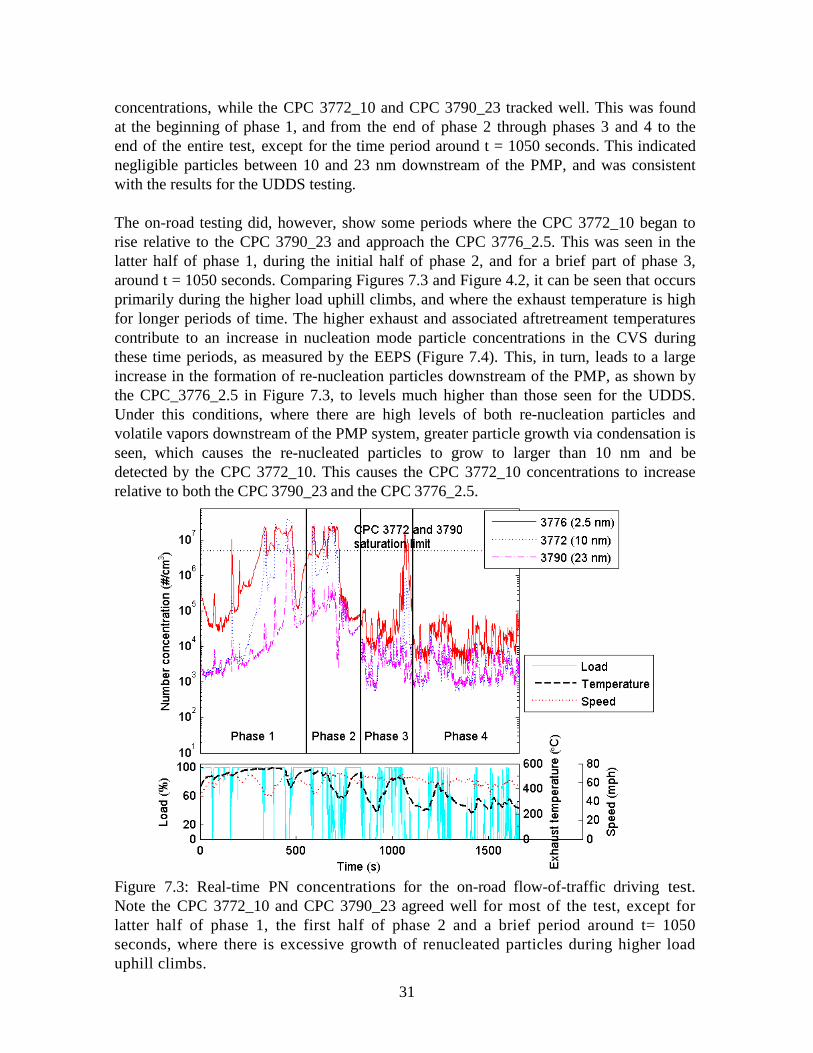
Figure 7.3 shows the real-time PN concentrations downstream of the PMP system for the on-road flow-of-traffic driving test. Speed, engine load, and exhaust temperature are also shown in Figure 7.3. The dashed horizontal line in Figure 7.3 is the PMP dilution corrected saturation limit of the CPC 3772_10 and CPC 3790_23, above which the reported CPC concentrations are not considered to be accurate due to coincidence. Coincidence occurs when multiple particles occupy the same optical sensing region of the CPC simultaneously (TSI, 2007). The CPC 3772_10 reached its saturation limit during some time periods of phases 1 and 2. The CPC 3790_23 also saturated for a very short period of time during phase 1. It is worth mentioning that the concentrations of the CPC 3772_10 and CPC 3790_23 are underestimated during the saturation. The CPC 3776_2.5 was under its saturation limit throughout the entire test. For the downhill and more modest uphill portions of the on-road cycle, the CPC 3776_2.5 concentrations were always higher than the CPC 3772_10 and CPC 3790_23
31
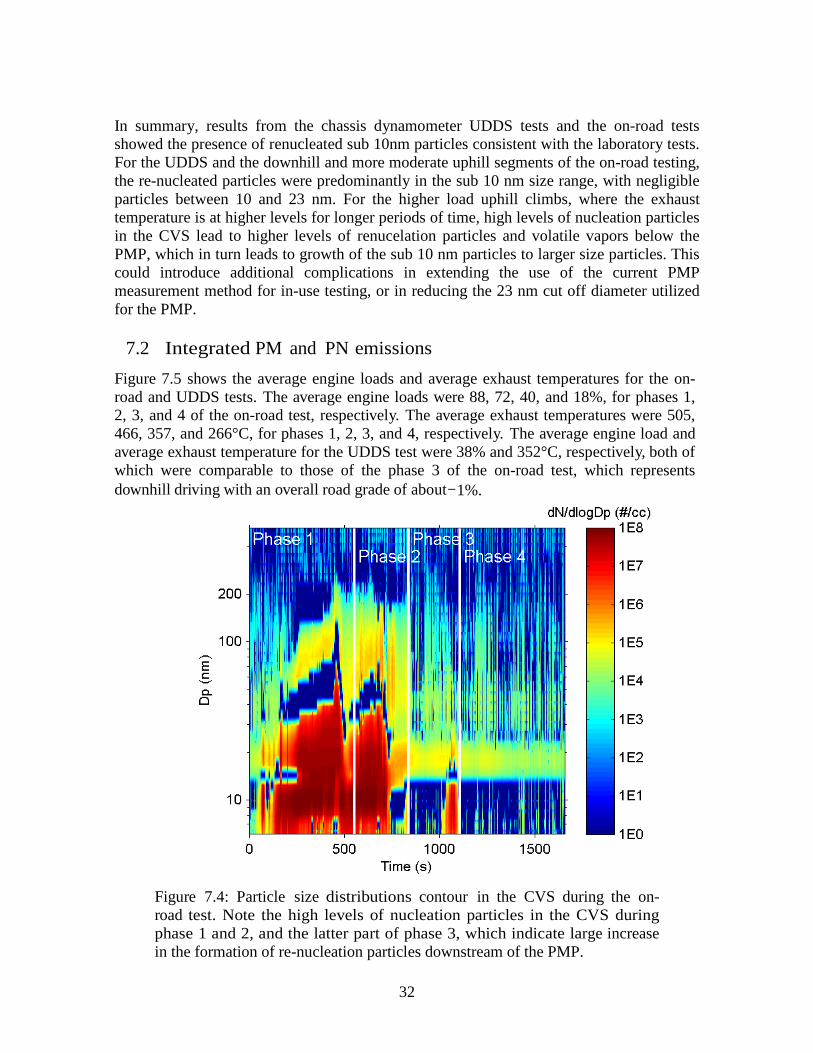
concentrations, while the CPC 3772_10 and CPC 3790_23 tracked well. This was found at the beginning of phase 1, and from the end of phase 2 through phases 3 and 4 to the end of the entire test, except for the time period around t = 1050 seconds. This indicated negligible particles between 10 and 23 nm downstream of the PMP, and was consistent with the results for the UDDS testing. The on-road testing did, however, show some periods where the CPC 3772_10 began to rise relative to the CPC 3790_23 and approach the CPC 3776_2.5. This was seen in the latter half of phase 1, during the initial half of phase 2, and for a brief part of phase 3, around t = 1050 seconds. Comparing Figures 7.3 and Figure 4.2, it can be seen that occurs primarily during the higher load uphill climbs, and where the exhaust temperature is high for longer periods of time. The higher exhaust and associated aftretreament temperatures contribute to an increase in nucleation mode particle concentrations in the CVS during these time periods, as measured by the EEPS (Figure 7.4). This, in turn, leads to a large increase in the formation of re-nucleation particles downstream of the PMP, as shown by the CPC_3776_2.5 in Figure 7.3, to levels much higher than those seen for the UDDS. Under this conditions, where there are high levels of both re-nucleation particles and volatile vapors downstream of the PMP system, greater particle growth via condensation is seen, which causes the re-nucleated particles to grow to larger than 10 nm and be detected by the CPC 3772_10. This causes the CPC 3772_10 concentrations to increase relative to both the CPC 3790_23 and the CPC 3776_2.5.
Figure 7.3: Real-time PN concentrations for the on-road flow-of-traffic driving test. Note the CPC 3772_10 and CPC 3790_23 agreed well for most of the test, except for latter half of phase 1, the first half of phase 2 and a brief period around t= 1050 seconds, where there is excessive growth of renucleated particles during higher load uphill climbs.
32
In summary, results from the chassis dynamometer UDDS tests and the on-road tests showed the presence of renucleated sub 10nm particles consistent with the laboratory tests. For the UDDS and the downhill and more moderate uphill segments of the on-road testing, the re-nucleated particles were predominantly in the sub 10 nm size range, with negligible particles between 10 and 23 nm. For the higher load uphill climbs, where the exhaust temperature is at higher levels for longer periods of time, high levels of nucleation particles in the CVS lead to higher levels of renucelation particles and volatile vapors below the PMP, which in turn leads to growth of the sub 10 nm particles to larger size particles. This could introduce additional complications in extending the use of the current PMP measurement method for in-use testing, or in reducing the 23 nm cut off diameter utilized for the PMP.
7.2 Integrated PM and PN emissions
Figure 7.5 shows the average engine loads and average exhaust temperatures for the on-road and UDDS tests. The average engine loads were 88, 72, 40, and 18%, for phases 1, 2, 3, and 4 of the on-road test, respectively. The average exhaust temperatures were 505, 466, 357, and 266°C, for phases 1, 2, 3, and 4, respectively. The average engine load and average exhaust temperature for the UDDS test were 38% and 352°C, respectively, both of which were comparable to those of the phase 3 of the on-road test, which represents downhill driving with an overall road grade of about-1%.
Figure 7.4: Particle size distributions contour in the CVS during the on-road test. Note the high levels of nucleation particles in the CVS during phase 1 and 2, and the latter part of phase 3, which indicate large increase in the formation of re-nucleation particles downstream of the PMP.
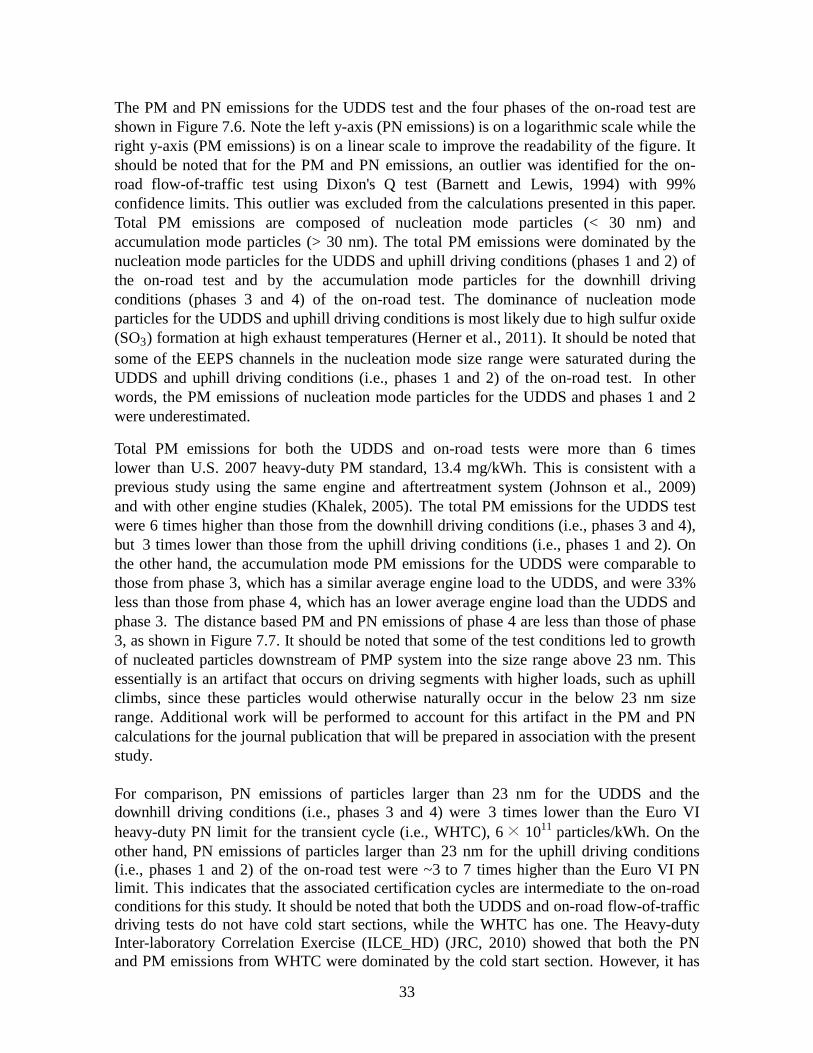
33
The PM and PN emissions for the UDDS test and the four phases of the on-road test are shown in Figure 7.6. Note the left y-axis (PN emissions) is on a logarithmic scale while the right y-axis (PM emissions) is on a linear scale to improve the readability of the figure. It should be noted that for the PM and PN emissions, an outlier was identified for the on-road flow-of-traffic test using Dixon's Q test (Barnett and Lewis, 1994) with 99% confidence limits. This outlier was excluded from the calculations presented in this paper. Total PM emissions are composed of nucleation mode particles (< 30 nm) and accumulation mode particles (> 30 nm). The total PM emissions were dominated by the nucleation mode particles for the UDDS and uphill driving conditions (phases 1 and 2) of the on-road test and by the accumulation mode particles for the downhill driving conditions (phases 3 and 4) of the on-road test. The dominance of nucleation mode particles for the UDDS and uphill driving conditions is most likely due to high sulfur oxide (SO3) formation at high exhaust temperatures (Herner et al., 2011). It should be noted that some of the EEPS channels in the nucleation mode size range were saturated during the UDDS and uphill driving conditions (i.e., phases 1 and 2) of the on-road test. In other words, the PM emissions of nucleation mode particles for the UDDS and phases 1 and 2 were underestimated. Total PM emissions for both the UDDS and on-road tests were more than 6 times lower than U.S. 2007 heavy-duty PM standard, 13.4 mg/kWh. This is consistent with a previous study using the same engine and aftertreatment system (Johnson et al., 2009) and with other engine studies (Khalek, 2005). The total PM emissions for the UDDS test were 6 times higher than those from the downhill driving conditions (i.e., phases 3 and 4), but 3 times lower than those from the uphill driving conditions (i.e., phases 1 and 2). On the other hand, the accumulation mode PM emissions for the UDDS were comparable to those from phase 3, which has a similar average engine load to the UDDS, and were 33% less than those from phase 4, which has an lower average engine load than the UDDS and phase 3. The distance based PM and PN emissions of phase 4 are less than those of phase 3, as shown in Figure 7.7. It should be noted that some of the test conditions led to growth of nucleated particles downstream of PMP system into the size range above 23 nm. This essentially is an artifact that occurs on driving segments with higher loads, such as uphill climbs, since these particles would otherwise naturally occur in the below 23 nm size range. Additional work will be performed to account for this artifact in the PM and PN calculations for the journal publication that will be prepared in association with the present study.
For comparison, PN emissions of particles larger than 23 nm for the UDDS and the downhill driving conditions (i.e., phases 3 and 4) were 3 times lower than the Euro VI heavy-duty PN limit for the transient cycle (i.e., WHTC), 6 × 10¹¹ particles/kWh. On the other hand, PN emissions of particles larger than 23 nm for the uphill driving conditions (i.e., phases 1 and 2) of the on-road test were ~3 to 7 times higher than the Euro VI PN limit. This indicates that the associated certification cycles are intermediate to the on-road conditions for this study. It should be noted that both the UDDS and on-road flow-of-traffic driving tests do not have cold start sections, while the WHTC has one. The Heavy-duty Inter-laboratory Correlation Exercise (ILCE_HD) (JRC, 2010) showed that both the PN and PM emissions from WHTC were dominated by the cold start section. However, it has

34
been suggested that the high emissions of cold start WHTC have an origin of the exhaust system instead of the engine itself (Giechaskiel et al., 2012). Similar to the accumulation mode PM emissions, PN emissions of particles larger than 23 nm for the UDDS (with the average engine load of 38%) were comparable in magnitude to those for phase 3 of the on-road test, and were 25% lower than those for phase 4 of the on-road test.
. Figure 7.5: Average engine loads and exhaust temperatures for the UDDS and on-road tests.

35
Figure 7.6: Integrated PM and PN emissions for the UDDS and on-road tests.
7.3 Test repeatability
Good repeatability is one of the necessary requirements for any regulatory measurement method. In Europe, repeatability and reproducibility have been the two main properties that both the PMP inter-laboratory correlation exercise and round robin test aimed to evaluate (Giechaskiel et al., 2012). The Heavy-duty Inter-laboratory Correlation Exercise (ILCE_HD) (JRC, 2010) showed a PN repeatability ranging from 20 to 61% and a PM repeatability ranging from 35 to 56% for CVS measurements. The coefficients of variation (COVs) of average engine loads, average exhaust temperatures, PM emissions of accumulation mode particles (COV_PM_acc), total PM emissions (COV_PM_all), PN emissions of particles larger than 23 nm (COV_PN_23), and PN emissions of particles larger than 2.5 nm (COV_PN_2.5) are shown in Figure 7.8. The COVs of the PN emissions of particles larger than 10 nm (COV_PN_10) and of the PM emissions of nucleation mode particles (COV_PM_nuc) are also included in Figure 7.8 for completeness. COV_PM_all, COV_PM_acc, and COV_PM_nuc are all measurements from the CVS tunnel, with COV_PM_all representing the variability of both the nucleation and accumulation mode particles and COV_PM_acc representing the variability of the accumulation mode particles in the CVS tunnel, which is upstream of the PMP system. On the other hand, the COV_PN_2.5 represents the variability of both the nucleation and accumulation mode particles and the COV_PN_23 represents the variability of the accumulation mode particles downstream of the PMP system. Therefore, it is interesting to compare the COV_PM_all and COV_PN_2.5 and the COV_PM_acc and COV_PN_23.

36
Figure 7.7: Integrated PM and PN emissions for the UDDS and on-road tests on a distance basis.
For both the UDDS and on-road tests, the variabilities of both nucleation and accumulation mode particles downstream of the PMP system were usually slightly larger than those upstream of the PMP system (i.e., in the CVS tunnel). The COV_PN_23 values were 40, 30, 13, 10, and 18% for phases 1, 2, 3, 4, and UDDS, respectively. In contrast, the COV_PM_acc values were 31, 14, 13, 5, and 13% for phases 1, 2, 3, 4, and UDDS, respectively. The relatively large values of the COV_PN_23 and COV_PM_acc for phases 1 and 2 were likely associated with the elevated levels of DPF regeneration during phases 1 and 2, which can be attributed to the high exhaust temperatures. The COV_PN_2.5 values were 20, 24, 80, 50, and 25% for phases 1, 2, 3, 4, and UDDS, respectively. On the other hand, the COV_PM_all values were 18, 16, 21, 5, and 9% for phases 1, 2, 3, 4, and UDDS, respectively. Phase 3 had the largest COV_PN_2.5 and COV_PM_all values. This was attributed to the spike of sub-23 nm particle concentrations around t = 1050 second (Figure 7.3). The COV_PN_23 for both the UDDS and on-road tests were comparable to the PN emissions variability of the PMP ILCE_HD (JRC, 2010).
Both the UDDS and on-road tests were repeatable in terms of engine parameters. The COVs of the average engine loads and average exhaust temperatures for the UDDS and on-road tests were all below 5%, except the COVs of the average engine loads for phases 3 and 4 of the on-road test, which were 10 and 12%, respectively. The transient chassis dynamometer test (i.e., the UDDS cycle) and on-road tests showed the presence of sub 10 nm particles consistent with the lab and steady state chassis dynamometer test.

37
Figure 7.8: Coefficients of variations for the UDDS and on-road tests.

38
8 Summary and Discussion A European PMP compliant particle measurement system, the APC, and an alternative system for removing volatile particles, the CS, were evaluated and compared using laboratory-generated model volatile particles and diluted exhaust of a DPF-equipped, heavy-duty diesel vehicle operated on a heavy-duty chassis dynamometer and on-road. The goal of this study was to investigate and characterize the nature of appeared to be solid particles found downstream of the PMP system, with an emphasis on sub-23 nm particles.
• The lab study showed that re-nucleation particles can form downstream of the PMP system and that this re-nucleation is associated with sulfuric acid and hydrocarbon in the exhaust. Most of the particles found downstream of the PMP were volatile while 12-14% of particles were non-volatile. The well-controlled laboratory experiments provided an important link to the vehicle exhaust testing by evaluating the formation and volatility of the sub-23 nm particles downstream of the PMP. The laboratory tests were conducted with pure sulfuric acid and hydrocarbon aerosols separately, and then with mixed sulfuric acid/hydrocarbon aerosols. In the laboratory tests, the PMP and CS eliminated 98.9 to 99.9% of the input particles by total particle number. The remaining particles downstream of the PMP were almost entirely volatile when aerosols generated from pure sulfuric acid or pure tetracosane were used. However, for tests where particles were generated using a mixture of sulfuric acid and hydrocarbons, 12–14% of the particles downstream of the PMP were non-volatile, and appeared-to-be formed in the PMP.
• The steady state chassis dynamometer tests consistently showed the presence of
renucleated sub 10 nm particles. For the two steady state conditions tested on the chassis dynamometer (i.e., the 26% and 74% loads), the majority of the particles downstream of the PMP system were below the 23 nm size cut for the standard PMP measurement. Particle number concentrations between 3 and 10 nm downstream the PMP were ~2 and 7 times higher than the number concentrations of particles above 10 nm at the 74 and 26% engine load, respectively. At the 26% engine load, number concentrations of the 3 to 10 nm particles downstream the PMP were more than half an order of magnitude higher than the total (volatile plus solid) number concentration in the dilution tunnel, demonstrating the APC was making 3 to 10 nm particles.
• Both the transient chassis dynamometer test (i.e., the UDDS cycle) and the on-road
tests showed the presence of sub 10 nm particles consistent with the lab and steady state chassis dynamometer test. During uphill on-road driving conditions those sub 10 nm particles grew to a larger size due to condensation associated with higher concentrations of volatile vapors. For the UDDS and downhill on-road driving conditions, all the re-nucleated particles downstream of the PMP system were smaller than 10 nm, with negligible numbers of particles between 10 and 23 nm downstream of the PMP system. The variability of the PN emissions of particles larger than 23 nm ranged from 10 to 40% for the UDDS and on-road tests, comparable to that found in the European PMP study.

39
• This study provides evidence that the majority of sub-23 nm solid particles found downstream of the PMP in previous studies and in the current study are artifact particles formed by renucleation of semivolatiles. The presence of sub-23 nm particles downstream of the PMP poses challenges if the cut off diameter for the PMP protocol were to be reduced to count ash particles or if the PMP were to be applied more broadly to other sectors for measuring solid particles. Based on the current study, these artifact particles are mainly present below 10 nm, suggesting that artifact formation would not be a significant issue if the cut off diameter of the PMP was only lowered to 10 nm. The CS showed much less of a tendency to form particles downstream than the PMP, but suffers from higher thermophoretic and diffusion losses. Overall, more study is needed to find ways to further reduce or eliminate artifact formation under the PMP methodology for broader applications.
40
Bibliography Abdul-Khalek, I.S. and Kittelson, D.B. (1995). Real time measurement of volatile and solid
exhaust particles using a catalytic stripper. SAE Technical Paper 950236. Barnett, V. and Lewis, T. (1994). Outliers in Statistical Data. Wiley Series in Probability &
Statistics. Wiley & Sons, third edition. Biswas, S., Verma, V., Schauer, J.J., Cassee, F.R., Cho, A.K., and Sioutas, C. (2009).
Oxidative potential of semi-volatile and non-volatile particulate matter (pm) from heavy-duty vehicles retrofitted with emission control technologies. Environmental Science & Technology, 43(10):3905–3912.
Burtscher, H. (2005). Physical characterization of particulate emissions from diesel engines: a
review. Journal of Aerosol Science, 36(7):896–932. Burtscher, H., Baltensperger, U., Bukowiecki, N., Cohn, P., Huglin, C., Mohr, M., Matter, U.,
Nyeki, S., Schmatloch, V., Streit, N., and Weingartner, E. (2001). Separation of volatile and non-volatile aerosol fractions by thermodesorption: instrumental development and applications. Journal of Aerosol Science, 32(4):427–442.
Burwell, R.L., Scott, R.B., Maury, L.G., and Hussey, A.S. (1954). The action of 96. Journal of the
American Chemical Society, 76(22):5822–5827. Cocker, D.R., Shah, S.D., Johnson, K., Miller, J.W., and Norbeck, J.M. (2004). Development and
application of a mobile laboratory for measuring emissions from diesel engines. 1. regulated gaseous emissions. Environmental Science & Technology, 38(7):2182–2189.
Cooper, B.J. and Thoss, J.E. (1989). Role of no in diesel particulate emission control. SAE Technical Paper 890404.
Czerwinski, J., Comte, P., Larsen, B., Martini, G., and Mayer, A. (2006). Research on particle
emissions of modern 2-stroke scooters. SAE Technical Paper 2006-01-1078. EC (2008). Implementing and amending regulation (ec) no 715/2007 of the European parliament
and of the council on type-approval of motor vehicles with respect to emissions from light passenger and commercial vehicles (euro 5 and euro 6) and on access to vehicle repair and maintenance information. Commission Regulation (EC) No 692/2008.
EC (2011). Implementing and amending regulation (ec) no 595/2009 of the European parliament
and of the council with respect to emissions from heavy duty vehicles (euro vi) and amending annexes i and iii to directive 2007/46/ec of the European parliament and of the council. Com- mission Regulation (EC) No 582/2011.
EPA (2011). 40 Code of Federal Regulations, part 1065.

41
Filippo, A.D. and Maricq, M.M. (2008). Diesel nucleation mode particles: semivolatile or solid? Environmental Science & Technology, 42(21):7957–7962.
Gidney, J.T., Twigg, M.V., and Kittelson, D.B. (2010). Effect of organometallic fuel additives on
nanoparticle emissions from a gasoline passenger car. Environmental Science & Technology, 44(7):2562–2569.
Giechaskiel, B. and Drossinos, Y. (2010). Theoretical investigation of volatile removal efficiency
of particle number measurement systems. SAE Technical Paper 2010-01-1304. Giechaskiel, B., Carriero, M., Martini, G., and Andersson, J. (2009). Heavy duty particle mea-
surement programme (pmp): exploratory work for the definition of the test protocol. SAE Technical Paper 2009-01-1767.
Giechaskiel, B., Cresnoverh, M., JÃu rgl, H., and Bergmann, A. (2010a). Calibration and accuracy
of a particle number measurement system. Measurement Science & Technology, 21(4):045102. Giechaskiel, B., Chirico, R., DeCarlo, P.F., Clairotte, M., Adam, T., Martini, G., Heringa, M.F.,
Richter, R., Prevot, A.S.H., Baltensperger, U., and Astorga, C. (2010b). Evaluation of the particle measurement programme (PMP) protocol to remove the vehicles’ exhaust aerosol volatile phase. Science of the Total Environment, 408(21):5106–5116.
Giechaskiel, B., Mamakos, A., Andersson, J., Dilara, P., Martini, G., Schindler, W., and Bergmann,
A. (2012). Measurement of automotive non-volatile particle number emissions within the euro- pean legislative framework: A review. Aerosol Sci. Technol, 46(7):719-749.
Herner, J.D., Robertson, W.H., and Ayala, A. (2007). Investigation of ultrafine particle number
measurements from a clean diesel truck using the European PMP protocol. SAE Technical Paper 2007-01-1114.
Herner, J.D., Hu, S., Robertson, W.H., Huai, T., Chang, M.C.O., Rieger, P., and Ayala, A. (2011).
Effect of advanced aftertreatment for PM and NOx reduction on heavy-duty diesel engine ultrafine particle emissions. Environmental Science & Technology, 45(6):2413–2419.
Johnson, K.C., Durbin, T.D., Jung, H., Chaudhary, A., Cocker, D.R., Herner, J.D., Robertson,
W.H., Huai, T., Ayala, A., and Kittelson, D. (2009). Evaluation of the European PMP methodologies during on-road and chassis dynamometer testing for DPF equipped heavy-duty diesel vehicles. Aerosol Science and Technology, 43(10):962 – 969.
JRC (2010). Particle measurement programme (PMP) heavy-duty inter-laboratory correlation
exercise (ilce_hd) final report. Technical report, JRC. Khalek, I.A. (2005). 2007 diesel particulate measurement research. final report. CRC project E-
66- phase 1. Technical report, Coordinating Research Council. Kittelson, D.B. (1998). Engines and nanoparticles: a review. Journal of Aerosol Science, 29(5-
6):575–588. Kittelson, D.B., Watts, W.F., and Johnson, J.H. (2002). Diesel aerosol sampling methodology -
CRC E-43. Technical report.
42
Kittelson, D.B., Watts, W.F., Savstrom, J.C., and Johnson, J.P. (2005). Influence of a catalytic stripper on the response of real time aerosol instruments to diesel exhaust aerosol. Journal of Aerosol Science, 36(9):1089–1107.
Kittelson, D.B., Watts, W.F., and Johnson, J.P. (2006). On-road and laboratory evaluation of
combustion aerosols-part1: summary of diesel engine results. Journal of Aerosol Science, 37(8):913–930.
Lahde, T., Ronkko, T., Virtanen, A., Schuck, T.J., Pirjola, L., Hameri, K., Kulmala, M., Arnold, F.,
Rothe, D., and Keskinen, J. (2009). Heavy duty diesel engine exhaust aerosol particle and ion measurements. Environmental Science & Technology, 43(1):163–168.
Lahde, T., Ronkko, T., Virtanen, A., Solla, A., Kyto, M., Soderstrom, C., and Keskinen, J.
(2010). Dependence between nonvolatile nucleation mode particle and soot number concentrations in an EGR equipped heavy-duty diesel engine exhaust. Environmental Science & Technology, 44(8):3175–3180.
Liu, Z.G., Vasys, V.N., Dettmann, M.E., Schauer, J.J., Kittelson, D.B., and Swanson, J. (2009).
Comparison of strategies for the measurement of mass emissions from diesel engines emitting ultra-low levels of particulate matter. Aerosol Science and Technology, 43(11):1142–1152.
Maricq, M.M. and Xu, N. (2004). The effective density and fractal dimension of soot particles from
premixed flames and motor vehicle exhaust. Journal of Aerosol Science, 35(10):1251–1274. Martini, G., Giechaskiel, B., and Dilara, P. (2009). Future European emission standards for
vehicles: the importance of the UN-ECE particle measurement programme. Biomarkers, 14(s1):29–33.
Park, K., Kittelson, D.B., and McMurry, P.H. (2003). A closure study of aerosol mass
concentration measurements: comparison of values obtained with filters and by direct measurements of mass distributions. Atmospheric Environment, 37(9-10):1223–1230.
Ronkko, T., Virtanen, A., Kannosto, J., Keskinen, J., Lappi, M., and Pirjola, L. (2007). Nucleation
mode particles with a nonvolatile core in the exhaust of a heavy duty diesel vehicle. Environmental Science & Technology, 41(18):6384–6389.
Seinfeld, J.H. and Pandis, S.N. (2006). Atmospheric Chemistry and Physics: From Air Pollution
to Climate Change. John Wiley & Sons, Inc., second edition. Shi, J.P. and Harrison, R.M. (1999). Investigation of ultrafine particle formation during diesel
exhaust dilution. Environmental Science & Technology, 33(21):3730–3736. Stenitzer, M. (2003). Nano particle formation in the exhaust of internal combustion engines.
Master’s thesis, Technischen Universität Wien. Swanson, J. and Kittelson, D. (2010a). Evaluation of thermal denuder and catalytic stripper
methods for solid particle measurements. Journal of Aerosol Science, 41(12):1113–1122. Swanson, J. and Kittelson, D.B. (2010b). Alternatives to the gravimetric method for
quantification of diesel particulate matter near the lower level of detection. Journal of the Air & Waste Management Association (1995), 60(10):1177–1191.
43
TSI (2007). Model 3772/3771 condensation particle counter operation and service manual. Technical report.
UNECE (2011a). Uniform provisions concerning the measures to be taken against the emission
of gaseous and particulate pollutants from compression ignition engines for use in vehicles, and the emission of gaseous pollutants from positive-ignition engines fuelled with natural gas or liquified petroleum gas for use in vehicle. Revision 5, Amendment 1, Addendum 48: Regulation No. 49.
UNECE (2011b). Uniform provisions concerning the approval of vehicles with regard to the
emission of pollutants according to engine fuel requirements. Revision 4, Addendum 82: Regulation No. 83.
Zheng, Z., Johnson, K.C., Liu, Z., Durbin, T.D., Hu, S., Huai, T., Kittelson, D.B., and Jung, H.S.
(2011). Investigation of solid particle number measurement: Existence and nature of sub-23 nm particles under PMP methodology. Journal of Aerosol Science, 42(12):883–897.
Zheng, Z., Durbin, T.D., Karavalakis, G., Johnson, K.C., Chaudhary, A., III, D.R.C., Herner, J.D.,
Robertson, W.H., Huai, T., Ayala, A., Kittelson, D.B., and Jung, H.S. (2012). Nature of sub-23 nm particles in the solid particle measurement method: a real time data perspective. Aerosol Science & Technology, 46:886–896.
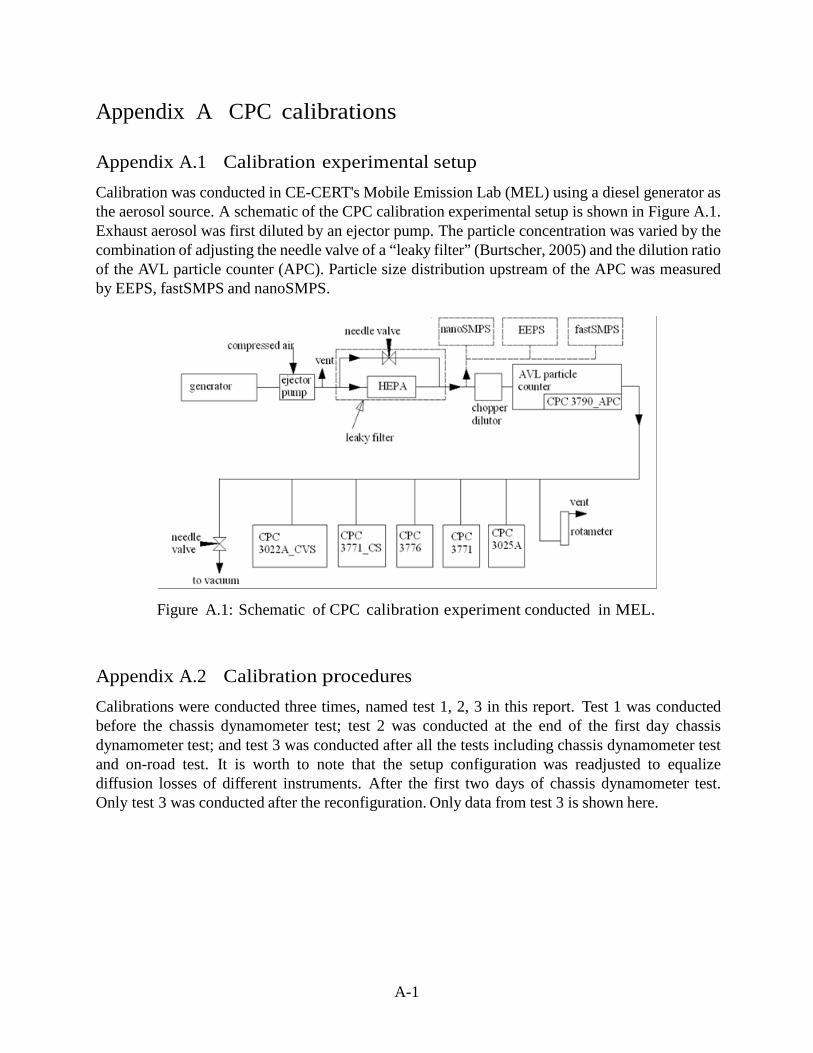
A-1
Appendix A CPC calibrations Appendix A.1 Calibration experimental setup
Calibration was conducted in CE-CERT's Mobile Emission Lab (MEL) using a diesel generator as the aerosol source. A schematic of the CPC calibration experimental setup is shown in Figure A.1. Exhaust aerosol was first diluted by an ejector pump. The particle concentration was varied by the combination of adjusting the needle valve of a “leaky filter” (Burtscher, 2005) and the dilution ratio of the AVL particle counter (APC). Particle size distribution upstream of the APC was measured by EEPS, fastSMPS and nanoSMPS.
Figure A.1: Schematic of CPC calibration experiment conducted in MEL. Appendix A.2 Calibration procedures
Calibrations were conducted three times, named test 1, 2, 3 in this report. Test 1 was conducted before the chassis dynamometer test; test 2 was conducted at the end of the first day chassis dynamometer test; and test 3 was conducted after all the tests including chassis dynamometer test and on-road test. It is worth to note that the setup configuration was readjusted to equalize diffusion losses of different instruments. After the first two days of chassis dynamometer test. Only test 3 was conducted after the reconfiguration. Only data from test 3 is shown here.
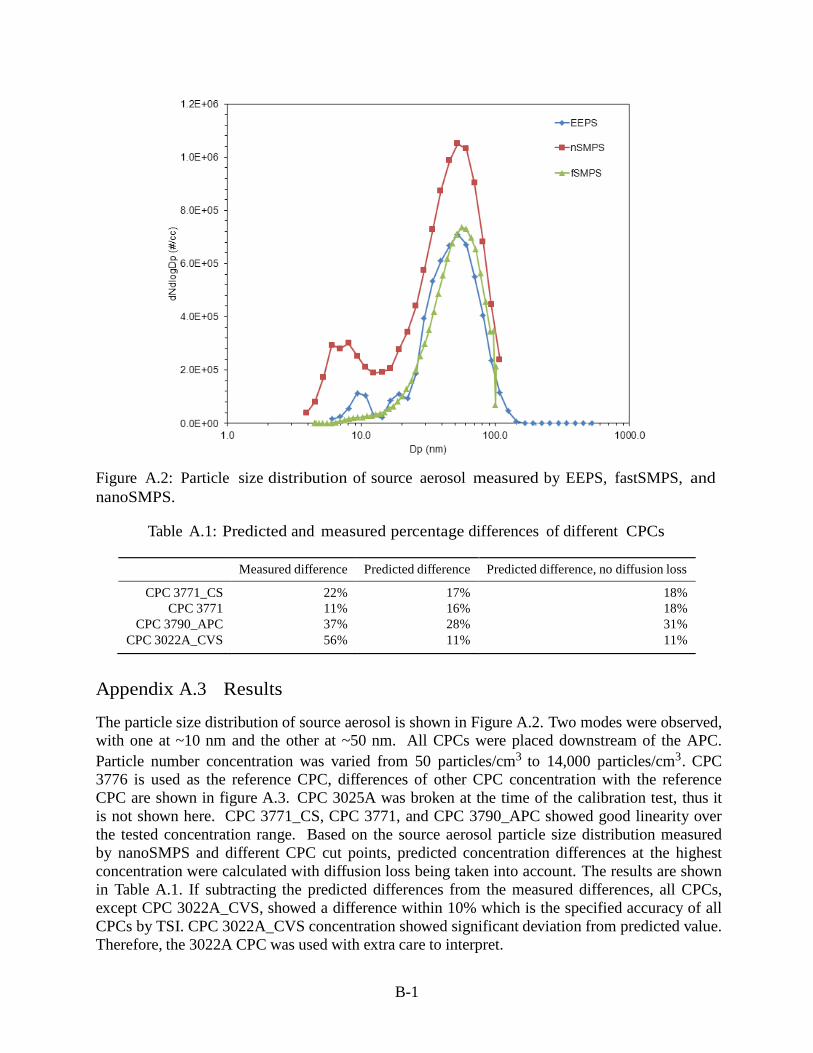
B-1
Figure A.2: Particle size distribution of source aerosol measured by EEPS, fastSMPS, and nanoSMPS.
Table A.1: Predicted and measured percentage differences of different CPCs
Measured difference Predicted difference Predicted difference, no diffusion loss
CPC 3771_CS 22% 17% 18% CPC 3771 11% 16% 18%
CPC 3790_APC 37% 28% 31% CPC 3022A_CVS 56% 11% 11%
Appendix A.3 Results
The particle size distribution of source aerosol is shown in Figure A.2. Two modes were observed, with one at ~10 nm and the other at ~50 nm. All CPCs were placed downstream of the APC. Particle number concentration was varied from 50 particles/cm3 to 14,000 particles/cm3. CPC 3776 is used as the reference CPC, differences of other CPC concentration with the reference CPC are shown in figure A.3. CPC 3025A was broken at the time of the calibration test, thus it is not shown here. CPC 3771_CS, CPC 3771, and CPC 3790_APC showed good linearity over the tested concentration range. Based on the source aerosol particle size distribution measured by nanoSMPS and different CPC cut points, predicted concentration differences at the highest concentration were calculated with diffusion loss being taken into account. The results are shown in Table A.1. If subtracting the predicted differences from the measured differences, all CPCs, except CPC 3022A_CVS, showed a difference within 10% which is the specified accuracy of all CPCs by TSI. CPC 3022A_CVS concentration showed significant deviation from predicted value. Therefore, the 3022A CPC was used with extra care to interpret.
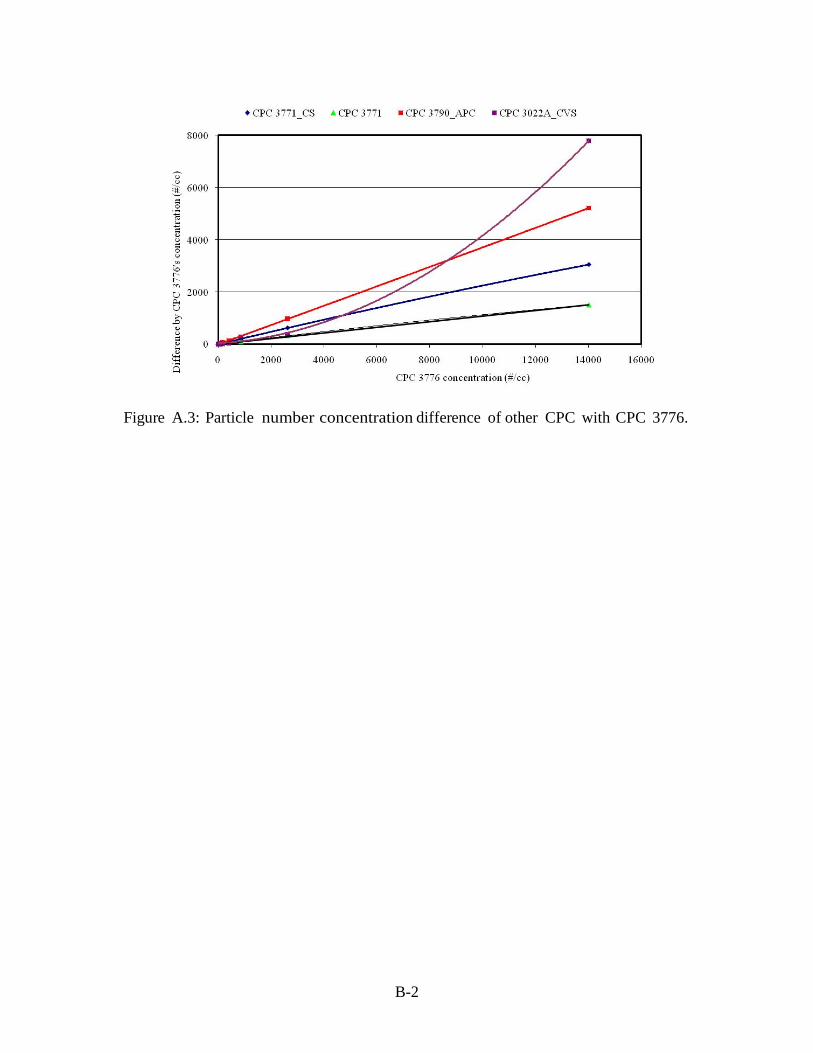
B-2
Figure A.3: Particle number concentration difference of other CPC with CPC 3776.
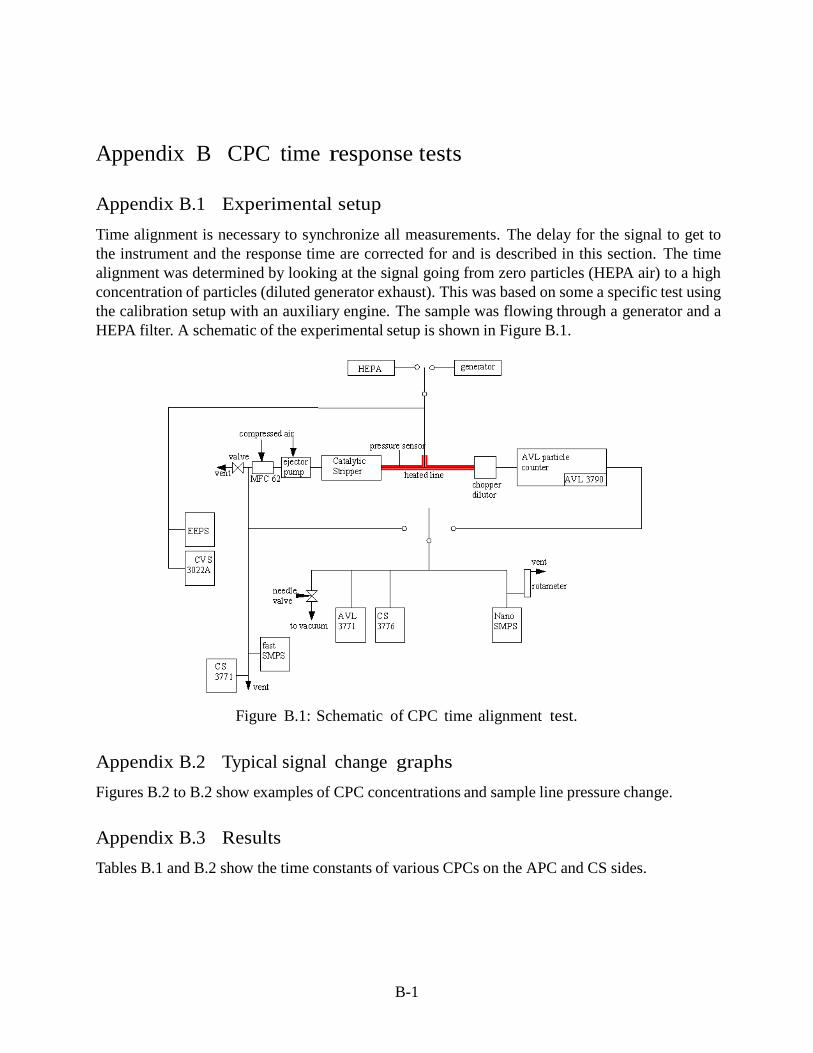
B-1
Appendix B CPC time response tests Appendix B.1 Experimental setup
Time alignment is necessary to synchronize all measurements. The delay for the signal to get to the instrument and the response time are corrected for and is described in this section. The time alignment was determined by looking at the signal going from zero particles (HEPA air) to a high concentration of particles (diluted generator exhaust). This was based on some a specific test using the calibration setup with an auxiliary engine. The sample was flowing through a generator and a HEPA filter. A schematic of the experimental setup is shown in Figure B.1.
Figure B.1: Schematic of CPC time alignment test. Appendix B.2 Typical signal change graphs
Figures B.2 to B.2 show examples of CPC concentrations and sample line pressure change.
Appendix B.3 Results
Tables B.1 and B.2 show the time constants of various CPCs on the APC and CS sides.
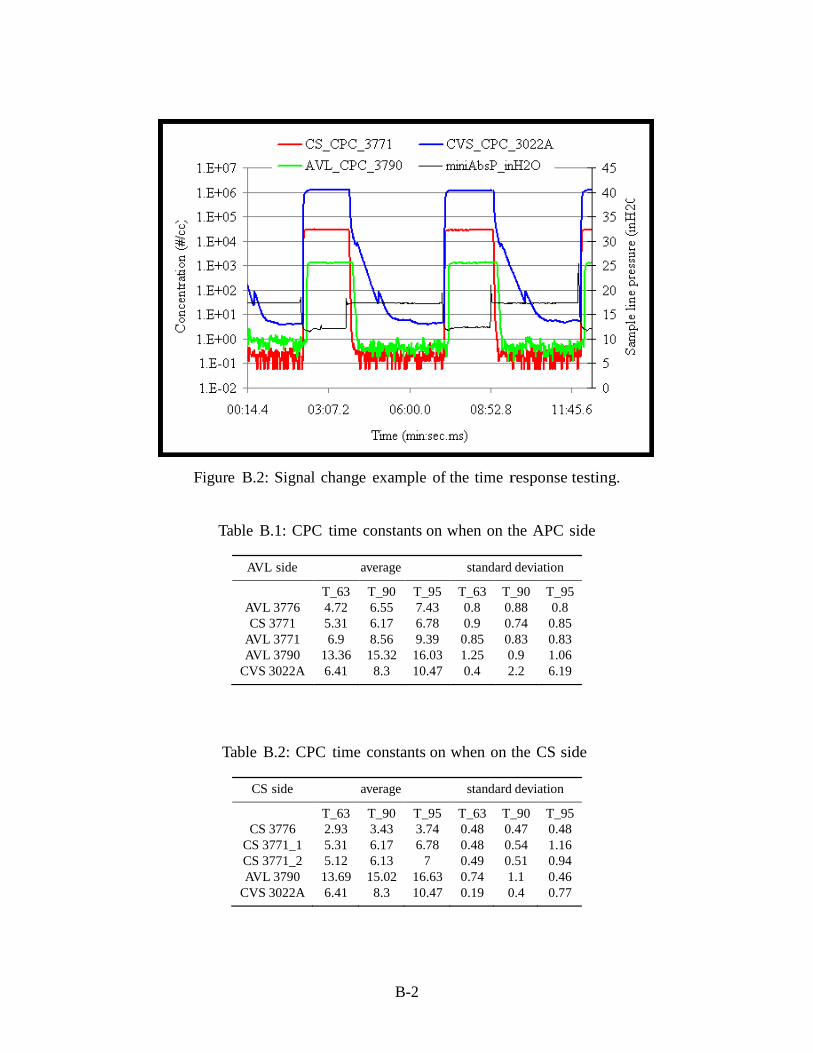
B-2
Figure B.2: Signal change example of the time response testing.
Table B.1: CPC time constants on when on the APC side
AVL side average standard deviation
T_63 T_90 T_95 T_63 T_90 T_95 AVL 3776 4.72 6.55 7.43 0.8 0.88 0.8 CS 3771 5.31 6.17 6.78 0.9 0.74 0.85
AVL 3771 6.9 8.56 9.39 0.85 0.83 0.83 AVL 3790 13.36 15.32 16.03 1.25 0.9 1.06
CVS 3022A 6.41 8.3 10.47 0.4 2.2 6.19
Table B.2: CPC time constants on when on the CS side
CS side average standard deviation
T_63 T_90 T_95 T_63 T_90 T_95 CS 3776 2.93 3.43 3.74 0.48 0.47 0.48
CS 3771_1 5.31 6.17 6.78 0.48 0.54 1.16 CS 3771_2 5.12 6.13 7 0.49 0.51 0.94 AVL 3790 13.69 15.02 16.63 0.74 1.1 0.46
CVS 3022A 6.41 8.3 10.47 0.19 0.4 0.77

B-3
Figure B.3: Signal change example of the time response testing.
Figure B.4: Signal change example of the time response testing.

C-1
Appendix C Additional data for laboratory tests Appendix C.1 Sulfuric acid aerosol
Figure C.1 shows the results of evaluating CS with sulfuric acid aerosol only. The aerosol had a peak at ∼10 nm. The upstream number concentration was ∼ 3.36 × 10⁷ particles/cm3 and the removing efficiency was 99.9993%.
Figure C.1: Sulfuric acid particle size distributions measured upstream and downstream of CS.
Figure C.2 shows the results of evaluating the APC and the APC-CS with sulfuric acid aerosol only. No particles were observed downstream of the APC-CS.
Appendix C.2 Tetracosane aerosol
Figure C.3 shows the results of evaluating the CS with tetracosane aerosol only. The aerosol had a peak at ∼80 nm. The upstream number concentration was ∼ 3.66 × 10⁴ particles/cm3 and the removing efficiency was 99.9966%.
Figure C.4 shows the results of evaluating the APC and the APC + CS with tetracosane aerosol only. No particles were observed downstream of APC + CS.

C-2
Figure C.2: Sulfuric acid particle size distributions measured upstream and downstream of APC.
Appendix C.3 Sulfuric acid and tetracosane aerosol
Figure C.5 shows results of evaluating the CS with sulfuric acid and tetracosane aerosol. Signifi- cant number of particles was observed downstream of CS.
Figure C.6 and Figure C.7 show the results of evaluating the APC and the APC + CS with sulfuric acid and tetracosane aerosol. The dilution ratio of APC was 120. Figure C.6 was measured by regular SMPS while nansSMPS was used in figure C.7. Particles were observed downstream of CS. More particles were measured downstream of CS by nanoSMPS than regular SMPS.

C-3
Figure C.3: Tetracosane particle size distributions upstream and downstream of CS.
Figure C.4: Tetracosane particle size distributions upstream and downstream of APC and CS.

C-4
Figure C.5: Sulfuric acid and tetracosane size distributions upstream and downstream of CS.
Figure C.6: Sulfuric acid and tetracosane size distributions upstream and downstream of APC and CS measured with regular SMPS.
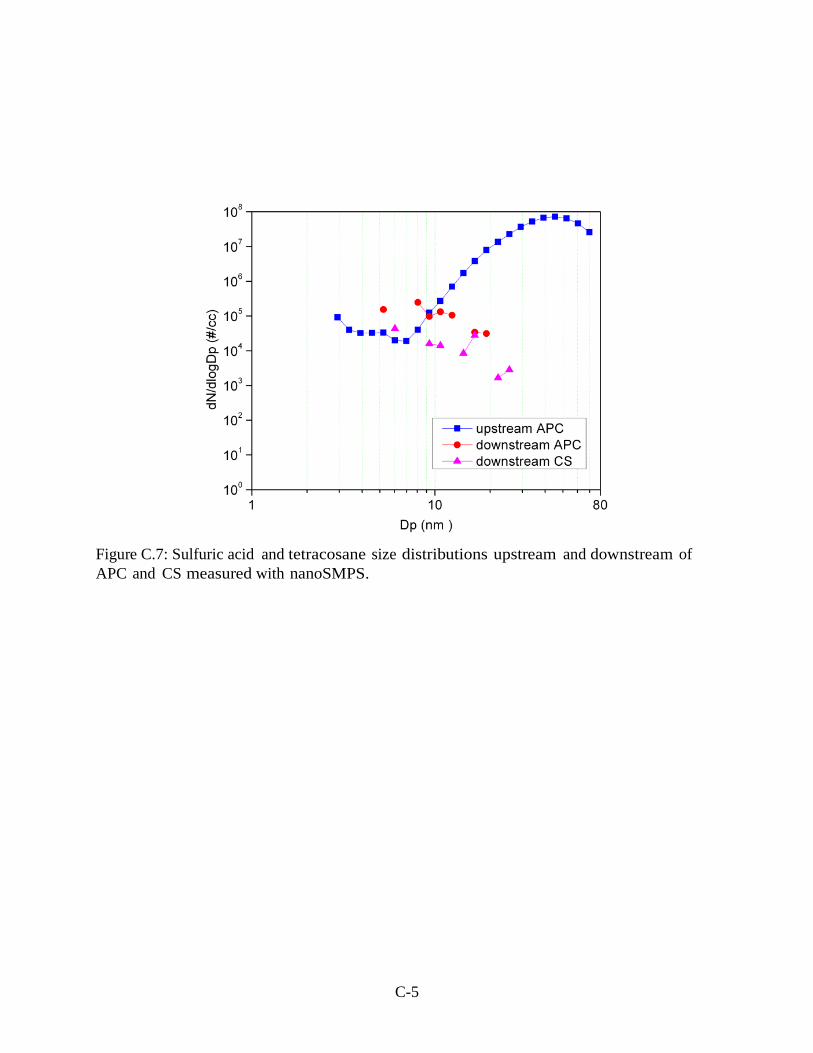
C-5
Figure C.7: Sulfuric acid and tetracosane size distributions upstream and downstream of APC and CS measured with nanoSMPS.
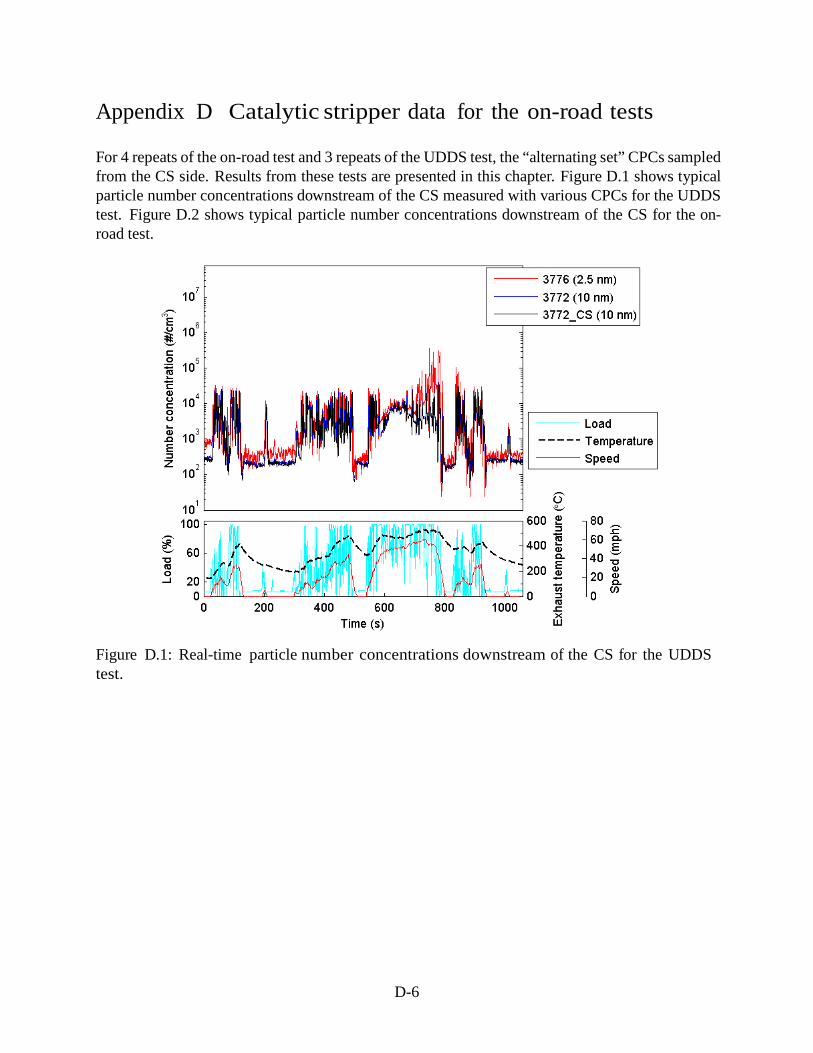
D-6
Appendix D Catalytic stripper data for the on-road tests For 4 repeats of the on-road test and 3 repeats of the UDDS test, the “alternating set” CPCs sampled from the CS side. Results from these tests are presented in this chapter. Figure D.1 shows typical particle number concentrations downstream of the CS measured with various CPCs for the UDDS test. Figure D.2 shows typical particle number concentrations downstream of the CS for the on- road test.
Figure D.1: Real-time particle number concentrations downstream of the CS for the UDDS test.

D-7
Figure D.2: Real-time particle number concentrations downstream of the CS for the on-road test.


