Measure Efficiency, Transformations -...
37
Transcript of Measure Efficiency, Transformations -...


Measure Efficiency,Effectiveness, and Culture toOptimize DevOpsTransformations
Metrics for DevOps Initiatives
DevOps Enterprise Forum
IT RevolutionPortland, Oregon
Measure Efficiency, Effectiveness, and Culture to Optimize DevOps Transforma-tions: Metrics for DevOps Initiatives Copyright © 2015 IT Revolution All rights reserved. No part of this book may be reproduced in any form withoutwritten permission from IT Revolution. IT RevolutionPortland, [email protected] For quantity purchases by corporations, associations, and others, please con-tact the publisher at [email protected]. Cover design by Brian David Smith and Mammoth Collective.Interior layout generated by O’Reilly Atlas.

Table of Contents
Preface v
Introduction vii
CHAPTER 1: Principles 9
1.1 Hunger for Better Measurements 9
1.2 What are some key principles of measurement? 9
1.3 Which classes of measurements matter most? 10
1.4 Discussion on Lead Time and vs. Process Time 11
1.5 Discussion on Code Deployment Lead Time 12
1.6 Discussion on Work-in-progress (WIP) 13
1.7 Measuring Culture 13
1.7.1 Why Culture Matters 13
1.7.2 How to Measure Culture 14
1.7.3 When to Measure Culture 15
CHAPTER 2: Scenarios 17
2.1 Scenario 1: Moving to a SaaS Culture 17
2.1.1 Live Site Health 17
2.1.2 Usage 18
2.1.3 Engineering Velocity and Debt Indicators 19
2.2 Scenario 2: High Incident Volume 21
2.2.1 The Problem 21
iii
2.2.2 Solution 21
2.2.3 Eliminate Redundant Systems 21
2.2.4 Better Signal 22
2.2.5 Repeat Offenders 22
2.2.6 Fix Top Problems 22
2.2.7 Success 23
2.3 Scenario 3: Complex Integration Test Problems 23
2.3.1 The Problem 23
2.3.2 The Solution 24
Decoupling from Constraints 24
Accelerating the Changes 24
2.3.3 Success 24
CHAPTER 3: 3 The Value of Measurement 27
3.1 Improved measurement can increase trust in software delivery. 28
3.2 Improved Measurement Can Enable Better Decision Making andSteering. 28
3.3 Getting Started 28
References 29
Collaborators 31
Acknowledgments 33
Table of Contents
iv

Preface
The DevOps Enterprise Forum, facilitated by IT Revolution, brought together50 technology leaders and thinkers in the DevOps Enterprise community forthree days in Portland, Oregon in May 2015, with the goal of organizing in totask teams and creating written guidance on the best-known methods for over-coming the top obstacles in the DevOps Enterprise community.
We tackled the five key areas identified by the community at the 2014 De-vOps Enterprise Summit:
• Better strategies and tactics for creating automated tests for legacy appli-cations
• Addressing culture and leadership aspects during transforming• Top approaches to organizational design, roles and responsibilities• Information security and compliance practices• Identifying metrics to best improve performance with DevOps initiatives.
For three days, we broke into groups based on each of the key areas and setto work, choosing teams, sometimes switching between teams, collaborating,sharing, arguing… and writing.
After the Forum concluded, the groups spent the next six months workingtogether to complete and refine the work they started together.
Our goal was to generate content in the form of white papers, articles, orother resources in time to share that guidance with the technology communityduring the DevOps Enterprise Summit 2015 in October.
We are proud to share the outcomes of the hard work, dedication, and col-laboration of this amazing group of people.
—Gene KimOctober 2015
v


Introduction
Advancing the state of measurement practice is an important foundation forimproving software delivery economics. The DevOps Enterprise communityhas identified improved measurement as a top priority for 2015. This papersummarizes a position on DevOps measurement that we intend to be a catalystfor accelerating more mature guidance on measuring and steering software de-livery.
vii


Principles
1.1 Hunger for Better Measurements
There is a hunger for better measurements. DevOps teams and professionalswant to push new ideas and new ways of doing things. Metrics objectively helpteams distinguish between improvements and unproductive changes. We feelmeasurements
1. Remove Subjectivity
2. Improve Excellence
3. Focus on Strategy
4. Create Predictability
Measurements work best when they drive crucial conversations and helpteams improve. Measurements are undermined when they are driven as anevaluation of performance and impact. People will game the system or distorta metric if it focuses on personal performance rather than team performance. Therefore, a successful transformation to a metrics driven organization ispowered by three things.
1. A better work environment more accepting of new ideas
2. Desire for accountable teams
3. Continuous improvement via the scientific method
1.2 What are some key principles of measurement?
Software’s most important quality is its adaptiveness and ease of change. Abili-ty to execute on a faster cadence (efficiency) and the ability to freely add morevalue (effectiveness) demand continuous change cycles. This is different frommanufacturing processes. Accepting continuous change in software drives ourbelief in that we need different thinking to drive measurement and metrics forDevOps.
9
1

From experience reports we know there are a set of practices common tosuccessful software delivery. Using these experience reports we have developeda set of guiding principles for a stronger measurement approach for DevOpssoftware delivery.
1. Software’s most important quality is its adaptiveness (ease of change),therefore rate of change and cost of change are the most importantmeasures for software
2. The product pipeline—change managed builds, tests, deployments, andcustomer usage are the primary sources of measurement. Process pipe-lines are secondary sources.
3. Track at least one measure in each of three dimensions: 1-internal (effi-ciency or cost related), 2-external (effectiveness or value related), 3-cultural (team dynamics or people related); and no more than a few inany dimension.
4. Metric collection should be largely automated and unobtrusive to practi-tioners. Automation eliminates subjectivity and manual overhead, andimproves consistency.
5. Measures should be useful and transparent to both leadership and engi-neering personnel in communicating progress and quality in a consistentformat.
6. Measurement targets should be captured as distributions of probableoutcomes. An honest exchange would include a discussion of the var-iance and the uncertainty inherent in the forecasted expectation.
7. Measurement precision and fidelity should improve over time along withthe improvements in the software development process. Measures arenot static; the best teams evolve their measures.
1.3 Which classes of measurements matter most?
We have identified three dimensions (or classes) of measures that are requiredto steer projects through the uncertainties, tradeoffs and critical decisions ofsoftware delivery:
• Internal - Objective measures and trends in technical progress, productpipeline trends and resource consumption. These are inside-out meas-ures of efficiency and resource consumption (cost/time/materials)
• External - Objective measures and trends in quality, usefulness, perfor-mance, and business outcomes. These are outside-in measures of effec-tiveness and value delivered.
CHAPTER 1: Principles
10
• Cultural - Objective and subjective trends in team dynamics, processoverhead, trustworthiness, shared objectives, morale, motivation, andteam/product/enterprise identity
In this paper we felt that External Measures have been well covered by ac-counting rules and industry experts. In addition we felt External Measures de-pend on the stage of the company from startup to steady business and the rev-enue model of the business. Public companies have standard accounting meas-ures found in GAAP, IAS, and IFRS. Startups and new companies have a wealthof measures available like the “Four Gears” by Geoffrey Moore. For these rea-sons we focus the paper on Internal and Cultural measures.
1.4 Discussion on Lead Time and vs. Process Time
In the Internal Class of Measurements, Lead Time and Process Time are some ofthe most powerful measures. Software is at its best when it remains flexible andthe team is free to adapt to changes. Lead Time and Process Time effectivelymeasure the dynamic nature of software development across industries andtypes of projects. When used at an appropriately high level Lead Time and Pro-cess Time help to identify the odds of delivering items within expected time-frames, the bottlenecks in the process, quantify handoff efficiency betweenteams, and enable continued improvement in feedback cycles. Using these def-initions across the industry will help establish some consistency and help docu-ment improvements in our practice.
Lead Time (LT): The elapsed time from receiving a customer request to de-livering on that request. Lead Time = Process Time plus Wait Time.
Process Time (PT): Process time begins when the work has been pulled intoa doing state and ends when the work is delivered to the next downstream cus-tomer.
Wait Time (WT): The time that work sits idle not being worked.
Lead time, Process time and Wait time metrics reveal how long it takes todeliver value. A faster delivery time allows for faster feedback which in turn in-creases the product value These metrics can also expose inefficiencies (idletime, non-value-adding process time) in the workflow that create uncertainty.Reducing uncertainty helps organizations become more predictable.
1.4 Discussion on Lead Time and vs. Process Time
11
1.5 Discussion on Code Deployment Lead Time
One of the key findings of the Puppet Labs State of DevOps reports spanningthree years, which included surveys of over 20,000 IT professionals, was that asignificant predictor of IT performance and organization performance is “codedeployment lead time,” as it divides the two qualitatively segments of the tech-nology value stream:
• The Design and Development value stream begins when product ownerscome up with hypotheses or customers submit requests, and ends whencode is committed into our version control repository.
• The Testing and Operations value stream begins at this point when workis checked into version control, where it is ideally then integrated, submit-ted to a automated suite of unit, acceptance and non-functional tests(such as performance tests), and then deployed into production in single-piece flow.
The Design and Development value stream more resembles Lean ProductDevelopment, which is highly variable and highly uncertain, often requiringhigh degrees of creativity and performing work that may never be performedagain. On the other hand, the Test and Operations value stream more resem-bles Lean Manufacturing, while also requires creativity, expertise and experi-mentation, strives to be predictable and mechanistic, with the goal of achievingwork outputs with minimized variability (e.g., lead times, process times, de-fects, etc.).
Process times in the Design and Development value stream are usuallylonger (e.g., days or weeks to complete) than process times in the Testing andOperations value stream (e.g., minutes, hours). To achieve DevOps outcomes offast flow and high reliability, we need Testing work to happen simultaneouslywith Development work (or even earlier, with techniques such as Test DrivenDevelopment).
We do this by ensuring work in the Design and Development value stream is frequent and continuous, with developers checking code into version controland integrating frequently (e.g., at least daily), with the Testing and Operationsvalue stream providing fast feedback (e.g., minutes or hours) back to the Designand Development value stream.
One of the findings of the 2014 and 2015 Puppet Labs State of DevOps re-search was that “deployment lead time” serves as a predictor of performancefor both value streams: Deployment lead times not only predicts deploymentand reliability outcomes, but it also measures how quickly Design and Develop-ment value stream can receive feedback from the customer and how quicklynew customer experiments can be performed.
High performers had significantly better outcomes:
CHAPTER 1: Principles
12
• Throughput and agility metrics
◦ 200x faster deployment lead times
◦ 30x more frequent deployments
• Reliability and stability metrics
◦ 60x higher change success rates
◦ 168x faster mean time to restore service (MTTR)
• Organizational performance metrics
◦ 2x more likely to exceed productivity, market share, and profitabili-ty goals
◦ 50% higher market capitalization growth over three years.
1.6 Discussion on Work-in-progress (WIP)
Where lead time and process time are trailing indicators (we don’t know howlong something took to do until it’s been completed), Work-in-Progress metricsprovide organizations with a rare leading indicator. It’s proven that the moreitems we have on our plate, the longer those items take to complete. The pri-mary cause is due to increased context switching and dependencies. The mi-nute we set work item 1 aside to take on work item 2, work item 1 starts to be-comes stale. If we then set work item 2 aside to begin work item 3 before items1 and 2 are done, a pile of unfinished work (WIP) builds up that provides no realvalue. Identifying how much WIP is in the system is the best predictor of LeadTime.
Work-in-progress (WIP): The amount of work in a system that has beenstarted but not finished.
A consistent amount of WIP, where the amount of incoming work requests isapproximately equal to the amount of outgoing work requests, helps teams tobalance their workload in a sustainable fashion and become more predictable.
1.7 Measuring Culture
1.7.1 Why Culture Matters
Organizational culture has been shown to be an important factor in organiza-tional change and organizational impacts for decades. In contrast to otherbroad measures of culture (such as national culture), an organization’s culturecan be seen and observed in its formal state (such as mission statements andgoals) as well as its informal state (such as shared values and social norms). Theimportance of shared values and social norms seen in informal organizational
1.6 Discussion on Work-in-progress (WIP)
13
1 Westrum, R. (2004). A typology of organisational cultures. Quality and safety in health care,13(suppl 2), ii22-ii27. Retrieved from http://www.ncbi.nlm.nih.gov/pmc/articles/PMC1765804/pdf/v013p0ii22.pdf.
structures have been quite apparent, as they can often be stronger than anyformal communication, which may be “tossed aside” or “only used for show.”
Organizational culture has many facets, and practitioners can choose to fo-cus on aspects of their culture which would benefit their context or project themost. In DevOps transformations, which prioritize work and communicationacross previously separate silos of technical teams, information flow is para-mount. Ron Westrum proposed a model of organizational culture that empha-sized the importance of information flow in complex and high risk work envi-ronments (2004). For this reason, the State of DevOps Study 2014 and 2015(published by Puppet Labs and IT Revolution) selected this framework for inclu-sion in its investigations, and adapted it for use in research. In fact, one couldeasily argue that the work of software and IT service delivery is high risk andcomplex, and information flow is crucial, making this framework ideal for thecontext.
1.7.2 How to Measure Culture
Organizational culture is a perceptual measure, and therefore, captured usingsurvey methods. It is important to use well-designed items and constructs thatare rigorous and show good psychometric properties of discriminant and con-vergent validity and reliability (all statistical measures). Always base surveyquestions and constructs on well-tested theories and expert input, and use aLikert-type format. As an example, Westrum survey measures are included be-low.1
Westrum items. Note these items have been shown to be highly valid andreliable statistically. They should be presented together (though not labeled ortitled), with responses ranging from Strongly Disagree (=1) to Strongly Agree(=7). They are a latent construct, which means their scores can be averaged,thereby providing a single score for one’s Westrum culture metric. The itemscan be slightly altered, if necessary, to fit your context, but only minor changesshould be done in order to preserve the statistical properties.
• On my team, information is actively sought.• On my team, failures are learning opportunities, and messengers of them
are not punished.• On my team, responsibilities are shared.• On my team, cross-functional collaboration is encouraged and rewarded.• On my team, failure causes enquiry.• On my team, new ideas are welcomed.
CHAPTER 1: Principles
14

Studies have shown that Westrum culture is a significant predictor of IT per-formance (in the context of DevOps work) as well as organizational perfor-mance. High IT Performers have significantly higher Westrum scores than Medi-um and Low IT Performers. Higher scores are indicative of a generative (orperformance-oriented) culture, while lower scores are indicative of a bureau-cratic culture.
One closing question about the Westrum construct: What does it have to dowith information flow? Very few of the questions actually talk about informa-tion or communication… What this really comes down to is creating and foster-ing a culture of trust. Because once you work in an environment where youtrust those you work with, and you know they trust you, sharing informationjust happens. It is a byproduct of the intimacy that comes from honest commu-nication, egoless collaboration, shared objectives, learning, and welcoming adiversity of thought.
1.7.3 When to Measure Culture
Good practices suggest measuring at regular intervals. This allows for longitudi-nal analysis and comparisons across periods and quarterly or twice-yearlymeasurement is ideal. Organizational culture is known to be important for De-vOps transformations, and they give us insight into how a team is functioning –or how they think they’re functioning. It also can give us a hint into what maybe coming: preliminary results suggest certain aspects of organizational culture(such as the Westrum construct) can be a leading indicator for any upcomingchallenges.
For example, a dip in a team’s Westrum score that corresponds to a majorreorg may be expected, or at least would not be a complete surprise.However, a dip in a team’s Westrum score with no known explanation could in-dicate challenges in team dynamic or information flow that should be ad-dressed. If not addresses, automation and/or tooling challenges are likely forth-coming.
The key takeaway here is that whatever metrics you use, watch for how theyare changing. Progression, digression, or stability of your metrics are the key tolearning and improving.
1.7 Measuring Culture
15


Scenarios
2.1 Scenario 1: Moving to a SaaS Culture
Shanti is an engineering manager in an independent software vendor (ISV) thatis transitioning its product to a software–as-a-service (SaaS) offering. In thepast, her organization has already moved to agile teams and schedules andpractices such as a common product backlog. Now moving to the cloud, Shantiand her leadership are discovering that their telemetry and engineering practi-ces are inadequate for a SaaS business. They attack three areas of improve-ment:
1. Improving Live Site Health2. Understanding Usage3. Improving Engineering Flow and Reducing Engineering Debt
2.1.1 Live Site Health
Everything starts with Live Site. If the service is not available and performantfor its users, no one will use it and nothing else matters. Accordingly, every LiveSite Incident (LSI) is treated to very high scrutiny. For each LSI, Shanti meas-ures:
Time to Detect
Shanti believes that *our telemetry should spotany problem before the customer tells us*. Howlong does it take to identify that which users areaffected and how severely? Is this a single user,the worst .001 percentile, or a broad outage?
Time to Communicate
Shanti believes that customers need to knowthat we know. How long before we notify the af-fected users via our service blog and Twitter thatwe are working on the problem and what the ex-pected next steps will be?
17
2

Time to Escalate
Shanti’s philosophy is, You build it, you run it.How long before a member of the responsible de-velopment team is on the troubleshooting bridgeworking on a mitigation.
Time to Mitigate
Shanti believes that we operate 24x7x365 andcannot have downtime or slow performance.How long does it take us to restore the service inthe users’ eyes? Shanti watches the cumulativehours or days to solution by customer wheneverthere is a problem report.
Time to implement Learn-ing, Repair, and Prevention(at Root Cause)
If something went wrong, there is at least oneroot cause. Shanti believes in using 5 Whys to un-derstand what preventive actions we can take sothat this class of problem does not recur. We thenneed to identify the engineering items, add themto the backlog, and complete them within twosprints at most. And we need to measure our ef-fectiveness in the time to implement the learn-ings at root cause.
Total Customer Minutes Out-side SLA (service level agree-ment)
This is the performance measure from the cus-tomer point of view. How many minutes has theservice not responded within its SLA * the num-ber of affected customers within a given week?
Outlier Performance
The most telling cases are the slow ones. Shantiand the team study performance at the 95th,99th and 99.9th percentile to understand wheth-er there are special cases that make these usersexperience the service differently than the major-ity. These instances lead to more 5 Whys and pre-ventive actions.
Alerting Efficiency
An impediment to working on the right problemsis the phenomenon of redundant alerts or miss-ing alerts. Accordingly, Shanti pays careful atten-tion to alerting efficiency. Ideally, every LSIshould trigger an obvious and unique root causealert. Shanti and her team have implemented ahealth model to consolidate redundant alertsand pinpoint root cause to minimize false posi-tives. No human should have to triage alerts. Atthe same time, they are always scouring for gapsin telemetry which lack alerting, so that no prob-lems go undetected.
2.1.2 Usage
Having a high-quality live site experience allows Shanti and her team to lookclosely at business metrics and to experiment with improvements in the busi-
CHAPTER 2: Scenarios
18
ness. They think of this as a funnel, in which they start with the effectiveness ofacquisition of customers to first time trial use, then engagement, retention, con-version to ongoing subscription or premium offers. In addition, they are veryconscious of understanding and minimizing churn. To handle the business met-rics, Shanti’s team puts custom instrumentation around each of the importantbusiness scenarios to measure the business transitions.
A goal for Shanti’s team is to run the maximum number of meaningful experi-ments in the least time at the least cost. In other words, for each transition pointin the funnel, the team works on hypotheses how to improve the customer pull-through and retention. They will experiment by exposing the new version to acohort, and pivot or persevere based on observed behavior.
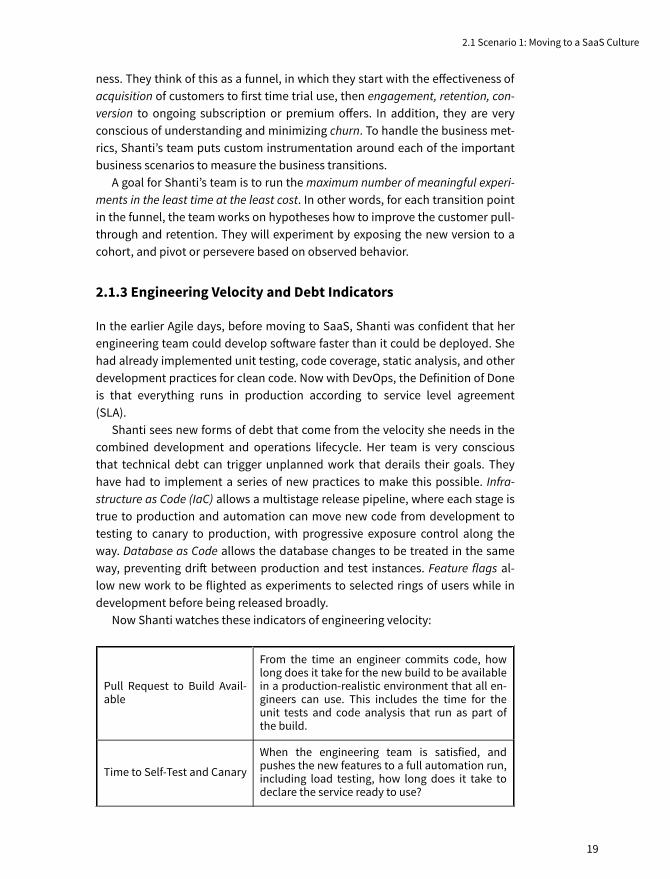
2.1.3 Engineering Velocity and Debt Indicators
In the earlier Agile days, before moving to SaaS, Shanti was confident that herengineering team could develop software faster than it could be deployed. Shehad already implemented unit testing, code coverage, static analysis, and otherdevelopment practices for clean code. Now with DevOps, the Definition of Doneis that everything runs in production according to service level agreement(SLA).
Shanti sees new forms of debt that come from the velocity she needs in thecombined development and operations lifecycle. Her team is very consciousthat technical debt can trigger unplanned work that derails their goals. Theyhave had to implement a series of new practices to make this possible. Infra-structure as Code (IaC) allows a multistage release pipeline, where each stage istrue to production and automation can move new code from development totesting to canary to production, with progressive exposure control along theway. Database as Code allows the database changes to be treated in the sameway, preventing drift between production and test instances. Feature flags al-low new work to be flighted as experiments to selected rings of users while indevelopment before being released broadly.
Now Shanti watches these indicators of engineering velocity:
Pull Request to Build Avail-able
From the time an engineer commits code, howlong does it take for the new build to be availablein a production-realistic environment that all en-gineers can use. This includes the time for theunit tests and code analysis that run as part ofthe build.
Time to Self-Test and Canary
When the engineering team is satisfied, andpushes the new features to a full automation run,including load testing, how long does it take todeclare the service ready to use?
2.1 Scenario 1: Moving to a SaaS Culture
19

Time to Deploy (by ring)
Shanti’s service deploys automatically acrossmultiple data centers, grouped in parallel “rings.”Progressive exposure and telemetry check thehealth of each ring before the next ring starts. Be-cause the database is an integral part of the ser-vice, and downtime is not allowed, deploymenthappens in multiple steps. Shanti carefullywatches the deployment time.
# Experiments/Release
Shanti is very conscious that the frequency of ex-periments the team can run, with exposure con-trol, is a key to the improvement of the service.She carefully monitors the success of the engi-neering system in allowing experiments to pro-gress and report results against the hypothesesunder test.
Upstream, predeployment, Shanti is making sure that her developmentteams are not allowing any debt to accumulate. There she watches measuressuch as:
Bug cap per engineer
For each area team, what is the average num-ber of active bugs per engineer? If it ever ex-ceeds an agreed cap, e.g. 5, all new work hasto stop, and all bugs need to be paid down be-fore new work can proceed. By the end of thesprint, the team needs to be clean with zeroactive.
# and % of bugs caught by testautomation, pass rate, andcoverage by release stage
Tests are code. Ideally all bugs are caught bytest automation and all automated tests runreliably. If the tests are flaky, they need to befixed. If they do not cover code paths previous-ly uncovered, they are redundant.
False Bugs / Missed Bugs dueto Environment Drift or Incom-pleteness
The production realism of the Release Pipelineis essential. If bugs escape because the envi-ronments are not set up correctly, then the en-vironment definitions need to be fixed.
# P0 or P1 bugs aged in buckets
All key issues discovered with the service needto be fixed promptly. These are aged. Shantiscrutinizes anything not fixed within the sprintto understand the delay. This is especially trueof security items and performance items, al-though it also applies to anything that will af-ffect the quality of service.
Shanti and her team know that this is an evolutionary journey, where every-thing is about trends and improvement. They are never done. They are their
CHAPTER 2: Scenarios
20

own harshest critics, and they are paranoid that if they do not keep improving,they will discover that someone else has beaten them. They collect as muchtelemetry as they can, and always look for more opportunities to deliver a bet-ter service.
2.2 Scenario 2: High Incident Volume
2.2.1 The Problem
With an organizational change, a team inherits several new online services re-sulting in 3,000 high severity alerts a week. The team is overwhelmed with thealerts. Each of the 3,000 alerts generates an automated phone call which goesto the on-duty team. The on-duty rotation becomes 24x7 job of getting callsand responding to alerts. Even worse while the team is triaging and fixing oneissue, several new issues will arise leading to more phone calls. The team feelsfrustrated and depressed. They are showing signs of being burnt-out.
2.2.2 Solution
The team decided that something must to be done. They decided the currentsituation was dire, and they called a meeting to decide on a drastic course ofaction. They needed to downgrade all alerts which were not customer impact-ing. For example an alarm indicating the worker process for a data ingestion jobhad timed out did not impact a customer. A new worker process would spawnin 30 seconds and resolve the issue.
First step: Eliminate false alarms by downgrading severity. These are inci-dents without customer impact. When the team found a noisy alert, they imme-diately downgrade the severity for all future alerts of that type. Metric is signal/noise ratio.
signal-noise-ratio = (total alerts - false alarms)/total alerts
The team felt good after the first day downgrading alerts. They were doingsomething. This effort remove the most frequent alarms and reduce daily vol-ume to 2,600 alerts a week.
2.2.3 Eliminate Redundant Systems
As a result of the organizational change the team inherited new online systemswith a completely different alerting and incident management pipeline. The on-
2.2 Scenario 2: High Incident Volume
21
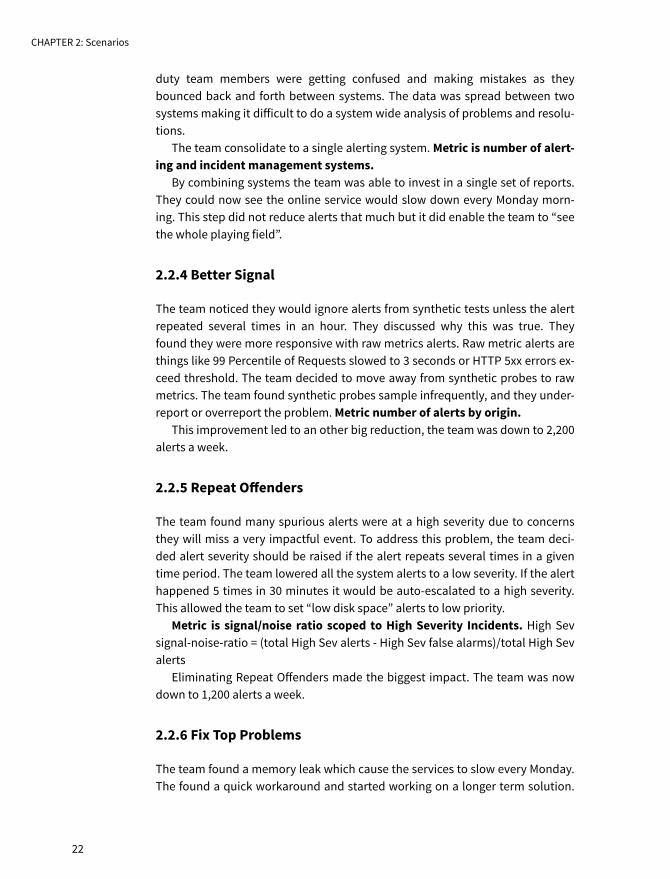
duty team members were getting confused and making mistakes as theybounced back and forth between systems. The data was spread between twosystems making it difficult to do a system wide analysis of problems and resolu-tions.
The team consolidate to a single alerting system. Metric is number of alert-ing and incident management systems.
By combining systems the team was able to invest in a single set of reports.They could now see the online service would slow down every Monday morn-ing. This step did not reduce alerts that much but it did enable the team to “seethe whole playing field”.
2.2.4 Better Signal
The team noticed they would ignore alerts from synthetic tests unless the alertrepeated several times in an hour. They discussed why this was true. Theyfound they were more responsive with raw metrics alerts. Raw metric alerts arethings like 99 Percentile of Requests slowed to 3 seconds or HTTP 5xx errors ex-ceed threshold. The team decided to move away from synthetic probes to rawmetrics. The team found synthetic probes sample infrequently, and they under-report or overreport the problem. Metric number of alerts by origin.
This improvement led to an other big reduction, the team was down to 2,200alerts a week.
2.2.5 Repeat Offenders
The team found many spurious alerts were at a high severity due to concernsthey will miss a very impactful event. To address this problem, the team deci-ded alert severity should be raised if the alert repeats several times in a giventime period. The team lowered all the system alerts to a low severity. If the alerthappened 5 times in 30 minutes it would be auto-escalated to a high severity.This allowed the team to set “low disk space” alerts to low priority.
Metric is signal/noise ratio scoped to High Severity Incidents. High Sevsignal-noise-ratio = (total High Sev alerts - High Sev false alarms)/total High Sevalerts
Eliminating Repeat Offenders made the biggest impact. The team was nowdown to 1,200 alerts a week.
2.2.6 Fix Top Problems
The team found a memory leak which cause the services to slow every Monday.The found a quick workaround and started working on a longer term solution.
CHAPTER 2: Scenarios
22
They repeated the same process for the top 3 alert categories. Metric is TopCorrelation by Incident Volume.
By fixing the top 3 causes of alerts the team was able to reduce alerts to 600a week.
2.2.7 Success
By using these metrics the team was able to reduce their high severity incidentsfrom 3,000 a week to 600 a week. A huge improvement. Now the team has 90alerts a day. Now they have time to look into the real issues and fix the true un-derlying problems.
• Metric is signal/noise ratio• Metric is number of alerting systems.• Metric number of alerts by origin• Metric is signal/noise ratio scoped to High Severity Incidents• Metric is Top Correlation by Incident Volume
2.3 Scenario 3: Complex Integration Test Problems
2.3.1 The Problem
A large telecommunications organization with tens of millions of customers hashundreds of retail stores. One of the most critical applications is called CoFEE,which is used by every retail employee to support customers, by customer ser-vice representatives in call centers, and by technicians in the field.
This application is been written over decades, and is a client-server system,which interfaces with over 600 backend applications, including store catalog,customer service, support, billing, customer provisioning, etc. Many of thesebackend systems are decades old, running on mainframes, as part of an acquis-ition, also decades ago.
To support organizational needs, there would be one major software releaseevery two months — releases were often problematic, requiring long test timesand often longer than desired recovery times when something went wrong.
The evidence of the problem were measured as followed:
• Long code integration and test times• Low deployment and release frequencies (every 2 months)• Poor release outcomes -- High number of post-change incidents -- High
number of major customer impacting incidents -- Low release successrates
2.3 Scenario 3: Complex Integration Test Problems
23

2.3.2 The Solution
Decoupling from Constraints
One of the top problem areas identified were the billing systems: this was animportant system of record, with long lead times, because everyone was de-pendent on changes on the billing system. While new offers or capabilitiescould be designed for customers, attendant changes to the billing and down-stream systems required that work to get slotted into an enterprise release cal-endar where each change drove multiple prioritization conversations - witheach change causing cascading scheduling impacts.
As a result, the billing system was a constraint, with commitments andpromises made for the next six months, with competition and contention forthose scarce cycles.
The team set out to migrate from a client-server application to a .NET webapplication, and selected 120 interfaces to move to a SOA model, accessed viaAPI gateways. The goal was to enable better architectural isolation, enable bet-ter testing and accountability, and decouple the release cadences of the differ-ent services.
Accelerating the Changes
The team took the primary user facing application that was now web based andidentified the types of changes that could proceed without backend interac-tions. Based on the need for the changes, additional areas of functionality likethe product catalog and caching of bills for display were split out into separatesmaller decoupled applications. This left the core billing systems just doing bill-ing and metering.
In addition, this also allowed each individual team to build their applica-tions with technologies that were best suited to their development needs andtheir skills. Each application team was also able to make architecture decisionsindependently allowing appropriate scaling patterns.
2.3.3 Success
By using these decoupling actions, the team was able to speed up applicationdeployments. The key indicators of success for the customer facing teams werethat the teams:
• moved to weekly releases
CHAPTER 2: Scenarios
24

• defined features and capabilities in the application that were not tied in-to enterprise release model
• built automation to deploy these changes faster• enabled testing in isolation for non-coupled changes allowing for better-
quality designed features• toggles user-facing features supporting 40K call center reps
Accelerating the Changes
25

3 The Value of Measurement
Successful software outcomes depend on negotiation of requirements, accu-rate scoping of work, value judgments, innovations, team collaboration, soft-ware architecture, economic tradeoffs and user demand. Success is less depen-dent on contract quality, Gantt charts, critical path schedules, earned-valuemeasurement, laws of physics, material properties, mature building codes, andcertified engineers. Stated another way, steering software delivery projects ismore a discipline of economics than it is of engineering. Unlike most mature en-gineering disciplines, software delivery is a nondeterministic endeavor withmore uncertainty to be managed.
What is measurement?
Scientists define measurement as an observation that reduces uncertain-ty, where the result is expressed as a quantity (Hubbard, 2010).
Taking action earlier in the project life cycle is a recurring attribute found inmost successful software development efforts. Early efforts to reduce uncer-tainty and seize opportunity validate learning and increase the probability ofsuccess. To progress on this front, this paper makes a case for a core measure-ment foundation of software-based systems. This foundation will proposestronger practices and tooling that specifically address a few key themes:
• measurement of process time and lead time
• quantifying uncertainty or complexity
• forecasting outcomes probabilistically
• evaluating drivers of organizational health
27
3

3.1 Improved measurement can increase trust insoftware delivery.
Quantifying software progress and quality can lead to more honest and trust-worthy exchanges among constituencies. Trust is the currency of lean engineer-ing efficiency. Trust is earned when we combine integrity and competence.Measurements with an accepted basis of theory and practice are easier to trust.The software development industry does not have enough accepted theory,and it has an ever changing set of practices.
3.2 Improved Measurement Can Enable BetterDecision Making and Steering.
Software delivery involves tradeoffs across multiple competing dimensions.While some decisions can positively affect all dimensions, most decisions aretradeoffs based on quantifiable optimizations. Without objective measure-ments, decision-making centers on subjective guesswork. Better user experien-ces and better business outcomes will always require expert judgement. Teamscan play better offense (exploiting opportunities) and better defense (manag-ing risks and uncertainties) by incorporating objective evidence from metrics in-to their judgments in steering.
3.3 Getting Started
We are excited by the possibilities of standardizing metrics for software engi-neering. Translating this excitement into action raises the obvious question,where do we start and how do we drive better judgment through metrics andmeasurements? This is a complicated topic which deserves a complete analysisof the challenges and practical tools and techniques that will make an impactin your organization. Adoption of measures and metrics will be covered in fu-ture papers and presentations. We look forward to your feedback and contin-ued support in driving standard measures and metrics for software engineer-ing.
CHAPTER 3: 3 The Value of Measurement
28
References
• Westrum, R. (2004). A typology of organisational cultures. Quality andsafety in health care, 13(suppl 2), ii22-ii27. Retrieved from http://www.ncbi.nlm.nih.gov/pmc/articles/PMC1765804/pdf/v013p0ii22.pdf.
• Forsgren Velasquez, N., Kim, G., Kersten, N., & Humble, J. (2014). 2014State of DevOps Report. Puppet Labs and IT Revolution.
• 2015 State of DevOps Report. (2015). Puppet Labs and IT Revolution.• Martin, Karen and Mike Osterling. Value Stream Mapping: How to Visualize
Work and Align Leadership for Organizational Transformation, (McGraw-Hill Education, 2013) p. 71.
29
A


Collaborators
• Dominica DeGrandis, Director, Learning & Development, LeanKit• Nicole Forsgren, PhD, Director Organizational Performance and Analytics,
Chef• Sam Guckenheimer, Product Owner, Visual Studio Cloud Services, Micro-
soft• Mirco Hering, DevOps Lead APAC, Accenture• Mark Michaelis, Chief Technical Architect, IntelliTect• Chivas Nambiar, Director DevOps Platform Engineering, Verizon• Eric Passmore, CTO MSN, Microsoft• Walker Royce, Software Economist• Jeff Weber, Managing Director, Protiviti
31
B

Acknowledgments
IT Revolution wishes to thank the following sponsors for making the DevOpsEnterprise Forum possible.
We wish to thank all the participants of the 2015 DevOps Enterprise Forum
• Steve Barr, Executive Director, Operations at CSG International
• Ross Clanton, Senior Group Manager, Target
• Jason Cox, Director of Systems Engineering, The Walt Disney Company
• Dominica DeGrandis, Director, Learning & Development, LeanKit
• James DeLuccia, Director and Leader for Certification Services, EY Certify-Point
• Jason DuMars, Senior Director of Technical Operations, SendGrid
• Paul Duvall, Chairman and CTO, Stelligent, Author of Continuous Integra-tion and DevOps in AWS
33
C
• Damon Edwards, Managing Partner DTO Solutions, Inc
• Nicole Forsgren, PhD, Director Organizational Performance and Analytics,Chef
• Jeff Gallimore, Partner, Excella Consulting
• Gary Gruver, President, Practical Large Scale Agile LLC
• Sam Guckenheimer, Product Owner, Microsoft
• Mirco Hering, DevOps Lead APAC, Accenture
• Christine Hudson, Solutions and Product Marketing, Rally Software
• Jez Humble, Owner, Jez Humble & Associates LLC
• Mustafa Kapadia, DevOps Service Line Leader, IBM
• Nigel Kersten, CTO, Puppet
• Gene Kim, Author and Researcher
• Courtney Kissler, Vice President of E-Commerce and Store Technologies,Nordstrom
• Dave Mangot, Director of Operations, Librato, Inc.
• Mark Michaelis, Chief Technical Architect, IntelliTect
• Heather Mickman, Senior Group Manager, Target
• Chivas Nambiar, Director DevOps Platform Engineering, Verizon
• Steve Neely, Director of Software Engineering, Rally Software
• Tapabrata “Topo” Pal, Product Manager, CapitalOne
• Eric Passmore, CTO MSN, Microsoft
• Mark Peterson, Sr. Director, Infrastructure Engineering & Operations,Nordstrom
• Scott Prugh, Chief Architect, CSG International
• Terri Potts, Technical Director, Raytheon IIS Software
• Walker Royce, Software Economist
• Jeremy Van Haren, Director of Software Development, CSG International
• Jeff Weber, Managing Director, Protiviti
• James Wickett, Sr. Engineer, Signal Sciences Corp
• John Willis, Director of Ecosystem Development, Docker
• Tim Wilson, Solution Architect, IBM
• Elizabeth Wittig, Field Solutions Engineer, Puppet
• Julie Yoo, Vice President, Information Security Compliance, Live Nation`
Appendix C, Acknowledgments34

And we would also like to acknowledge the organizers, scribes, editors, anddesigners who lent their support and attention to make the event and these ar-tifacts possible:
Alex Broderick-Forster, Alanna Brown, Robyn Crummer-Olson, William Her-tling, Aly Hoffman, Todd Sattersten, and Brian David Smith.
3.3 Getting Started 35