
Mean Stress and the Exhaustion of Fatigue-Damage … STRESS AND THE EXHAUSTION OF FATIGUE-DAMAGE...
20
NASA Technical Memorand.um__!013 !l ........ Mean Stress and the Exhaustion .... of Fatigue-Damage Resistance _ Lewis Research Center ................ Cleveland Ohio November 1989 , =_ (NA_A-TM-101311) MEAN STRESS ANO THE N90-13819 " EXHAUSTION OF FATIGUE-DAMAG_ R_SISTANCE (NASA) 18 p CSCL 20K Uncl as G3/39 0252602 https://ntrs.nasa.gov/search.jsp?R=19900004503 2018-06-27T03:16:01+00:00Z
Transcript of Mean Stress and the Exhaustion of Fatigue-Damage … STRESS AND THE EXHAUSTION OF FATIGUE-DAMAGE...
NASA Technical Memorand.um__!013 ! l ........
Mean Stress and the Exhaustion ....
of Fatigue-Damage Resistance
_ Lewis Research Center
................ Cleveland Ohio
November 1989
, =_ (NA_A-TM-101311) MEAN STRESS ANO THE N90-13819
" EXHAUSTION OF FATIGUE-DAMAG_ R_SISTANCE
(NASA) 18 p CSCL 20KUncl as
G3/39 0252602
https://ntrs.nasa.gov/search.jsp?R=19900004503 2018-06-27T03:16:01+00:00Z
MEAN STRESS AND THE EXHAUSTION OF FATIGUE-DAMAGE RESISTANCE
Avraham Berkovits*
National Aeronautics and Space AdministrationLewis Research Center
Cleveland, Ohlo 44135
r-.oc,')
,:ti
L_
SUMMARY
Mean-stress effects on fatigue llfe are critical In isothermal and thermo-
mechanically loaded materials and composites. Unfortunately, existing mean-
stress Iife-predlctlon methods do not incorporate physical fatigue-damage
mechanisms. An objective of this paper is to examine the relation between
mean-stress-lnduced damage (as measured by acoustic emission) and existinglife-predlction methods. Acoustic emission instrumentation has Indicated that,
as with static yieldlng, fatigue damage results from dlslocatlon bulldup andmotion until dislocation saturation is reached, after which vold formation and
coalescence predominate. Correlation of damage processes with similar mecha-
nlsms under monotonic Ioadlng led to a reinterpretation of Goodman diagrams for
40 alloys and a modlfIcatlon of Morrow's formulation for llfe prediction under
mean stresses. Further testing, using acoustic emission to monitor dlslocatlon
dynamics, can generate data for developing a more general model for fatigueunder mean stress.
INTRODUCTION
Significantly large mean stresses can develop under creep-fatlgue loadingconditions at high temperatures. Thls Is especially so under thermal and
bithermal cycling, wherein the ratlo of elastic to plastic stralnrange can
vary between the tension and compression halves of the cycle (ref. I). Mean
stresses that develop during large inelastic straln cycles tend to be Ineffec-
tive In Influenclng cyclic llfe. Under low stralns, however, mean stresses can
influence crack-lnltiation fatigue lives to a greater extent than do creep
effects. When the mean stresses are tensile, crack-lnltlatlon llfe is short-
ened and accurate prediction of this effect becomes of prime Importance.
Different mean-stress effects have been documented for a variety of mate-rials and testlng techniques wlth the result that numerous mean-stress theories
have emerged for nomlnally elastic, isothermal, hlgh-cycle fatigue loading.
Additionally, it has been suggested that, for elastlc thermal cycling, mean-
stress effects may be estimated by replacing the mean-stress ratio (see ref. 1)
In the Morrow mean-stress relation (ref. 2) wlth the analogous mean elastlc
strain ratio. The mean elastic strain appears In the equation as a linear
effect In thermal cycling, as does mean stress in the elastic Isothermal case.In Isothermal fatigue, the two formulations are, of course, identical.
The Morrow mean-stress formula must be further modified for thermomechanl-
cal cycling In the Inelastic, low-cycle regime. Inelastic strain cycling
Involving plasticity and creep strain introduces stralnrate-dependent flow
*Natlonal Research Couhcil - NASA Research Associate, on leave from
Technion - Israel Institute of Technology, Halfa, Israel.
strengths. Also, the ratio of inelastic stralnrange to elastic stralnrangehas been shownto be significant in governing the amountof meanstress thatcan develop and be sustained (ref. l). These parameters are closely relatedto the structural and metallurgical changes taking place In the mlcrostructuredurlng cycling.
In manyengineering applications, Inelastic strain cycling phenomenaareminimal because fatigue lives are in the nominally elastic, hlgh-cycle regime.Nevertheless, even In the hlgh-cycle fatigue regime, damageIs Incurred byplastic deformation mechanisms,and, if the temperature Is sufficiently high,by creep and oxidation. However, the inelastic strains that are developed maybe too small to be discerned by conventional laboratory extensometry.
A research effort was Initiated in which the effects of various fatigueparameters were isolated and evaluated. Parametric influence on the develop-ment of meanstresses and their subsequent effect on isothermal and thermo-mechanical fatigue llfe were determined. An attempt was madeto formulate amodel representing the observed responses. Thls report also contains a reviewof mIcroscbpic fatigue damagemechanismsand their relation to a macroscopicresponse that Is measurable In the mechanical testing laboratory. Particularattention Is given to the slgnlficance of acoustic emission as a measureofdlslocatlon dynamics. An outline is proposed for using acoustic emission dataobtained in strength tests for predicting crack-lnltlatlon fatigue llfe in thepresence of meanstress In fatlgue situations. The emphasis is on hlgh-cyclefatigue, where mean-stress effects are particularly large.
MeanStress in Classlcal Isothermal Fatigue
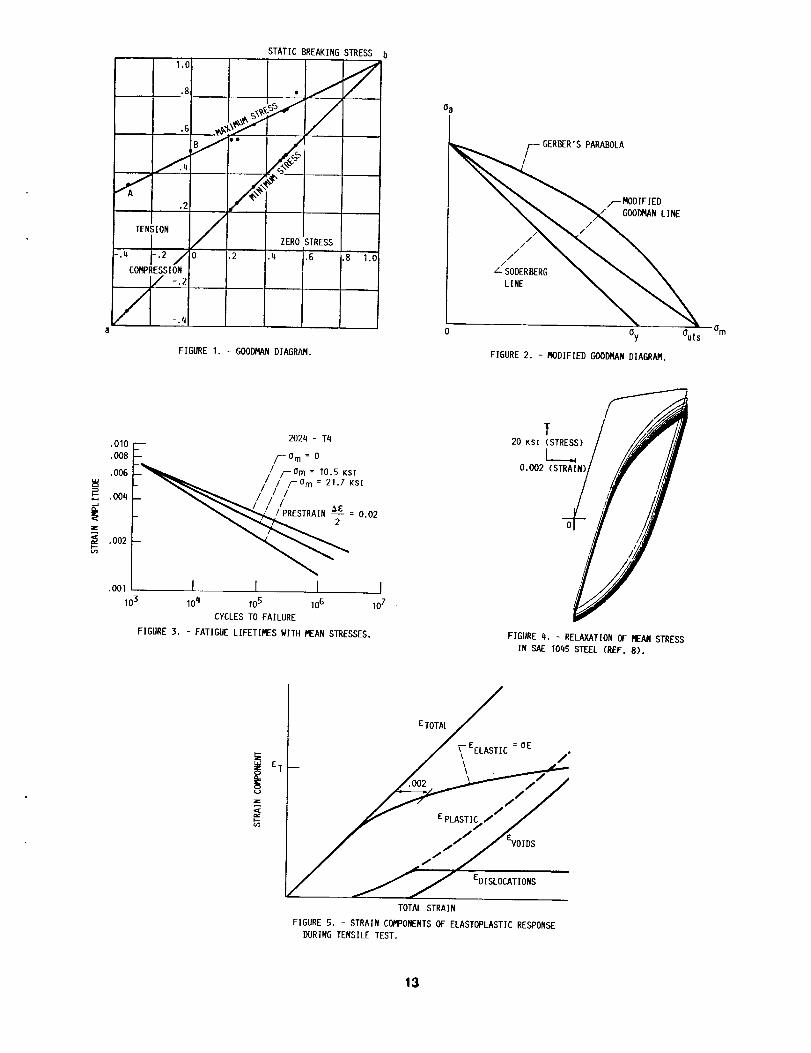
The fact that meanstresses affect fatigue llfe was recognized almostImmediately after the fatigue problem was first recognized. W_hler reportedthe first fatigue test data in 1870, and by 1874 Gerber publlshed results whichshowedthat tensile meanstress shortens fatigue llfe. John Goodman,in hisbook "Mechanics Applied to Engineerlng" (ref. 3), presented a graph (fig. l)which showedthe effect of meanstress upon the 4xlO -cycles-to-failure endur-ance limit of steel. Thls type of graph was later modified by others todescribe the effect of meanstress at any llfetlme, and becameknownas themodlfled Goodmandiagram (fig. 2).
It is well knownthat the influence of mean stress on fatigue life is a
functlon of the stress (or strain) amplitude relative to material yielding.
Although at moderate-to-low ampiltudes tensile mean stresses shorten llfe and
compressive mean stresses lead to longer lives, their effect tends to disappear
at hlgh amplitudes In low-cycle fatigue (fig. 3 and ref. l). In a relatedeffect, mean stresses cannot be sustained for long under high-amplltude,
straln-controlled cycling, but soon cyclically relax, tending toward a symmet-
rlcal stress cycle about zero stress (flg. 4).
Damage Mechanisms
In order to understand the nature of the mean-stress effect in fatigue,
the various damage stages occurring durlng fatigue must be considered. Com-
monly, fatigue life is characterized by outward evidence of fatigue damage andis divided into two stages, crack initiation and crack propagation. On the
other hand, the various Internal damageprocesses are related to the mecha-nisms that control cyclic plastic deformatlon (ref. 5).
Dislocation dynamics are responsible for Initiating plastlc deformation inthe low stralnrange. Manypure metals and fully soluble metal alloys exhibita type of plastic deformation that occurs in parallel sllp bands and is inducedby ordered dislocation glide (refs. 6 and 7). Most engineering alloys deformplastlcally becauseof dlslocation multiplication and cross s11p. These plas-tic deformation mechanismsare only dlscernible at electron-mlcroscope magnlfi-cation levels (ref. 8). Regardless of whether one or both of these damageprocesses are operating In a given material, sufficient dislocatlons eventuallycoalesce in various 1ocatlons to form a numberof voids, or microscopic cracks.At this stage, there are so manydlslocations in the material lattice structurethat the back stress set up in the stress fleld around the voids inhibits fur-ther dislocation multiplication and momentumchange. At this point, evldenceof strain hardening is seen.
Further plastic deformation results from void migration and mlcrocrackcoalescence rather than from dislocations. After sufficlent coalescence hasoccurred, a third stage of fatigue damagesets in, as one or more of the micro-cracks reaches a length that Is visible to the naked or optically asslsted eyeand becomesa "well-behaved" crack. This point deflnes the crack-lnltiationfatigue life and is the result of three consecutive fatigue-damage mechanisms.
The final phase of fatigue damageoccurs as the dominant crack grows Inlength under continued cyclic loadlng, eventually reachlng the "critical crackslze" at which separatlon occurs because the materlal or structure can nolonger support the applied load. The numberof cycles required to traversethis phase defines the macroscopic crack-propagation llfe. This is dealt withby fracture mechanics methods and is not discussed herein. The present worktreats only the earlier fatlgue-damage mechanismsthat lead to crackinitiation.
Fatigue Damageand Static-Load Damage
From the foregolng discussion it appears that the crack-lnltlation portionof fatigue life is dominated by two damagemechanisms: dislocation dynamics,followed by void growth and coalescence. The samemechanismsof plastic damageare responsible for the yielding and straln-hardenlng phenomenaobserved inductile materials under monotonic loading. As the material is loaded, thenumberof mobile dislocations begins to increase and the stress-straln responsedeviates from the elastic line at the proportional limit. From this point on,the intensity of dislocatlon activity increases with load, reaching a peakbefore the 0.2 percent yield stress is achleved. Soon after the yield stressis passed, dislocation density is saturated and dislocation movementreachessteady state. (It is worthy of note that the materlal acoustic emission showsrate characteristics similar to those of the dislocation density rate. Thissimilarity will be utilized in a subsequent section.) Further plastic strainin the strain-hardenlng region is due to the growth of voids.
The slgnlfIcance of the parallels between fatigue-damage mechanismsandmonotonic plastlclty processes can be appreciated if these mechanismsarerelated to the stralnranges in whicM,they operate. Figure 5 Is a representa-tive model of the various strain componentsin monotonlc stress-straln behavior
3
of a typical material. At low stress, before bulk plastic deformation occurs,all the strain Is nominally elastic, and the elastlc-straln llne follows thetotal-straln line at 45° to the horizontal axis. It begins to deviate from
the 45 o slope at the proportional limit when dislocation dynamics begins to
cause pIastlc strain. By the time 0.2 percent plastic strain has beenInduced, the dlslocatlon-caused strain rate has approached a saturated level
that may or may not be zero. Dislocatlon-drlven strain contribution decays
prior to the 0.2 percent yield point because it is superseded by vold-drlvendeformation. Hardening continues as the plastic strain increases, until the
plastlc-straln curve In figure 5 reaches a slope of 45°, at which time theelastIc-straln curve will become horizontal. However, In most materials, fail-
ure occurs before this happens.
Failure due to fully reversed cycllc loading may be considered by studying
the typical log straln-log life curve, represented In figure 6 by the Morrow
formulation (ref. 2), and slmilarly by Manson (ref. 9) as the method of Univer-
sal Slopes. The total strainrange is the arithmetic sum of the elastic andthe plastlc stralnrange components. The plastic strainrange Is dominant In
low-cycle fatigue, whereas the elastic strainrange dominates In hlgh-cycle
fatigue. A transition point, 2NT, Is defined when the elastic and plasticstrain components are equal. The strain, cT, corresponding to the transltlon
point Is marked In the monotonic response curve of figure 5.
Note that the point at which elastic straln and plastic strain are equal
may occur well beyond the 0.2 percent yleld polnt and Is out of the range ofmost aeronautlcal appIicatlons. In the case of fatigue loading as well, prac-
tlcal applications frequently fall considerably to the right of 2NT In flg-ure 6, In the region dominated by elastic deformation. At one decade beyond
2NT, the plastic strain constitutes less than 25 percent of the total strain.Nevertheless, It reflects the dislocation dynamics responsible for crack-
Initiation 11fe, just as the proliferation of dislocations is the cause ofInitlal yielding In the monotonic case. Furthermore, crack-lnitiatlon lifegenerally accounts for more than 80 percent of llfe to fallure In the elasticregion.
ACOUSTIC EMISSION AND DISLOCATION MOTION
In order to assess incremental damage withln a test specimen during mono-
tonic or cyclic deformation, measurement Is required of some physlcal param-eter whose rate of accrual reflects the rates at which the damage processes
occur. At present, no englneerlng method is readlly available for monltoring
vold formation and development during a mechanical test.
On the other hand, the use of acoustlc emission (AE) measurement tech-
niques has become recognized and accepted (refs. lO to 12) as a relative meas-
ure of the amount of dislocatlon activity In a material specimen. These tech-
niques are based on the fact that dislocation multiplicatlon and motion createminute sounds that are discernible with sensitive acoustic Instrumentation.
Thus, as the number of free dislocations begins to multiply and the material
starts to yleld plastically, the material emlts acoustlcally in proportion to
the number of dlslocatlons in motion at a given instant.
Figure 7 shows the monotonic response of a typical ductile materlal(ref. I0). Dislocation motion begins near the materlal proportlonal limit and
4
i7T!
goes through a maximum at a strain near the middle of the knee of the stress-strain curve. The integral of this rate defines the total free dislocationdensity count, a curve whose shape reflects the dislocatlon-drlven straincurve in figure 5. The curves representlng rate of acoustlc emission andtotal AE count in figure 7 are proportional to free dislocation density rateand total count curves, respectlvely. Clearly, a def|nitlve relationship formonotonic ]oadlng can be formulated between the plastlc straln occurring inthe knee of the stress-strain curve as a result of dislocation motion and theacoustic emlsslon of the material during yielding.
The stress and strain history and the corresponding rate of acoustic emls-slon during the early cycles of a low-cycle fatigue test on 99.5 percent purepolycrystalline aluminum under symmetric strain cycling (ref. 13) are shown infigure 8. The strain amplitude of ±0.05 was high and resulted in the materl-al's y_eldlng during both tension and compression. After the masslve acoustlcemission during initial loading, there was an additional acoustic occurrenceduring each subsequent ylelding in either direction. The emlsslon peaks wereapproxlmateiy equal during subsequent yielding and dropped to the background]eve] (near zero output) during elastic loading and unloading. The almost sym-metrical response indicates the facility with which the direction of dlsloca-t|on motion is reversed under the cyclic shear conditions set up. This is typ-Ical of many metals and fully soluble alloys.
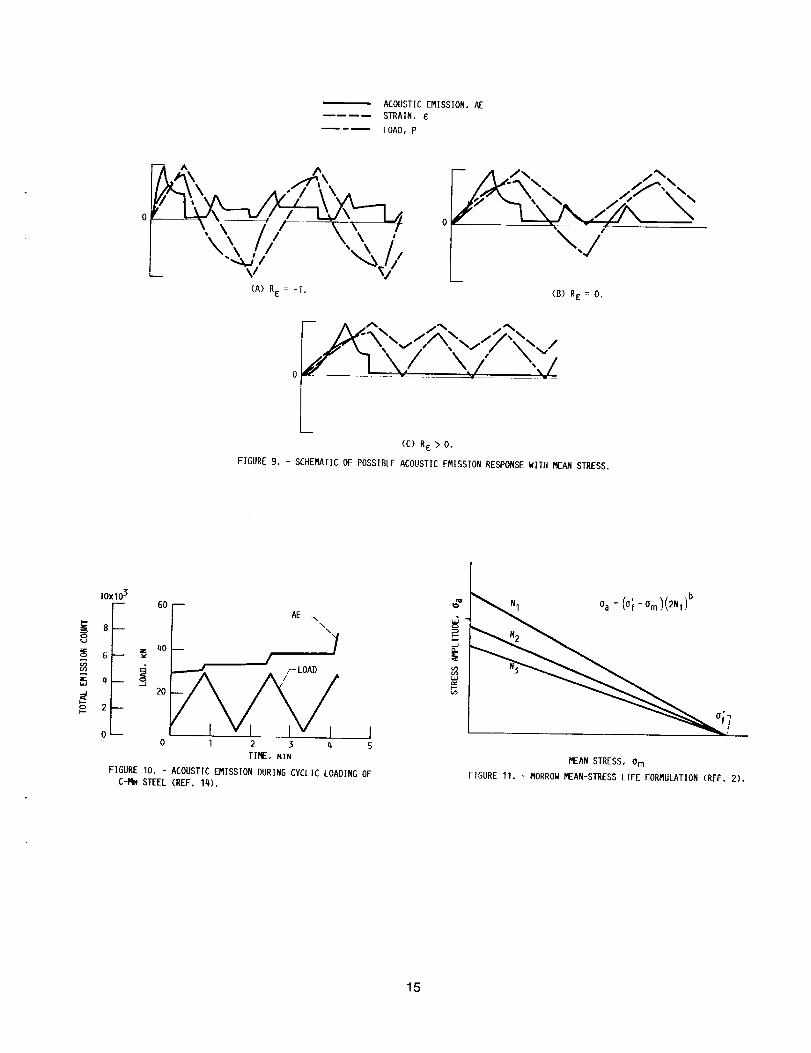
What would be the expected acoustic emlsslon response under lower andunsymmetrlc load conditlons? The acoustic emission during the Initla] cycle ofthe symmetric loading in figure 8 (shown schematically In fig. 9(a)) Is highbecause of bulk yielding in the materlal. Under lower symmetrical strainamplitudes, one would expect lower AE peaks corresponding to incipient yleld-Ing. Positive mean strain (e.g., Rc , O, as shown schematically In fig. 9(b)),although leading to some asymmetry in stress extrema, causes yielding at bothtension and compresslon reversals at large stralnranges. Thus, the acousticemission in this case would be expected to be similar to that obtained fromsymmetrical straining.
At low amplltudes (fig. 9(c)) compresslve yielding may not occur, and
acoustic emission would be recorded only during tenslle loading. Because dis-1ocatlon motion in this case would be largely unldirectlonal, the lifetime to
saturation, and subsequently to fracture, would be reduced. This effect will
probably be even more evident under unsymmetrical stress-cycling condltions.
When the stress ratio Ro Is significantly greater than -l, no compressiveyleldlng occurs and the phenomenon of cyclic straln ratchetting may be
observed. Again, If dislocation saturation does not occur as the result of
extensive ylelding during the Initial cycle, further acoustic emlsslon should
be recorded during loading in subsequent cycles until saturatlon is reached.Such a case is shown for carbon-manganese steel (ref. 14) in figure 10, where
tensile load reversals produced further acoustic emission until a fatigue crack
initiated at a notch. (Because of local compresslve yielding at the notch,
some AE was noted at times at the minimum load as well. However, It appearedthat before crack initiation, the acoustic emission was essentially the result
of tensile, rather than compressive, yieldlng.)
In general it may be conjectured that for metal alloys the dlslocatlon-related fatigue damage which leads to fatigue crack initiation is a function
of the maximum strain and stress reached relative to an appropriate yield
criterion. The fatlgue-damage rate depends on the rate of dislocatlon satura-
tion, which, in turn, is a function of a cyclic parameter such as amplitude.
This proposal requires further substantlatlon. In this regard it is of Inter-
est that the Goodman diagram In its orlglnal form (fig. l) defined maximum
applied stress at the endurance llmlt as a functlon of minimum stress as the
only cyclic parameter. From the foregolng discussion it appears that the peakstress Is a primary parameter affecting the degree of physical damage in a
material, and its significance is at least equal to that of the mean stress.
MEAN-STRESS LIFE PARAMETERS
The crux of the preceding discusslon Is that fatigue damage consists of
the gradual exhaustion of dislocatlon-lnduced ductile yielding. Such yielding
can occur rapidly, either during initial loading or more gradually at the ten-
sile peak of discrete cycles. Morrow (ref. 2) has related the exhaustion con-
cept to the elastic term of the Manson-Coffin relationship In order to predict
the effect of mean stress on fatigue life. In terms of stress, hls modifica-tion takes the form
oa - _o_- Om_2Nf) b (I)
!
where oa, of, and om are stress amplitude, a fatigue-related material
strength constant, and the mean stress, respectively; 2NF is the number of
reversals to crack initiation; and b, a material constant, represents the
slope of the basic isothermal (log-log) fatigue curve. For any given lifetime
Nf, equation (1) defines a proportlonal relationship between stress amplitude
and mean stress that is dependent on the fatigue-related strength parameter,
as in figure ]l, a figure immediately recognized as a modlfled Goodman diagram.
As om approaches o_, the amplitude oa goes to zero.
Although logic dictates that this relationship is reasonable, the fact is
that for most materlals the apex of the Goodman diagram along the mean-stress
axls does not usually lie at either o_ or even OUTS. Table I presents a
comparison of the fatlgue-related strength paramater o_ and a mean-stress-!
related strength constant om, representing the actual apex on the Om-aXis,
for 40 metal alloys. Data for these materlals were taken from modified Goodman
diagrams appearing in references 15 and 16. Note that for temperatures above
approximately 0.4 of the melting temperature (i.e., in the region in whichintracrystal]Ine dislocation dynamlcs are supplanted by graln-boundary sliding
as the primary deformation mode), the strength parameters in table I become
dependent on frequency as well as on cycle count.
I
There is no clear correlation between the mean-stress constant om and
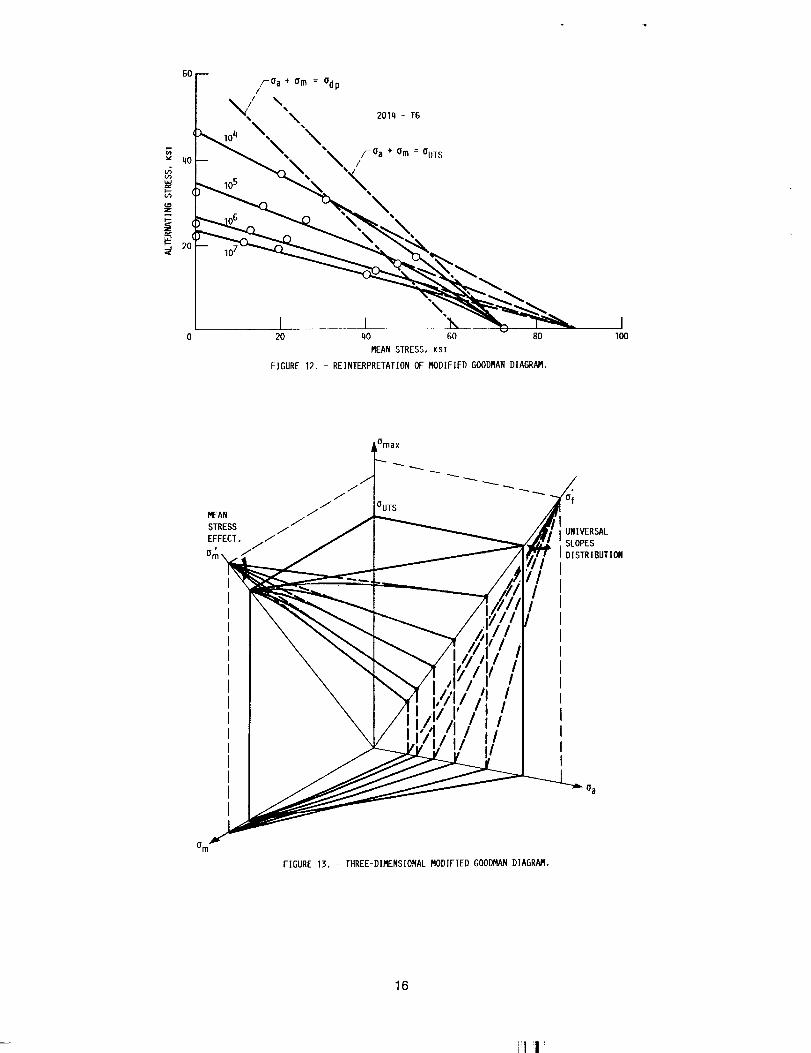
elther o_ or the monotonic strength oUT S. A typical modified Goodman
diagram is shown in figure 12, in this case for 2014-T6, for which
o_ = 123 ksi. When the maximum applled stress (the sum of amplitude and mean
stress) is elastic and below the proportional limit, the constant-llfe curves
are Indeed linear and tend toward a common polnt (o_ : 89 ksi) on the mean-
stress axls. However, when the maximum stress Is in the plastic regime, the
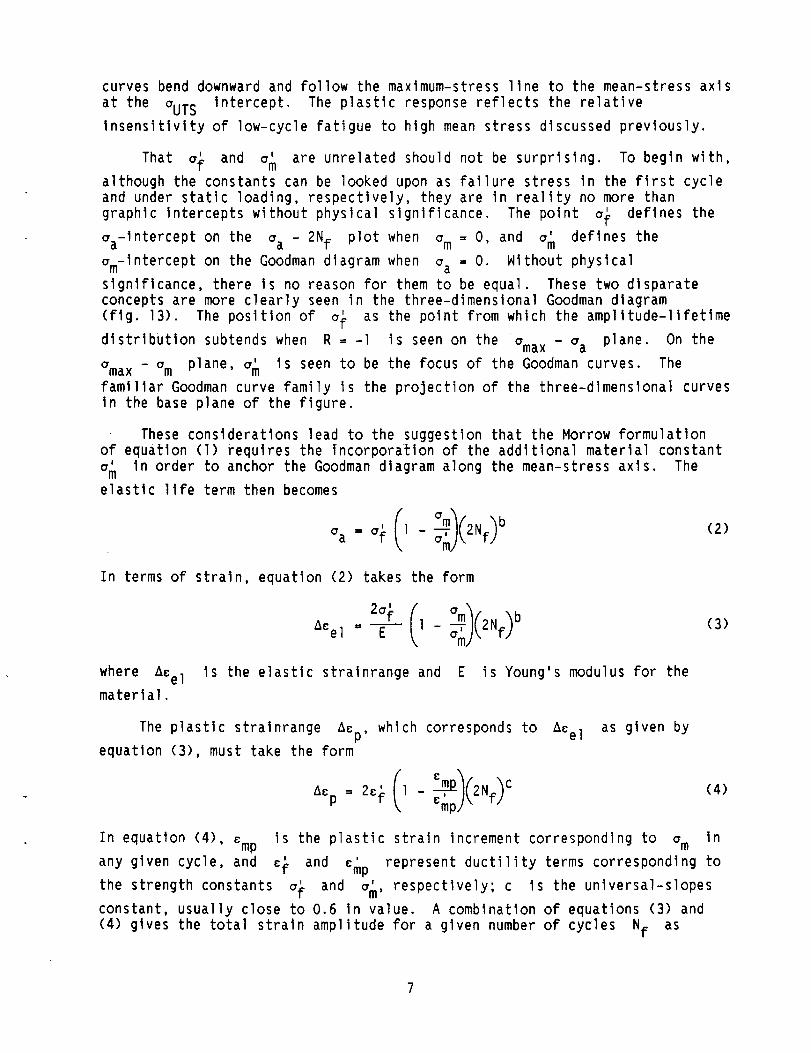
curves bend downwardand follow the maxlmum-stress 11ne to the mean-stress axlsat the GUTS intercept. The plastic response reflects the relativeInsensitivity of low-cycle fatigue to high meanstress discussed previously.
I
That a_ and am are unrelated should not be surprising. To begin with,
although the constants can be looked upon as failure stress in the first cycle
and under static loading, respectlvely, they are In reallty no more than
graphic intercepts without physical significance. The point a_ defines the!
aa-lntercept on the aa - 2Nf plot when am = O, and am defines the
am-lntercept on the Goodman diagram when aa = O. Without physical
significance, there Is no reason for them to be equal. These two disparate
concepts are more clearly seen in the three-dimenslonal Goodman diagram
(fig. 13). The position of a_ as the point from which the amplltude-lifetlme
distribution subtends when R = -I is seen on the ama X - aa plane. On theI
ama X - am plane, am is seen to be the focus of the Goodman curves. The
famlliar Goodman curve family is the projection of the three-dlmenslonal curves
in the base plane of the figure.
These considerations lead to the suggestlon that the Morrow formulation
of equation (I) requires the Incorporation of the additional material constant!
am in order to anchor the Goodman dlagram along the mean-stress axis. The
elastic llfe term then becomes
am b(2)
In terms of strain, equation (2) takes the form
ACel = _ l - 2NF} b (3)
where ACel
materlal.
is the elastic stralnrange and E is Young's modulus for the
The plastlc stralnrange Acp'
equation (3), must take the form
which corresponds to ACel
_mpJ \
as given by
(4)
In equation (4), Cmp is the plastic straln increment correspondlng to am in!
any given cycle, and c_ and Cmp represent ductility terms corresponding toI
the strength constants a_ and am , respectively; c Is the unlversal-slopes
constant, usually close to 0.6 in value. A combination of equations (3) and
(4) gives the total strain amplitude for a given number of cycles Nf as
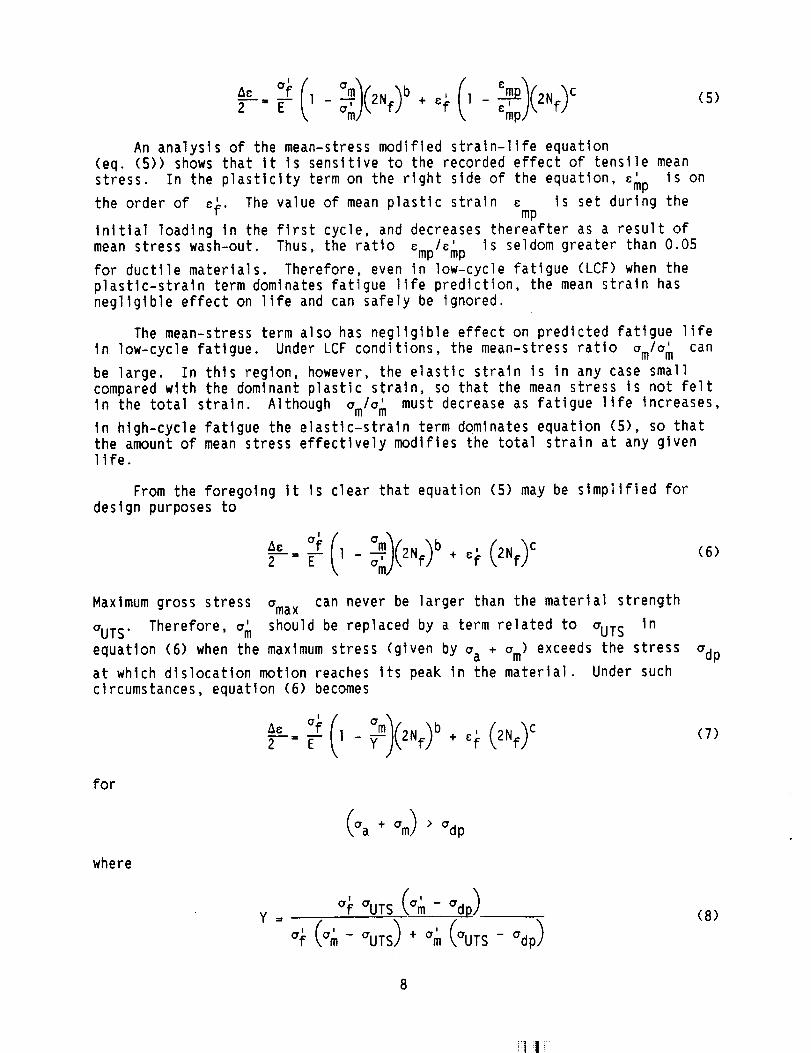
÷ ( c_-'-- _- ] - Omj\ e:mp)', /(5)
An analysis of the mean-stress modified straln-life equation
(eq. (5)) shows that It Is sensitive to the recorded effect of tensile meanI
stress. In the plasticity term on the right slde of the equation, Cmp is on
the order of c_. The value of mean plastic straln Cmp Is set during the
Initial loading ]n the first cycle, and decreases thereafter as a result ofmean stress wash-out Thus, the ratlo / ' Is seldom greater than 0.05
• Cmp Cmp
for ductile materials. Therefore, even In low-cycle fatigue (LCF) when the
plastic-strain term dominates fatigue life prediction, the mean strain has
negllgible effect on life and can safely be ignored.
The mean-stress term also has negligible effect on predicted fatigue life
In low-cycle fatigue Under LCF conditions the mean-stress ratio o /o' can• ' m m
be large• In this region, however, the elastic strain Is In any case small
compared wlth the dominant plastic strain, so that the mean stress is not felt
In the total straln. Although o.m/o.m' must decrease as fatigue life increases
In high-cycle fatigue the elastic-straln term dQmlnates equation (5), so thatthe amount of mean stress effectively modlfles the total straln at any givenllfe.
From the foregoing It Is clear that equation (5) may be simplified for
design purposes to
A._._._2"E-°_(1-'-To.mj,,o'm_('2Nf]/ b + e_ (2Nf)C(6)
Maxlmum gross stress o.max can never be larger than the material strength!
O.UTS. Therefore, o.m should be replaced by a term related to O.UTS In
equation (6) when the maximum stress (given by o.a + om) exceeds the stress
at which dislocation motion reaches Its peak in the material. Under such
circumstances, equation (6) becomes
o'dp
_---'--=-_- 1 - 2Nf + c_ 2NF(7)
for
o-a + o-m) > o-dp
where
y I
o.f O'UTS (o.l_- o'dp)
o..l_(o._-O.UTS)+ o._ (O.UTS - a dp)
(8)
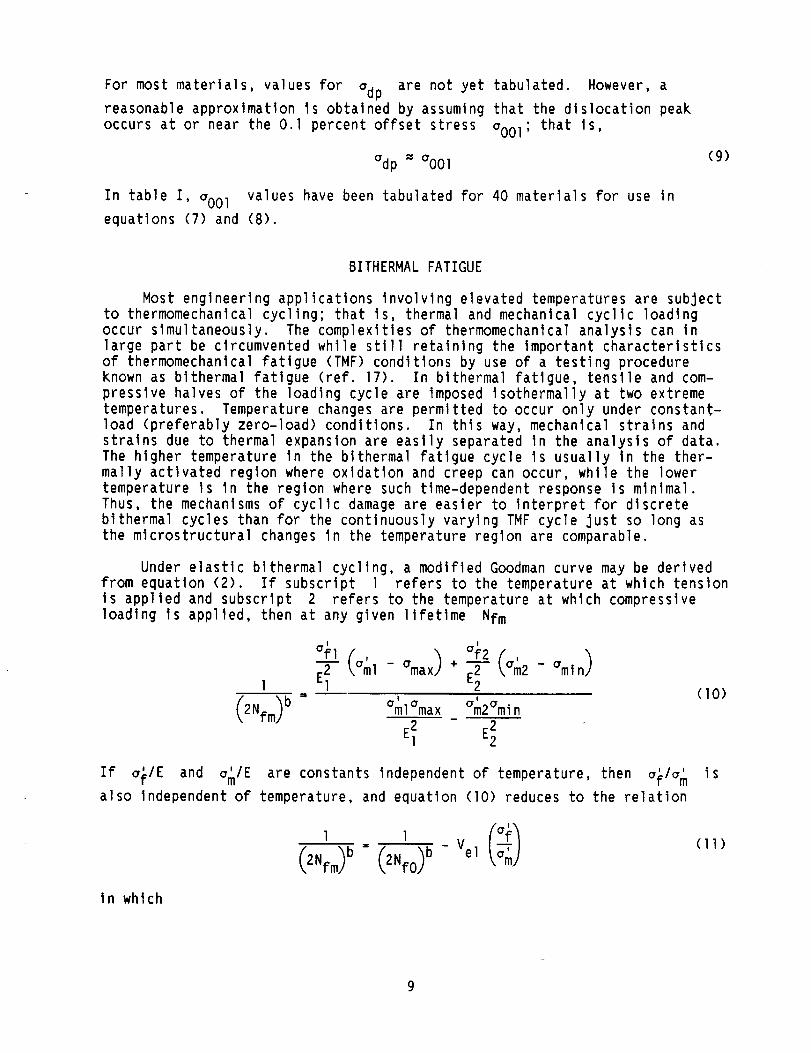
For most materials, values for adp are not yet tabulated. However, a
reasonable approximation is obtained by assuming that the dlslocation peak
occurs at or near the 0.1 percent offset stress _001; that Is,
adp = aO01
In table I, aO01 values have been tabulated for 40 materials for use In
equations (7) and (8).
(g)
BITHERMAL FATIGUE
Most engineering applications Involving elevated temperatures are subject
to thermomechanlcal cycling; that Is, thermal and mechanlcal cyclic loadingoccur slmultaneously. The complexities of thermomechanlcal analysls can In
large part be circumvented while still retaining the Important characteristics
of thermomechanlcal fatigue (TMF) conditions by use of a testing procedure
known as blthermal fatigue (ref. 17). In bithermal fatigue, tensile and com-
presslve halves of the 1oadlng cycle are imposed Isothermally at two extreme
temperatures. Temperature changes are permitted to occur only under constant-
load (preferably zero-load) conditions. In thls way, mechanical strains and
strains due to thermal expansion are easily separated In the analysis of data.
The higher temperature In the blthermal fatigue cycle Is usually In the ther-
mally activated region where oxldatlon and creep can occur, while the lower
temperature Is In the region where such tlme-dependent response is mlnlmal.Thus, the mechanisms of cyclic damage are easier to Interpret for discrete
blthermal cycles than for the continuously varying TMF cycle Just so long as
the mlcrostructural changes In the temperature region are comparable.
Under elastlc blthermal cycling, a modified Goodman curve may be derived
from equation (2). If subscript 1 refers to the temperature at which tension
Is applied and subscript 2 refers to the temperature at which compressive
1oadlng Is applied, then at any given lifetime Nfm
af'1(aml_amax)+of'2(am2-°mln)
2Nfm) _ , ,b aml amax am2 aml n(10)
If a_/E and am/E are constants independent of temperature, then a_/a m is
also independent of temperature, and equation (10) reduces to the relation
2Nfm)b .(11)
in which
9
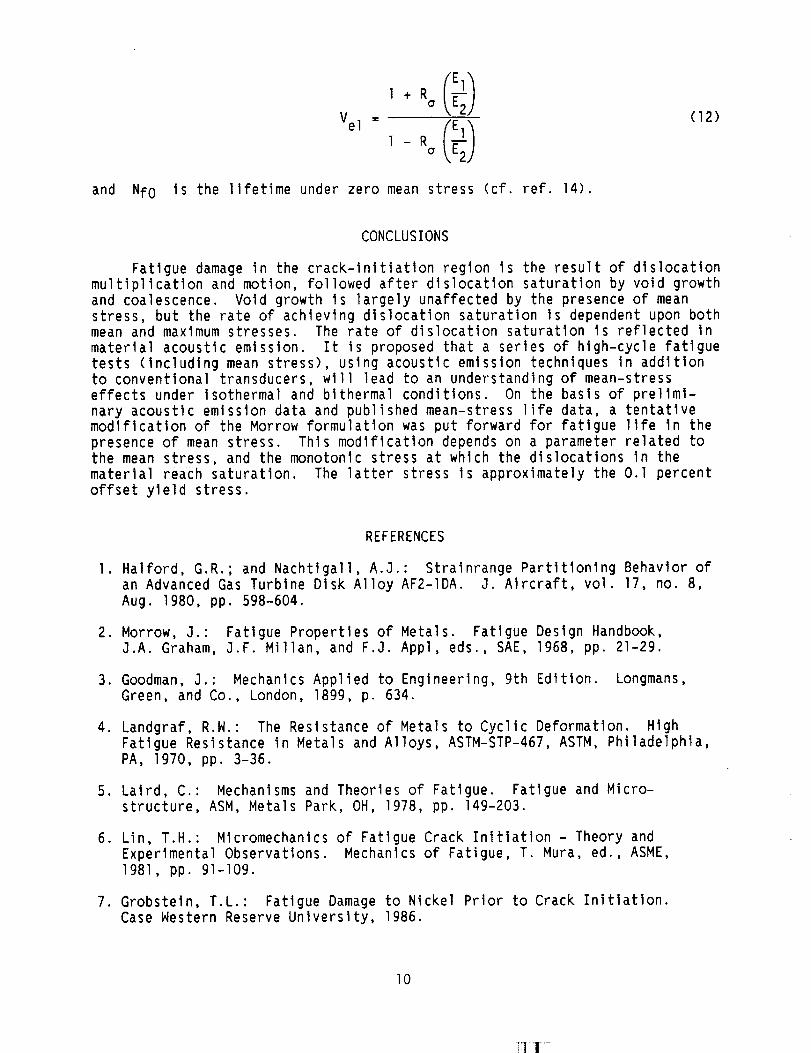
(12)Vel -
and Nfo Is the lifetime under zero mean stress (cf. ref. 14).
CONCLUSIONS
Fatlgue damage in the crack-lnltiatlon region is the result of dislocation
multiplication and motion, followed after dlslocatlon saturation by void growthand coalescence. Void growth is largely unaffected by the presence of mean
stress, but the rate of achlevlng dislocation saturation Is dependent upon bothmean and maximum stresses. The rate of dislocation saturatlon is reflected In
material acoustic emission. It is proposed that a series of hlgh-cycle fatigue
tests (Includlng mean stress), using acoustic emisslon techniques In additionto conventional transducers, wlll lead to an understanding of mean-stress
effects under isothermal and blthermal conditions. On the basis of pre]Iml-
nary acoustic emission data and published mean-stress life data, a tentatlvemodification of the Morrow formulation was put forward for fatigue llfe In the
presence of mean stress. Thls modlfication depends on a parameter re]ated to
the mean stress, and the monotonic stress at which the dislocations In the
material reach saturation. The latter stress Is approximately the O.l percent
offset yield stress.
REFERENCES
1. Halford, G.R.; and Nachtigall, A.J.: Stralnrange Partltlonlng Behavlor of
an Advanced Gas Turblne Dlsk Alloy AF2-1DA. J. Alrcraft, vol. 17, no. 8,
Aug. 1980, pp. 598-604.
2. Morrow, J.: Fatigue Properties of Metals. Fatigue Design Handbook,
J.A. Graham, J.F. Mlllan, and F.J. Appl, eds., SAE, 1968, pp. 21-29.
3. Goodman, J.: Mechanics Applied to Englneerlng, 9th Edltlon. Longmans,
Green, and Co., London, 1899, p. 634.
4. Landgraf, R.W.: The Resistance of Metals to Cyclic Deformation. HighFatigue Resistance in Metals and Alloys, ASTM-STP-467, ASTM, Philadelphia,PA, 1970, pp. 3-36.
5. Laird, C.: Mechanlsms and Theories of Fatlgue. Fatigue and Micro-
structure, ASM, Metals Park, OH, 1978, pp. 149-203.
6. Lin, T.H.: Mlcromechanlcs of Fatigue Crack Inltiatlon - Theory and
Experimental Observations. Mechanics of Fatigue, T. Mura, ed., ASME,
1981, pp. 91-109.
7. Grobsteln, T.L.: Fatigue Damage to Nickel Prior to Crack Initlatlon.Case Western Reserve University, 1986.
lO
T_]I _
8. Wllsdorf, H.G.F.: Direct Studies of Fracture Mechanisms in Metals at
Highest Magnlflcatlon. Dept. of Materlals Sclence, University of
Virginia, Report No. UVA/525354/MS82/I02, 1982. (Avail. NTIS, AD-AII4712.)
9. Manson, S.S.: Fatigue: A Complex Subject - Some Simple Approximations.
Exp. Mech., vol. 5, no. 7, July 1965, pp. 193-226.
I0. Helple, C.R.; and Carpenter, S.H.: Acoustic Emission from DislocationMotion. Acoustic Emission, 3.R. Matthews, ed., Gordon and Breach,New York, 1983, pp. 15-103.
II. Buck, 0.; and Alers, G.A.: New Techniques for Detection and Monitoring ofFatigue Damage. Fatigue and Microstructure, ASM, Metals Park, OH, 1978,pp. 101-147.
12. Helple, C.R.; Carpenter, S.H.; and Thomas, R.L.: Acoustic Emission Pro-
duced by Deformation of Metals and Alloys. Rockwell International Corp.,
Report No. RFP-4046, Golden, CO, Mar. 1987.
13. Kishl, T., et al.: The Application of Acoustlc Emission Technique to the
Study of Strain Hardenlng and Fatigue Hardening. Third Acoustlc Emission
Symposium, Japan Industrial Planning Assoc., Tokyo, 1976, pp. 305-325.
14. Palmer, I.G.: Acoustic Emission Measurements on Reactor Pressure Vessel
Steel. Mater. Scl. Eng., vol. II, 1973, pp. 227-236.
15. Metallic Materials and Elements for Aerospace Vehicle Structures. DOD
MIL-HDBK-5C, 1979.
16. Aerospace Structural Metals Handbook. Metals and Ceramics Information
Center, Battelle Labs, Columbus, OH, 1988.
17. Halford, G.R.: Low-Cycle Thermal Fatigue. Thermal Stresses II,
R.B. Hetnarskl, ed., Elsevier Press, 1987, pp. 330-428.
II
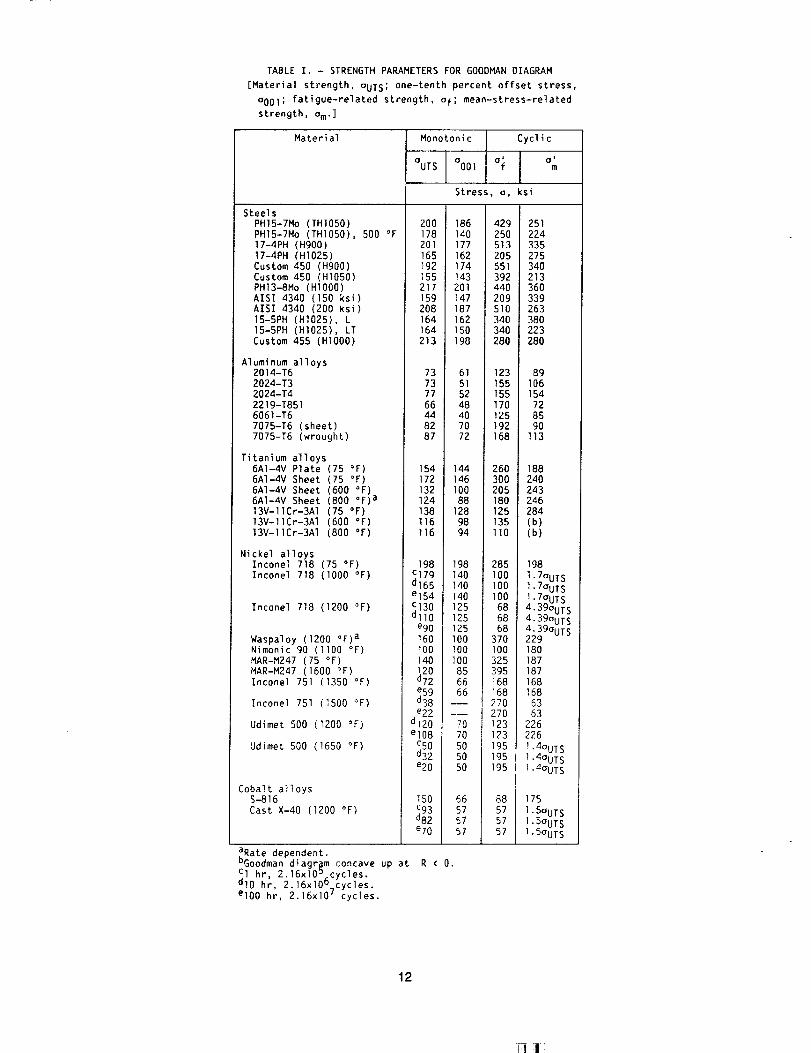
TABLE I. - STRENGTH PARAMETERS FOR GOODMAN DIAGRAM
[Material strength, OUTS; one-tenth percent offset stress,
oOOl; fatigue-related strength, af; mean-stress-related
strength, am.]
Material
Steels
PHIS-7Mo (THIOSO)
PHIS-7Mo (THIOSO), SO0 °F
17-4PH (H900)
17-4PH (HI025)
Custom 450 (HgO0)
Custom 450 (HI050)
PHI3-8Mo (HlO00)
AISI 4340 (150 ksi)
AISI 4340 (200 ksi)
15-5PH (HI025), L
15-5PH (HI025), LT
Custom 455 (HIO00)
Aluminum alloys2014-T6
2024-T3
2024-T42219-T851
6061-T6
7075-T6 (sheet)
7075-T6 (wrought)
Titanium alloys6A1-4V Plate (75 °F)
6AI-4V Sheet (75 °F)
6AI-4V Sheet (600 °F)
6A1-4V Sheet (800 °F) a
13V-11Cr-3Al (75 °F)
13V-IICr-3Al (600 °F)
13V-lICr-3Al (800 °F)
Nickel alloysInconel 718 (75 °F)
Inconel 718 (lO00 °F)
Inconel 718 (1200 °F)
Waspaloy (1200 °F) aNimonic 90 (llO0 °F)
MAR-M247 (75 °F)
MAR-M247 (1600 °F)
Inconel 751 (1350 °F)
Inconel 751 (1500 °F)
Udimet 500 (1200 °F)
Udimet 500 (1650 °F)
Cobalt alloysS-816
Cast X-40 (1200 °F)
aRate dependent.
bGoodman diagram concave up atCl hr, 2.16xi0 J cycles.
dlO hr, 2.16xi06 cycles.
elO0 hr, 2.16xlO 7 cycles.
Monotonic Cycl ic
1 IaUT S OO01 a_ a m
Stress, a, ksi
200 186 429 251
178 140 250 224
201 177 513 335
165 162 205 275
192 174 551 340
ISS 143 392 213
217 201 440 360
159 147 209 339
208 187 SlO 263
164 162 340 380
164 150 340 223213 198 280 280
73 61 123 89
73 51 155 106
77 52 155 15466 48 170 72
44 40 125 85
82 70 192 9087 72 168 I13
154 144 260 188172 146 300 240132 100 205 243124 88 180 246
138 128 125 284116 98 135 (b)
116 94 110 (b)
198 198 285 198
cl7g 140 I00 1.7OUT S
d165 140 100 1.7aUT S
e154 140 lO0 1.7aUT SCl30 125 68 4 390 -
• UTSdllO 125 68 4 39a• UTSe90 125 68 4.39oUT S160 lO0 370 229
I00 I00 I00 180
140 lO0 325 187120 85 395 i87d 72 66 168 ]68e59 66 168 168d38 --- 270 63
e22 --- 270 63d120 70 123 226
el08 70 123 226
%0 50 195 1.4OUT Sd32 50 195 1,4oUT se20 50 195 1,4OUT s
150 66 88 175
c93 57 57 I.SOUT Sd82 57 57 1.5aUT Se70 57 57 I.SauT S
R<O.
12
Tq:I:
1.0
,8
.G
.2
TENSION
-.4 -.2 /CORPRESSION
/ -.2
_,q
STATIC BRDJKING STRESS b
!
ZEROSTRESS
O .2 .q .6
S/
/
1.0
FIGURE I. - GOODMAN DIAGRA/4.
Oa
_'S PA\\\ RABOL_I,_ODIFIED
o Oy (_uts
FIGURE 2. - RODIFIED GOODMANDIAGRN4,
0 m
.010
.008
• 006
. O04
• 002
.o01
2024 - Tq
f-am= O
-_.-- / /--Om = 10.5 Ks[_ ,/ / Fom = 21.7 KSl
_ __ ///
= 0.02
I I I I103 1O_ 105 106 107
CYCLES TO FAILURE
FIGURE 3. - FATIGUE LIFETIMES WITH MEAN STRESSES.
0.002 (STRAINJ
FIGURE q. - RELAXATIONOF PlAN STRESS
IN SAE lObS STEEL (REF. 8).
F-T __
E TOTAL/
/ _ rELASTIC =OE /.
f J j f//Evo IUS
j/ EDISLOCATIONS
TOTAL STRAIN
FIGURE S. - STRAIN COt4PONENTSOF ELASTOPLASTIC RESPONSE
DURING TENSILE TEST.
13

----F .... IX
// I_ _-PLASTIC:
LELASTIC: !_ '_ ,,_
_e, o;....b ! "-,,_-_=_;<2N,,<--7-" -7- ,_"v i_
2NT
REVERSALS TO FAILURE
FIGURE 6. - FATIGUE LIFE RELATION (REF. 2).
ACOUSTIC EMISSION COUNT
_ STRESS-S_AIN
_ DISLOCATION COUNT
_'_ ACOUSTIC EMISSION RAE
_-_ D_SL_ATION RA_
/,,4 .....
// j__
STRAIN
FIGURE 7. - _OUSTIC EMISSION RESP_SE UN_R MONOT_IC
L_DING.
10 .10,-- 3.0
5-
ACOUSTIC EMISSION, AE
STRAIN, E
k _ LOAD, P
1
' lL!'k,..__ #/
-,os,--1.s I i I \Ji I I I1 2 3 LI 5 6 7
Tl,_, ,,,tr_
FIGURE 8. - ACOUSTIC EMISSION DURING CYCLIC LOADING OF ALUMINUM
(REF. 13).
-5-
14
ACOUSTIC EMISSION, AE
STRAIN, E
LOAD, P
',,,',,//",,',,i,"--_/ ""K/
(A) RC = -I.
//)C"'X"-, /,>"\',,
"\.,/'
(B) RE = O.
]_\ -,,/',;_,.,.__"\,,,./
f h \/ \,i_ _::/0
(C) RE > O.
FIGURE 9. - SCHEMATIC OF POSSIBLE ACOUSTIC EMISSION RESPONSE WITH MEAN STRESS.
10xi03
8--
6--
q--
2
0 --
60AE --_
\
_y
o 720 -
I vl I v I I0 1 2 3 4 S
TIME, MTN
FIGURE 10. - ACOUSTIC EMISSION DURING CYCLIC LOADING OF
C-MN STEEL (REF. 14).
N
N3
MEAN STRESS, 0m
FIGURE 11. - MORROW MEAN-STRESS LIFE FORMULATION (REF. 2).
15
60 --
/-Oa + Om = Odp/
_, _ 2014 - T6
=¢_ qO __'_ /-Oa+Om=OUTS/
i ,\
_ 2o_,
0 20 40 60 80 100
MEAN STRESS, KSl
FIGURE 12. - REINTERPRETATION OF MODIFIED GOODMAN DIAGRAM.
MEAN
STRESS
EFFECT, //-
/
°max
°UTS
FIGURE 13. - THREE-DIMENSIONAL MODIFIED GOODMAN DIAGRAM.
UNIVERSAL
SLOPES
DISTRIBUTION
0a
16
i!i_l_
---,.'1..... ,/
Report Documentation PageNational AeronautiCS and
Space Administration
1. Report No. 2. Government Accession No. 3. Recipient's Catalog No.
NASA TM-101311
5. Report Date
November 1989
4. Title and Subtitle
Mean Stress and the Exhaustion of Fatigue-Damage Resistance
7. Author(s)
Avraham Berkovits
g.
12.
Performing Organization Name and Address
National Aeronautics and Space Administration
Lewis Research Center
Cleveland, Ohio 44135-3191
Sponsoring Agency Name and Address
National Aeronautics and Space Administration
Washington, D.C. 20546-0001
6. Performing Organization Code
8. Performing Organization Report No.
E-4307
10. Work Unit No.
582-01-11
11. Contract or Grant No.
13. Type of Report and Period Covered
Technical Memorandum
14. Sponsoring Agency Code
15. Supplementary Notes
Avraham Berkovits, National Research Council--NASA Research Associate, on leave from Technion--
Israel Institute of Technology, Haifa, Israel.
16. Abstract
Mean-stress effects on fatigue life are critical in isothermal and thermomechanically loaded materials and
composites. Unfortunately, existing mean-stress life-prediction methods do not incorporate physical fatigue-
damage mechanisms. An objective of this paper is to examine the relation between mean-stress-induced damage
(as measured by acoustic emission) and existing life-prediction methods. Acoustic emission instrumentation has
indicated that, as with static yielding, fatigue damage results from dislocation buildup and motion until dislocation
saturation is reached, after which void formation and coalescence predominate. Correlation of damage processes
with similar mechanisms under monotonic loading led to a reinterpretation of Goodman diagrams for 40 alloys
and a modification of Morrow's formulation for life prediction under mean stresses. Further testing, using
acoustic emission to monitor dislocation dynamics, can generate data for developing a more general model for
fatigue under mean stress.
17. Key Words (Suggested by Author(s))
Metal fatigue; Life prediction; Mean stress; Strain fatigue;
Endurance limit; Thermomechanical fatigue; Acoustic
emission; Dislocations; Void growth
18. Distribution Statement
Unclassified - Unlimited
Subject Category 39
19. Security Classif. (of this report) 20. Security Classif. (of this page) 21. No of pages
Unclassified Unclassified 17
NASA FORM 1626 OCT 86 *For sale by the National Technical Information Service, Springfield, Virginia 22161
22. Price*
A03

ilI'-