Mean Consumption, Poverty and Inequality in Rural India in ... · Mean Consumption, Poverty and...
26
Revised 27 Oct 2006 ASARC Working Paper 2006/11 Mean Consumption, Poverty and Inequality in Rural India in the Sixtieth Round of the National Sample Survey Raghbendra Jha, Raghav Gaiha, Anurag Sharma Australian National University of Delhi Monash University University ABSTRACT This paper reports on mean consumption, poverty (all three FGT measures) and inequality during January to June 2004 for rural India using National sample Survey (NSS) data for the 60 th Round. Mean consumption at the national level is much higher than the poverty line. However, the Gini coefficient is higher than in recent earlier rounds. The headcount ratio using the thirty day recall is 22.9 per cent and with the seven day recall this stands at 17.9 per cent and, with the combined data, this figure is 20.6 per cent. Mean consumption, all three measures of poverty and the Gini coefficient are computed at the level of 20 states and 63 NSS regions in these 20 states. It is surmised that despite impressive growth rates deprivation is pervasive, pockets of severe poverty persist, and inequality is rampant. All communication to: Prof. Raghbendra Jha, Australia South Asia Research Centre, RSPAS, Australian National University Canberra, Act 0200 Australia Phone: + 61 2 6125 2683 Fax: + 61 2 6125 0443 Email: [email protected]
Transcript of Mean Consumption, Poverty and Inequality in Rural India in ... · Mean Consumption, Poverty and...

Revised 27 Oct 2006
ASARC Working Paper 2006/11
Mean Consumption, Poverty and Inequality in Rural India in the Sixtieth Round of the National Sample Survey
Raghbendra Jha, Raghav Gaiha, Anurag Sharma Australian National University of Delhi Monash University University
ABSTRACT
This paper reports on mean consumption, poverty (all three FGT measures) and inequality
during January to June 2004 for rural India using National sample Survey (NSS) data for
the 60th Round. Mean consumption at the national level is much higher than the poverty
line. However, the Gini coefficient is higher than in recent earlier rounds. The headcount
ratio using the thirty day recall is 22.9 per cent and with the seven day recall this stands at
17.9 per cent and, with the combined data, this figure is 20.6 per cent. Mean consumption,
all three measures of poverty and the Gini coefficient are computed at the level of 20 states
and 63 NSS regions in these 20 states. It is surmised that despite impressive growth rates
deprivation is pervasive, pockets of severe poverty persist, and inequality is rampant.
All communication to: Prof. Raghbendra Jha, Australia South Asia Research Centre, RSPAS, Australian National University Canberra, Act 0200 Australia Phone: + 61 2 6125 2683 Fax: + 61 2 6125 0443 Email: [email protected]
Raghbendra Jha, Raghav Gaiha & Anurag Sharma
ASARC Working Paper 2006/11 2
Mean Consumption, Poverty and Inequality in Rural India
in the Sixtieth Round of the National Sample Survey I. Introduction
With the recent release of the National Sample Survey (NSS) data for the 60th round
(conducted during January to June 2004) the debate on the impact of the current economic
policy stance will, no doubt, be renewed anew. The change in the methodology for collecting
NSS data put into effect in the 55th Round (1999–00) created controversy about the
comparability of the 55th Round results with the earlier rounds.
The 60th Round data is not entirely comparable with the 55th Round data yet it does provide
an inkling of how the movement of poverty has developed during this period. In this paper
we provide estimates of mean consumption, poverty and inequality at three levels: the
national level, state level and at the level of 63 NSS regions.
II. Poverty During the 1990s
A spate of studies (contained in Deaton and Kozel, 2005 and elsewhere) contain widely
varying estimates of reduction in poverty during the 1990s — a period that witnessed wide-
ranging economic reforms — both domestic and external liberalisation — and accelerated
growth. The reduction in poverty, however, varies depending on whether the estimates are
obtained from adjusted or unadjusted 55th round NSS estimates (see, for example, Sundaram
and Tendulkar (2003, 2005), Deaton (2005), Datt, Kozel and Ravallion (2005), Deaton and
Dreze (2002), Kijima and Lanjouw (2003) and Planning Commission, Government of India
as reported in Sen and Himanshu (2004). To give the flavour of the debate, two sets of
evidence are reviewed below.

Mean Consumption, Poverty & Inequality in Rural India in the 60th Round of the NSS
ASARC Working Paper 2006/11 3
Although “official” estimates of poverty reduction are high (the HCR in rural areas fell from
37.27 per cent to 27.09 per cent, and the number of poor from 244 million to 193.2 million
over the period 1993–99), the balance of evidence with careful adjustments of the 1999/2000
NSS data point to markedly lower reductions. An admirably comprehensive and by far the
most persuasive is the contribution by Sen and Himanshu (2005). It casts doubts over earlier
estimates of poverty reduction — specifically, that it was faster than that in the previous
decade. As it turns out, the headcount ratio declined but at most by 3 percentage points and
the absolute number of the poor did not decline over 1993–99. The reason is that both inter-
state and within-state inequality rose sharply during the 1990s, with the latter being the larger
component of total inequality in India. Within-state urban inequality rose sharply in the
1990s, while a declining phase of within-state rural inequality was reversed during this
period. So, despite rapid growth, poverty reduction in the 1990s was muted. The
characterisation of the 1990s as “a relatively lost decade for poverty reduction” is thus not an
exaggeration.
The reasons relate to weak linkages between liberalisation and agricultural growth on the one
hand, and between the latter and poverty reduction on the other. First, although the growth
rate of agricultural (crop) output was slightly higher during the 1990s (3.08 per cent annually
as against 2.94 per cent during the 1980s), it slowed down to 1.6 per cent during 1997–98 and
2000/1.1 Secondly, whether agricultural growth translates into poverty reduction depends
greatly on how unequal is the distribution of land. An implication of highly unequal
distribution of land is that the growth of real agricultural wages tends to be sluggish.
Independently of agricultural growth, abrupt increases in price of food result in higher
1 For details, see Nayyar (2003).

Raghbendra Jha, Raghav Gaiha & Anurag Sharma
ASARC Working Paper 2006/11 4
poverty.2 Some additional but more recent evidence further points to slow reduction in
poverty. (i) Between 1993–99, the employment elasticity of agricultural growth was barely
0.01 as compared to 0.70 during 1983–93. (ii) There was a sharp drop in the growth rate of
real agricultural wages, from 3.99 per cent per annum during 1978–79 to 1989–90 to 2.34 per
cent annually during 1990–91 to 1999–2000. (iii) The (wholesale) price index for food rose
faster than that for all commodities. With 1980-81 as the base at 100, food prices rose to 433
in 1998–99, while for all commodities it rose to only 353.3.3 In any case, the disadvantaged
groups — especially the STs and female-headed households- continue to be considerably
worse-off than all other rural households.4 Their social exclusion, and limited access to assets
— especially land and education —.perpetuate their poverty (Gaiha and Imai, 2004).
Yet another dimension that needs critical scrutiny is spatial concentration of the poor. An
analysis based on the NSS regional data over the period 1987–99 shows that the ranking of
the poorest 20 regions has not changed much and that they continue to account for a large
share of the rural poor.5 What these findings point to is that not only do persistently poor
require greater access to human and physical assets, markets and financial services but also
conditions that would enable them to overcome social exclusion. While a definitive
comparison of the spatial concentration over the period covered by the earlier NSS rounds
with the 60th round must await a comparable regional classification, our analysis draws
2 For illustrative results on the causal role of these variables based on the ICRISAT data for the semi-arid region, see Gaiha (1995). 3 For details, see Nayyar (2003). 4 In India, survey data for 1993–1994 show that per capita incomes among SCs were lower than the state averages (24 per cent in Andhra Pradesh, and 41 per cent in Kerala). In the eastern state of Orissa, more than 24 per cent of the population consisted of STs, as compared to 9 per cent in the country as a whole. 92 per cent of the households belonging to a ST in rural southern Orissa were poor — twice the state poverty rate and three and a half times the national poverty rate (CPRC, 2004). Besides, the overall prevalence of stunting among SC/ST children is much higher than the all-India average (over 63 per cent and about 58 per cent, respectively. For details, see Gaiha and Kulkarni (2005). See also Sundaram and Tendulkar (2005) for illustrations of relatively low rates of poverty reduction among subsets of SC/ST households during 1993–99. 5 This is based on a collaborative study by R. Jha and R. Gaiha, funded by a DFID grant. See Jha and Gaiha (2003) and Jha and Sharma (2003).

Mean Consumption, Poverty & Inequality in Rural India in the 60th Round of the NSS
ASARC Working Paper 2006/11 5
attention to marked variations within states and across regions as a continuing feature of
poverty in India despite spectacular growth rates of income.
III. Methodology
The poverty measures used in this paper are all drawn from the popular Foster-Greer-
Thorbecke (FGT) class of functions. This is written as:
where Y is the measure of poverty, yi is the (per capita) consumption expenditure of the ith
household or the ith class of household, z is the poverty line, n is the number of observations,
and α is a non-negative parameter. The headcount ratio, PG0, given by the percentage of the
population who are poor, is obtained when α=0. This measure fails to capture the extent to
which individual income (or expenditure) falls below the poverty line. Hence we use our
second measure: the poverty gap index (PG1) given by the aggregate income shortfall of the
poor as a proportion of the poverty line and normalized by the population size. This is given
by setting α=1 in (1). PG1 captures the acuteness of poverty since it measures the total
shortfall of the poor from the poverty line. In other words, it measures the total amount of
income necessary to remove that poverty. This measure has the drawback that it does not
consider the importance of the number of people who are below the poverty line. For this
reason, it is important to use both measures of poverty jointly to evaluate the extent of
poverty. There are certain policy changes that favor one group of poor and adversely affect
another group. In such cases PG0 may not register any change but PG1 may get around this
problem to some extent. A further improvement is the Foster-Greer-Thorbecke measure
which is obtained by setting α=2 in (1). We abbreviate this as PG2.6
6 This is also referred to as a distributionally sensitive measure. More generally, if α >1, the FGT index is distributionally sensitive.
)1(/]/)[(∑<
−=zy
ii
nzyzY αα

Raghbendra Jha, Raghav Gaiha & Anurag Sharma
ASARC Working Paper 2006/11 6
Also reported in this paper are data on the Gini coefficient, a standard measure of inequality.
Typically this is defined as:
)2(2 2
1 1
µn
yyG
n
i
n
jji∑∑
= =
−=
Thus G is calculated as the relative mean difference, i.e., the mean of the difference in
consumption levels between every possible pair of households divided by the mean size µ.
IV. Results
Consumption data in the 60th Round of the NSS has been reported in three formats:
(i) schedule 1 uses 30 day recall; (ii) schedule 2 uses 7 day recall; and (iii) consumption data
combining the two recall periods are reported.
We present the results at three levels: (a) national; (b) state level (20 states) and (c) agro-
climatic zone wise (63 NSS regions) for all three data formats. The poverty lines used in the
analysis are reported in Table 1. These poverty lines are updates for the official poverty lines
used by the Government of India for the year 2004 using CPIAL figures for the nation as a
whole (for India) and state level CPIALs.
Table 1: Poverty Lines Used in the Analysis: Rs. per capita per month
India 399.00 Assam 406.65 J&K 407.82 West Bengal 390.24 Himachal Pradesh 380.87 Orissa 375.00 Punjab 416.02 Madhya Pradesh 386.72
Haryana 420.71 Gujarat 410.16 Rajasthan 405.48 Maharashtra 410.15 UP 401.96 Andhra Pradesh 418.37 Bihar 379.69 Karnataka 398.45 Manipur 363.28 Kerala 411.34 Tripura 394.93 Tamilnadu 406.65 Meghalaya 421.88

Mean Consumption, Poverty & Inequality in Rural India in the 60th Round of the NSS
ASARC Working Paper 2006/11 7
Computations on mean consumption, poverty and inequality at the national level are reported
in Table 2.
Table 2: Mean Consumption, Poverty and Inequality in Rural India at the National Level
30-Day recall 7-day recall Combined
Mean per capita consumption7 (Rs. Per month)
786 852 818
PG0 l 22.90292 17.9421 20.62485
PG1 0.045277 0.034262 0.040367
PG2 0.01378 0.010126 0.012199
Gini Coefficient) 0.36 0.37 0.37
Although mean per capita consumption is much higher than the poverty line, the Gini
coefficient is higher than in the earlier rounds. The Sen–Himanshu estimate (2005) for the
55th round, for example, is 0.263 for the adjusted 7-day question on food. It may be noted,
however, that our Gini estimates do not vary much with the recall period. But the poverty
estimates do. These are lower with the 7-day recall. State level results for mean consumption
are presented in Table 3.
7 This and other mean consumption magnitudes are weighted means of expenditures.

Raghbendra Jha, Raghav Gaiha & Anurag Sharma
ASARC Working Paper 2006/11 8
Table 3: Mean Consumption in Indian States (Rs. per capita per month)
30-Day recall 7-day recall Combined
J&K 972.8327 977.8441 968.4384
Himachal Pradesh 973.8306 1144.433 1059.719
Punjab 1083.278 1219.027 1152.276
Haryana 982.1269 959.5434 969.3607
Rajasthan 738.4412 772.5644 755.1089
UP 689.8689 735.1858 708.3049
Bihar 521.9517 546.1557 531.1039
Manipur 723.9151 765.2466 739.9257
Tripura 589.8687 658.7604 618.2768
Meghalaya 788.2561 794.7582 789.8932
Assam 640.9064 727.5854 685.3843
West Bengal 800.8758 908.8001 856.5894
Orissa 507.9771 606.8665 553.496
Madhya Pradesh 570.1587 619.3557 595.461
Gujarat 875.3434 941.0047 905.1426
Maharashtra 975.7975 1088.055 1035.484
Andhra Pradesh 788.5478 810.2635 801.5304
Karnataka 717.1448 773.5267 744.5439
Kerala 1220.356 1267.083 1242.271
Tamilnadu 891.4005 990.3706 937.5418
In Table 4 we report on state level poverty levels for all three FGT measures for all three
recall measures.

Mean Consumption, Poverty & Inequality in Rural India in the 60th Round of the NSS
ASARC Working Paper 2006/11 9
Table 4: State Level FGT Poverty measures
30-day recall 7-day recall Combined 30-day recall 7-day recall Combined
J&K Assam PG0 7.523135 3.666223 5.731677 PG0 18.53069 9.585625 14.04115 PG1 0.009122 0.001207 0.005445 PG1 0.032728 0.015354 0.024008 PG2 0.001685 4.57E-05 0.000924 PG2 0.009242 0.00353 0.006375 Himachal Pradesh West Bengal PG0 5.612861 4.884036 5.25185 PG0 15.64928 13.54053 14.64926 PG1 0.009318 0.006042 0.007695 PG1 0.02817 0.020304 0.02444 PG2 0.002026 0.001058 0.001547 PG2 0.008108 0.004658 0.006472 Punjab Orissa PG0 4.345747 2.883431 3.627695 PG0 48.976 34.07085 41.76606 PG1 0.006456 0.004189 0.005343 PG1 0.121024 0.075288 0.098901 PG2 0.001769 0.000884 0.001334 PG2 0.042643 0.025608 0.034402 Haryana Madhya Pradesh PG0 4.745976 5.69111 5.207297 PG0 34.72388 28.83626 31.84933 PG1 0.008585 0.00722 0.007919 PG1 0.068514 0.059964 0.064339 PG2 0.002245 0.001726 0.001992 PG2 0.01998 0.017173 0.01861 Rajasthan Gujarat PG0 16.36508 12.84879 14.6321 PG0 16.52033 13.45861 14.99201 PG1 0.023992 0.018122 0.021099 PG1 0.030296 0.017762 0.02404 PG2 0.005427 0.004975 0.005204 PG2 0.007656 0.003812 0.005737 UP Maharashtra PG0 27.45898 22.845 25.25927 PG0 17.03622 14.00895 15.56448 PG1 0.052302 0.041244 0.04703 PG1 0.028537 0.028206 0.028376 PG2 0.014608 0.011449 0.013102 PG2 0.008707 0.008218 0.008469 Bihar Andhra Pradesh PG0 36.56325 31.22599 33.98184 PG0 27.66666 21.66952 24.71371 PG1 0.06722 0.054726 0.061177 PG1 0.060019 0.042106 0.051199 PG2 0.018419 0.013893 0.01623 PG2 0.019152 0.013391 0.016316 Manipur Karnataka PG0 1.435798 0.348609 0.925893 PG0 26.43068 14.09506 20.49877 PG1 0.001101 0.000207 0.000682 PG1 0.056255 0.028239 0.042783 PG2 9.41E-05 1.34E-05 5.62E-05 PG2 0.021097 0.010015 0.015768 Tripura Kerala PG0 25.31683 14.66559 20.24155 PG0 6.465446 3.472056 5.004189 PG1 0.048087 0.021149 0.035251 PG1 0.015452 0.005169 0.010432 PG2 0.012849 0.005601 0.009395 PG2 0.005757 0.001017 0.003443 Meghalaya Tamilnadu PG0 3.925776 3.756516 3.842222 PG0 19.82947 15.11981 17.48075 PG1 0.001828 0.001995 0.00191 PG1 0.037657 0.031844 0.034758 PG2 0.000197 0.000165 0.000181 PG2 0.012383 0.010825 0.011606

Raghbendra Jha, Raghav Gaiha & Anurag Sharma
ASARC Working Paper 2006/11 10
Some comments are in order.8
I. In all cases, the poverty estimates are lower with the weekly recall- in a few cases
(e.g. Assam, Orissa and Karnataka), the differences are large. This holds for all
poverty indices.
II. Head count ratios vary considerably from 3.6 per cent for Punjab to 41.76 per cent for
Orissa. Further there is considerable variation in the other two FGT measures of
poverty. Thus there is great heterogeneity in poverty incidence across Indian states.
III. What is important to note is that some of the poorest states (viz. Bihar, UP, Orissa,
Madhya Pradesh) continued to exhibit high incidence and severity of poverty in the
60th round. As these states also accounted for a large majority of the poor, it is safe to
conclude that large subsets of the rural population continue to remain in abject
poverty.
IV. Among superior performers, Assam and Maharashtra stand out.
Turning now to within-state inequality we report on the Gini coefficients within the 20 Indian
states for the three recall periods in Table 5.
Table 5: The Gini Coefficient in Select States: 2004
State Gini Gini Gini State Gini Gini Gini 30-day recall 7-day recall Combined 30-day recall 7-day recall Combined
J&K 0.2857 0.28686 0.2891 Assam 0.26354 0.25315 0.26268 Himachal Pradesh 0.32247 0.34237 0.33768 West Bengal 0.35491 0.38784 0.37422 Punjab 0.30412 0.34442 0.32985 Orissa 0.33115 0.35567 0.34649 Haryana 0.28917 0.27829 0.2858 Madhya Pradesh 0.29297 0.31584 0.30892 Rajasthan 0.29802 0.30682 0.30204 Gujarat 0.32668 0.3406 0.33397 UP 0.34145 0.3431 0.3421 Maharashtra 0.38356 0.40212 0.39866 Bihar 0.27494 0.26962 0.27377 Andhra Pradesh 0.39063 0.36082 0.37898 Manipur 0.19766 0.1895 0.19364 Karnataka 0.3484 0.31728 0.33601 Tripura 0.25951 0.24152 0.2518 Kerala 0.39086 0.34752 0.36902 Meghalaya 0.24404 0.21329 0.22983 Tamilnadu 0.39833 0.40536 0.40275
8 Note that the comparisons are relative to the estimates given for the 30 day-recall with adjustments in Sen and Himanshu (2005), and essentially ordinal in nature.
Mean Consumption, Poverty & Inequality in Rural India in the 60th Round of the NSS
ASARC Working Paper 2006/11 11
I. Apart from the relatively small north eastern states with low Ginis, in most other
states the Ginis are high (e.g. Andhra Pradesh, Kerala, Tamil Nadu, Maharashtra,
West Bengal, and UP0, pointing to considerable inequality in consumption
expenditure. Other things being equal, and to the extent that consumption expenditure
inequality reflects inequality in physical (e.g. land) and human capital (e.g.
education), even high rates of growth of income are unlikely to translate into
substantial poverty reduction.9
II. Our second observation is that the Gini and recall period are unrelated in so far as in
some cases the 7-day recall Ginis are higher (e.g. Himachal Pradesh, Punjab, Madhya
Pradesh, Gujarat, Maharashtra, West Bengal) while in others (e.g.Kerala, Karnataka,
Andhra Pradesh, Haryana) the 30-day recall Ginis are higher.
We now report results for the 63 NSS regions in the 20 states studied in the sample. Since
there is considerable heterogeneity in the mean income, poverty and inequality across Indian
states we rank the NSS regions in respect of these criteria. Table 6 reports mean consumption
across the 63 NSS regions.
9 For poverty reduction, some forms of inequality matter more than others. Important ones include inequality in the distribution of assets, especially land, human capital, financial capital, and access to public assets, such as rural infrastructure. The fast growing economies of East and South East Asia had the advantage of low asset inequality compared to other Asian and Pacific economies — in some countries, following land reforms along with a better spread of education. Simulations for selected Asia countries show that even with low historic growth rates observed over 1980–98 continuing over the period 1998–2015, achievement of the MDG of halving poverty by 2015 will depend largely on reduction in income Gini. A case in point is Bangladesh. For details, see Gaiha et al. (2006).

Raghbendra Jha, Raghav Gaiha & Anurag Sharma
ASARC Working Paper 2006/11 12
Table 6: Mean Consumption in 63 NSS regions.
Region
Mean per capita consumption
Rs. per month, using 30 day
recall
Mean per capita consumption Rs. per month, using
7 day recall
Mean per capita consumption
Rs. per month, using combined
data
Orissa - Southern 382.3202 Bihar -Northern 521.3547 Orissa - Southern 435.0203 Bihar - Northern 493.9157 Orissa-Southern 531.7943 Bihar - Northern 506.5602 Andhra Pradesh -
Southwestern 497.7435 Madhya Pradesh - Vindhya 538.4066 Madhya Pradesh - Vindhya 534.5801
Madhya Pradesh - South 513.1753 Manipur Hills 561.6731 Manipur Hills 542.8674
Manipur Hills 529.0483 Madhya Pradesh - Northern 562.1582 Andhra Pradesh - Southwestern 545.6545
Orissa - Coastal 533.5662 Bihar –Central 582.9039 Madhya Pradesh – Southwestern 566.5562
Madhya Pradesh - Vindhya 538.9176 Andhra Pradesh - Southwestern 587.7381 Bihar - Central 567.6301 Orissa - Northern 543.5959 Assam- Hills 588.5093 Assam - Hills 571.2477 Madhya Pradesh -
Southwestern 545.5946 Madhya Pradesh -
South Western 591.7947 Orissa - Coastal 572.8435
Madhya Pradesh - Central 547.9702 Karnataka - Inland Northern 603.7699 Karnataka - Inland Northern 582.4472 Assam - Hills 563.392 Orissa - Coastal 609.3578 Madhya Pradesh - South 584.9811 Bihar - Central 563.7171 UP-Eastern 620.5799 Madhya Pradesh - Northern 587.4471 Karnataka -
Inland Northern 564.5278 J&K - Outer Hills 624.486 Orissa - Northern 591.7593
UP– Eastern 574.0773 UP - Southern 632.0912 UP - Eastern 592.1753 Maharashtra -
Inland Central 585.1088 Madhya Pradesh - South 632.2123 Madhya Pradesh - Central 593.754
Rajasthan - Southern 588.4957 Rajasthan - Southern 637.171 Rajasthan - Southern 611.4989 Tripura 589.8687 Madhya Pradesh - Central 641.9581 UP - Southern 613.5037 Maharashtra– Eastern 596.8489 West Bengal - Eastern Plains 642.4689 Tripura 618.2768 UP - Southern 599.1825 Orissa - Northern 644.5159 Maharashtra - Eastern 635.4515
Rajasthan - Southeastern 604.5262 Andhra Pradesh -
Inland Southern 649.0862 Maharashtra - Inland Central 640.4635
Madhya Pradesh - Northern 613.2689 Tripura 658.7604 West Bengal - Eastern Plains 640.8221
Assam - Western Plains 626.8526 Maharashtra - Eastern 664.6354 Assam - Western Plains 663.589 West Bengal -
Eastern Plains 627.3531 Assam - Western Plains 696.3702 West Bengal - Himalayan 663.9409
Maharashtra - Inland Northern 629.2679 Maharashtra - Inland Central 697.2817 Maharashtra -
Inland Northern 670.1932
West Bengal - Himalayan 633.6284 West Bengal - Himalayan 711.7695 Madhya Pradesh - Malwa 673.7985
Madhya Pradesh — Malwa 640.1963 Madhya Pradesh – Malwa 712.6074 Andhra Pradesh - Inland Southern 677.9223
West Bengal - Western Plains 646.5755 Maharashtra-Inland Northern 734.069 J&K - Outer Hills 678.3652
Gujarat - Eastern Plains 667.4835 Gujarat-Eastern Plains 745.4638 Rajasthan - Southeastern 688.3069
Assam - Eastern Plains 670.2827 Gujarat - Dry Areas 751.0528 West Bengal - Western Plains 701.4953
Gujarat - Dry Areas 677.9898 West Bengal –Western Plains 755.3273 Gujarat - Eastern Plains 707.1367 Karnataka - Inland Eastern 697.7822 Rajasthan-Southeastern 773.8966 Gujarat - Dry Areas 710.1218 Andhra Pradesh -
Inland Southern 714.9236 Assam- Eastern Plains 789.0936 Assam - Eastern Plains 730.0946
Maharashtra - Inland Eastern 721.8851 Rajasthan-Western 792.2087 Karnataka - Inland Eastern 762.0683

Mean Consumption, Poverty & Inequality in Rural India in the 60th Round of the NSS
ASARC Working Paper 2006/11 13
Tamilnadu - Southern 722.0696 Meghalaya 794.7582 Rajasthan - Western 771.4897 UP - Central 746.6434 Rajasthan-Northeastern 796.9272 Andhra Pradesh - Coastal 773.3236 Andhra Pradesh - Coastal 747.1952 Andhra Pradesh - Coastal 800.4125 Maharashtra - Inland Eastern 778.3886 Rajasthan - Western 749.8216 UP -Western 818.5796 UP - Central 780.0228 J&K - Outer Hills 767.5505 UP -Central 820.8091 Meghalaya 789.8932 Tamilnadu - Coastal 782.2574 Karnataka-Inland Eastern 824.569 UP - Western 799.1729 Karnataka -
Coastal and Ghats 787.5728 Haryana-Western 841.1849 Rajasthan - Northeastern 804.0644
UP - Western 787.6173 Maharashtra-Inland Eastern 850.0757 Tamilnadu - Southern 808.3885
Meghalaya 788.2561 Gujarat – Northern Plains 863.3985 Karnataka - Coastal and Ghats 817.7058
Tamilnadu - Inland 788.9409 Karnataka-Coastal and Ghats 864.4428 Tamilnadu - Coastal 821.3376 Rajasthan - Northeastern 812.2178 Tamilnadu-Coastal 866.3769 Haryana - Western 828.0515 Manipur Plains 822.3966 Manipur Plains 867.479 Tamilnadu - Inland 837.6813 Haryana - Western 833.0341 J&K- Jhelum Valley 882.9438 Manipur Plains 839.5699 J&K - Jhelum Valley 850.3121 Tamilnadu-Southern 892.0155 J&K - Jhelum Valley 857.53 Gujarat - Northern Plains 859.2667 Tamilnadu-Inland 902.9814 Gujarat - Northern Plains 862.1294 Karnataka -
Inland Southern 877.3021 Andhra Pradesh -
Inland Northern 906.0837 Karnataka - Inland Southern 905.1707
Andhra Pradesh – Inland Northern 917.9501 Karnataka - Inland Southern 930.2411 Andhra Pradesh -
Inland Northern 918.4969
Kerala - Northern 950.8168 Kerala - Northern 998.5377 Kerala - Northern 967.1696 Gujarat - Saurashtra 964.5867 Gujarat - Saurashtra 999.3153 Gujarat - Saurashtra 973.1618 Punjab - Northern 971.1683 Haryana - Eastern 1028.889 Haryana - Eastern 1052.442 Himachal Pradesh 973.8306 Maharashtra - Inland Western 1103.052 Himachal Pradesh 1059.719 West Bengal -
Central Plains 987.8527 Himachal Pradesh 1144.433 West Bengal - Central Plains 1073.671
Maharashtra - Inland Western 1051.11 West Bengal - Central Plains 1156.964 Maharashtra -
Inland Western 1075.204
Haryana - Eastern 1069.415 Punjab - Northern 1198.37 Punjab - Northern 1080.139 Gujarat - Southern Plains 1091.632 Tamilnadu - Coastal Northern 1203.543 Gujarat - Southern Plains 1177.405 Tamilnadu -
Coastal Northern 1164.955 Punjab - Southern 1251.473 Tamilnadu - Coastal Northern 1180.791
Punjab - Southern 1258.322 Gujarat - Southern Plains 1268.245 Punjab - Southern 1264.877 J&K - Mountains 1288.599 J&K - Mountains 1364.163 J&K - Mountains 1331.709 Kerala - Southern 1370.839 Kerala - Southern 1417.252 Kerala - Southern 1396.197 Maharashtra - Coastal 1504.582 Maharashtra - Coastal 1677.618 Maharashtra - Coastal 1614.205
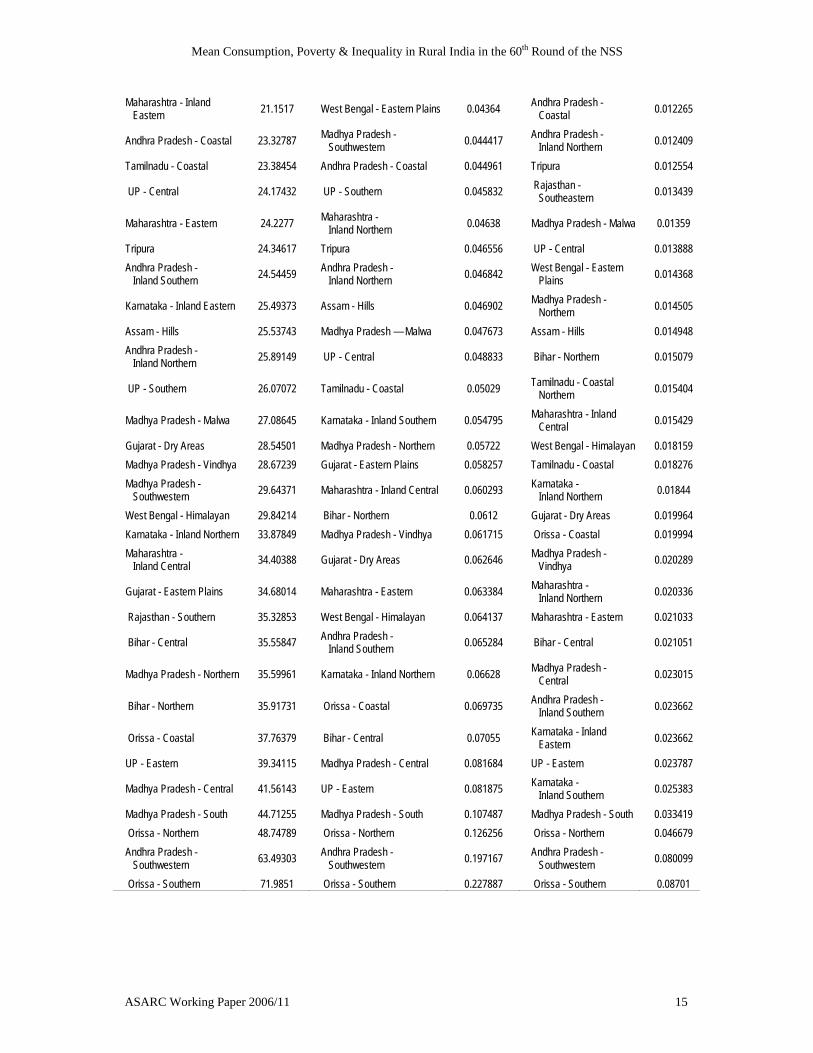
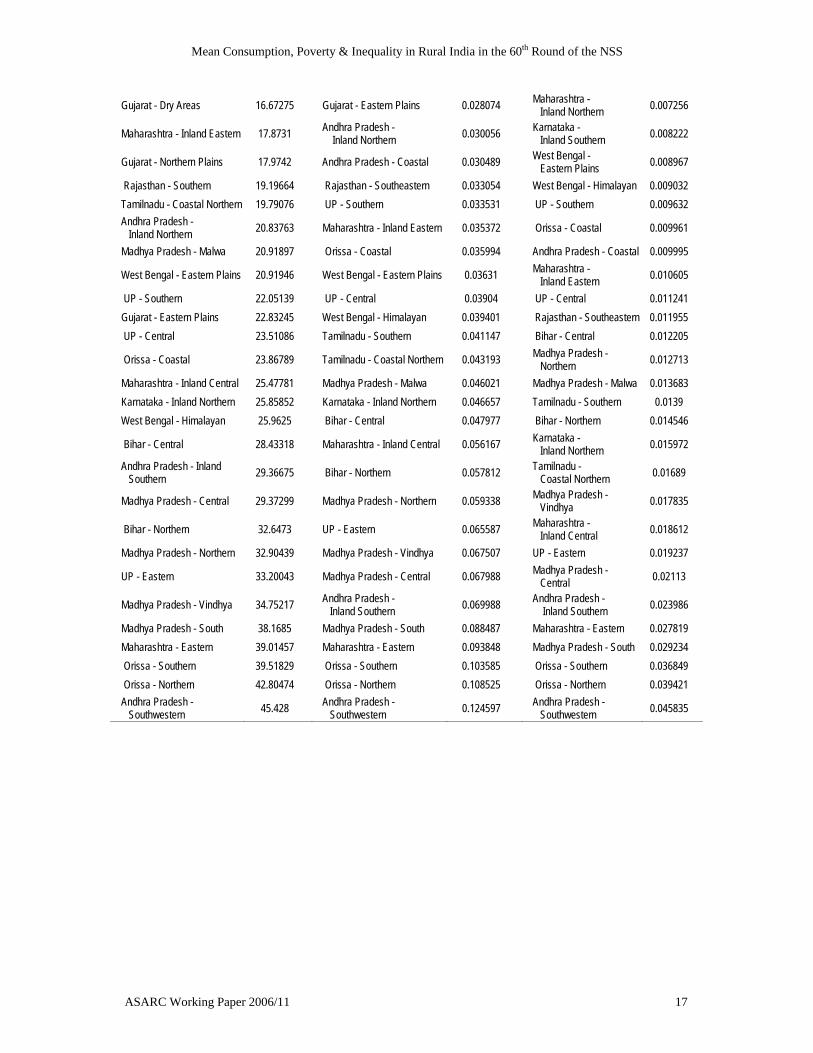
Tables 7, 8 and 9 give results on FGT measures of poverty for 30-day recall, 7-day recall and
combined data for the 63 NSS regions. All figures have been arranged in ascending order to
emphasise regional variations in the incidence and severity of poverty.

Raghbendra Jha, Raghav Gaiha & Anurag Sharma
ASARC Working Paper 2006/11 14
Table 7: Poverty Incidence and severity in NSS regions: 30-day recall
30 - day recall NSS Region PG0 NSS Region PG1 NSS Region PG2
Manipur Plains 0 Manipur Plains 0 Manipur Plains 0 Haryana - Eastern 1.995144 Haryana - Eastern 0.00179 Meghalaya 0.000199 J&K - Mountains 2.895294 Meghalaya 0.001845 Haryana - Eastern 0.000247 J&K - Jhelum Valley 2.907934 Punjab - Northern 0.003454 Punjab - Northern 0.000519
Maharashtra - Coastal 3.634305 Manipur Hills 0.003498 Karnataka - Coastal and Ghats 0.00066
Meghalaya 3.943499 J&K - Mountains 0.004845 J&K - Jhelum Valley 0.00114 Punjab - Northern 3.9572 Maharashtra - Coastal 0.005388 Maharashtra - Coastal 0.001153 Kerala - Southern 4.067028 J&K - Jhelum Valley 0.005462 J&K - Mountains 0.001246
Punjab - Southern 4.1433 Karnataka - Coastal and Ghats 0.007159 Himachal Pradesh 0.001864
Manipur Hills 4.561012 Kerala - Southern 0.007429 J&K - Outer Hills 0.001942 Gujarat - Saurashtra 5.228135 Gujarat - Saurashtra 0.008595 Gujarat - Saurashtra 0.001972 Himachal Pradesh 5.345676 Himachal Pradesh 0.00864 Kerala - Southern 0.002225
Gujarat - Southern Plains 6.689781 Punjab - Southern 0.010032 West Bengal - Central Plains 0.002374
Haryana - Western 7.451478 Gujarat - Southern Plains 0.011498 Gujarat - Southern Plains 0.002509 West Bengal -
Central Plains 8.956159 West Bengal - Central Plains 0.011928 Manipur Hills 0.003498
Kerala - Northern 10.92927 J&K - Outer Hills 0.012849 Maharashtra - Inland Western 0.003785
Maharashtra - Inland Western 13.23083 Maharashtra - Inland Western 0.014966 Rajasthan -
Northeastern 0.003798
Rajasthan - Northeastern 13.38379 Karnataka - Inland Eastern 0.015081 Punjab - Southern 0.003819 Rajasthan - Western 14.01539 Haryana - Western 0.017723 Rajasthan - Western 0.004683 Karnataka -
Coastal and Ghats 14.03725 Rajasthan - Northeastern 0.018409 Haryana - Western 0.005066
Gujarat — Northern Plains 16.34344 Rajasthan - Western 0.021642 Assam - Eastern Plains 0.005972 Rajasthan - Southeastern 16.4631 UP - Western 0.024194 UP - Western 0.006121 UP - Western 16.57037 Assam - Eastern Plains 0.025918 Rajasthan - Southern 0.006542 J&K - Outer Hills 17.4346 Gujarat - Northern Plains 0.026913 Gujarat - Northern Plains 0.006549 Tamilnadu - Southern 17.5686 Tamilnadu - Southern 0.029134 Tamilnadu - Southern 0.00734 Assam - Eastern Plains 17.64185 Tamilnadu - Inland 0.029689 Tamilnadu - Inland 0.007541
Tamilnadu - Inland 18.15908 Kerala - Northern 0.03021 West Bengal - Western Plains 0.009512
Assam - Western Plains 18.40118 West Bengal - Western Plains 0.032159 Maharashtra - Inland Eastern 0.010248
Karnataka - Inland Southern 19.6512 Maharashtra - Inland Eastern 0.033541 Madhya Pradesh - Southwestern 0.01051
West Bengal - Western Plains 20.13886 Assam - Western Plains 0.035572 Assam - Western Plains 0.011132
Tamilnadu - Coastal Northern 20.25069 Rajasthan - Southeastern 0.038519 UP - Southern 0.011806
Maharashtra - Inland Northern 20.52224 Rajasthan - Southern 0.03967 Gujarat - Eastern Plains 0.011842
West Bengal - Eastern Plains 20.71352 Tamilnadu - Coastal Northern 0.040416 Kerala - Northern 0.01211
Mean Consumption, Poverty & Inequality in Rural India in the 60th Round of the NSS
ASARC Working Paper 2006/11 15
Maharashtra - Inland Eastern 21.1517 West Bengal - Eastern Plains 0.04364 Andhra Pradesh -
Coastal 0.012265
Andhra Pradesh - Coastal 23.32787 Madhya Pradesh - Southwestern 0.044417 Andhra Pradesh -
Inland Northern 0.012409
Tamilnadu - Coastal 23.38454 Andhra Pradesh - Coastal 0.044961 Tripura 0.012554
UP - Central 24.17432 UP - Southern 0.045832 Rajasthan - Southeastern 0.013439
Maharashtra - Eastern 24.2277 Maharashtra - Inland Northern 0.04638 Madhya Pradesh - Malwa 0.01359
Tripura 24.34617 Tripura 0.046556 UP - Central 0.013888 Andhra Pradesh -
Inland Southern 24.54459 Andhra Pradesh - Inland Northern 0.046842 West Bengal - Eastern
Plains 0.014368
Karnataka - Inland Eastern 25.49373 Assam - Hills 0.046902 Madhya Pradesh - Northern 0.014505
Assam - Hills 25.53743 Madhya Pradesh — Malwa 0.047673 Assam - Hills 0.014948 Andhra Pradesh -
Inland Northern 25.89149 UP - Central 0.048833 Bihar - Northern 0.015079
UP - Southern 26.07072 Tamilnadu - Coastal 0.05029 Tamilnadu - Coastal Northern 0.015404
Madhya Pradesh - Malwa 27.08645 Karnataka - Inland Southern 0.054795 Maharashtra - Inland Central 0.015429
Gujarat - Dry Areas 28.54501 Madhya Pradesh - Northern 0.05722 West Bengal - Himalayan 0.018159 Madhya Pradesh - Vindhya 28.67239 Gujarat - Eastern Plains 0.058257 Tamilnadu - Coastal 0.018276 Madhya Pradesh -
Southwestern 29.64371 Maharashtra - Inland Central 0.060293 Karnataka - Inland Northern 0.01844
West Bengal - Himalayan 29.84214 Bihar - Northern 0.0612 Gujarat - Dry Areas 0.019964 Karnataka - Inland Northern 33.87849 Madhya Pradesh - Vindhya 0.061715 Orissa - Coastal 0.019994 Maharashtra -
Inland Central 34.40388 Gujarat - Dry Areas 0.062646 Madhya Pradesh - Vindhya 0.020289
Gujarat - Eastern Plains 34.68014 Maharashtra - Eastern 0.063384 Maharashtra - Inland Northern 0.020336
Rajasthan - Southern 35.32853 West Bengal - Himalayan 0.064137 Maharashtra - Eastern 0.021033
Bihar - Central 35.55847 Andhra Pradesh - Inland Southern 0.065284 Bihar - Central 0.021051
Madhya Pradesh - Northern 35.59961 Karnataka - Inland Northern 0.06628 Madhya Pradesh - Central 0.023015
Bihar - Northern 35.91731 Orissa - Coastal 0.069735 Andhra Pradesh - Inland Southern 0.023662
Orissa - Coastal 37.76379 Bihar - Central 0.07055 Karnataka - Inland Eastern 0.023662
UP - Eastern 39.34115 Madhya Pradesh - Central 0.081684 UP - Eastern 0.023787
Madhya Pradesh - Central 41.56143 UP - Eastern 0.081875 Karnataka - Inland Southern 0.025383
Madhya Pradesh - South 44.71255 Madhya Pradesh - South 0.107487 Madhya Pradesh - South 0.033419 Orissa - Northern 48.74789 Orissa - Northern 0.126256 Orissa - Northern 0.046679 Andhra Pradesh -
Southwestern 63.49303 Andhra Pradesh - Southwestern 0.197167 Andhra Pradesh -
Southwestern 0.080099
Orissa - Southern 71.9851 Orissa - Southern 0.227887 Orissa - Southern 0.08701

Raghbendra Jha, Raghav Gaiha & Anurag Sharma
ASARC Working Paper 2006/11 16
Table 8: Poverty Incidence and Severity in NSS regions: 7-day recall
7 - day recall PG0 PG1 PG2 J&K - Mountains 0 J&K - Mountains 0 J&K - Mountains 0
Manipur Plains 0 Manipur Plains 0 Manipur Plains 0 Karnataka -
Coastal and Ghats 0 Karnataka - Coastal and Ghats 0 Karnataka -
Coastal and Ghats 0
Manipur Hills 0.97492 J&K - Jhelum Valley 8.32E - 05 J&K - Jhelum Valley 4.86E - 07 Karnataka - Inland Eastern 1.333028 Manipur Hills 0.000578 Manipur Hills 3.74E - 05
J&K - Jhelum Valley 1.424487 Karnataka - Inland Eastern 0.000729 Karnataka - Inland Eastern 3.98E - 05
Punjab - Northern 2.065513 Haryana - Eastern 0.001386 Haryana - Eastern 9.87E - 05 Maharashtra - Coastal 2.411363 Punjab - Northern 0.001897 J&K - Outer Hills 0.000167 Haryana - Eastern 2.842309 Meghalaya 0.002024 Punjab - Northern 0.000174 Kerala - Southern 3.254454 Assam - Hills 0.002745 Meghalaya 0.000174 Gujarat - Saurashtra 3.510835 Maharashtra - Coastal 0.003524 Assam - Hills 0.000251 Meghalaya 3.748284 Kerala - Southern 0.004053 Maharashtra - Coastal 0.000736 Punjab - Southern 4.01827 J&K - Outer Hills 0.004284 Assam - Eastern Plains 0.000742 Kerala - Northern 4.387776 Assam - Eastern Plains 0.005404 Kerala - Southern 0.000825 Assam - Hills 4.561741 Himachal Pradesh 0.005858 Himachal Pradesh 0.001026 Himachal Pradesh 4.795449 Punjab - Southern 0.007226 Kerala - Northern 0.001285 Assam - Eastern Plains 6.350944 Kerala - Northern 0.007229 Gujarat - Northern Plains 0.001519 West Bengal - Central Plains 6.484249 Gujarat - Saurashtra 0.007927 Punjab - Southern 0.001783
Karnataka - Inland Southern 7.923218 West Bengal - Central Plains 0.009405 Madhya Pradesh - Southwestern 0.001954
Gujarat - Southern Plains 8.775191 Rajasthan - Northeastern 0.012517 West Bengal - Central Plains 0.002118
Tamilnadu - Inland 9.206844 Madhya Pradesh - Southwestern 0.012762 Rajasthan - Northeastern 0.002674
Rajasthan - Western 9.948625 Gujarat - Northern Plains 0.014159 Gujarat - Saurashtra 0.002875 Maharashtra -
Inland Western 9.981079 West Bengal - Western Plains 0.015367 Tamilnadu - Coastal 0.002955
Haryana - Western 10.52494 Maharashtra - Inland Western 0.015481 West Bengal - Western Plains 0.003024
Madhya Pradesh - Southwestern 10.66594 Haryana - Western 0.016243 Maharashtra - Inland
Western 0.003718
J&K - Outer Hills 11.01397 Tamilnadu - Coastal 0.01641 Gujarat - Dry Areas 0.004049 UP - Western 11.84736 Rajasthan - Western 0.016589 Haryana - Western 0.004199 Rajasthan - Northeastern 13.03963 Tamilnadu - Inland 0.017995 UP - Western 0.004266 Assam - Western Plains 13.15418 UP - Western 0.018813 Rajasthan - Western 0.004583 Tamilnadu - Coastal 13.7651 Karnataka - Inland Southern 0.021252 Tamilnadu - Inland 0.005001 Maharashtra - Inland
Northern 13.94992 Tripura 0.021659 Gujarat - Eastern Plains 0.005184
West Bengal - Western Plains 14.3031 Gujarat - Dry Areas 0.02245 Tripura 0.005615
Tripura 14.81768 Gujarat - Southern Plains 0.023258 Assam - Western Plains 0.006164
Rajasthan - Southeastern 15.32071 Assam - Western Plains 0.024826 Andhra Pradesh - Inland Northern 0.006918
Andhra Pradesh - Coastal 15.68051 Maharashtra - Inland Northern 0.027101 Gujarat - Southern Plains 0.006944
Tamilnadu - Southern 16.3625 Rajasthan - Southern 0.027602 Rajasthan - Southern 0.006958
Mean Consumption, Poverty & Inequality in Rural India in the 60th Round of the NSS
ASARC Working Paper 2006/11 17
Gujarat - Dry Areas 16.67275 Gujarat - Eastern Plains 0.028074 Maharashtra - Inland Northern 0.007256
Maharashtra - Inland Eastern 17.8731 Andhra Pradesh - Inland Northern 0.030056 Karnataka -
Inland Southern 0.008222
Gujarat - Northern Plains 17.9742 Andhra Pradesh - Coastal 0.030489 West Bengal - Eastern Plains 0.008967
Rajasthan - Southern 19.19664 Rajasthan - Southeastern 0.033054 West Bengal - Himalayan 0.009032 Tamilnadu - Coastal Northern 19.79076 UP - Southern 0.033531 UP - Southern 0.009632 Andhra Pradesh -
Inland Northern 20.83763 Maharashtra - Inland Eastern 0.035372 Orissa - Coastal 0.009961
Madhya Pradesh - Malwa 20.91897 Orissa - Coastal 0.035994 Andhra Pradesh - Coastal 0.009995
West Bengal - Eastern Plains 20.91946 West Bengal - Eastern Plains 0.03631 Maharashtra - Inland Eastern 0.010605
UP - Southern 22.05139 UP - Central 0.03904 UP - Central 0.011241 Gujarat - Eastern Plains 22.83245 West Bengal - Himalayan 0.039401 Rajasthan - Southeastern 0.011955 UP - Central 23.51086 Tamilnadu - Southern 0.041147 Bihar - Central 0.012205
Orissa - Coastal 23.86789 Tamilnadu - Coastal Northern 0.043193 Madhya Pradesh - Northern 0.012713
Maharashtra - Inland Central 25.47781 Madhya Pradesh - Malwa 0.046021 Madhya Pradesh - Malwa 0.013683 Karnataka - Inland Northern 25.85852 Karnataka - Inland Northern 0.046657 Tamilnadu - Southern 0.0139 West Bengal - Himalayan 25.9625 Bihar - Central 0.047977 Bihar - Northern 0.014546
Bihar - Central 28.43318 Maharashtra - Inland Central 0.056167 Karnataka - Inland Northern 0.015972
Andhra Pradesh - Inland Southern 29.36675 Bihar - Northern 0.057812 Tamilnadu -
Coastal Northern 0.01689
Madhya Pradesh - Central 29.37299 Madhya Pradesh - Northern 0.059338 Madhya Pradesh - Vindhya 0.017835
Bihar - Northern 32.6473 UP - Eastern 0.065587 Maharashtra - Inland Central 0.018612
Madhya Pradesh - Northern 32.90439 Madhya Pradesh - Vindhya 0.067507 UP - Eastern 0.019237
UP - Eastern 33.20043 Madhya Pradesh - Central 0.067988 Madhya Pradesh - Central 0.02113
Madhya Pradesh - Vindhya 34.75217 Andhra Pradesh - Inland Southern 0.069988 Andhra Pradesh -
Inland Southern 0.023986
Madhya Pradesh - South 38.1685 Madhya Pradesh - South 0.088487 Maharashtra - Eastern 0.027819 Maharashtra - Eastern 39.01457 Maharashtra - Eastern 0.093848 Madhya Pradesh - South 0.029234 Orissa - Southern 39.51829 Orissa - Southern 0.103585 Orissa - Southern 0.036849 Orissa - Northern 42.80474 Orissa - Northern 0.108525 Orissa - Northern 0.039421 Andhra Pradesh -
Southwestern 45.428 Andhra Pradesh - Southwestern 0.124597 Andhra Pradesh -
Southwestern 0.045835

Raghbendra Jha, Raghav Gaiha & Anurag Sharma
ASARC Working Paper 2006/11 18
Table 9: Poverty Incidence and severity in NSS regions: Combined data
Combined NSS Region PG0 NSS Region PG1 NSS Region PG2 Manipur Plains 0 Manipur Plains 0 Manipur Plains 0 J&K - Mountains 1.445786 Haryana - Eastern 0.001588 Manipur Hills 0.000168 J&K - Jhelum Valley 2.163806 Meghalaya 0.001935 Haryana - Eastern 0.000173 Haryana - Eastern 2.418539 Manipur Hills 0.002035 Meghalaya 0.000187
Manipur Hills 2.764995 J&K - Mountains 0.002419 Karnataka - Coastal and Ghats 0.00033
Punjab - Northern 3.008528 Punjab - Northern 0.002673 Punjab - Northern 0.000346 Maharashtra - Coastal 3.024544 J&K - Jhelum Valley 0.002764 J&K - Jhelum Valley 0.000568
Kerala - Southern 3.660594 Karnataka - Coastal and Ghats 0.003576 J&K - Mountains 0.000622
Meghalaya 3.845778 Maharashtra - Coastal 0.004459 Maharashtra - Coastal 0.000945 Punjab - Southern 4.080785 Kerala - Southern 0.00574 Karnataka - Inland Eastern 0.001003 Gujarat - Saurashtra 4.377181 Himachal Pradesh 0.007251 J&K - Outer Hills 0.001064
Himachal Pradesh 5.070846 Karnataka - Inland Eastern 0.007905 Himachal Pradesh 0.001445
Karnataka - Coastal and Ghats 7.011182 Gujarat - Saurashtra 0.008264 Kerala - Southern 0.001524
Kerala - Northern 7.654714 J&K - Outer Hills 0.008611 West Bengal – Central Plains 0.002247
West Bengal - Central Plains 7.72978 Punjab - Southern 0.008629 Gujarat - Saurashtra 0.002419
Gujarat - Southern Plains 7.732287 West Bengal - Central
Plains 0.010676 Punjab - Southern 0.002801
Haryana - Western 8.988088 Maharashtra - Inland Western 0.015223 Rajasthan - Northeastern 0.003237
Maharashtra - Inland Western 11.60792 Rajasthan -
Northeastern 0.01547 Assam - Eastern Plains 0.00335
Rajasthan - Western 11.98063 Assam - Eastern Plains 0.015635 Maharashtra -
Inland Western 0.003752
Assam - Eastern Plains 11.98233 Haryana - Western 0.016983 Gujarat - Northern Plains 0.004034 Rajasthan -
Northeastern 13.21208 Gujarat - Southern Plains 0.017377 Haryana - Western 0.004633
Karnataka - Inland Eastern 13.41338 Kerala - Northern 0.018706 Rajasthan - Western 0.004633
Tamilnadu - Inland 13.66444 Rajasthan - Western 0.019114 Gujarat - Southern Plains 0.004726 Karnataka -
Inland Southern 13.79427 Gujarat - Northern Plains 0.020537 UP - Western 0.005196
UP - Western 14.21644 UP - Western 0.021512 Madhya Pradesh - Southwestern 0.006241
J&K - Outer Hills 14.25788 West Bengal - Western Plains 0.0237 West Bengal - Western
Plains 0.006244
Assam - Hills 15.09375 Tamilnadu - Inland 0.023818 Tamilnadu - Inland 0.006266 Assam - Western Plains 15.77768 Assam - Hills 0.024916 Kerala - Northern 0.006691 Rajasthan -
Southeastern 15.89191 Madhya Pradesh - Southwestern 0.028624 Rajasthan - Southern 0.00675
Tamilnadu - Southern 16.96555 Assam - Western Plains 0.030199 Assam - Hills 0.00763
Gujarat - Northern Plains 17.15877 Tamilnadu - Coastal 0.033359 Gujarat - Eastern Plains 0.008515 West Bengal -
Western Plains 17.19903 Rajasthan - Southern 0.033635 Assam - Western Plains 0.008648 Maharashtra -
Inland Northern 17.2416 Tripura 0.034107 Tripura 0.009084
Tamilnadu - Coastal 18.57746 Maharashtra - Inland Eastern 0.034448 Andhra Pradesh -
Inland Northern 0.009662 Andhra Pradesh -
Coastal 19.51589 Tamilnadu - Southern 0.035141 Maharashtra - Inland Eastern 0.010425

Mean Consumption, Poverty & Inequality in Rural India in the 60th Round of the NSS
ASARC Working Paper 2006/11 19
Maharashtra - Inland Eastern 19.52682 Rajasthan -
Southeastern 0.035786 Tamilnadu - Coastal 0.01062
Tripura 19.58193 Maharashtra - Inland Northern 0.036756 Tamilnadu - Southern 0.01062
Tamilnadu - Coastal Northern 20.02052 Andhra Pradesh -
Coastal 0.037747 UP - Southern 0.010719 Madhya Pradesh -
Southwestern 20.17593 Karnataka - Inland Southern 0.038043 Andhra Pradesh - Coastal 0.011133
West Bengal - Eastern Plains 20.81617 Andhra Pradesh -
Inland Northern 0.038443 West Bengal - Eastern Plains 0.011676
Gujarat - Dry Areas 22.60888 UP - Southern 0.039682 Gujarat - Dry Areas 0.012006 Andhra Pradesh -
Inland Northern 23.36284 West Bengal - Eastern Plains 0.039986 UP - Central 0.012565
UP - Central 23.84277 Tamilnadu - Coastal Northern 0.041806 Rajasthan - Southeastern 0.012697
Madhya Pradesh - Malwa 24.04948 Gujarat - Dry Areas 0.042548 Madhya Pradesh - Northern 0.013611
UP - Southern 24.06105 Gujarat - Eastern Plains 0.043176 Madhya Pradesh - Malwa 0.013636
Andhra Pradesh - Inland Southern 26.94954 UP - Central 0.043939 West Bengal - Himalayan 0.013647
Rajasthan - Southern 27.26148 Madhya Pradesh - Malwa 0.04686 Maharashtra -
Inland Northern 0.013807 West Bengal -
Himalayan 27.92417 West Bengal - Himalayan 0.051908 Bihar - Northern 0.014814
Gujarat - Eastern Plains 28.7604 Orissa - Coastal 0.052853 Orissa - Coastal 0.014974 Karnataka -
Inland Northern 29.87136 Karnataka - Inland Northern 0.056475 Tamilnadu -
Coastal Northern 0.016148 Maharashtra -
Inland Central 29.94484 Maharashtra - Inland Central 0.058231 Bihar - Central 0.016644
Orissa - Coastal 30.81099 Madhya Pradesh - Northern 0.058277 Karnataka - Inland Southern 0.016813
Maharashtra - Eastern 31.64293 Bihar - Central 0.059304 Maharashtra - Inland Central 0.017019
Madhya Pradesh - Vindhya 31.71062 Bihar - Northern 0.059516 Karnataka - Inland Northern 0.017207
Bihar - Central 32.00861 Madhya Pradesh - Vindhya 0.064609 Madhya Pradesh - Vindhya 0.019062
Madhya Pradesh - Northern 34.25524 Andhra Pradesh -
Inland Southern 0.06763 UP - Eastern 0.021517
Bihar - Northern 34.29257 UP - Eastern 0.073751 Madhya Pradesh - Central 0.022072 Madhya Pradesh -
Central 35.46721 Madhya Pradesh - Central 0.074836 Andhra Pradesh -
Inland Southern 0.023824
UP - Eastern 36.27837 Maharashtra - Eastern 0.078661 Maharashtra - Eastern 0.024436
Madhya Pradesh - South 41.44052 Madhya Pradesh - South 0.097987 Madhya Pradesh - South 0.031327
Orissa - Northern 45.7791 Orissa - Northern 0.117399 Orissa - Northern 0.043054 Andhra Pradesh -
Southwestern 54.46258 Andhra Pradesh - Southwestern 0.16089 Orissa - Southern 0.061833
Orissa - Southern 55.68906 Orissa - Southern 0.165496 Andhra Pradesh - Southwestern 0.062971
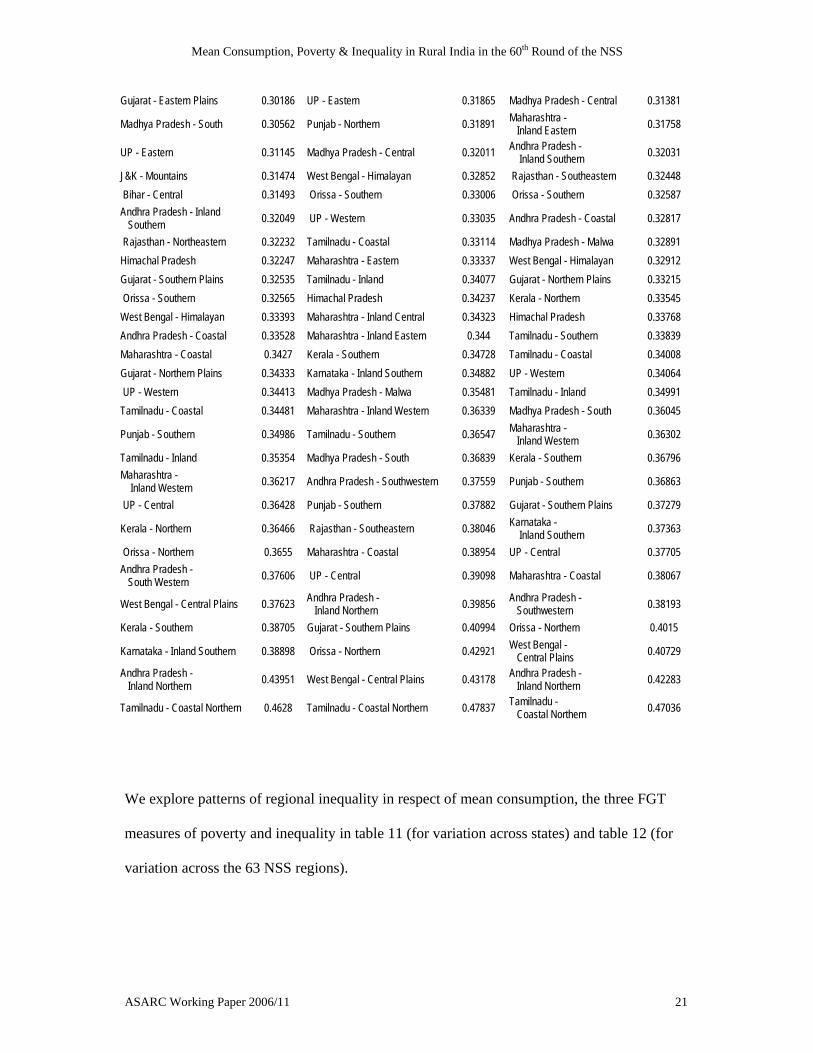
In Table 10 we report on the Gini coefficients in these regions again arranged in ascending
order.

Raghbendra Jha, Raghav Gaiha & Anurag Sharma
ASARC Working Paper 2006/11 20
Table 10: Gini Coefficients in NSS regions
30-day recall 7-day recall Combined data Manipur Hills 0.11239 Manipur Hills 0.11079 Manipur Hills 0.11188 Manipur Plains 0.18049 J&K - Outer Hills 0.13973 Manipur Plains 0.17562 J&K - Jhelum Valley 0.21909 Assam - Hills 0.16327 Assam - Hills 0.19526 Assam - Hills 0.22145 Manipur Plains 0.16933 J&K - Jhelum Valley 0.21503
J&K - Outer Hills 0.24019 Madhya Pradesh - Southwestern 0.18242 Madhya Pradesh -
Southwestern 0.21943
Bihar - Northern 0.24126 Meghalaya 0.21329 J&K - Outer Hills 0.22000 Karnataka - Coastal and
Ghats 0.24388 J&K - Jhelum Valley 0.21625 Meghalaya 0.22983
Meghalaya 0.24404 Karnataka - Inland Eastern 0.22444 Karnataka - Coastal and Ghats 0.24522
Rajasthan - Southeastern 0.24477 Tripura 0.24152 Bihar - Northern 0.24859 Madhya Pradesh -
Southestern 0.24609 Karnataka - Coastal and Ghats 0.24563 Tripura 0.25180
Madhya Pradesh - Vindhya 0.24971 Bihar - Northern 0.24883 UP - Southern 0.25236
UP - Southern 0.2508 Assam - Western Plains 0.24883 Karnataka - Inland Eastern 0.25381
Punjab - Northern 0.25649 Rajasthan - Southern 0.24919 Haryana - Western 0.25941 Tripura 0.25951 Haryana - Western 0.25187 Assam - Western Plains 0.26137 Rajasthan - Western 0.26048 UP - Southern 0.25449 Madhya Pradesh - Vindhya 0.26400 Assam - Western Plains 0.26312 Maharashtra - Inland Northern 0.25478 Assam - Eastern Plains 0.26468 Assam - Eastern Plains 0.26317 Madhya Pradesh - Northern 0.25747 Rajasthan - Southern 0.26665 Karnataka - Inland Eastern 0.26547 Assam - Eastern Plains 0.25809 Gujarat - Saurashtra 0.27066
Haryana - Western 0.26674 Karnataka - Inland Northern 0.26799 Maharashtra - Inland Northern 0.27128
Gujarat - Saurashtra 0.26899 Madhya Pradesh - Vindhya 0.27128 Rajasthan - Western 0.27569
Maharashtra - Eastern 0.27177 Gujarat - Saurashtra 0.27146 Karnataka - Inland Northern 0.27956
Maharashtra - Inland Central 0.27182 West Bengal - Eastern Plains 0.27642 Madhya Pradesh - Northern 0.28368
Orissa - Coastal 0.27493 Haryana - Eastern 0.28495 West Bengal - Eastern Plains 0.28490
Rajasthan - Southern 0.2754 West Bengal - Western Plains 0.28576 West Bengal - Western Plains 0.28818
West Bengal - Western Plains 0.27837 Rajasthan - Western 0.28983 Haryana - Eastern 0.29034
Maharashtra - Inland Northern 0.28147 Gujarat - Dry Areas 0.29377 Orissa - Coastal 0.29182
West Bengal - Eastern Plains 0.28278 Bihar - Central 0.29509 Gujarat - Dry Areas 0.29385 Karnataka - Inland Northern 0.28706 J&K - Mountains 0.29654 Punjab - Northern 0.29601 Maharashtra - Inland Eastern 0.28843 Orissa - Coastal 0.29759 J&K - Mountains 0.30041 Haryana - Eastern 0.29132 Gujarat - Eastern Plains 0.30148 Gujarat - Eastern Plains 0.30251 Gujarat - Dry Areas 0.29428 Rajasthan - Northeastern 0.3029 Bihar - Central 0.30484
Tamilnadu - Southern 0.29634 Andhra Pradesh - Inland Southern 0.31056 Rajasthan - Northeastern 0.31143
Madhya Pradesh - Central 0.29698 Kerala - Northern 0.3109 UP - Eastern 0.31147 Madhya Pradesh - Northern 0.29727 Andhra Pradesh - Coastal 0.31293 Maharashtra - Eastern 0.31184
Madhya Pradesh - Malwa 0.3002 Gujarat - Northern Plains 0.31535 Maharashtra - Inland Central 0.31319
Mean Consumption, Poverty & Inequality in Rural India in the 60th Round of the NSS
ASARC Working Paper 2006/11 21
Gujarat - Eastern Plains 0.30186 UP - Eastern 0.31865 Madhya Pradesh - Central 0.31381
Madhya Pradesh - South 0.30562 Punjab - Northern 0.31891 Maharashtra - Inland Eastern 0.31758
UP - Eastern 0.31145 Madhya Pradesh - Central 0.32011 Andhra Pradesh - Inland Southern 0.32031
J&K - Mountains 0.31474 West Bengal - Himalayan 0.32852 Rajasthan - Southeastern 0.32448 Bihar - Central 0.31493 Orissa - Southern 0.33006 Orissa - Southern 0.32587 Andhra Pradesh - Inland
Southern 0.32049 UP - Western 0.33035 Andhra Pradesh - Coastal 0.32817
Rajasthan - Northeastern 0.32232 Tamilnadu - Coastal 0.33114 Madhya Pradesh - Malwa 0.32891 Himachal Pradesh 0.32247 Maharashtra - Eastern 0.33337 West Bengal - Himalayan 0.32912 Gujarat - Southern Plains 0.32535 Tamilnadu - Inland 0.34077 Gujarat - Northern Plains 0.33215 Orissa - Southern 0.32565 Himachal Pradesh 0.34237 Kerala - Northern 0.33545 West Bengal - Himalayan 0.33393 Maharashtra - Inland Central 0.34323 Himachal Pradesh 0.33768 Andhra Pradesh - Coastal 0.33528 Maharashtra - Inland Eastern 0.344 Tamilnadu - Southern 0.33839 Maharashtra - Coastal 0.3427 Kerala - Southern 0.34728 Tamilnadu - Coastal 0.34008 Gujarat - Northern Plains 0.34333 Karnataka - Inland Southern 0.34882 UP - Western 0.34064 UP - Western 0.34413 Madhya Pradesh - Malwa 0.35481 Tamilnadu - Inland 0.34991 Tamilnadu - Coastal 0.34481 Maharashtra - Inland Western 0.36339 Madhya Pradesh - South 0.36045
Punjab - Southern 0.34986 Tamilnadu - Southern 0.36547 Maharashtra - Inland Western 0.36302
Tamilnadu - Inland 0.35354 Madhya Pradesh - South 0.36839 Kerala - Southern 0.36796 Maharashtra -
Inland Western 0.36217 Andhra Pradesh - Southwestern 0.37559 Punjab - Southern 0.36863
UP - Central 0.36428 Punjab - Southern 0.37882 Gujarat - Southern Plains 0.37279
Kerala - Northern 0.36466 Rajasthan - Southeastern 0.38046 Karnataka - Inland Southern 0.37363
Orissa - Northern 0.3655 Maharashtra - Coastal 0.38954 UP - Central 0.37705 Andhra Pradesh -
South Western 0.37606 UP - Central 0.39098 Maharashtra - Coastal 0.38067
West Bengal - Central Plains 0.37623 Andhra Pradesh - Inland Northern 0.39856 Andhra Pradesh -
Southwestern 0.38193
Kerala - Southern 0.38705 Gujarat - Southern Plains 0.40994 Orissa - Northern 0.4015
Karnataka - Inland Southern 0.38898 Orissa - Northern 0.42921 West Bengal - Central Plains 0.40729
Andhra Pradesh - Inland Northern 0.43951 West Bengal - Central Plains 0.43178 Andhra Pradesh -
Inland Northern 0.42283
Tamilnadu - Coastal Northern 0.4628 Tamilnadu - Coastal Northern 0.47837 Tamilnadu - Coastal Northern 0.47036
We explore patterns of regional inequality in respect of mean consumption, the three FGT
measures of poverty and inequality in table 11 (for variation across states) and table 12 (for
variation across the 63 NSS regions).

Raghbendra Jha, Raghav Gaiha & Anurag Sharma
ASARC Working Paper 2006/11 22
Table 11: Variation of Mean Consumption, Poverty and Inequality across Indian States
Average Highest Lowest Coefficient of Variation
30 day recall 802.64 1220. 35 507.98 0.24 7 day recall 865.32 1267.08 546.15 0.237
Mean Consumption (Rs. per capita per month) Combined 832.49 1242.27 531.10 0.238
30 day recall 18.25 48.97 1.43 0.70 7 day recall 13.53 34.07 0.348 0.73 PG0 Combined 15.96 41.76 0.92 0.71 30 day recall 0.035 0.121 0.001 0.84 7 day recall 0.02 0.075 0.0002 0.89 PG1 Combined 0.029 0.0989 0.000682 0.85 30 day recall 0.0107 0.042 9.41E-05 0.95 7 day recall 0.0069 0.025 1.34E-05 0.995 PG2 Combined 0.0088 0.0344 5.26E-05 0.958 30 day recall 0.314 0.398 0.197 0.171 7 day recall 0.315 0.405 0.189 0.190 Gini Coefficient Combined 0.317 0.402 0.193 0.1778
It is interesting to note that the 7-day recall magnitudes are generally more volatile than 30-
day magnitudes with the combined results lying in between. Further, the coefficients of
variation of the FGT measures are much higher than those for mean consumption and the
Gini coefficient. Within the FGT measures PG2 has higher coefficient of variation than PG1
which in turn has a higher coefficient of variation than PG0. Thus poverty, particularly severe
poverty, is more volatile.
Table 12: Variation of Mean Consumption, Poverty and Inequality across 63 NSS regions
Average Highest Lowest Coefficient of Variation
30 day recall 758.91 1504.58 382.32 0.304 7 day recall 822.57 1677.62 521.35 0.294
Mean Consumption (Rs. per capita per month) Combined 788.91 1614.20 435.02 0.300
30 day recall 21.84 71.98 0 0.668 7 day recall 16.219 45.428 0 0.964 PG0 Combined 19.03 55.689 0 0.675 30 day recall 0.043 0.2278 0 0.945 7 day recall 0.03 0.124 0 0.964 PG1 Combined 0.036 0.165 0 0.923 30 day recall 0.013 0.087 0 1.131 7 day recall 0.008 0.045 0 0.964 PG2 Combined 0.011 0.062 0 1.117 30 day recall 0.299 0.4628 0.112 0.194 7 day recall 0.3033 0.478 0.110 0.235 Gini Coefficient Combined 0.305 0.470 0.111 0.202
Mean Consumption, Poverty & Inequality in Rural India in the 60th Round of the NSS
ASARC Working Paper 2006/11 23
We offer additional comments by concentrating on the upper and lower tails of the
distributions for average, consumption, FGT indices and the consumption Ginis. In order to
avoid tedious comparisons, we will first pick the lowest 5 regions in terms of per capita
consumption and the highest five, using the 30-day recall. How many of these overlap with
those with the lowest or highest FGT indices and Gini coefficients would help understand
better spatial dimensions of well-being, deprivation and inequality.
I. The regions with the lowest per capita expenditure (in ascending order) are10:
Orissa-Southern
Bihar-Northern
Andhra Pradesh-South western
Madhya Pradesh-South
Orissa-Coastal.
Those with the highest per capita expenditure (in ascending order) are:
Tamil Nadu-Coastal Northern
Punjab-Southern
J&K-Mountains
Kerala-Southern
Maharashtra-Coastal
II. It turns out that three out of the five regions with the lowest per capita expenditure are
also the ones with the highest incidence of poverty (PG0). These are (in ascending
order):
Madhya Pradesh-South
Andhra Pradesh-South Western
Orissa-Southern
10 Manipur Hills is omitted, as it belongs to a relatively small state.

Raghbendra Jha, Raghav Gaiha & Anurag Sharma
ASARC Working Paper 2006/11 24
Let us now examine the overlap with regions with the highest distributionally sensitive
poverty (PG2). It turns out that the regions with the highest incidence of poverty are
also the ones with the highest PG2.
III. There is some overlap between regions with the highest per capita expenditure and
lowest incidence of poverty (PG0). These are :
J&K-Mountains
Maharashtra-Coastal
The overlap with regions with the lowest PG2 is smaller, as it comprises just one
region viz. Maharashtra –Coastal.
IV. Let us now turn to the overlap between lowest consumption and lowest Gini. The
overlap is small comprising Madhya Pradesh-South.
V. The overlap between regions with the highest consumption and Gini is not so small, as
it comprises Kerala-Southern, and Tamil Nadu-Coastal Northern.
VI.Finally, let us examine the overlap between the Ginis and FGT indices. The regions
with the highest Ginis (in ascending order) are:
West Bengal-Central Plains
Kerala-Southern
Karnataka-Inland Southern
Andhra Pradesh-Inland Northern
Tamil Nadu-Coastal Northern.
None of these regions overlaps with those with the highest incidence of poverty (PG0).
However, there is some overlap with regions with the highest distributionally sensitive
poverty, comprising Karnataka –Inland Southern.

Mean Consumption, Poverty & Inequality in Rural India in the 60th Round of the NSS
ASARC Working Paper 2006/11 25
IV. Concluding Remarks
Even though we have not gone beyond ordinal comparisons with the estimates of
poverty and inequality from the previous 55th round of the NSS, some of the findings
are noteworthy. First, more than a few of the states (e.g. UP, Madhya Pradesh, Orissa),
with high levels of poverty measured using the FGT class of poverty indices, and high
concentrations of the poor in rural areas continue to do so in the 60th round of the NSS.
Second, except for the small north eastern states, high levels of inequality in
consumption expenditure distribution persisted in many of the states. Third, the overlap
between regions with the lowest consumption expenditure and highest poverty, and
between those with highest consumption and lowest poverty was far from negligible.
Fourth, the overlaps between lowest consumption expenditure and lowest Ginis, and
between highest consumption and highest Ginis were negligible or small. Fifth, in
general, the 7-day recall magnitudes (average consumption expenditure, poverty and
inequality) are more volatile than 30-day magnitudes. Sixth, the CVs of the FGT
measures are higher than those for mean consumption and the Gini coefficient. Finally,
the CVs of PG2 (or distributionally sensitive poverty) are higher than those of PG1
(intensity of poverty) which in turn are higher than those of PG0 (or the head-count
ratio). It is surmised that despite impressive growth rates deprivation is pervasive,
pockets of severe poverty persist, and inequality is rampant.
Raghbendra Jha, Raghav Gaiha & Anurag Sharma
ASARC Working Paper 2006/11 26
References
Datt, G., V. Kozel and M. Ravallion (2005) “A Model-Based Assessment of India’s Progress in Reducing Poverty in the 1990s”, in Deaton and Kozel (eds).
Deaton, A. “Adjusted Indian Poverty Estimates for 1999/2000”, in Deaton and Kozel (eds).
Deaton, A. and V. Kozel (eds) (2005) The Great Indian Poverty Debate, New Delhi: Macmillan.
Gaiha, R. (1995) “Does Agricultural Growth Matter in Poverty Alleviation?’, Development and Change, 26(2): 285–304.
Gaiha, R., and K. Imai (2004) “Vulnerability, Shocks and Persistent of Poverty: Estimates for Semi-Arid Rural South India”, Oxford Development Studies, 32(2): 261–81.
Gaiha, R. and V. Kulkarni (2005) “Anthropometric Failure and Persistence of Poverty in Rural India”, International Review of Applied Economics, 19(2): 179–97.
Gaiha, R., K. Imai and M.A. Nandhi (2006) “Millennium Development Goal of Halving Poverty in Asia and the Pacific Region — Progress, Prospects and Priorities”, Rome: IFAD, Occasional Papers 1.
Jha, R. and R. Gaiha (2003) “The Determinants of Undernutrition in Rural India”, ASARC Working Paper, 2003/01, Australian National University.
Jha, R. and A. Sharma (2003) “Spatial Distribution of Rural Poverty – Last Three Quinquennial Rounds of the NSS” Economic and Political Weekly, 39: 4985–93 (22 November).
Kijima, Y. and P. Lanjouw (2003) “Poverty in India During the 1990s: A Regional Perspective”, Washington DC: World Bank, World Bank Policy Research Working Paper 3141.
Nayyar, R. (2003) “India Country Study”, New Delhi: Planning Commission, Government of India (mimeo).
Sen, A. and Himanshu (2004) “Poverty and Inequality in India-I”, Economic and Political Weekly, 40: 4247–63 (18 September).
Sen, A, and Himanshu (2005) “Poverty and Inequality in India”, in Deaton and Kozel (eds).
Sundaram, K. and S. Tendulkar (2005) “Poverty Outcomes in India in the 1990s”, in Deaton and Kozel (eds).
Sundaram, K. and S. Tendulkar (2003) “Poverty in India in the 1990s — Revised Results for All-India and 15 Major States for 1993-94”, Economic and Political Weekly, 39: 4826–72 (15 November).