Mead, Rohan and Cummins, Robert 2010,...
41
This is the published version: Mead, Rohan and Cummins, Robert 2010, What makes us happy? Ten years of the Australian unity wellbeing index, 2nd ed., Australian Unity : Deakin University, [Melbourne, Vic.]. Available from Deakin Research Online: http://hdl.handle.net/10536/DRO/DU:30032977 Reproduced with the kind permission of the copyright owner. Copyright : 2010, Deakin University & Australian Unity
Transcript of Mead, Rohan and Cummins, Robert 2010,...
This is the published version: Mead,RohanandCummins,Robert2010,Whatmakesushappy?TenyearsoftheAustralianunitywellbeingindex,2nded.,AustralianUnity:DeakinUniversity,[Melbourne,Vic.].
Available from Deakin Research Online: http://hdl.handle.net/10536/DRO/DU:30032977Reproducedwiththekindpermissionofthecopyrightowner.Copyright:2010,DeakinUniversity&AustralianUnity

Ten years of the Australian
Unity Wellbeing Index
What makes
us happy?Second edition

Contents
Foreword 2Welcome 3Introduction 4 Become a ‘well being’ 6Wellbeing of Australians 8Life in Australia 10 Happiest Australians 16Men and women 18Relationships 19
Where do the happiest people live? 22Does money make us happy? 24Home ownership 28Health and happiness 30Employment 32Volunteering 34Caring and wellbeing 35What makes us feel connected? 36Wellbeing research 38List of reports 39
Since its conception in 2000, the Australian Unity Wellbeing Index, developed in partnership with Deakin University, has become a leading authority and measure on how Australians feel about themselves. Over the past 10 years, the wellbeing concept has been taken up by many others including local government, scholars, media, statisticians, treasury officers and the general community.
Economics has dominated social sciences for a very long time and is an important discipline, but it has failed in one key area. It doesn’t handle well, and can sometimes ignore, components of society that are difficult to measure with a monetary value. This has meant that the traditional ‘measures’ of social progress fail to take properly into account important elements such as community spirit and quality of life. At Australian Unity, we are proud that we have been able to support emerging areas of social science which give a more comprehensive assessment of society’s wellbeing and in fact help us understand more about ways of supporting, growing and developing wellbeing. It is our hope that this research, and other research it inspires, will continue to help Australians to meaningfully build our community and our society.
The Australian Unity Wellbeing Index is a scientific measure of subjective wellbeing and of our national and personal satisfaction with life. National satisfaction relates to economic, environmental and social conditions, whereas personal satisfaction looks at satisfaction with health, personal relationships, safety, community connectedness, future security, spirituality and standard
Forewordof living. When factoring in all these measures, on a scale of 0-100 Australians rate highly in the happiness stakes – at around 75 points.
Now a decade on, the wellbeing of Australians has managed to maintain its positive state. We have learned many things from the index. For instance our satisfaction with community connectedness increases in the after math of natural disasters and shared threats; while the more we earn doesn’t just increase our bank accounts, but it increases our satisfaction with health and relationships. We also know that people who give back to their communities through volunteering have a higher wellbeing than those who don’t.
What the Australian Unity Wellbeing Index teaches us is that our happiness is not reliant on one single factor but a broad spectrum of threads that make up our lives. These insights from the 10 years of research have been rolled into this special report to provide a snapshot of Australia’s wellbeing to help us answer the question: ‘What makes us happy?’
Alan CastlemanChairman Australian Unity
November 2010
2 W H A T M A K E S U S H A P P Y ?

WelcomeWelcome to the second edition of What makes us happy? This report shares key findings from a decade of researching the lives and happiness of Australians.
The Australian Unity Wellbeing Index, created in partnership with Deakin University, is the nation’s most regular and most comprehensive measure on how happy we as Australians feel about ourselves.
Through regular surveys and reports, the index offers insight into what makes us happy…and not so happy. It records the impact of changing social issues and events on our wellbeing. For example, it describes how happiness is influenced by our relationships and work, how much money we earn, and by the performance of the Australian economy. And it allows us to understand how features of our lifestyle, such as home ownership and who we live with, affect our wellbeing.
I hope you enjoy our What makes us happy? report.
Through regular surveys and
reports, the index offers insight
into what makes us happy…
and not so happy.
Rohan MeadGroup Managing Director Australian Unity
Robert CumminsProfessor of PsychologyDeakin University
3T E N Y E A R S O F T H E A U S T R A L I A N U N I T Y W E L L B E I N G I N D E X

IntroductionWe all want to be happy. It’s probably the one thing that all humans have in common…
no one wants to be miserable. But what does it mean to be happy? How do we get there?
Are we born that way, or is our happiness determined by what happens in our lives?
Can we become happier? And what can we learn from studying happiness?
Why measure wellbeing and happiness?
Our national measures of how well Australia is doing tend to be economic, objective indicators such as gross domestic product (GDP), consumer price index (CPI), house prices and so on. And while these measures are important, they don’t provide a complete view of what’s happening.
More and more global bodies such as the Organisation for Economic Co-operation and Development are interested in using subjective indicators in national statistics. They realise that while GDP figures are critical, measures of wellbeing add immense value.
Studying wellbeing and happiness in a systematic and scientific way enables us to fill some gaps and quantify the extent to which different factors influence how people feel about their quality of life. It enables the identification of groups in society that aren’t doing so well, and helps us learn how best to assist people who have low wellbeing. Conversely, it shows us those who are doing well, and why.
Wellbeing – what is it?
The Australian Unity Wellbeing Index regularly measures the ‘subjective wellbeing’ of the Australian population by asking people to rate their satisfaction with aspects of their lives. Subjective wellbeing is a normally positive state of mind. It is a long-lasting, deep sense of contentment, as opposed to the momentary burst of joy we experience when laughing at a joke.
The Australian Unity Wellbeing Index is based on the psychological theory of homeostasis—that wellbeing is normally maintained by an internal active management system that enables people to keep feeling positive, even when things go wrong. This self-regulation works in an analogous manner to the maintenance of body temperature. In-built brain mechanisms allow our feelings of wellbeing to fluctuate a little, but homeostasis does its best to hold such feelings relatively steady over time. Failure of this system on a chronic basis, due to overwhelming levels of negative life experience, results in the loss of positive wellbeing, and this is what we know as depression.
4 W H A T M A K E S U S H A P P Y ?
And while happiness and wellbeing have their own unique definitions, for the purposes of this report, the term ‘wellbeing’ has been used interchangeably with ‘happiness’, since happiness is a term that people can relate to and conceptualise easily.
The Australian Unity Wellbeing Index is a joint project between Australian Unity and Deakin University’s Australian Centre on Quality of Life.
How is wellbeing measured?
A measurement tool known as the Personal Wellbeing Index (PWI) is used to calculate an individual’s wellbeing. The survey participants are asked to rate their satisfaction with eight domains on a scale of 0-10. The domains are; standard of living; health; achieving in life; personal relationships; safety; community connection; future security, and spirituality or religion. The scores from the eight domains are combined and converted to a 0-100 point range. This is the PWI.
The Australian average hovers around the 75 mark. However, it does show some variation. Over the surveys conducted to date, the PWI has ranged from 73.5 to 76.7 on a 100-point scale—a fluctuation of only 3.2 points. This range can be used to identify groups in the population whose wellbeing lies outside this normal range. If the average score of an entire group of people falls below this range, it indicates that the group may contain a higher than normal proportion of people who are at high risk of depression.
The normal PWI range for individual people is much wider. Exactly how wide we are not sure but our best guess at this stage is that the normal range for individual scores is between about 55–90 points. What we do know, however, is that the individual values should be above 50 points. If wellbeing falls below this level then, again, this is indicative of an elevated risk of depression.
In addition to the domains measured by the PWI, the National Wellbeing Index (NWI) measures satisfaction with social conditions, the economic situation, the environment, business, national security and government.
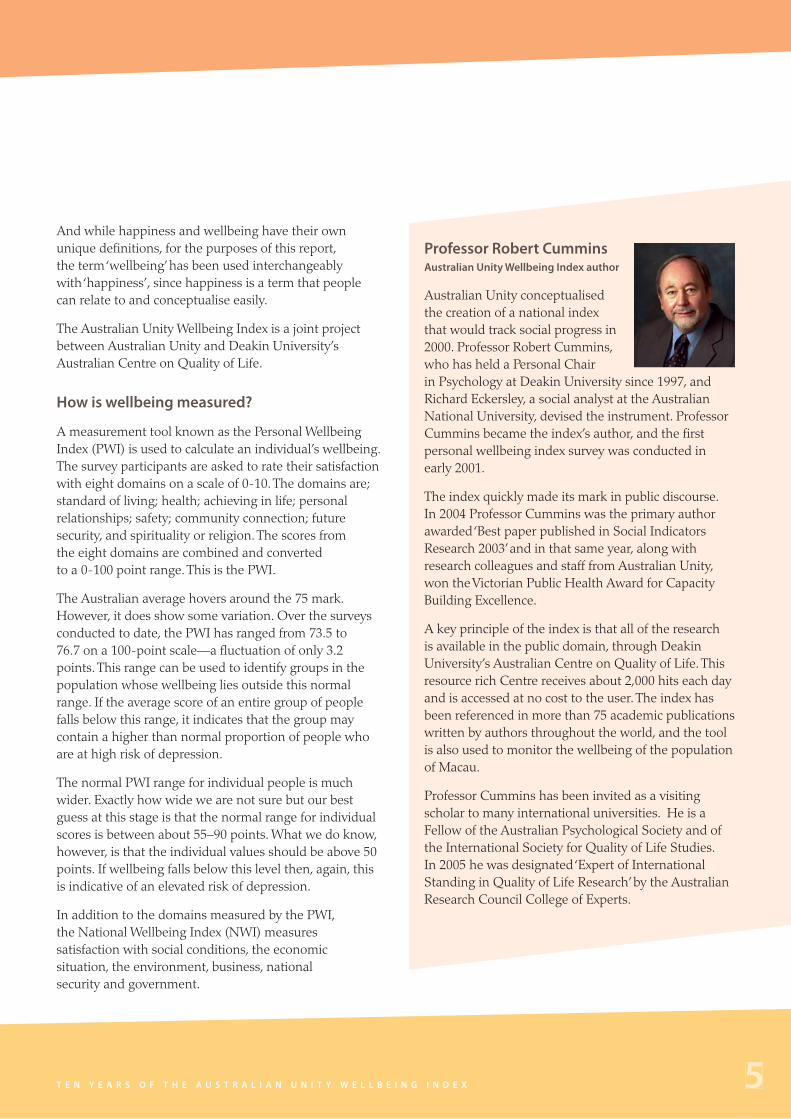
Professor Robert CumminsAustralian Unity Wellbeing Index author
Australian Unity conceptualised the creation of a national index that would track social progress in 2000. Professor Robert Cummins, who has held a Personal Chair in Psychology at Deakin University since 1997, and Richard Eckersley, a social analyst at the Australian National University, devised the instrument. Professor Cummins became the index’s author, and the first personal wellbeing index survey was conducted in early 2001.
The index quickly made its mark in public discourse. In 2004 Professor Cummins was the primary author awarded ‘Best paper published in Social Indicators Research 2003’ and in that same year, along with research colleagues and staff from Australian Unity, won the Victorian Public Health Award for Capacity Building Excellence.
A key principle of the index is that all of the research is available in the public domain, through Deakin University’s Australian Centre on Quality of Life. This resource rich Centre receives about 2,000 hits each day and is accessed at no cost to the user. The index has been referenced in more than 75 academic publications written by authors throughout the world, and the tool is also used to monitor the wellbeing of the population of Macau.
Professor Cummins has been invited as a visiting scholar to many international universities. He is a Fellow of the Australian Psychological Society and of the International Society for Quality of Life Studies. In 2005 he was designated ‘Expert of International Standing in Quality of Life Research’ by the Australian Research Council College of Experts.
5T E N Y E A R S O F T H E A U S T R A L I A N U N I T Y W E L L B E I N G I N D E X

Become a ‘well being’
Every person has a genetic template, which
makes us the way we are. This includes
determining how intrinsically happy
(or grumpy) we may be.
Our wellbeing is protected by a shield of resources
Wellbeing
Major external protective resources
eg: money, relationships
Internal resources
eg: finding meaning in a bad event
While we have this base level of happiness that we’re born with, things in our lives can cause it to fluctuate, but generally only a little. Similar to how we hold body temperature steady, we also hold our wellbeing relatively steady.
We do this by drawing on a combination of external and internal resources to help us cope when things go wrong. External resources include personal relationships and money—someone to talk to, or money to pay for the knee operation we need. We also have internal resources— such as finding meaning in a bad event. For example, losing a job can be a stressful experience, but if we find meaning in it – “it wasn’t right for me anyway, and the next job will be better” – we manage to cope with the tough situation much better.
It’s only when the challenges in life get too much for our defences that our system for protecting wellbeing fails and our happiness suffers. Normally this loss of happiness is short-term, but if it is prolonged and fails to recover, it can result in depression.
Things we can do to look after our wellbeing
• Connect with family and friends. Spending time with our loved ones is likely to make us happier, healthier and more productive. They’re our best source of support when we need it and have the strongest influence on our happiness.
• Watch spending and save for the proverbial rainy day. Having money when it really counts can make a difference when things go wrong.
6 W H A T M A K E S U S H A P P Y ?

• Get involved in our community. Getting to know neighbours, volunteering, and being involved in local activities are great ways to feel connected. Feeling part of our community enhances our sense of belonging and security.
• Engage in activities that give us a sense of achievement. We get a sense of contentment and drive when we have achieved something useful or good, so it makes sense for us to keep doing things that challenge our minds or bodies.
• Find a balance between work and leisure. This balance is different for each person—there is no simple formula. What is important is that we try to achieve a balance that suits us.
• Keep healthy. Staying healthy is all about balance. Eating well, exercise and regular doctor checks are important elements of staying healthy.
What’s your personal wellbeing?
On a scale of 0 to 10, with 0 being very dissatisfied, rate how satisfied you are with:
Your health Your personal relationships Your safety Your standard of living What you’re currently achieving in life Your community connection Your future security Your spirituality/religion [if applicable]
Add your responses together and divide by number of questions answered (seven or eight). Multiply this number by 10 to get your Personal Wellbeing Index (PWI). This is your wellbeing score out of 100. See how you compare to the national average, which hovers around the 75 mark.
You can access an online measurement survey of the Australian Unity Wellbeing Index at australianunity.com.au/wellbeingindex. Tips are also provided at the end of the online questionnaire as to what you should do if you have a low wellbeing score.
T E N Y E A R S O F T H E A U S T R A L I A N U N I T Y W E L L B E I N G I N D E X

Wellbeing of Australians
The level of Australians’ wellbeing
is at a record high level.
A considerable body of research has demonstrated that most people are satisfied with their own life. In western nations, the average value for population samples is about 75 percentage points of satisfaction across eight aspects of personal life—health, personal relationships, safety, standard of living, achieving in life, community connectedness, spirituality or religion and future security. That is, on a standardised scale from 0 (completely dissatisfied) to 100 (completely satisfied) the average person rates their level of life satisfaction as 75. The normal range for group averages is from 73.7 points to 76.7 points. The average level of the PWI in large Australian population samples has always fallen within this range. However, average levels of satisfaction with aspects of national life are normally lower, falling in the range 55 to 65 points.
Key changes in wellbeing
The most obvious trend in the PWI is that it rose following the September 11 terrorist attacks and has remained generally higher. Of the 24 surveys conducted since the first survey, 15 have been significantly higher than this initial value. It seems that both negative and positive events have acted to raise the wellbeing of the Australian population. Curiously, it appears that the presence of an external threat causes the population wellbeing to rise. This occurred first following the September 11 attacks and reached its maximum about six months after the event. The second time this occurred was immediately following the Bali bombing and the build-up in tension surrounding the Iraq War.
W H A T M A K E S U S H A P P Y ?

73.7 points
76.7 points
0
10
20
30
40
50
60
70
80
90
100
The normal range for wellbeing
Str
en
gth
of
sati
sfa
cti
on
In terms of positive events, the PWI was at its highest level in September 2009 when it reached 76.3 points following the start of the economic recovery. The previous occasion it reached this value coincided with the Athens Olympics in August 2004, which could be attributable to the success of Australian athletes.
The National Wellbeing Index (NWI) achieved its highest level of 64.1 points in October 2007. The NWI is more volatile than the PWI due to the relatively low level of homeostatic control.
For more details on key changes in wellbeing see pages 10 to 15.
73.7
76.7
Nor
mal
rang
e
Pe
rso
na
l w
ell
be
ing
in
de
x
Personal wellbeing
Survey date
70
72
74
76
78
Sep10
Apr10
Sep09
May09
Oct08
Apr08
Oct07
Apr07
Oct06
May06
Oct05
May05
Aug04
May04
Feb04
Nov03
Aug03
Jun03
Mar03
Nov02
Aug02
Mar02
Sep01
Apr01
73.4
8
74.6
5
75.1
9
74.4
1
74.5
8
75.2
1
75.8
5
75.4
2
75.3
75.5
8
74.8
76.3
74.6
4
75.2
6
74.1
1
74.4
6
75.5
8
75.8
1
74.8
74.8
8
75.6
2
76.2
7
76.0
3
76.2
0
1st Bali bombing (Dec 02)Pre-Iraq War
2nd Bali bombing
Athens OlympicsSept 11 terrorist attacks
9T E N Y E A R S O F T H E A U S T R A L I A N U N I T Y W E L L B E I N G I N D E X
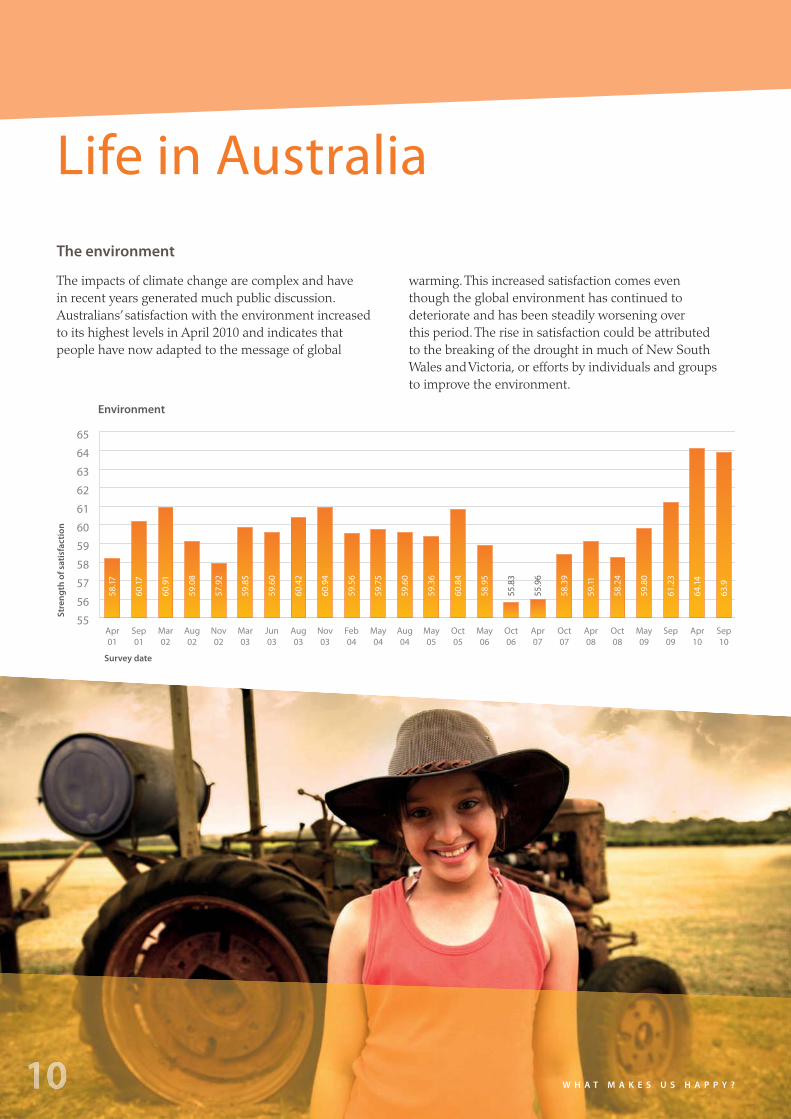
Life in Australia The environment
The impacts of climate change are complex and have in recent years generated much public discussion. Australians’ satisfaction with the environment increased to its highest levels in April 2010 and indicates that people have now adapted to the message of global
55
56
57
58
59
60
61
62
63
64
65
Sep10
Apr10
Sep09
May09
Oct08
Apr08
Oct07
Apr07
Oct06
May06
Oct05
May05
Aug04
May04
Feb04
Nov03
Aug03
Jun03
Mar03
Nov02
Aug02
Mar02
Sep01
Apr01
Str
en
gth
of
sati
sfa
cti
on
Environment
Survey date
58.17
60.17
60.9
1
59.0
8
57.9
2
59.8
5
59.6
0
60.4
2
60.9
4
59.5
6
59.7
5
59.6
0
59.3
6
60.8
4
58.9
5
55.8
3
55.9
6
58.3
9
59.11
58.2
4
59.8
0
61.2
3
64.14
63.9
warming. This increased satisfaction comes even though the global environment has continued to deteriorate and has been steadily worsening over this period. The rise in satisfaction could be attributed to the breaking of the drought in much of New South Wales and Victoria, or efforts by individuals and groups to improve the environment.
W H A T M A K E S U S H A P P Y ?

Government
The Australian Unity Wellbeing Index also measures Australians’ level of satisfaction with Government. This measure has fluctuated dramatically over the past 10 years. From a high result of almost 59 points in the first survey, which followed the September 11 terrorist attacks in the United States and preceded the 2001 re-election of the federal Coalition Government led by John Howard, the rating reached lows of around 53 points in March 2002 and October 2006*.
Australians’ satisfaction with Government then rose to unprecedented heights after the November 2007 federal election of Labor’s Kevin Rudd, peaking in April 2008. These heights then wavered, but remained strong until Australians’ satisfaction with Government plummeted to a record low in September 2010.
During 2010, instability in the federal Labor Government led to a change of leadership from Kevin Rudd to Julia Gillard. A special additional personal wellbeing index survey commissioned in July 2010, just after that leadership change, recorded that women’s wellbeing
50
52
54
56
58
60
62
Sep10
Apr10
Sep09
May09
Oct08
Apr08
Oct07
Apr07
Oct06
May06
Oct05
May05
Aug04
May04
Feb04
Nov03
Aug03
Jun03
Mar03
Nov02
Aug02
Mar02
Sep01
Str
en
gth
of
sati
sfa
cti
on
Government
Survey date
58.9
7
52.8
0
53.2
6
55.7
7
53.4
5
55.7
8
53.4
5
54.5
2
54.8
3
54.0
1
55.0
3
54.6
6
53.7
0
53.3
1
52.6
1
53.9
7
56.10
61.4
5
58.7
9
57.7
0
59.1
7
54.6
1
51.5
7
received a boost at that time. This was most particularly evident in the domains of community connection and achieving in life. While men showed change in their sense of achieving in life, they also showed increased satisfaction with community connection. It is possible that women felt that the swearing in of Australia’s first female prime minister improved their own aspirations in life. Still, this did not stop both women and men reporting the record low satisfaction with Government in the September 2010 survey, which followed the August election that resulted in a hung parliament and the continuation of the Gillard government.
Interestingly, satisfaction with Government appears to rise in times of national threat. The strong result after September 11, 2001, was followed by a similar, more muted rise following the October 2002 Bali bombing and the overthrow of the former Iraqi leader, Saddam Hussein, in early 2003. This phenomenon is described in the literature as the ‘rally effect’ (rally around the flag).
* The Australian Unity Wellbeing Index asks Australians to rate their ‘satisfaction with government’ as a broad, generic question and does not refer to a specific political party or individual politicians.
11T E N Y E A R S O F T H E A U S T R A L I A N U N I T Y W E L L B E I N G I N D E X

Social conditions
Since peaking with the Athens Olympics in 2004, satisfaction with social conditions hit a hurdle and declined in 2004 (possibly due to the government’s introduction of the Industrial Relations laws). This low didn’t last long, with levels continuing to increase each year. In late 2009 satisfaction with social conditions rose to its highest level recorded before dropping marginally in September 2010. This may reflect the positive economic conditions and recovery from the global financial crisis.
Str
en
gth
of
sati
sfa
cti
on
Social conditions
Survey date
58
59
60
61
62
63
64
65
66
Sep10
Apr10
Sep09
May09
Oct08
Apr08
Oct07
Apr07
Oct06
May06
Oct05
May05
Aug04
May04
Feb04
Nov03
Aug03
Jun03
Mar03
Nov02
Aug02
Mar02
Sep01
Apr01
59.4
4
62.8
8
62.7
6
61.9
9
62.6
1
63.0
0
62.6
0
61.8
5
62.1
1
61.0
3
61.2
9
63.1
3
61.1
6
63.1
3
60.5
3
60.0
1
61.9
6
62.3
5
61.9
2
62.4
8
62.5
6
64.9
0
65.6
5
64.2
2
Life in Australia
Australia is often referred to as the ‘lucky
country’. But how happy are Australians
with the nation’s health and progress?
Australians’ satisfaction with the
environment, government, social conditions,
economic situation, national security and
business in Australia has certainly
fluctuated over time.
12 W H A T M A K E S U S H A P P Y ?

Economic situation
Satisfaction with the economy forms part of the National Wellbeing Index (NWI). After a gradual rise since the September 2001, satisfaction with the economy over the period from April 2008 and May 2009 fell by 12.4 points. This large decline is almost certainly tied to the major fall in the stock market over this period and the start of the global financial crisis. The NWI then staged a dramatic recovery back to its normal level from September 2009,
Str
en
gth
of
sati
sfa
cti
on
The economy
Survey date
53
55
57
59
61
63
65
67
69
71
73
Sep10
Apr10
Sep09
May09
Oct08
Apr08
Oct07
Apr07
Oct06
May06
Oct05
May05
Aug04
May04
Feb04
Nov03
Aug03
Jun03
Mar03
Nov02
Aug02
Mar02
Sep01
Apr01
53.8
0
58.1
5
64.0
1
63.9
1
65.0
4
65.4
4
66.1
4
65.3
8
66.6
0
66.5
0
66.8
6
68.4
7
66.2
9
66.8
6
66.0
5
66.6
8
68.1
9
70.8
8
62.4
1
58.5
4
59.9
1
66.5
0
64.9
6
66.2
7
possibly as a result of the Government’s various measures to stimulate the economy, in particular the $900 one-off cash payments to tax payers and school age children in March and April 2009. Although sustained by the evident economic recovery it dropped marginally between September 2009 and April 2010, only to rise again in September 2010.
Wellbeing and Consumer Price Index
An Australian Unity Wellbeing Index analysis over a seven year period between 2001 and 2008 showed that inflation impacts on women’s health and wellbeing more than men, indicating a strong correlation between the wellbeing of women and the Consumer Price Index (CPI). The analysis found that women’s wellbeing dropped when the CPI went up and increased when CPI dropped, suggesting that women are more sensitive to the rising cost of living than men. While the Australian Unity Wellbeing Index research has shown us that the wellbeing of men is highly linked to earning money, this analysis showed that the wellbeing of women is highly linked to the capacity to manage it.
Wellbeing and interest rates
A specially conducted ‘spot survey’ of 1,000 people was conducted in February 2008 to test if the series of successive interest rate rise from August 2007 to February 2008 had impacted on wellbeing. Interestingly, the findings revealed that wellbeing remained steady over this time. However by April 2008 it had fallen, pinpointing this drop in wellbeing to March 2008, when a rate rise had occurred. What this could mean is that people can cope with extra financial pressures in their lives, but only up to a point and then it becomes too much and has a negative impact on wellbeing.
13T E N Y E A R S O F T H E A U S T R A L I A N U N I T Y W E L L B E I N G I N D E X

“
Business
Satisfaction with business has risen 10 points between September 2001 and April 2010 reaching 65.4 points—its highest level—returning to pre-recession levels indicating the financial crisis could now be a distant memory for most people. This continued rise in satisfaction may have increased following the September 11 attacks because the doomsayers were proved wrong. The attacks did not, as
Str
en
gth
of
sati
sfa
cti
on
Business
Survey date
54
56
58
60
62
64
66
Sep10
Apr10
Sep09
May09
Oct08
Apr08
Oct07
Apr07
Oct06
May06
Oct05
May05
Aug04
May04
Feb04
Nov03
Aug03
Jun03
Mar03
Nov02
Aug02
Mar02
Sep01
55.
69
59.8
8
59.3
1
61.1
1
58.8
6
60.8
6
60.9
6
61.7
3
61.9
7
61.9
9
63.4
0
60.5
2
63.4
1
62.4
3
61.3
4
62.7
0
64.6
7
62.5
0
62.2
4
61.6
0
63.8
7
65.4
2
64.6
8
Life in Australia
has been widely predicted, drive the global economy into recession. Australians did feel the effects of the global financial crisis, with a corresponding drop in wellbeing between April 2008 and May 2009. In part, this was possibly due to the bonus payments made by the government to individuals to stimulate the Australian economy.
14 W H A T M A K E S U S H A P P Y ?
National security
National security remains at one of its highest levels since first conducting the wellbeing index. The dramatic rise since the report’s inception probably reflects the September 11 terrorist attacks. Its continued gradual rise from March 2002 could have been kicked off by the strengthened American alliance and the lack of potential terrorist events in Australia.
Str
en
gth
of
sati
sfa
cti
on
National security
Survey date
54
56
58
60
62
64
66
68
70
72
Sep10
Apr10
Sep09
May09
Oct08
Apr08
Oct07
Apr07
Oct06
May06
Oct05
May05
Aug04
May04
Feb04
Nov03
Aug03
Jun03
Mar03
Nov02
Aug02
Mar02
Sep01
57.5
5
63.3
3
62.9
3
61.0
4
60.5
3
65.1
7
63.5
9
64.5
1
64.5
6
63.9
5
66.2
8
65.0
6
65.3
0
65.1
5
64.4
9
67.7
2
69.6
1
70.8
6
70.4
9
67.6
0
69.3
5
68.0
9
68.7
8
It is also interesting to note that this high level has been maintained despite the surge in ‘boat people’ arriving as refugees in Australian waters. While these events may remind Australians that our borders are not completely secure, they do not seem to impact on the sense of national security.
15T E N Y E A R S O F T H E A U S T R A L I A N U N I T Y W E L L B E I N G I N D E X

Happiest AustraliansThe Australian Unity Wellbeing Index
identifies segments of the population
with the highest and lowest wellbeing.
The most powerful two demographic elements are relationships and household income. Both are strongly associated with high and low wellbeing. People with extremely high wellbeing tend to be wealthier people living with their partner. At the opposite end of the wellbeing scale, people with the lowest wellbeing tend to have a low income and either live alone or as single parents. This is consistent with the role of money as a flexible resource to defend wellbeing, and the role of an intimate relationship to act as a buffer to adversity.
Who has the highest wellbeing?
The following five groups have the highest wellbeing in Australia.
Demographics Average wellbeing score
People living with a partner with an annual household income of over $150,000
79.3
People living with a partner and children, with an annual household income of over $150,000
79.3
People who have an annual household income of over $150,000
78.6
People over 76 years with an annual household income over $60,000
77.9
People who live with a partner 77.1
The groups of people who have the highest levels of wellbeing tend to have the following characteristics:
• They have a minimum annual household income of $60,000-$90,000 per year. This is about double the median household income which is about $35,000 per year.
• They are in a relationship and they are likely to be married.
16 W H A T M A K E S U S H A P P Y ?

Age and happiness
Personal wellbeing appears to increase with age. Some of the happiest Australians are aged 76 and over, with an annual household income of between $61,000-$90,000.
Both the 66-75 and 75 and over age groups have a high level of satisfaction with their lives. In particular, their wellbeing is highly influenced by their relationships and interactions with others. This connection with others tends to offset their satisfaction with health, which declines as age related ailments set in.
The two groups that seem to be most affected are the 36-45 and 66-75 age groups.
Demographics Average wellbeing score
Carers 58.5
People who live alone and are unemployed 60
People who are unemployed with an annual household income of over $15,000
61.3
People who are unemployed 66.6
People who live alone with an annual household income of less than $15,000
70.5
The combination of a very low income and the lack of a partner is a high risk factor for extremely low wellbeing. If divorce or unemployment is added, this defines the groups who have the lowest wellbeing in our total sample.
73.7
76.7
Nor
mal
rang
e
70
72
74
76
78
80
76+66-7556-6546-5536-4526-3518-25
Str
en
gth
of
sati
sfa
cti
on
Age and happiness
Age
79.2
75.2
75.9
74.8
76.6
76.2
77.9
Who has the lowest wellbeing?
The following four groups have the lowest wellbeing in Australia.
17T E N Y E A R S O F T H E A U S T R A L I A N U N I T Y W E L L B E I N G I N D E X
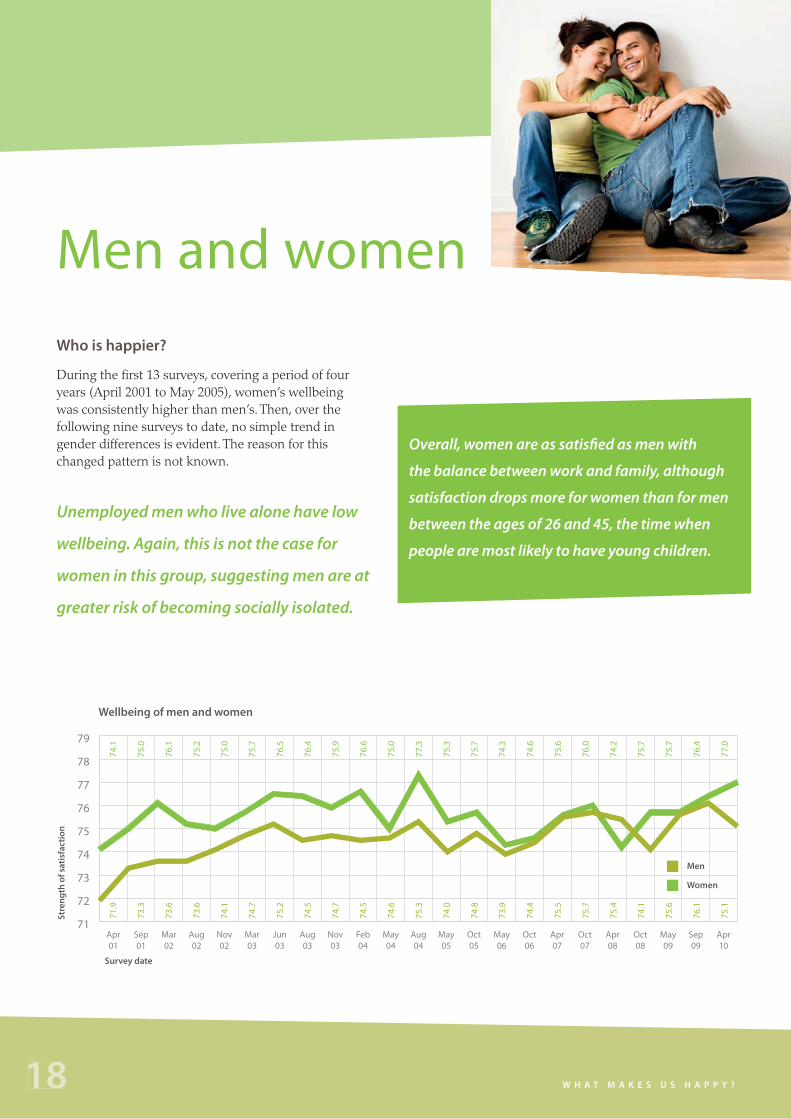
Men and womenWho is happier?
During the first 13 surveys, covering a period of four years (April 2001 to May 2005), women’s wellbeing was consistently higher than men’s. Then, over the following nine surveys to date, no simple trend in gender differences is evident. The reason for this changed pattern is not known.
Str
en
gth
of
sati
sfa
cti
on
Wellbeing of men and women
Survey date
71
72
73
74
75
76
77
78
79
Apr10
Sep09
May09
Oct08
Apr08
Oct07
Apr07
Oct06
May06
Oct05
May05
Aug04
May04
Feb04
Nov03
Aug03
Jun03
Mar03
Nov02
Aug02
Mar02
Sep01
Apr01
71.9
73.3
73.6
73.6
74.1
74.7
75.2
74.5
74.7
74.5
74.6
75.3
74.0
74.8
73.9
74.4
75.5
75.7
75.4
74.1
75.6
76.1
75.1
74.1
75.0
76.1
75.2
75.0
75.7
76.5
76.4
75.9
76.6
75.0
77.3
75.3
75.7
74.3
74.6
75.6
76.0
74.2
75.7
75.7
76.4
77.0
Men
Women
Overall, women are as satisfied as men with
the balance between work and family, although
satisfaction drops more for women than for men
between the ages of 26 and 45, the time when
people are most likely to have young children.
Unemployed men who live alone have low
wellbeing. Again, this is not the case for
women in this group, suggesting men are at
greater risk of becoming socially isolated.
18 W H A T M A K E S U S H A P P Y ?

RelationshipsMarriage and happiness
People who are married have the highest wellbeing of all marital status groups. The commitment, security and support that come with having a partner appears to help protect wellbeing.
People who are married are happier than people living in a defacto relationship.
The separated and divorced groups differ only on the domain of relationships, where the divorced group have higher satisfaction. This may be the result of a longer period of time since separation for the divorced group.
It is interesting that the people who have never married lie below the normal range. This is, however, age dependent, with people in the youngest group and those over 65 years having normal range personal wellbeing.
Singles
People who have never married are a difficult group to analyse. They tend to be younger and therefore their age and lower income can play a part in their relative low wellbeing score. This finding does not indicate that people need a partner to be happy. It does reflect, however, the advantage of having a partner in the happiness stakes.
It’s better to be alone than in a stale marriage
While people with a partner have higher wellbeing on average, this is really only the case if it’s a happy relationship. A partner who provides insufficient support is worse for people than not having a partner at all. When asked about the level of support people receive from their partner on a scale of 0-10, the index revealed people not receiving enough support from their partner had lower wellbeing than people living on their own.
The two most powerful things we can do in our lives
to maintain a positive sense of wellbeing is to work on
our relationships, and manage our finances effectively.
55
60
65
70
75
80
85
90
WidowedDivorcedSeparatedNever married
DefactoMarried
Str
en
gth
of
sati
sfa
cti
on
Wellbeing and marital status
Marital status
85.4 82.6 67.8 59.2 64.5 77.6
People who are married have
the highest wellbeing of all
marital status groups.
19T E N Y E A R S O F T H E A U S T R A L I A N U N I T Y W E L L B E I N G I N D E X

In their middle age, people who do
not live with a partner are at risk
of low wellbeing.
Widows
Widows have high levels of personal wellbeing despite having low levels of health satisfaction. Thus, health alone cannot be used to measure subjective wellbeing. The high PWI of widows is certainly influenced by the fact that many are elderly and the effect of widowhood is also age dependant. People widowed who are younger than 56 years have lower than normal wellbeing for their age group.
66
68
70
72
74
76
78
80
82
84
Future security
Community connection
SafetyPersonal relationships
Achieving in life
HealthStandard of living
PWI
Str
en
gth
of
sati
sfa
cti
on
Widows
76.7 83.0 73.4 75.3 73.0 78.9 78.3 74.7
Widows have low health satisfaction
and yet have high wellbeing.
Living with your children is good
for your wellbeing if you are
single and older than 66 years.
Relationships
20 W H A T M A K E S U S H A P P Y ?

0
5
10
15
20
25
30
35
40
45
50
Other adultsParentsPartner and childrenChildren onlyPartner onlyAlone
Me
asu
re o
f lo
ne
lin
ess
Loneliness by household composition and gender
Men
Women
44.3
32.9
20.4
24 32.7
34.1
20.3
25.9
31.7
30.2
29.7
30.8
NB: Unlike the personal wellbeing index, the measure of loneliness is a negative measure; thus the higher the score, the lonelier one feels.
Loneliness
Loneliness is a significant problem among Australians. According to the Australian Unity Wellbeing Index survey conducted in 2008, more than 30 percent of Australians are lonely and Australian men are lonelier than Australian women.
Men who live alone are much more likely to feel lonely than women who live alone. This could be because of the generally higher ability of women to form emotionally supportive relationships in the absence of a live-in partner.
When it comes to marital status, the research has shown that men who have never been married, who are separated or who are widowed are significantly
lonelier than women in the same circumstances. Curiously, however, women who are married or in defacto relationships record higher levels of loneliness than married men or men in defacto relationships. In this respect, therefore, marriage benefits men on average more than women.
The research has also shown that people who live only with children, with their parents or with other adults feel lonelier than people who live with their partner or with their partner and children.
Interestingly, living with other adults, aside from your partner, appears to be no remedy for loneliness!
21T E N Y E A R S O F T H E A U S T R A L I A N U N I T Y W E L L B E I N G I N D E X

Where do the happiest people Where do the happiest people live?
Over the years, the Australian Unity Wellbeing Index has surveyed the wellbeing of Australians living in cities, in the country, and in different states and electorates.
Country vs City
When it comes to country versus city living, people who live in a country town tend to be the happiest. People who live in rural and regional areas have a stronger connection to their community compared to city dwellers and this may go some way to explaining their higher level of wellbeing. This advantage from country living disappears when cities contain more than 40,000 people.
However, people who live in remote to highly remote areas of Australia lose their ‘rural advantage’ and have a level of wellbeing no different from their city cousins.
Which capital city is the happiest?
People living in Melbourne and Brisbane have the highest wellbeing of Australia’s capital cities, with Perth and Sydney lagging well behind. Melburnians and Brisbanites scored highly across a number of wellbeing indicators, with the highest levels of community connection of all the cities.
Although lower than Melbourne and Brisbane, Adelaide, Hobart, Canberra and Darwin also rated their satisfaction with life highly. Sydney and Perth had lower personal wellbeing and also rated significantly lower than the other capitals in terms of community connection and safety. High population density and the cost of living in Sydney is a significant factor in their lower wellbeing score.
Although Perth has similar demographics to Brisbane, its residents’ relative low wellbeing score may be due to it being the most isolated capital in the world. The resources boom also means there is an influx of transient populations, which can be disruptive to building cohesive communities.
70
71
72
73
74
75
76
77
78
79
BarkerRichmondIndiWannonMalleeBoothbyGippslandHigginsEden-MonaroMurrayMaranoaMayoRyanRiverina
Str
en
gth
of
sati
sfa
cti
on
The highest personal wellbeing electorates
Electorates
78.13
77.6
7
77.5
9
77.5
8
77.5
0
77.4
9
77.4
4
77.1
7
77.1
7
77.1
5
77.1
5
77.0
9
76.8
8
76.7
1
73.7
76.7
Nor
mal
rang
e
22 W H A T M A K E S U S H A P P Y ?

live?Happiest Federal electorates
Federal electorates in Australia are geographically-defined areas represented by a single elected Member of the Federal Parliament. These members of parliament make up the many politicians that help govern our country. So do people living in different electorates have different levels of wellbeing?
The top scoring electorates are generally characterised by low population density, with eight of the nine top divisions located outside of inner-metropolitan areas.
These high wellbeing electorates are also demographically favoured by having a higher proportion of people living only with their partner, people who are married, people who have retired, and people aged 56 years and over. They are also favoured by having fewer people who have never married. It is interesting that all of these elements are age-related to some degree.
There is a stark difference between Victoria and New South Wales in terms of the proportion of high and low electorates. Victoria accounts for 43 percent of high electorates and 12 percent of low electorates. New South Wales accounts for 21 percent of electorates with high wellbeing and 62 percent of the electorates with low wellbeing.
The highest levels of wellbeing are generally found in safe Coalition seats with lowest levels of wellbeing found within safe ALP seats, most particularly for men.
70
71
72
73
74
75
76
77
BlaxlandGortonSydneyFowlerProspectPerthParramattaRankin
Str
en
gth
of
sati
sfa
cti
on
The lowest personal wellbeing electorates
Electorates
71.2
71.5
71.8
72.1
72.4
72.6
72.9
72.9
73.7
76.7
Normal range
T E N Y E A R S O F T H E A U S T R A L I A N U N I T Y W E L L B E I N G I N D E X
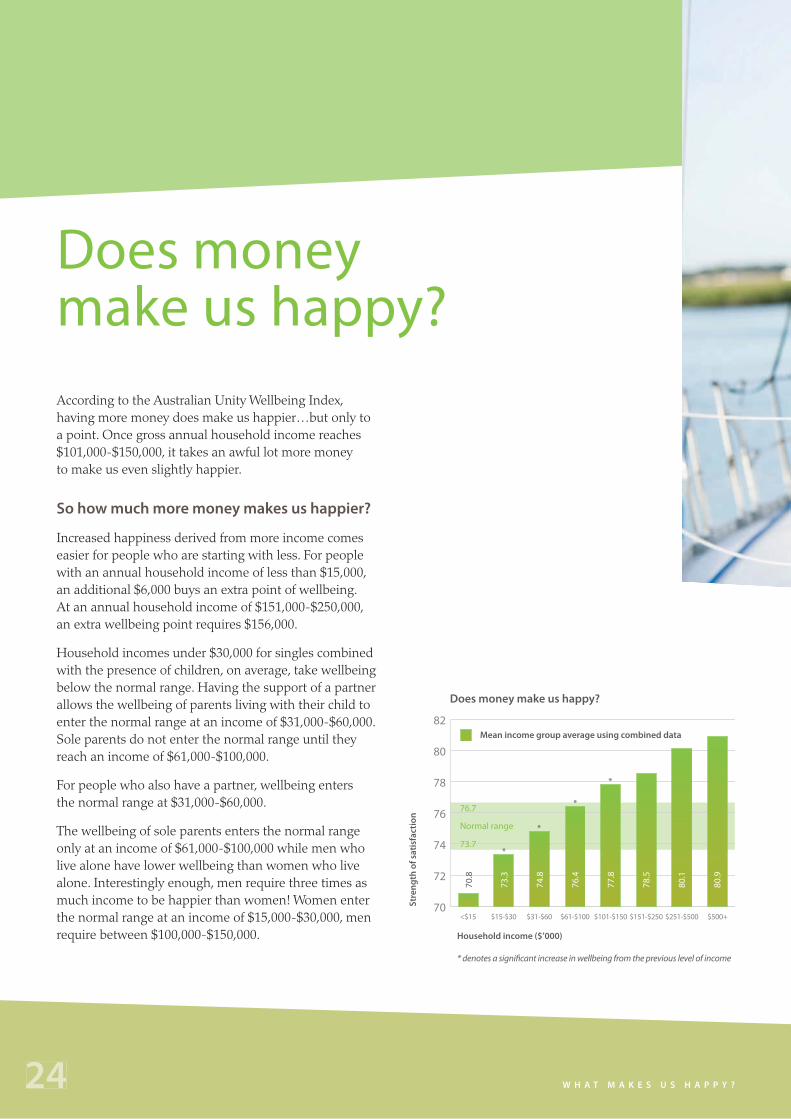
According to the Australian Unity Wellbeing Index, having more money does make us happier…but only to a point. Once gross annual household income reaches $101,000-$150,000, it takes an awful lot more money to make us even slightly happier.
So how much more money makes us happier?
Increased happiness derived from more income comes easier for people who are starting with less. For people with an annual household income of less than $15,000, an additional $6,000 buys an extra point of wellbeing. At an annual household income of $151,000-$250,000, an extra wellbeing point requires $156,000.
Household incomes under $30,000 for singles combined with the presence of children, on average, take wellbeing below the normal range. Having the support of a partner allows the wellbeing of parents living with their child to enter the normal range at an income of $31,000-$60,000. Sole parents do not enter the normal range until they reach an income of $61,000-$100,000.
For people who also have a partner, wellbeing enters the normal range at $31,000-$60,000.
The wellbeing of sole parents enters the normal range only at an income of $61,000-$100,000 while men who live alone have lower wellbeing than women who live alone. Interestingly enough, men require three times as much income to be happier than women! Women enter the normal range at an income of $15,000-$30,000, men require between $100,000-$150,000.
70
72
74
76
78
80
82
$500+$251-$500$151-$250$101-$150$61-$100$31-$60$15-$30<$15
Str
en
gth
of
sati
sfa
cti
on
Does money make us happy?
Household income ($’000)
* denotes a significant increase in wellbeing from the previous level of income
70.8
73.3
74.8
76.4
77.8
78.5
80.1
80.9
73.7
76.7
Normal range
*
*
*
*
Mean income group average using combined data
Does money make us happy?
24 W H A T M A K E S U S H A P P Y ?

0
50
100
150
200
$151-$250$101-$150$61-$100$31-$60$15-$30<$15
Co
st o
f p
urc
ha
sin
g (
$’0
00
)
The cost of purchasing a percentage point of wellbeing
Current income ($’000)
6,00
0
20,
000
2
8,50
0
35,
000
143,
000
156,
000
62
64
66
68
70
72
74
76
78
80
82
$251-$500$151-$250$101-$150$61-$100$31-$60$15-$30<$15
Str
en
gth
of
sati
sfa
cti
on
Strength of satisfaction
Current income ($’000)
Partner
Partner + children
Sole parent
74.5
76.2
77.6
77.9
78.6
78.9
81.1
72.4
72.0
75.5
76.9
78.1
78.8
78.5
63.8
67.9
69.8
74.7
75.7
75.5
T E N Y E A R S O F T H E A U S T R A L I A N U N I T Y W E L L B E I N G I N D E X

People who have low control
over their financial situation
have low wellbeing.
Personal debt
Having a financial debt does not necessarily decrease wellbeing. In fact, people with large debts typically have high personal wellbeing because they live in high income households and their debts represent income-generating loans or the security of a mortgage and home ownership.
Australians who have a loan of more than $200,000 are happier than people who have no debt at all. The Australian Unity Wellbeing Index shows that substantial debt is often beneficial for wellbeing, whereas people with smaller debts of less than $50,000 have low wellbeing.
People living in a low income household are especially vulnerable to financial debt. However, the 30 percent of credit card holders who cannot pay off their card each month, have reduced wellbeing, irrespective of their income. Therefore, people who own a credit card they cannot pay off each month place their own wellbeing at risk.
Does money make us happy?
26 W H A T M A K E S U S H A P P Y ?

Gambling and wellbeing
Despite the popularity of pokies venues and casinos and the stories of people winning big, the reality is that the vast majority of gamblers are destined to lose money. Although most people gamble occasionally for fun, those who are frequent gamblers have a lower wellbeing and are less satisfied with their standard of living than those who don’t gamble. Thus, gambling is not only bad for your bank balance but it is also detrimental to wellbeing.
According to the Australian Unity Wellbeing Index, 15 percent of Australians gamble as often as once a week or more and these people tend to have low wellbeing. However, while gambling on your own is associated with low wellbeing, gambling in the company of family or friends is not.
The research shows that the people who are most likely to gamble on their own are people who live by themselves, people who are divorced, people who are separated, people who are widowed, people with an annual income of less than $15,000 and people who are over the age of 75.
60
65
70
75
80
OcassionallyOnce a monthOnce a weekDailyNever
Str
en
gth
of
sati
sfa
cti
on
Frequency of gambling
Frequency
76.4
72.4
72.8
76.2
75.5
73.7
76.7
Normal range
Str
en
gth
of
sati
sfa
cti
on
Gamble for money
73.7
76.7
Normal range
70
72
74
76
78
NoYes
74.7
76.4
27T E N Y E A R S O F T H E A U S T R A L I A N U N I T Y W E L L B E I N G I N D E X

Home ownership Many Australians aspire to owning their own home and home ownership does indeed make us happier.
When comparing home owners to renters in similar age groups and income level, home owners have higher wellbeing.
People who own their home outright have the highest level of wellbeing, with people who are dependent on others following closely behind.
Mortgage stress
The phenomenal hike in house prices hasn’t seemed to put a dampener on our feel-good from home-ownership—people with a mortgage have a higher level of wellbeing than those renting, regardless of income level.
60
64
68
72
76
80
OwnersDependantsRentMortgage
Str
en
gth
of
sati
sfa
cti
on
Home ownership and happiness
Home ownership status
74.4
69.2
75.3
77.2
73.7
76.7
Normal range
While housing debt has increased, so has the amount of equity. This may have offset much of the negative feelings from mortgage stress. People are possibly happier knowing the amount owed on their homes is more than covered by the increasing worth of their asset.
Age of home owners compared to renters
This supports the finding of higher levels of wellbeing among older home owners (age 55 and over) even though they are in a lower income bracket. This most probably contributes to the general finding that wellbeing increases after the age of 55 years.
People with a mortgage
have higher wellbeing than
people who are renting,
regardless of income level.
28 W H A T M A K E S U S H A P P Y ?

T E N Y E A R S O F T H E A U S T R A L I A N U N I T Y W E L L B E I N G I N D E X

Health and happinessDoes a healthier body make for a happier mind?
We are constantly bombarded with health messages to eat well and exercise. But is it true that happiness and health are linked?
The answer is complex, as shown by changes over time. Not surprisingly, satisfaction with our health decreases as people get older—a change probably linked to decreasing physical capacity. However, as people age beyond 55 years, subjective wellbeing does not decrease, in fact, as stated above, it tends to increase. There is, thus, no simple link between health and wellbeing, except under extreme circumstances where people are living, for example, with chronic and severe pain. Then, if the pain is sufficiently strong to defeat homeostasis, wellbeing is held at low levels. This is a very important understanding. It means, for example, that people who are disabled or in poor health can still enjoy normal levels of wellbeing, provided they are supported by sufficient financial and relationship resources.
Gender and happiness
Satisfaction with health varies significantly depending on whether you are male or female. Men’s satisfaction with their health shows a continuous drop between 18-25 and 46-55 years. Women’s satisfaction with health remains steady over the periods 18-45 years, then falls sharply between 46-55 years. The reason for the drop in female health satisfaction at 46-55 years may be associated with the onset of menopause.
Medical conditions
Major medical conditions do not necessarily cause wellbeing to fall. In fact, medical conditions such as blood pressure have little impact on wellbeing. However, conditions that involve stress or pain (cancer, arthritis, diabetes) reduce wellbeing below the normal range. As expected, illnesses such as anxiety or depression take wellbeing to very low levels (with low wellbeing being an indicator of depression).
68
70
72
74
76
78
80
82
76+66-7556-6546-5536-4526-3518-25
Str
en
gth
of
sati
sfa
cti
on
Age, gender and happiness
Age
79.9
76.5
75.1
73.4
72.6
72.6
70.9
78.2
78.3
77.2
74.5
73.7
72.6
71.0
Men
Women
58
60
62
64
66
68
70
72
74
76
78
AnxietyDepress-ion
DiabetesArthritisCancerHeart problems
AsthmaBlood pressure
Str
en
gth
of
sati
sfa
cti
on
The impact of major medical conditions on wellbeing
Major medical conditions
76.6
72.8
73.0
72.6
70.6
69.6
65.0
63.1
73.7
76.7
Normal range
30 W H A T M A K E S U S H A P P Y ?

Family and health
It seems being part of a family with children is good for your health. Those of us living with a partner and children show a significant rise in health satisfaction compared to those couples who don’t have children. It may be the case that the responsibility of children causes parents to be more positive or more careful, about their own health.
Money and health
Money seems to play a big role on whether we are satisfied with our health. It doesn’t mean the more money earned the happier we are with our health. It’s more realistic to think that having more money allows daily life to become financially easier and it increases the affordability of health care.
Alcohol and wellbeing
Health professionals are often divided when it comes to alcohol and its effects on wellbeing. According to the Australian Unity Wellbeing Index there is a link between the amounts of alcohol consumed and people’s happiness.
The index shows that people who drink every day have high wellbeing, although happiness decreases when the daily amount of alcohol consumed exceeds three drinks for both men and women. Most intriguing is that people who don’t drink at all have the lowest wellbeing of all drinking categories.
Worringly, for people aged between 18-25 wellbeing remains high even when their number of daily drinks goes well beyond three drinks. This could contribute to Australia’s current binge drinking issue within this age group.
How body weight tips the scales
Obesity is bad for you, in almost every imaginable way. Apart from the increased health risks, people who are obese are subjected to a certain level of discrimination for their condition. And, indeed, happiness also suffers once people reach a moderate or severe level of obesity.
Most people however, whose weight falls within the mild obesity range, manage to maintain normal levels of wellbeing.
Men who are underweight report a lower level of wellbeing, whereas women who are underweight remain in the upper section of the normal range. The social pressure on women to be thin, means that it is more acceptable for women to be underweight.
If people eat chocolate every day and
are happy about it, their wellbeing
tends to be above average. However,
those people who wish they could
change the amount of chocolate
they eat have lower wellbeing. 65
67
69
71
73
75
77
79
Very severe obesity
Severe obesity
Moderate obesity
Mild obesity
Over-weight
NormalUnder-weight
Str
en
gth
of
sati
sfa
cti
on
Body weight and happiness
Body mass index
71.5
75.8
75.1
76.3
74.8
76.0
74.2
74.4
69.3
70.8
72.9
70.8
71.4
69.5
73.7
76.7
Normal range
Men Women
31T E N Y E A R S O F T H E A U S T R A L I A N U N I T Y W E L L B E I N G I N D E X
64
66
68
70
72
74
76
UnemployedFull-time employed
Str
en
gth
of
sati
sfa
cti
on
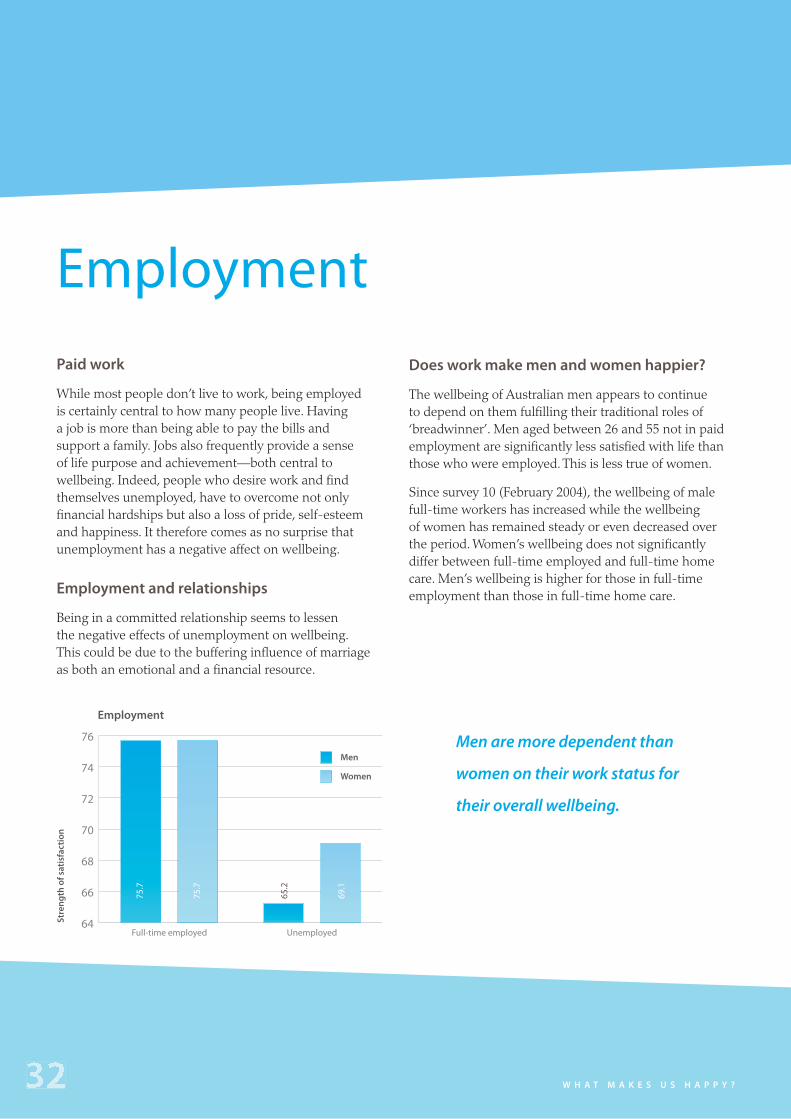
Employment
75.7
75.7
65.2
69.1
Men
Women
Paid work
While most people don’t live to work, being employed is certainly central to how many people live. Having a job is more than being able to pay the bills and support a family. Jobs also frequently provide a sense of life purpose and achievement—both central to wellbeing. Indeed, people who desire work and find themselves unemployed, have to overcome not only financial hardships but also a loss of pride, self-esteem and happiness. It therefore comes as no surprise that unemployment has a negative affect on wellbeing.
Employment and relationships
Being in a committed relationship seems to lessen the negative effects of unemployment on wellbeing. This could be due to the buffering influence of marriage as both an emotional and a financial resource.
EmploymentDoes work make men and women happier?
The wellbeing of Australian men appears to continue to depend on them fulfilling their traditional roles of ‘breadwinner’. Men aged between 26 and 55 not in paid employment are significantly less satisfied with life than those who were employed. This is less true of women.
Since survey 10 (February 2004), the wellbeing of male full-time workers has increased while the wellbeing of women has remained steady or even decreased over the period. Women’s wellbeing does not significantly differ between full-time employed and full-time home care. Men’s wellbeing is higher for those in full-time employment than those in full-time home care.
Men are more dependent than
women on their work status for
their overall wellbeing.
W H A T M A K E S U S H A P P Y ?

Nine to five
How many hours each week someone works can be determined by many different factors. One thing is certain though, different quantities of work suit different types of people.
According to the Australian Unity Wellbeing Index, as an average, women become less satisfied with their work once they have worked more than a 40 hour week. Comparatively for men, satisfaction with their work remains steady until they hit 45 hours a week.
I don’t like Mondays
In most cases, Monday signals the start of another work week. But are Mondays harder to bear than the other days in the week, including weekends? An investigation into happiness levels reported no significant difference between Monday and any other day of the week, including weekends. This is true across all employment types.
Str
en
gth
of
sati
sfa
cti
on
Wellbeing of men and women in full-time work
Survey date
72
74
76
78
Apr-10Sep-09May-09Oct-08Apr-08Oct-07Apr-07Oct-06May-06Oct-05May-05Aug-04May-04Feb-04Nov-03
75.5
74.9
75.3
76.3
74.8
75.8
74.8
74.7
75.2
75.7
75.8
74.4
76.8
77.0
76.2
76.7
76.2
74.4
77.2
75.7
75.4
75.3
75.9
75.7
76.3
74.0
75.0
74.7
77.0
76.8
Men
Women
33T E N Y E A R S O F T H E A U S T R A L I A N U N I T Y W E L L B E I N G I N D E X

VolunteeringDoes volunteering make us happy?
Volunteers are often referred to as the ‘glue that holds communities together’. And although they often work tirelessly without getting paid, they are the happiest employment group. There is also a significant wellbeing increase for those who are full-time employed, full-time retired and unemployed.
When we are feeling good we are more likely to contribute to society positively. But in reverse, community connection and engagement is important to our sense of wellbeing. A combination of the interaction provided by volunteering and the personal satisfaction achieved is likely to explain the positive impact on our happiness.
65
70
75
80
UnemployedFull-time studentFull-time homeSemi-retiredRetiredFull-time employed
Str
en
gth
of
sati
sfa
cti
on
Volunteering
75.6
77.7
76.5
78.8
76.1
76.4
74.9
76 75.2
73.8
67
.1
68.9
Work only
Work and volunteer
73.7
76.7
Normal range
34 W H A T M A K E S U S H A P P Y ?

Caring and wellbeingWellbeing of carers
Just like volunteers, informal carers fulfil a crucial role in society. According to the Australian Bureau of Statistics, around 2.5 million Australians aged 15 years and over care for someone at home because of a disability or old age. Without these carers, many people and family units would be in desperate circumstances.
While those in need of care greatly benefit from this devotion, the reverse effect is evident for the carers. A special Australian Unity Wellbeing Index survey coordinated with Carers Australia revealed that informal carers have the lowest level of wellbeing of any group yet identified through the surveys.
Carers generally have low household income which could mean they lack the financial resources to defend their wellbeing against the challenges they face in the role.
40
45
50
55
60
65
70
75
80
UnemployedPart-time volunteerPart-time studyPart-time employedRetiredFull-time studyFull-time employed
Str
en
gth
of
sati
sfa
cti
on
Caring and wellbeing
75.5
59.9
74.0
64.4
76.6
62.1
74.2
57.4
75.2
52.6
76.6
60.1
66.5
51.5
General
Carers73.7
76.7Normal range
“ The average score of the Australian
population usually sits between 73 and 76.
We’ve found in this study of around 4,000
carers, that their average score sits at 58.5
which is alarmingly low. It’s particularly
worrying due to the sheer scale of the
survey. It shows the enormous strain and
challenge that these Australians are under.”
Professor Robert Cummins.
35T E N Y E A R S O F T H E A U S T R A L I A N U N I T Y W E L L B E I N G I N D E X

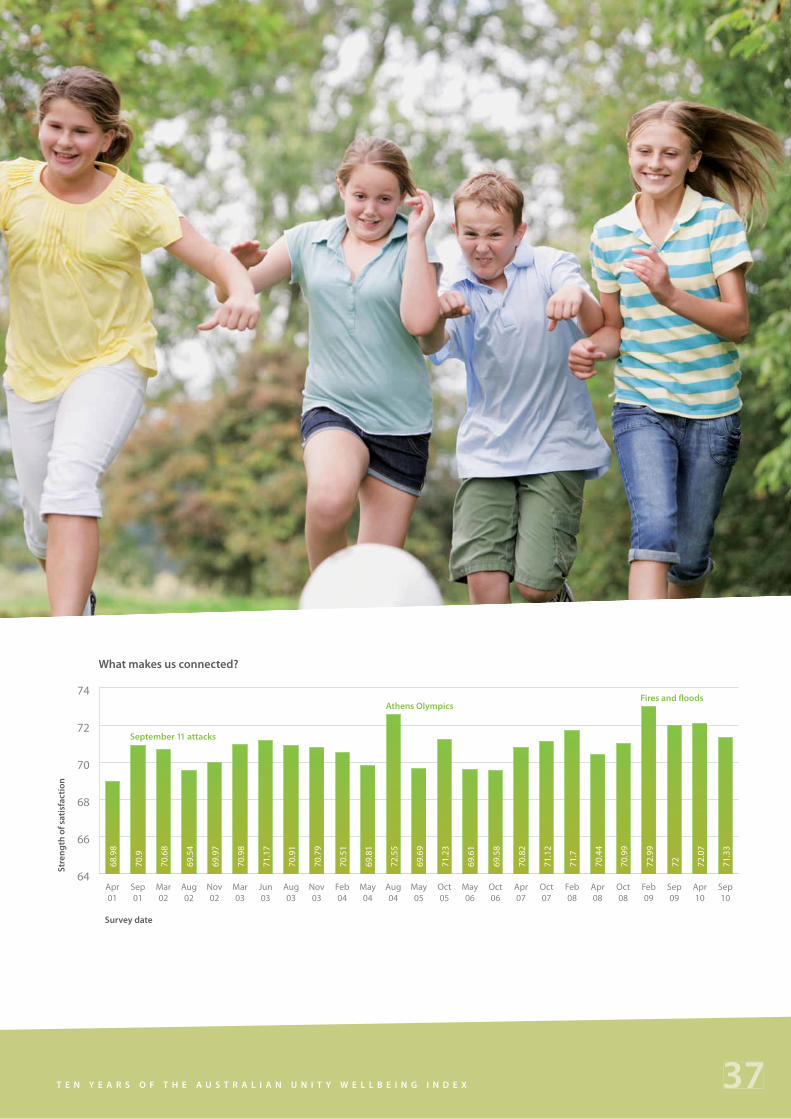
What makes us feel connected?What keeps us connected?
With all the new technology and social networking sites it is easier than ever to keep connected to other people. But does this really make us feel connected? When faced with a major event or experience people tend to feel more connected to family and friends. These experiences can be positive, like large scale sporting events such as the Olympics or negative events such as the Victorian bushfire disaster that united communities across Australia.
At the time of the Athens Olympics in 2004 the nation experienced elation at Australian athletes’ sporting success. The devastating Black Saturday Victorian bushfires and Queensland floods in 2009, generated national horror. Both of these brought people together. Although very different in how they made us feel, they raised our sense of community connection, making people feel more connected to one another.
Disasters
A disaster evokes powerful emotions that are often etched into our memories for years to come. A special survey (report 20.1) was conducted to detect whether the disastrous fires in Victoria—the worst bushfires in Australian history—and floods in north Queensland in 2009 had affected the subjective wellbeing of the population.
People surveyed felt more connected even though they were living in unaffected areas, such as the major cities. The images of danger from the fire and floods so vividly portrayed by the media, quite possibly played a major role. These events generated an enormous out-pouring of sympathy and tangible assistance, which caused the population to experience a heightened sense of belonging to the ‘Australian family’.
W H A T M A K E S U S H A P P Y ?
Str
en
gth
of
sati
sfa
cti
on
What makes us connected?
Survey date
64
66
68
70
72
74
Sep10
Apr10
Sep09
Feb09
Oct08
Apr08
Feb08
Oct07
Apr07
Oct06
May06
Oct05
May05
Aug04
May04
Feb04
Nov03
Aug03
Jun03
Mar03
Nov02
Aug02
Mar02
Sep01
Apr01
68.9
8
70.9
70.6
8
69.5
4
69.9
7
70.9
8
71.1
7
70.9
1
70.7
9
70.5
1
69.8
1
72.5
5
69.6
9
71.2
3
69.6
1
69.5
8
70.8
2
71.1
2
71.7
70.4
4
70.9
9
72.9
9
72 72.0
7
71.3
3September 11 attacks
Athens OlympicsFires and floods
37T E N Y E A R S O F T H E A U S T R A L I A N U N I T Y W E L L B E I N G I N D E X

Wellbeing research
Academic rigour
The Australian Unity Wellbeing Index is an academic study that adheres to rigorous implementation and statistical standards. It is one of the world’s leading measures of subjective wellbeing conducted at a national level. A team of academics within the Department of Psychology at Deakin University is responsible for data analysis. All findings presented in the reports are statistically significant—unless otherwise stipulated.
Research method
The Australian Unity Wellbeing Index is based on a quantitative methodology. National phone surveys of a random, geographically representative sample of 2,000 Australians, are conducted at least twice per year. Surveyors ask to speak to the person in the household with the most recent birthday who is aged over 18. An even gender split is sought in each geographic region to reflect the national population.
Unlike gender, the age composition of the sample is not actively managed but yields a break-down similar to that of the national population as determined by the Australian Bureau of Statistics. The surveys do include anyone aged under 18 years, non-English speaking persons, and it does not seek to specifically identify indigenous Australian respondents.
Presentation and type of analyses
In the presentation of results, the trends that are described in the text are statistically significant. All satisfaction values are expressed as the strength of satisfaction on the 0-100 scale. In situations where homogeneity of variance assumptions has been violated, Dunnetts T3 Post-Hoc Test has been used. In the case of t-tests we have used the SPSS option for significance when equality of variance cannot be assumed. The raw data for each report are available from the Deakin University Australian Centre on Quality of Life website: http://acqol.deakin.edu.au/index.htm
Report organisation
All information presented in this report is sourced from the Australian Unity Wellbeing Index reports, generated from national surveys conducted since April 2001, unless indicated otherwise. Naturally, however, we can’t fit everything from our reports in this one. A list of reports can be found on page 39. Complete reports, data files and further information on the Australian Unity Wellbeing Index are available at:
www.australianunity.com.au/wellbeingindex http://acqol.deakin.edu.au/index.htm
3838 W H A T M A K E S U S H A P P Y ?

List of reportsThe 36 reports published
between 2010 and 2001
Australian Unity Wellbeing Index: Survey 24 The Wellbeing of Australians – Life Better/Worse, Trust and Climate Change Cummins, Woerner, Weinberg, Collard, Gibson, Perera, and Horfiniak. September 2010.
Australian Unity Wellbeing Index: Survey 23 The Wellbeing of Australians – Life Better/Worse, Children and Neighbourhood Cummins, Woerner, Weinberg, Perera, Gibson, Collard and Horfiniak. April 2010.
Australian Unity Wellbeing Index: Survey 23.1 Marginal and Safe Seat Electorates Cummins, Gibson-Prosser, Weinberg, Perera and Woerner. July 2010.
Australian Unity Wellbeing Index: Survey 23.2 The Personal Wellbeing of Australians Living within Federal Electoral Divisions Cummins, Woerner and Gibson-Prosser. July 2010.
Australian Unity Wellbeing Index: Survey 22 The Wellbeing of Australians – Who Makes the Decisions, Health/Wealth Control, Financial Advice, and Handedness Cummins, Woerner, Weinberg, Collard, Lorbergs and Perera. September 2009.
Australian Unity Wellbeing Index: Survey 21 The Wellbeing of Australians – Gambling, Chocolate and Swine Flu Cummins, Woerner, Gibson, Weinberg, Chester and Collard. May 2009.
Australian Unity Wellbeing Index: Survey 20.1 The Wellbeing of Australians – The effect of fires in Victoria and Floods in Queensland Cummins, Woerner and Chester. April 2009.
Australian Unity Wellbeing Index: Survey 20 The Wellbeing of Australians – Money, debt and loneliness Cummins, Woerner, Gibson, Lai, Weinberg and Collard. October 2008.
Australian Unity Wellbeing Index: Survey 19.1 The Wellbeing of Australians – Differences between statistical sub-divisions, towns and cities Cummins, Woerner, Hamilton, Lai and Weinberg. August 2008.
Australian Unity Wellbeing Index: Survey 19 The Wellbeing of Australians – Links with exercise, nicotine and alcohol Cummins, Woerner, Gibson, Lai, Weinberg and Collard. August 2008.
Australian Unity Wellbeing Index: Survey 18.1 The Wellbeing of Australians – The effect of seven successive home-loan rate rises Cummins, Tomyn, Woerner and Gibson. February 2008.
Australian Unity Wellbeing Index: Survey 18 The Wellbeing of Australians – Changing conditions to make life better Cummins, Tomyn, Woerner, Gibson, Lai and James Collard. October 2007.
Australian Unity Wellbeing Index: Survey 17.1 Special Report: The Wellbeing of Australians – Carer Health and Wellbeing Cummins, Hughes, Tomyn, Gibson, Woerner, Lai. October 2007.
Australian Unity Wellbeing Index: Survey 17 The Wellbeing of Australians – Work, Wealth and Happiness Cummins, Woerner, Tomyn, Gibson & Knapp. July 2007.
Australian Unity Wellbeing Index: Report 16.1 Special Report: The Wellbeing of Australians – Groups with the Highest and Lowest Wellbeing in Australia Cummins, Walter & Woerner. March 2007.
Australian Unity Wellbeing Index: Survey 16 The Wellbeing of Australians – Mortgage Payments and Home Ownership Cummins, Woerner, Tomyn, Gibson & Knapp. October 2006.
Australian Unity Wellbeing Index: Survey 15 The Wellbeing of Australians – Income security Cummins, Woerner, Tomyn, Gibson & Knapp. May 2006.
Australian Unity Wellbeing Index: Report 14.1 Fifth Anniversary Special Report – Summarising the Major Findings Cummins. March 2006.
Australian Unity Wellbeing Index: Survey 14 The Wellbeing of Australians – Personal Relationships Cummins, Woerner, Tomyn, Gibson & Knapp. October 2005.
Australian Unity Wellbeing Index: Report 13.1 Special Report: The Personal Wellbeing of Australians Living within Federal Electoral Divisions Cummins, Knapp, Woerner, Walter & Page. October 2005.
Australian Unity Wellbeing Index: Survey 13 The Wellbeing of Australians – Caregiving at Home Cummins, Okerstrom, Woerner & Tomyn. July 2005.
Australian Unity Wellbeing Index: Report 12.1 Special Report on City and Country Living Cummins, Davern, Okerstrom, Kai Lo & Eckersley. January 2005.
Australian Unity Wellbeing Index: Survey 12 The Wellbeing of Australians – Job Security Cummins, Eckersley, Kai Lo, Okerstorm, Hunter & Woerner. October 2004.
Australian Unity Wellbeing Index: Survey 11 The Wellbeing of Australians – Personal Financial Debt Cummins, Eckersley, Kai Lo, Okerstorm, Davern & Woerner. August 2004.
Australian Unity Wellbeing Index: Survey 10 The Wellbeing of Australians – Health & Body Weight Cummins, Eckersley, Kai Lo, Okerstorm, Woerner & Davern. April 2004.
Australian Unity Wellbeing Index: Survey 9 The Wellbeing of Australians – Owning a Pet Cummins, Eckersley, Kai Lo, Okerstorm, Hunter & Davern. February 2004.
Australian Unity Wellbeing Index: Survey 8 The Wellbeing of Australians – Feeling Connected to Australia Cummins, Eckersley, Kai Lo, Okerstorm, Davern & Hunter. November 2003.
Australian Unity Wellbeing Index: Survey 7 The Wellbeing of Australians – The Effects of Work Cummins, Eckersley, Kai Lo, Okerstorm, Hunter & Davern. August 2003.
Australian Unity Wellbeing Index: Survey 6 The Wellbeing of Australians – Impact of the Impending Iraq War Cummins, Eckersley, Kai Lo, Okerstorm, Davern & Hunter. April 2003.
Australian Unity Wellbeing Index: Survey 5 The Wellbeing of Australians – 1. Personal Finances 2. The Impact of the Bali Bombing Cummins, Eckersley, Kai Lo, Okerstorm, Hunter & Davern. February 2003.
Australian Unity Wellbeing Index: Survey 4 The Wellbeing of Australians – 1. Work & Leisure 2. The Impact of September 11 One Year Later Cummins, Eckersley, Kai Lo, Okerstorm & Davern. September 2002.
Australian Unity Wellbeing Index: Survey 3, Report 3.2 The Impact of Personal Relationships and Household Structure on the Wellbeing of Australians Cummins, Eckersley, Pallant, Okerstorm & Davern. April 2002.
Australian Unity Wellbeing Index: Survey 3, Report 3.1 Wellbeing in Australia in the aftermath of September 11 Cummins, Eckersley, Pallant & Davern. May 2002.
Australian Unity Wellbeing Index: Survey 2, Report 2 Special Report on Income and Geographic Location Cummins, Eckersley, Pallant, Davern & Misajon. December 2001.
Australian Unity Wellbeing Index: Survey 2, Report 1 Cummins, Eckersley, Pallant, Misajon & Davern. December 2001.
Australian Unity Wellbeing Index: Survey 1, Report 1 Cummins, Eckersley, Pallant, Van Vugt, Shelley, Pusey & Misajon. June 2001.
For further information or general enquiries on the Australian Unity Wellbeing Index, please email: [email protected]
Copies of all reports and associated data sets can be downloaded free of charge from the Australian Centre on Quality of Life at Deakin University
http://www.deakin.edu.au/research/acqol/auwbi/survey-reports/
39T E N Y E A R S O F T H E A U S T R A L I A N U N I T Y W E L L B E I N G I N D E X