MDM4U- Math and Data Management Year-Long … Math and Data Management Year-Long project A Closer...
38
MDM4U- Math and Data Management Year-Long project A Closer Look At Canadian Suicide By: Jessica Laks Step 1: Planning The Project and Finding a Topic Action Plan 1) Select topic- by middle of October 2) Create the topic question- by middle of November 3) Find Data- by middle of December 4) Analyze the Data- by end of January 5) Create a Presentation Outline- by beginning of February 6) Prepare a first Draft- by end of February 7) Revise, edit and proofread- by middle of March 8) Prepare and practice the presentation- by end of March 9) Buffer Room- the whole month of April Mind Map Jess Academic Subjects Biology Chemistry Sciences Medicine Health Care Non-Academic Subjects Acting Singing Performing Arts Dancing
Transcript of MDM4U- Math and Data Management Year-Long … Math and Data Management Year-Long project A Closer...

MDM4U- Math and Data Management Year-Long project A Closer Look At Canadian Suicide
By: Jessica Laks
Step 1: Planning The Project and Finding a Topic
Action Plan
1) Select topic- by middle of October
2) Create the topic question- by middle of November
3) Find Data- by middle of December
4) Analyze the Data- by end of January
5) Create a Presentation Outline- by beginning of February
6) Prepare a first Draft- by end of February
7) Revise, edit and proofread- by middle of March
8) Prepare and practice the presentation- by end of March
9) Buffer Room- the whole month of April
Mind Map
Jess
Academic Subjects
Biology Chemistry Sciences
Medicine
Health Care
Non-Academic Subjects
Acting Singing
Performing Arts
Dancing

After looking over my mind map, I realized I would like to concentrate specifically on Health Care and Biology. This leads me to a new mind map.
Health issues: disease/illness Immunity
Health Care/Biology
Medications
Genetics After thinking about this mind map for a while and where my interests lie, I decided to research antibiotics and antibiotic resistance. I decided since I was so interested in health, this would be a perfect topic for me. Step 2: Find Data I immediately began searching for data on antibiotics and resistance. However, there were no actual data or studies done on this topic, so all I could find was written information and facts about antibiotics and resistance. I would have to start all over again. Back to Step 1: Choosing a Topic I looked over my mind map again and decided that my interests still lie within health and I would like to keep working on that. I remembered, that while I was searching for data on antibiotics, lots of data on asthma came up. I decided to start researching asthma and asthma rates around the world. Step 2: Find Data Finding data on asthma was much easier than antibiotics. I received excellent data and asthma rates from websites like: www.asthmasociety.ie/news/Irelandfit.asp and www.nationalasthma.org.au/publications/cam/trends.html The data led me to my thesis question: Does latitude have an effect on asthma rates? I planned to gather data on asthma prevalence from numerous countries around the world and graph it against the countries’ latitude. I would then determine if there was a

correlation between the two and make an index about how you can predict asthma rates in your country. However, as time went by I found it a struggle to bring my self to do the work and I finally realized why. I was not inspired by asthma and had no real interest in researching it. I knew that if I had no interest in asthma, then a class full of thirty 17-19 year olds would not be interested either. So, I was back to step 1! Step 1: Choosing a Topic This time, I was going to wait for some inspiration in choosing a topic. Unfortunately my inspiration came late and the action plan I made at the beginning was completely out of whack. However, finally the inspiration came from a story I heard on April 11th, 2003: On Tuesday, April 1st 2003, just 8 days before his 18th birthday, Daniel Ehrlick committed suicide. Dan was part of the same international youth organization and not only was he a member, but he was president of the Greater Jersey Hudson River Region (a region is a few cities put together). According to everyone that knew him, Dan was one of the nicest, happiest guys you could know. “He was one of the happiest people we knew” is a quote from one of his friends. Dan hung himself in his garage and left no note, no reason for his sudden departure from this world. Everyone who knew him is lost and confused no one expected this. Dan seemed like he had his entire life in order, he had been accepted to Indiana University right away with a scholarship into his desired program, Sports Management. His parents were easily the nicest people on earth, and spent the few days after his death trying to comfort his friends rather than having his friends comfort them. His death had a huge effect on many people’s life and is a devastating story. After hearing this story, I had found my calling. I was speechless in hearing this story and knew that my passion in researching a topic lay with suicide. Suicide is such a serious problem in our world today. In the case of Daniel Ehrlick, he did not leave a note so no one knows why he is gone. There are many people in the world who face the same problems and resort to death. In my project, I want to research suicide around the world and in Canada. I want to know why people commit suicide and how many people do it. I also want to research how you and I can help. Step 2: Finding Data Using the Stats Can Canadian Community Health Survey, I was able to gather data on people who have seriously considered suicide in the past year. However, before I analyze that data, I would like to look a bit at suicide around the world.
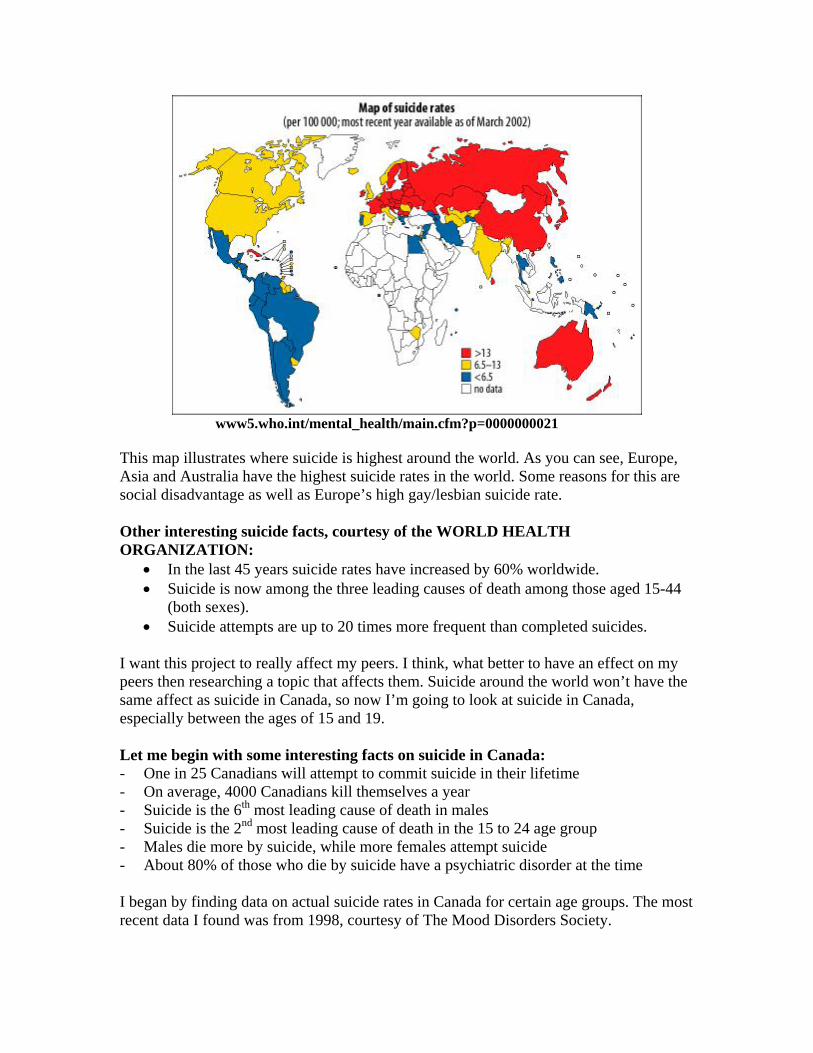
www5.who.int/mental_health/main.cfm?p=0000000021 This map illustrates where suicide is highest around the world. As you can see, Europe, Asia and Australia have the highest suicide rates in the world. Some reasons for this are social disadvantage as well as Europe’s high gay/lesbian suicide rate. Other interesting suicide facts, courtesy of the WORLD HEALTH ORGANIZATION:
• In the last 45 years suicide rates have increased by 60% worldwide. • Suicide is now among the three leading causes of death among those aged 15-44
(both sexes). • Suicide attempts are up to 20 times more frequent than completed suicides.
I want this project to really affect my peers. I think, what better to have an effect on my peers then researching a topic that affects them. Suicide around the world won’t have the same affect as suicide in Canada, so now I’m going to look at suicide in Canada, especially between the ages of 15 and 19. Let me begin with some interesting facts on suicide in Canada: - One in 25 Canadians will attempt to commit suicide in their lifetime - On average, 4000 Canadians kill themselves a year - Suicide is the 6th most leading cause of death in males - Suicide is the 2nd most leading cause of death in the 15 to 24 age group - Males die more by suicide, while more females attempt suicide - About 80% of those who die by suicide have a psychiatric disorder at the time I began by finding data on actual suicide rates in Canada for certain age groups. The most recent data I found was from 1998, courtesy of The Mood Disorders Society.

I found the suicide rates for both males and females in Canada in 1998. Before graphing the data, I made an assumption that suicide rates would be highest for people between the ages of 15 and 44. I assumed that the rest of the suicide rates would be fairly low and my graph would end up skewed to the right. I graphed the data and found:
Suicide Rates in 1998 (per 100, 000)
0
5
10
15
20
25
30
35
10 to
14
20 to
24
30 to
34
40 to
44
50 to
54
60 to
64
70 to
74
80 to
84
Age Group
Rat
e pe
r 100
, 000
Males
Females
That my hypothesis had been very wrong. The suicide rates are very high between the ages of 20 and 44, however the highest suicide rates in males are 85 years old and over. The highest suicide rates in females are 45 to 49 years old. Part 3: Analysis of the Data The graph of suicide in Canada is not skewed to one side or a normal distribution, so if I would like another way to explain the graph and the spread of data, I turn to measures of central tendency. I began by solving for the mean in males:
The mean equals the sum of f x m divided by the sum of the frequencies.
Age Frequency
f Midpoint (age) m fxm 10 to 14 2.9 12 2.9 x 12 = 34.8 15 to 19 18.2 17 18.2 x 17 = 309.4 20 to 24 25.5 22 25.5 x 22 = 561 25 to 29 24.5 27 24.5 x 27 = 661.5 30 to 34 24.8 32 24.8 x 32 = 793.6 35 to 39 27.3 37 27.3 x 37 = 1010.140 to 44 27.3 42 27.3 x 42 = 1146.645 to 49 25.8 47 25.8 x 47 = 1212.650 to 54 25 52 25 x 52 = 1300 55 to 59 24.6 57 24.6 x 57 = 1402.260 to 64 22.9 62 22.9 x 62 = 1419.865 to 69 18.5 67 18.5 x 67 = 1239.570 to 74 22.7 72 22.7 x 72 = 1634.475 to 79 20.5 77 20.5 x 77 = 1578.580 to 84 27.4 82 27.4 x 82 = 2246.885 + 31 87 31 x 87 = 2697
Mean= 19247.8 368.9 Mean= 52.18 Therefore the mean age group for the men is 50 to 54 years old.

Next, I solved for the mean in women:
Mean = 4385.3Age frequency f Midpoint (age) m fxm 10 to 14 1.5 12 1.5 x 12 = 18 15 to 19 6.4 17 6.4 x 17 = 108.8 20 to 24 4.1 22 4.1 x 22 = 90.2 25 to 29 5.6 27 5.6 x 27 = 151.2 30 to 34 6.2 32 6.2 x 32 = 198.4 35 to 39 7 37 7 x 37 = 259 40 to 44 7 42 7 x 42 = 294 45 to 49 8.3 47 8.3 x 47 = 390.1 50 to 54 7.2 52 7.2 x 52 = 374.4 55 to 59 5.6 57 5.6 x 57 = 319.2 60 to 64 4.7 62 4.7 x 62 = 291.4 65 to 69 4.9 67 4.9 x 67 = 328.3 70 to 74 5.5 72 5.5 x 72 = 396 75 to 79 5.6 77 5.6 x 77 = 431 .2 80 to 84 6.1 82 6.1 x 82 = 500.2 85 + 2.7 87 2.7 x 87 = 234.9
88.4 Mean = 49.6 Therefore, the mean in women is between the 45 to 49 age group, almost in the 50 to 54 age group.
By looking at the graph, both the men’s and women’s values for the mean look to be accurate. Next, I solved for the median for the men and women, in order to find another possible measure of central tendency, to help explain the data. The median in males is the 30 to 34 age group, while the median in females is both the 25 to 29 age group and the 75 to 79 age group. These medians, being so varied proves how inconsistent the data is, and how different it is for every age group. Lastly, I decided to solve for the mode in both males and females. In males, between the ages of 20 and 44, there is a high suicide rate, however the mode in males is the age group of 85+, with over 30 deaths out 100,000 people. I was very curious as to why suicide was highest in this age group, so I did some research. There are many factors of why suicide is so high in elderly males, some of them are:
• Frailty of elderly - injuries may cause more physical damage and their recuperative abilities may be less.
• The social isolation of many elders leaves less opportunity for rescue. • Elderly people tend to use more lethal methods and they often have stronger
suicidal intent • Being single or divorced, or living alone • Social isolation / closed family systems which do not encourage discussion or
help-seeking • Poor physical health or the belief that one is still ill

• Hopelessness and helplessness • Loss of health, status, social roles, independence, significant relationships • Depression • Fear of institutionalization
It turns out that suicide rates in elderly males are a huge problem in both Canada and the US. The most interesting fact I found was that most elderly males see a doctor in the month leading up to their suicide. However, the doctor does not pick up the signs or just doesn’t help enough.
Next, I looked at the mode in female suicide in 1998. The mode age group for committing suicide in females is 45 to 49, with approximately 8 deaths out of 100,000 people. I decided to do some research to find out why that was.
The reason for women’s suicide rates to be highest between the ages of 45 to 49 is:
• Depression in women of this age group is very high • Divorce • Single-parenting
After looking at this data and understanding all about the 85+ year old men having the highest suicide rate, I decided to find the actual proportion of all deaths for each age group that is suicide:
Proportion of All Deaths Due to Suicide in 1998
05
1015202530
Under15
15 to24
25 to44
45 to64
65+
Age
Perc
ent (
%)
Series1Series2
The purple bar represents the males and the maroon bar represents the females. As you can see, even though the elderly men have the highest suicide rates in 100,000 people, they have the lowest proportion of deaths due to suicide. This means that more elderly males are dieing due to other causes, not suicide. However, between the ages of 15 to 24, both males and females have the highest proportion of deaths due to suicides with 26% and 17%

respectively. This means that approximately ¼ of deaths in teens and young adults were due to suicide. That is ¼ of deaths that could have been prevented.
After this general overview of suicide in Canada at the different age groups, it’s time to get into the bulk of my research.
Research: As I mentioned earlier, I received my data from the Stats Can Canadian Community National Public Health Survey. Using this program, I was able to gather data on people in Canada of all different age groups and whether or not they’ve thought about suicide in their lifetime and if so, in the past 12 months. The data is part of a cross-sectional study done by Statistics Canada in 2001. The sample of people who took part in this survey is any Canadian 15 years old and above. As well, I was able to gather this data along with data on depression, self-esteem, emotional status and alcohol dependency of the same people.
Issues with Data: The survey was done on people who had only seriously considered suicide, not actually committed it. Therefore, the data is not the same is it would be for someone who actually went through with the suicide. Keep that in mind, when analyzing the data. As well, keep in mind the fact that people can be more melodramatic when participating in a survey.
Main Thesis Question: I believe that; depression, self-esteem, emotional status and alcohol dependency will all have some sort of effect on suicide.
I began analyzing the data by graphing the number of males and females who said yes to seriously considering suicide. The graph is set up by age; therefore I was interested in seeing if the graph resembled that of the suicide rates by age in 1998.
# of males who said yes to considering suicide in the past 12 months vs. age
05000
10000150002000025000
15 to
19
25 to
29
35 to
39
45 to
49
55 to
59
65 to
69
75 to
79
Age
# co
nsid
ered
sui
cide
in
past
12
mon
ths
Series1
# of females who said yes to considering suicide in the past 12 months
050000
100000150000200000250000
15 to
19
25 to
29
35 to
39
45 to
49
55 to
59
65 to
69
75 to
79
Age
# w
ho c
onsi
dere
d su
icid
e
Females
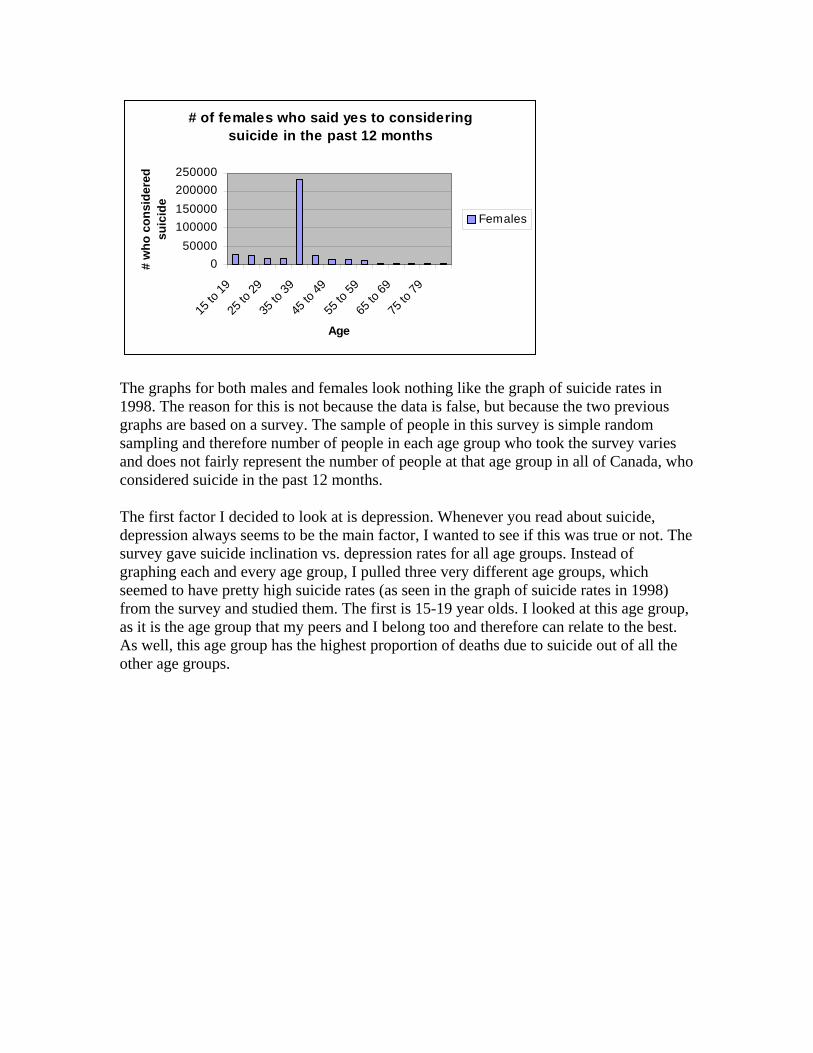
The graphs for both males and females look nothing like the graph of suicide rates in 1998. The reason for this is not because the data is false, but because the two previous graphs are based on a survey. The sample of people in this survey is simple random sampling and therefore number of people in each age group who took the survey varies and does not fairly represent the number of people at that age group in all of Canada, who considered suicide in the past 12 months.
The first factor I decided to look at is depression. Whenever you read about suicide, depression always seems to be the main factor, I wanted to see if this was true or not. The survey gave suicide inclination vs. depression rates for all age groups. Instead of graphing each and every age group, I pulled three very different age groups, which seemed to have pretty high suicide rates (as seen in the graph of suicide rates in 1998) from the survey and studied them. The first is 15-19 year olds. I looked at this age group, as it is the age group that my peers and I belong too and therefore can relate to the best. As well, this age group has the highest proportion of deaths due to suicide out of all the other age groups.

# of 15-19 year old males who considered suicide in the past 12 months vs. depression
0100020003000400050006000700080009000
[0.00
,0.05
)
[0.05
,0.25
)
[0.25
,0.50
)
[0.50
,0.80
)
[0.80
,0.90
)
Depression Scale
# of
mal
es w
ho c
onsi
dere
d su
icid
e
Series1
# of 15-19 year old females who considered suicide in the past 12 months vs. depression
0
2000
4000
6000
8000
10000
12000
[0.00
,0.05
)
[0.05
,0.25
)
[0.25
,0.50
)
[0.50
,0.80
)
[0.80
,0.90
)
Depression Scale
# of
fem
ales
who
con
side
red
suic
ide
Series1
The graphs of the 15-19 year olds did not come out as I expected. I expected to see a linear correlation that showed as depression went up, so did suicide inclination. However it seems as if for both males and females, more people have though about suicide at a lower depression. I then graphed the age group of 40-44 year olds, which has a fairly high suicide rate. I was hoping to see a more expected graph from this age group.
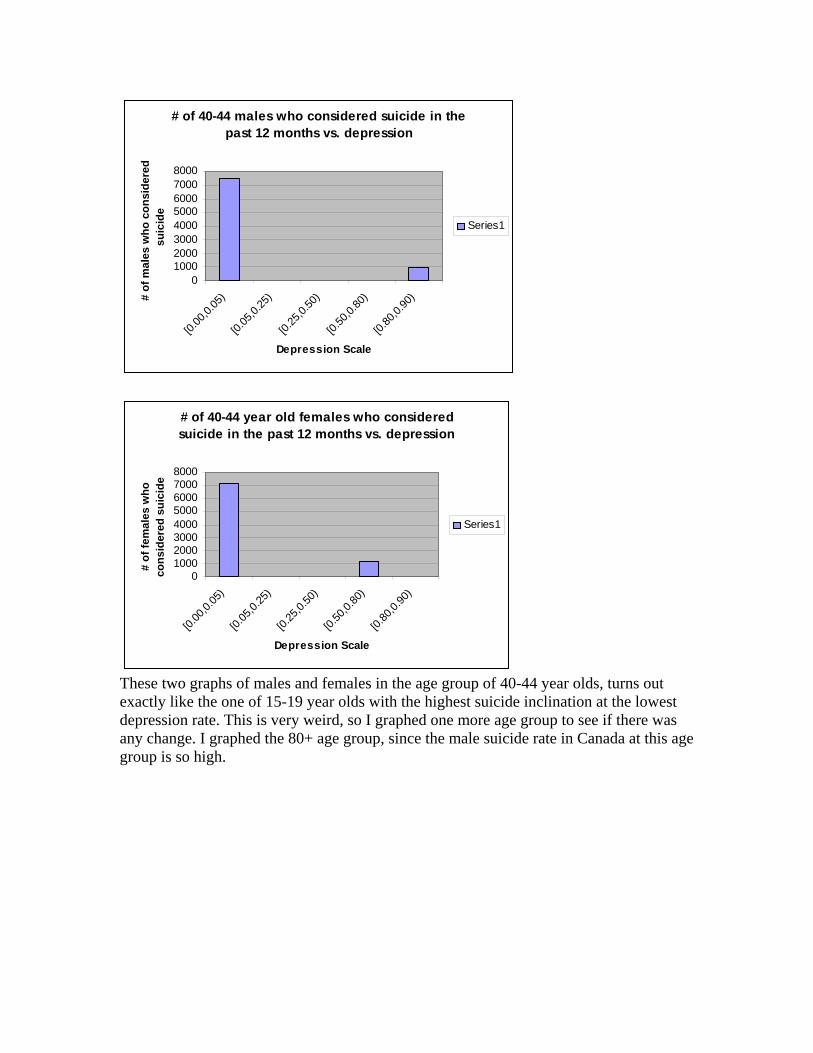
# of 40-44 males who considered suicide in the past 12 months vs. depression
010002000300040005000600070008000
[0.00
,0.05
)
[0.05
,0.25
)
[0.25
,0.50
)
[0.50
,0.80
)
[0.80
,0.90
)
Depression Scale
# of
mal
es w
ho c
onsi
dere
d su
icid
e
Series1
# of 40-44 year old females who considered suicide in the past 12 months vs. depression
010002000300040005000600070008000
[0.00
,0.05
)
[0.05
,0.25
)
[0.25
,0.50
)
[0.50
,0.80
)
[0.80
,0.90
)
Depression Scale
# of
fem
ales
who
co
nsid
ered
sui
cide
Series1
These two graphs of males and females in the age group of 40-44 year olds, turns out exactly like the one of 15-19 year olds with the highest suicide inclination at the lowest depression rate. This is very weird, so I graphed one more age group to see if there was any change. I graphed the 80+ age group, since the male suicide rate in Canada at this age group is so high.

# of 80+ males who considered suicide in the past 12 months vs. depression
0100200300400500600700
[0.00
,0.05
)
[0.05
,0.25
)
[0.25
,0.50
)
[0.50
,0.80
)
[0.80
,0.90
)
Depression Scale
# of
mal
es w
ho
cons
ider
ed s
uici
de
Series1
# of 80+ females who considered suicide in the
past 12 months vs. depression
0200400600800
100012001400
[0.00
,0.05
)
[0.05
,0.25
)
[0.25
,0.50
)
[0.50
,0.80
)
[0.80
,0.90
)
Depression Scale
# of
fem
ales
who
co
nsid
ered
sui
cide
Series1
As you can see, the 80+ age group in both males and females has the same outcome as the other two age groups. I refused to believe that my hypothesis was completely incorrect, there is no way depression plays such a small role in suicide and suicide inclination. I decided there must be some other factor having an effect here. Suicide and depression are very serious and private topics, many people when taking the survey did not respond to some of these questions. Non-response bias can have a large effect on the data. I decided to graph the age groups vs. the % response for those age groups. I expect that the older you get, the less willing you are to answer the questions as you are probably tired of sharing your life stories and private information with everyone. As well, I also expect to see that women’s’ response rates are less than men’s’. I believe that it will be like this because women sometimes like to keep things more personal than men. This graph is the percent of people who said they considered suicide in the past 12 years and responded to the depression scale.

% of people said yes to suicide in the past 12 months that answered depression question
0%
20%
40%
60%
80%
100%
17 27 37 47 57 67 77
Age
Perc
ent
Male
Female
As you can see from this graph, the men are on average higher than the women in percent response. However, their main difference is at the highest age group. The men follow my hypothesis and drop at the highest age group, as they are tired of sharing their personal life and are just ready to die. However, the females in at the highest age group have an almost 90% response rate, meaning they’re answering all the questions on depression. Why do people respond to considering suicide and not respond to depression questions that follow? When answering a survey, people will give answers but may not want to explain themselves. If people have thought about suicide in the past little while, they may not be ready to share why. We’re going to assume that by not responding to the depression questions, the participants of the survey are depressed. Keep this in mind when looking at the next two graphs. The next two graphs are the stacked column graphs for males and females showing the distribution of depression amongst the people who said they considered suicide in the past 12 months.

Distribution of Depression Amongst Males Who Said They Considered Suicide in The Past
Year
0%
50%
100%
150%
17 27 37 47 57 67 77
Age
Perc
ent % not depressed
% most depressed
% did not respond
Distribution of Depression Amongst Females Who Said They've Considered Suicide In The Past
Year
0%
20%40%
60%
80%100%
120%
17 27 37 47 57 67 77
Age
Perc
ent % not depressed
% most depressed
% did not respond
When analyzing these two graphs, consider % most depressed and % did not respond as one item together. Then compare it to the % not depressed. For the men, between the ages of 17 to 52, the % of people depressed is more than the % of people not depressed. As the men get older, that changes as and 80 year old man may not be depressed, he is just happy with the long life has lived and is ready for it to be over. As for the women, they have a higher % of depression all the way up until the age of approximately 67. This shows that depression in women has a greater effect on suicides then it does in men. Just as in the men’s comparison, as the women get older, they too become less depressed and more willing to die. Next, I took the percent of people who didn’t respond and calculated the number of people it comes out to in males and females 15-19, 40-44 and 80+. This way, we can analyze what the graph looks like now assuming that these people are mist depressed.

# of males between the ages of 15-19 who considered suicide in the past 12
months vs. depression
02000400060008000
10000
[0.00
,0.05
)
[0.05
,0.25
)
[0.25
,0.50
)
[0.50
,0.80
)
[0.80
,0.90
)
Depression Scale
# of
mal
es w
ho
cons
ider
ed
suic
ide Series1
As you can see, this graph now has a more equal level of suicide inclination between least depressed and most depressed. This still goes against my hypothesis, but makes more sense realistically.
# of females between the ages if 15-19 who considered suicide in the past 12
months vs. depressiony = 3859.6x2 -
22227x + 29630R2 = 0.9452
-10000
0
10000
20000
0 5 10
Depression Scale (1= 0.00,0.05)
# of
fem
ales
who
co
nsid
ered
su
icid
e
Series1Poly. (Series1)
The previous graph shows a very high quadratic correlation. The suicide inclination at highest depression is now higher than any other point on the depression scale. The reason this relationship is quadratic and not linear is because at all the middle depression rates, there was no response at all. People only seemed to answer as one extreme or the other.

# of males between the ages of 40-44 that considered suicide in the past 12
months vs. depression
02000400060008000
[0.00
,0.05
)
[0.05
,0.25
)
[0.25
,0.50
)
[0.50
,0.80
)
[0.80
,0.90
)
Depression Scale
# of
mal
es w
ho
cons
ider
ed s
uici
de
Series1
For males between the ages of 40 and 44 there is a pretty even number of males with suicide inclination at the lowest and highest depression rates. This graph is better representing the effect depression has on suicide then the first one, but it still is against my hypothesis.
# of females between the ages of 40-44 who considered suicide in the past 12
months vs. depressiony = 4322.4x2 -
23601x + 26412R2 = 1
-10000-5000
05000
100001500020000
0 2 4 6
Depression Scale (1= 0.00,0.05)
# of
fem
ales
who
co
nsid
ered
sui
cide
Series1Poly. (Series1)
Looking at the new graph of females between the ages of 40 and 44, we see that the number of people with suicide inclination at the highest depression rate is much higher than any other depression rate. This would prove my hypothesis. This relationship is represented by a perfect curve of best. It is a curve instead of a line of best fit, because of the lack of response at the middle depression rates.

# of 80+ year old males who considered suicide in the past 12
months vs. depressiony = 198.21x2 - 1143.6x
+ 1528R2 = 0.9458
-500
0
500
1000
0 2 4 6
Depression Scale (1=0.00, 0.05)
# of
mal
es w
ho
cons
ider
ed s
uici
de
Series1Poly. (Series1)
For males 80+ years old, we see again that as depression rates increase so does suicide inclination. The curve of best fit has a very high correlation representing the two peaks of suicide inclination and the area of middle depression that has no response.
# of 80+ year old females who considered suicide in the past 12
months vs. depression
0500
10001500
[0.00
,0.05
)
[0.05
,0.25
)
[0.25
,0.50
)
[0.50
,0.80
)
[0.80
,0.90
)
Depression Scale (1=0.00, 0.05)
# of
fem
ales
who
co
nsid
ered
sui
cide
Series1
The graph of 80+ year old females shows no difference than the first graph and disproves my hypothesis. Conclusion: It’s hard to base a conclusion on a survey with such a low response rate. However, if we assume that no response means the people are depressed and just don’t want to share it, then depression does have a major effect on suicide. You can see by my second set of graphs by age and sex how much of an effect the non-response has and therefore how much of an effect the depression has on suicide inclination and suicide. If we are assuming that no response is just no response, then our conclusion would be the opposite based on the first graphs.

Next, is a look at self-esteem in those that have considered suicide in the past 12 months. I’ll follow the same method in graphing the different age groups in order to keep a common variable. My hypothesis when it comes to self-esteem is that people with lower self-esteem will have higher suicide inclination. First two graphs are 15-19 year old males and females who have considered suicide in the past 12 months and their self-esteem:
# of 15-19 year old males who considered suicide in the past year vs. self-esteem scale
0
100
200
300
400
500
600
700
[00,
01)
[02,
03)
[04,
05)
[06,
07)
[08,
09)
[10,
11)
[12,
13)
[14,
15)
[16,
17)
[18,
19)
[20,
21)
[22,
23)
Self-esteem Scale
# of
peo
ple
cons
ider
ed s
uici
de
Series1
# of 15-19 year old females who considered
suicide in the past year vs. self-esteem
0
100
200300
400
500
600
[00,01
)
[03,04
)
[06,07
)
[09,10
)
[12,13
)
[15,16
)
[18,19
)
[21,22
)
Self-esteem Scale
# of
fem
ales
con
side
red
suic
ide
Series1
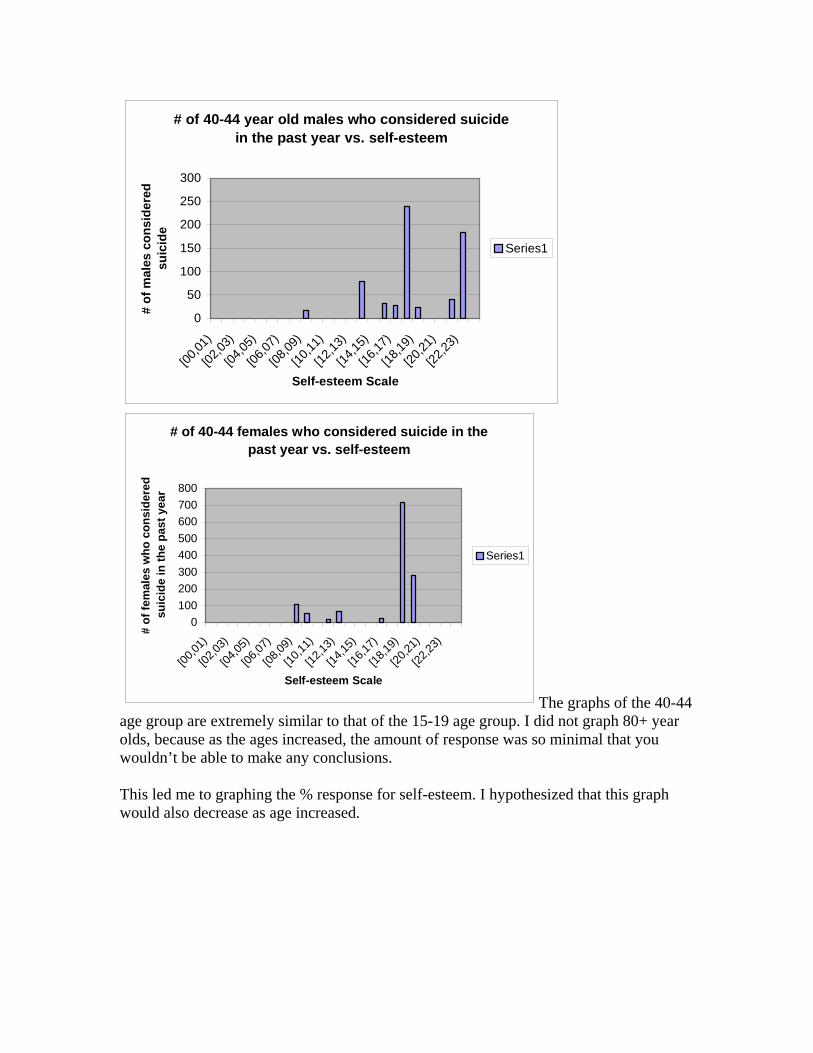
Again, by analyzing these two graphs we see that my hypothesis is wrong. Suicide inclination is highest in both 15-19 year old males and females where self-esteem is highest. It’s also extremely interesting to see that barely anyone responded to having low self-esteem. I then graphed the 40-44 year old males and females who considered suicide in the past 12 months versus their self-esteem.
# of 40-44 year old males who considered suicide in the past year vs. self-esteem
0
50
100
150
200
250
300
[00,01
)
[02,03
)
[04,05
)
[06,07
)
[08,09
)
[10,11
)
[12,13
)
[14,15
)
[16,17
)
[18,19
)
[20,21
)
[22,23
)
Self-esteem Scale
# of
mal
es c
onsi
dere
d su
icid
e
Series1
# of 40-44 females who considered suicide in the past year vs. self-esteem
0100200300400500600700800
[00,01
)
[02,03
)
[04,05
)
[06,07
)
[08,09
)
[10,11
)
[12,13
)
[14,15
)
[16,17
)
[18,19
)
[20,21
)
[22,23
)
Self-esteem Scale
# of
fem
ales
who
con
side
red
suic
ide
in th
e pa
st y
ear
Series1
The graphs of the 40-44 age group are extremely similar to that of the 15-19 age group. I did not graph 80+ year olds, because as the ages increased, the amount of response was so minimal that you wouldn’t be able to make any conclusions. This led me to graphing the % response for self-esteem. I hypothesized that this graph would also decrease as age increased.

% Response Of People Who Considered Suicide in The Past Year
0%2%4%6%8%
10%12%14%16%
17 27 37 47 57 67 77
Age
Perc
ent
Male
Female
My hypothesis is somewhat correct, as there is a peak in response for both males and females at the age of 72 and then a large drop to 0% response for the males and females older than that. By looking at the graph, you can see that % response for the self-esteem questions were extremely minimal, with the highest at not even 14% response. We can conclude from this that many people do not like talking about their self-esteem and we cannot base any conclusions on the four previous graphs, as they do not fairly represent the population. This led me to graphing a stack column of those who did not respond, those with low self-esteem and those with high self-esteem for each age group. Going into this graph, we are again going to assume that the majority of those that didn’t respond didn’t respond because they do have low self-esteem and did not want to talk about it.
Distribution of Self-Esteem of Males Who Considered Suicide in the Past Year
75%
80%
85%
90%
95%
100%
105%
17 27 37 47 57 67 77
Age
Perc
ent
% with high self-esteem% with low self-esteem% Not Responded

Distribution of Self-esteem in Females who Considered Suicide in the Past Year
0%
20%
40%
60%
80%
100%
120%
17 27 37 47 57 67 77
Age
Perc
ent
% with high self-esteem% with low self-esteem% not responded
Looking at the graphs for both males and females, we see that out of the people who have though about suicide in the past 12 months, very few of them have high self-esteem. The majority of people did not respond to the survey on self-esteem and are therefore assumed to have low self-esteem. After looking at the extremely large percent of non-response, I again graphed the different age groups and sexes. However, this time I included the non-response as people with low self-esteem and this is what I found:
# of 15-19 year old males who considered suicide in the past 12
months vs. self-esteem
05000
100001500020000
[00,
01)
[03,
04)
[06,
07)
[09,
10)
[12,
13)
[15,
16)
[18,
19)
[21,
22)
Self-esteem Scale
# of
mal
es w
ho
cons
ider
ed
suic
ide
Series1
The majority of suicide inclination in 15 to 19 year old males is at very low self-esteem. There is a few other suicide inclinations at other self-esteem rates, but they are so small it makes no difference.

# of 15-19 year old females that considere suicide in the past 12
months vs. self-esteem
05000
1000015000200002500030000
[00,
01)
[03,
04)
[06,
07)
[09,
10)
[12,
13)
[15,
16)
[18,
19)
[21,
22)
Self-esteem Scale
# of
fem
ales
who
cons
ider
ed
suic
ide
Series1
The graph of 15 to 19 year old females is the exact same as the one for females. Those with low self-esteem have the highest suicide inclination by far.
# of 40-44 year old males who considered suicide in the past 12
months vs. self-esteem
02000400060008000
10000120001400016000
[00,
01)
[03,
04)
[06,
07)
[09,
10)
[12,
13)
[15,
16)
[18,
19)
[21,
22)
Self-esteem Scale
# of
mal
es w
ho
cons
ider
ed s
uici
de
Series1
In the graph of 40-44 year old men, we see even less of suicide inclination at other self-esteem rates and almost 100% of suicide inclination taking place when the person has extremely low self-esteem.

# of 40-44 year old females who considered suicide in the past 12
months vs. self-esteem
05000
10000150002000025000
[00,01
)
[04,05
)
[08,09
)
[12,13
)
[16,17
)
[20,21
)
Self-esteem Scale
# of
fem
ales
who
cons
ider
ed
suic
ide
Series1
The graph for 40 to 44 year old women shows the exact same as the other graphs, with the majority of the suicide inclination being with people that have low self-esteem.
# of 80+ year old males who considered suicide in the past 12
months vs. self-esteem
0
500
1000
1500
[00,01
)
[03,04
)
[06,07
)
[09,10
)
[12,13
)
[15,16
)
[18,19
)
[21,22
)
Self-esteem Scale
# of
mal
es w
ho
cons
ider
ed
suic
ide
Series1
For the males 80 years and older, all 100% who considered suicide in the past 12 months have extremely low self-esteem.

# of 80+ year old females who considered suicide in the past 12
months vs. self-esteem
0
500
1000
1500
2000
[00,01
)
[04,05
)
[08,09
)
[12,13
)
[16,17
)
[20,21
)
Self-esteem Scale
# of
fem
ales
who
cons
ider
ed
suic
ide
Series1
Again, for women of 80 years or older, all 100% of people who considered suicide in the past 12 months have extremely low self-esteem. Conclusion: Again, it is extremely hard to make conclusions on self-esteem and suicide inclination considering there is close to 100% non-response in this sample. However, if we assume that not responding to the questions means the people have low self-esteem and choose not to talk about it. Then self-esteem has an extremely large effect on suicide inclination. Next, I looked at the emotional status of the people who considered suicide in the past 12 months. I began by graphing the 15-19 year olds and expected to see that people with a deteriorating emotional status had highest suicide inclination.
# of 15-19 year old males who considered suicide in the past year vs. emotional status
0100020003000400050006000700080009000
HA
PP
Y A
ND
INTE
RE
STE
DIN
LIF
E
SO
ME
WH
AT
UN
HA
PP
Y
SO
UN
HA
PP
YTH
AT
LIFE
ISN
OT
Emotional Status
# of
mal
es w
ho
cons
ider
ed s
uici
de in
the
past
yea
r
Series1

# of 15-19 year old females who considered suicide in the past year vs. emotional status
02000400060008000
100001200014000
HA
PP
Y A
ND
INTE
RE
STE
DIN
LIF
E
SOM
EWH
ATU
NH
AP
PY
SO
UN
HA
PP
YTH
AT
LIFE
ISN
OT
Emotional Status
# of
fem
ales
who
con
side
red
suic
ide
in th
e pa
st y
ear
Series1
Again, the graphs turned out opposite of what I expected. Based on these graphs, both 15-19 year old males and females who are happy or somewhat happy in life had the highest suicide inclination in the past year. In fact, the males had 0 inclination at “so unhappy life is not worthwhile,” and the females had less than 2000 at that point. I graphed that 40-44 year old age group next to see if their responses were any different.
# of 40-44 year old males who considered suicide in the past year vs. emotional status
01000200030004000500060007000
HA
PP
Y A
ND
INTE
RE
STE
DIN
LIF
E
SO
ME
WH
AT
UN
HA
PP
Y
SO
UN
HA
PP
YTH
AT
LIFE
ISN
OT
Emotional Status
# of
mal
es w
ho c
onsi
dere
d su
icid
e in
the
past
yea
r
Series1

# of 40-44 year old females who considered suicide in the past year vs. emotional status
0100020003000400050006000700080009000
10000
HA
PP
Y A
ND
INTE
RE
STE
DIN
LIF
E
SO
ME
WH
AT
UN
HA
PP
Y
SO
UN
HA
PP
YTH
AT
LIFE
ISN
OT
Emotional Status
# of
fem
ales
who
con
side
red
suic
ide
in th
e pa
st y
ear
Series1
The graphs of 40-44 year old males and females resemble that of the 15-19 year old age group. Again, the highest suicide inclination in the past year is of those people who are happy in life. Since there was enough of a response rate in 80+ year olds, I graphed them next.
# of 80+ year old males who considered suicide in the past year vs. emotional status
0100200300400500600700800
HA
PP
Y A
ND
INTE
RE
STE
DIN
LIF
E
SO
ME
WH
AT
UN
HA
PP
Y
SO
UN
HA
PP
YTH
AT
LIFE
ISN
OT
WO
RTH
WH
ILE
Emotional Status
# of
mal
es w
ho c
onsi
dere
dsu
icid
e in
the
past
yea
r
Series1

# of 80+ year old females who considered suicide in the past year vs. emotional status
0100200300400500600700800900
HA
PP
Y A
ND
INTE
RE
STE
DIN
LIF
E
SO
ME
WH
AT
UN
HA
PP
Y
SO
UN
HA
PP
YTH
AT
LIFE
ISN
OT
Emotional Status
# of
fem
ales
who
con
side
red
suic
ide
in th
e pa
st y
ear
Series1
The graph of 80+ year old men agreed with my hypothesis, as the majority of suicide inclination in the past 12 months was from those that are very unhappy in life. However, in 80+ year old women, the graph resembled the graphs of the 15-19 and 40-44 age groups. Since percent response had such an effect on the past two variables, I decided to see if there was non-response bias taking place in this sample.
% Response to self-esteem questions out of the people who considered
suicide in the past year
96.00%97.00%98.00%99.00%
100.00%101.00%
17 27 37 47 57 67 77
Age
perc
ent w
ho
resp
onde
d
Males
Femal
However, as you see by this graph, percent response in this sample is extremely high. The lowest response is almost 98%. Therefore, the data here is fairly represented by the responses of the people who took this survey. Conclusion: My hypothesis is completely wrong in this case. For the most part, emotional status has no effect on suicide inclination. There are exceptions however, as

seen with the 80+ year old males who are have the highest suicide inclination at emotional status of very unhappy. Next, the last major variable I studied is number of people who considered suicide in the past year versus their alcohol dependency. My hypothesis is that people with higher alcohol dependency or alcohol abuse will have a higher suicide inclination. I began, just as in the other studies graphing 15-19 year olds.
# of 15-19 year old males who considered suicide in the past year vs. alcohol
dependency
02000400060008000
1000012000
[0.00
,0.05
)
[0.05
,0.40
)
[0.40
,0.85
)
[0.85
,1.00
)
Alcohol Dependency Scale
# of
mal
es to
con
side
r su
icid
e in
the
past
yea
r
Series1
# of 15-19 year old females who considered suicide in the past year vs. alcohol dependency
0
5000
10000
15000
20000
25000
[0.00
,0.05
)
[0.05
,0.40
)
[0.40
,0.85
)
[0.85
,1.00
)
Alcohol Dependency Scale
# of
fem
ales
who
co
nsid
ered
sui
cide
in th
e pa
st y
ear
Series1
Again, this graph turned out not as I expected. The majority of people between the ages of 15-19 who have considered suicide in the past year do not depend on alcohol. However, when considering

this age group we must consider that it is illegal for the majority of people in this age group to drink alcohol. Therefore, we may see a large difference in the graphs of 40-44 year olds and their alcohol dependency.
# of 40-44 year old males who considered suicide in the past year vs. alcohol dependency
0
2000
4000
6000
8000
10000
12000
14000
[0.00,0.05) [0.05,0.40) [0.40,0.85) [0.85,1.00)
Alcohol Dependency Scale
# of
mal
es w
ho c
onsi
dere
d su
icid
e in
the
past
yea
r
Series1
# of 40-44 year old females who considered
suicide in the past year vs. alcohol dependency
0
5000
10000
15000
20000
25000
[0.00
,0.05
)
[0.05
,0.40
)
[0.40
,0.85
)
[0.85
,1.00
)
Alcohol Dependency Scale
# of
fem
ales
who
co
nsid
ered
sui
cide
in p
ast
year Series1
Wrong again! The alcohol dependency of the 40-44 year olds who have considered suicide in the past year is the same as the 15-19 year olds. They are not dependent. Lastly, I graphed the 80+ year olds to see if there was any variation in their data.

# of 80+ males who considered suicide in the past year vs. alcohol dependency
0200400600800
1000120014001600
[0.00,0.05) [0.05,0.40) [0.40,0.85) [0.85,1.00)
Alcohol Dependency Scale
# of
mal
es w
ho c
onsi
dere
d su
icid
e in
the
past
yea
r
Series1
# of 80+ year old females who considered
suicide in the past year vs. alcohol dependency
0200400600800
1000120014001600
[0.00,0.05) [0.05,0.40) [0.40,0.85) [0.85,1.00)
Alcohol Dependency Scale
# of
fem
ales
who
co
nsid
ered
sui
cide
in th
e pa
st y
ear
Series1
There is some variation in the 80+ age group. Instead of the majority of the suicide inclination being at the lowest alcohol dependency, the total suicide inclination is at the lowest alcohol dependency. My last chance to prove my hypothesis would be if there was a large non-response bias. So, I graphed the response rate for each age group when asked about alcohol dependency.

% Response To Questions about Alocohol Dependence of The People Who Have Considered Suicide in the Past Year
0%20%40%60%80%
100%120%
17 27 37 47 57 67 77
Age
Perc
ent r
espo
ndan
ce
Males
Females
It looks as if there is no hope for my hypothesis. The % response for the sample is extremely high, meaning the graphs and data we have are a fair representation of the people who have considered suicide in the past 12 months. Conclusion: From the people in this survey, who have considered suicide in the past 12 months, there is no real relationship between suicide inclination and alcohol dependency. Part 4: Extra Analysis if Desired After researching the previous four variables, I was not ready to finish my research. There were two other factors that I wondered if they had an effect on suicide inclination: weight and work stress. The sample population in this survey is a bit different than in the previous one. The sample in this survey has considered suicide at some point in their life. As well, this survey does not differ for sex or age. Basically, the next two variables you will see are being related to all people in Canada who took this survey that have seriously considered suicide at some point in their life. My hypothesis was that the more overweight you are the higher suicide inclination, and the more stress, the higher suicide inclination. I began by graphing suicide inclination for all ages and both sexes in their entire lifetime against weight. The weight scale was based on BMI. Underweight is a BMI of less than 20, acceptable weight is a BMI between 20 and 25 and overweight is a BMI of greater than 30.
Weight vs. Suicide Inclination
0100000200000300000400000500000600000
UN
DE
RW
EIG
HT
ACC
EPTA
BLE
WEI
GH
T
OV
ER
WEI
GH
TWeight
Suic
ide
Incl
inat
ion
(# o
f peo
ple)
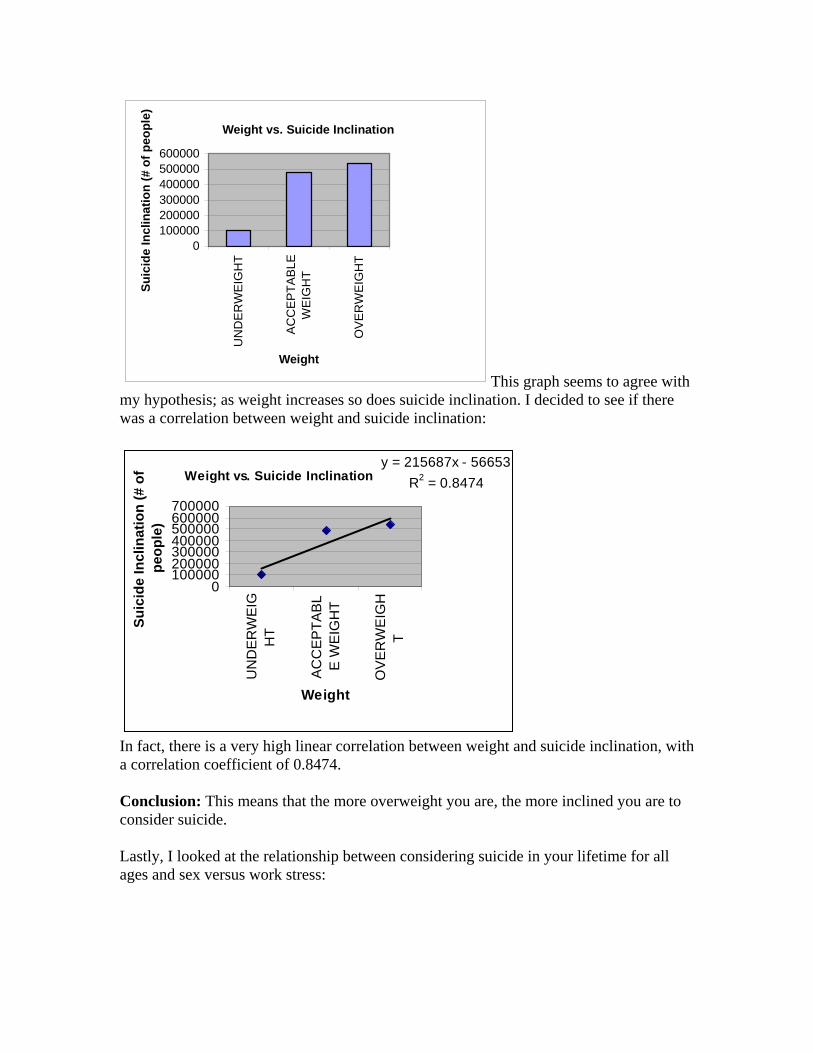
This graph seems to agree with my hypothesis; as weight increases so does suicide inclination. I decided to see if there was a correlation between weight and suicide inclination:
Weight vs. Suicide Inclinationy = 215687x - 56653
R2 = 0.8474
0100000200000300000400000500000600000700000
UN
DE
RW
EIG
HT
AC
CE
PTA
BL
E W
EIG
HT
OV
ER
WE
IGH
T
Weight
Suic
ide
Incl
inat
ion
(# o
f pe
ople
)
In fact, there is a very high linear correlation between weight and suicide inclination, with a correlation coefficient of 0.8474. Conclusion: This means that the more overweight you are, the more inclined you are to consider suicide. Lastly, I looked at the relationship between considering suicide in your lifetime for all ages and sex versus work stress:

Work Stress vs. Suicide Inclination
0
20000
40000
60000
80000
[02,
03)
[07,
08)
[12,
13)
[17,
18)
[22,
23)
[27,
28)
[32,
33)
[37,
38)
[42,
43)
Work Stress
Suic
ide
Incl
inat
ion
(# o
f pe
ople
)
The graph resembled a bell shape, so I decided to treat it as a normal distribution. This way I’d be able to calculate the percent at high work stress that has considered suicide in their lifetime. I began by looking at the mean of the data. The mean equals the sum of the frequency times the midpoint scale, divided by the sum of frequencies. Mean=18966328 901042.47 Mean= 21.05 This means that at the work stress scale point of (21,22) is the mean of the data. Next I solved for the standard deviation of the data. The standard deviation equals the square root of the sum of the points minus the mean squared, divided by the frequency. The final answer for standard deviation was approximately 5.67 The whole point in solving for the mean and standard deviation is so a normal distribution calculation can be done. Looking at the graph, there is a very small number of people who are extremely stressed out from work and have thought about suicide. Using the z-score I’m going to find out what percentage of people who are extremely stressed from work have thought about suicide in their lifetime:
Y (X>32.5) Z= 32.5-21.05
5.67 Z= 2.02

So, Z(X>2.02), which means that now I solve for the percent by using normalcdf(2.02, 100000000). This ends up equaling 0.0217 or 2.17%. This is an extremely low percentage and it means that only 2.17% of the people who have considered suicide in their lifetime are stressed out at work. Keep in mind: This survey is different from the one we used in the beginning. The question that was asked in this case was if the people have ever thought about suicide in their lifetime. Therefore, some answering this question may have seriously considered suicide 20 years ago, but is happy, healthy and not stress out about work at this point in their life. Also, this survey is not separated by age, meaning that everyone is included together in this graph. So, younger people and older people who may not work are included in the graph and may cause the low percentage of high work stress and suicide inclination. Conclusion: There is no direct relationship between and suicide inclination over a lifetime. You can see this through the graph that acts as a normal distribution, since it peaks in the middle and heads towards zero on either end. However, since it resembles a normal distribution, we can treat at as one to find percentages of people at different stress levels. Part 5: Final Conclusion After doing a research project like this, many final conclusions are made and many are left unsolved. It’s time now to look at what we’ve done in this project and see what final conclusions we can make. Suicide is highest in our world in Europe and Australia. Reasons for this include economy, poor living conditions and Europe’s extremely high gay/lesbian suicide rate. In Canada, suicide rates are the highest for males 85 years old and older and in females between the ages of 44 to 49 years old. Suicide rates are very high in both sexes for people between the ages of 24 and 44. In proportion to the number of deaths in every age group, suicide is the highest in both males and females between the ages of 15 to 24. When conducting research using a sample like this it’s very hard to make final conclusions due to the fact there is a large percent of non-response bias. To be looked at in this project, the participants of the survey must have said yes to considered suicide in the past 12 months. After that, they were asked a number of questions about their emotional status, depression etc. As you’ve seen, many people would say yes to considered suicide and would then refuse to answer any other questions. In this project, I assumed that anyone who did not respond did not respond because they did not want to speak about the question asked. Going with this thought, that would mean anyone in this who did not respond was considered “most depressed” or “has low self-esteem.” Suicide is a very personal issue and people might say yes to considering it and then refusing to explain why due to embarrassment or personal reasons. Therefore, it is hard to make conclusions when there is such a large response-bias and for reasons we are unaware of.

However, assuming that the percent of people who did not respond do fit into a category, the following conclusions can be made. Depression- does have a significant effect on suicide inclination and therefore suicide in general. The largest effect is found in women over men. More women who have considered suicide in the past 12 months are depressed. Self-Esteem- Almost 100% of people who considered suicide in the past 12 months, both males and females did not respond to the self-esteem question. This leads me to believe and conclude that self-esteem has an extremely high effect on suicide inclination and therefore suicide in general. If people had a high self-esteem, they would reply to the questions and not leave it unstated because high self-esteem is a good thing. That’s what leads me to believe that since there is such a low response rate, self-esteem has a huge effect on suicide. Emotional Status- The percent response in the emotional status questions for all ages was very high, which means that what we see in our graphs is pretty accurate. Therefore, emotional status has a varying effect on people’s suicide inclination. For example, 15-19 year old males and 40-44 year old males who are happy in life have the highest suicide inclination in the past 12 months, while 80+ year old men who have highest suicide inclination in the past 12 months are unhappy. Therefore, we can conclude that emotional status has an effect on suicide but in some ages, more than others. Alcohol Dependency- again, there was a large number of percent responses, so the data is a fair representation. For every age group and every sex, there seems to be no effect whatsoever on suicide inclination. This means that alcohol dependency is probably not a factor in suicide. Weight- weight has an effect on suicide inclination in a person’s lifetime. There is a very strong correlation between the increase in weight and the increase in suicide inclination. Work Stress- Since work-stress is not part of the same survey as the four first variables; it’s hard to compare the conclusions. When looking at work-stress I did not look at specific ages or sex and I did not look at response bias, which means I have a very general and possibly wrong conclusion from work-stress. What I conclude is that work-stress has an effect on suicide inclination but it depends on who and when in life. Based on my conclusions I tried to put together some sort of index for predicting suicide inclination. Suicide Inclination= 0.45self-esteem + 0.35depression + 0.05emotional status + 0.04work-stress + 0.1weight + 0.01alcohol dependency. This index is not perfect, especially since every age group and both sexes differ in certain areas on how much of an effect that factor has on suicide inclination. However, I feel the index is a pretty good measurement of how important each factor is. We saw that almost

everyone who was depressed had low self-esteem or didn’t respond which we’ll assume is low self-esteem. For the majority of age groups in both sexes, the depression was high and must have had an effect on suicide inclination. Emotional status varied among all the age groups and that is why it’s about 5% of the index. Work stress also seemed to have a peak at one point, which means it has an effect but not a very large one. We saw that weight has a linear correlation to suicide inclination and therefore is about 10% important to the suicide inclination. Lastly, alcohol dependency had little to no effect on suicide inclination. With that, I am finished my research and my conclusion. If you know anyone who shows any of the signs of depression, low self-esteem or any other suicide related factors, help them before it’s to late. There are many places you can go for help. Check on the Internet, talk to guidance counselors, doctors, anyone that can help. Suicide is a very serious issue in Canada and all over the world and we need to do what we can to help those people that feel there is no other way out. I hope you learned something from this research assignment.

Bibliography
• Statistics Canada’s Canadian Community Health Survey (2001) • Suicide in Canada - www.fathersforlife.org/health/cansuic.htm • Suicide Statistics - www.befrienders.org/suicide/statistics.htm • A Report on Mental Illness in Canada-
www.mooddisorderscanada.ca/report/english/chapter7/sbstats.htm • World Health Organization “Suicide Prevention” -
www5.who.int/mental_health/main.cfm?p=0000000021

MDM4U Research Project A Closer Look at Canadian
Suicide
For: Mr. McLeish By: Jessica Laks
Date: May 15th 2003