
Md. Mizanur Rahman
65
Md. Mizanur Rahman MEng(Sweden), PhD (Finland), CEng Chartered Energy Engineer (EI, UK) Certified Energy Manager School of Mechanical Engineering Universiti Teknologi Malaysia Email: [email protected]
Transcript of Md. Mizanur Rahman
Md. Mizanur Rahman MEng(Sweden), PhD (Finland), CEng Chartered Energy Engineer (EI, UK) Certified Energy Manager School of Mechanical Engineering Universiti Teknologi Malaysia Email: [email protected]
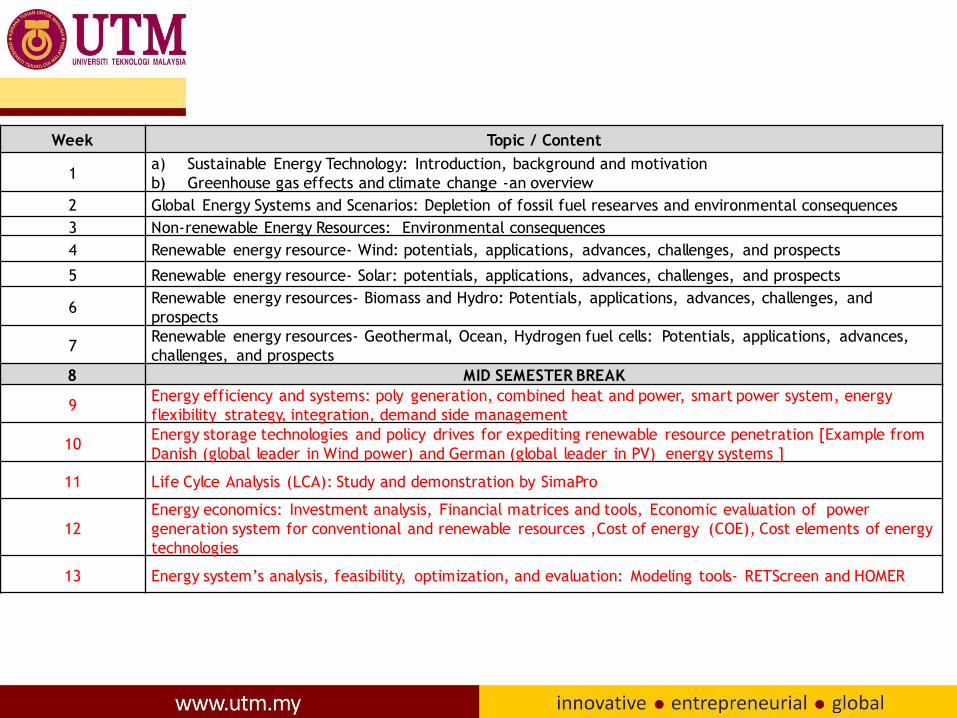
Week Topic / Content
1 a) Sustainable Energy Technology: Introduction, background and motivation
b) Greenhouse gas effects and climate change -an overview
2 Global Energy Systems and Scenarios: Depletion of fossil fuel researves and environmental consequences
3 Non-renewable Energy Resources: Environmental consequences
4 Renewable energy resource- Wind: potentials, applications, advances, challenges, and prospects
5 Renewable energy resource- Solar: potentials, applications, advances, challenges, and prospects
6 Renewable energy resources- Biomass and Hydro: Potentials, applications, advances, challenges, and
prospects
7 Renewable energy resources- Geothermal, Ocean, Hydrogen fuel cells: Potentials, applications, advances,
challenges, and prospects
8 MID SEMESTER BREAK
9 Energy efficiency and systems: poly generation, combined heat and power, smart power system, energy
flexibility strategy, integration, demand side management
10 Energy storage technologies and policy drives for expediting renewable resource penetration [Example from
Danish (global leader in Wind power) and German (global leader in PV) energy systems ]
11 Life Cylce Analysis (LCA): Study and demonstration by SimaPro
12
Energy economics: Investment analysis, Financial matrices and tools, Economic evaluation of power
generation system for conventional and renewable resources ,Cost of energy (COE), Cost elements of energy
technologies
13 Energy system’s analysis, feasibility, optimization, and evaluation: Modeling tools- RETScreen and HOMER

• Energy technology is a multidisciplinary branch of engineering connected with several other disciplines (e.g. electrical, chemical, economics, and social science etc.)
• Deals with efficient and safe
– Extraction
– Conversion and
– Use of energy
3
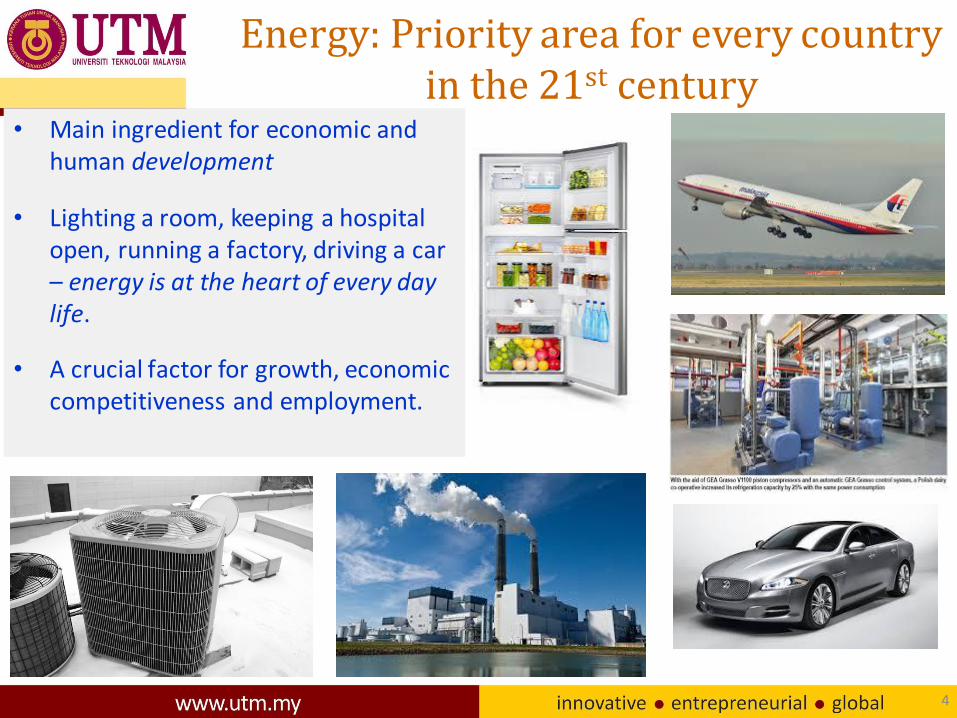
Energy: Priority area for every country in the 21st century
• Main ingredient for economic and human development
• Lighting a room, keeping a hospital open, running a factory, driving a car – energy is at the heart of every day life.
• A crucial factor for growth, economic competitiveness and employment.
4

Serving of energy (either as a product or service) is complex, because it- • Involves several types of output such as thermal, mechanical,
electrical, chemical energy
• Interacts with input from human operators and with other systems (e.g. networks, fuels, markets)
• These inputs are distributed over a wide geographic expanse
• Widespread infrastructures and equipment
• Connected with several physical and non-physical entities
Energy as a commodity
5
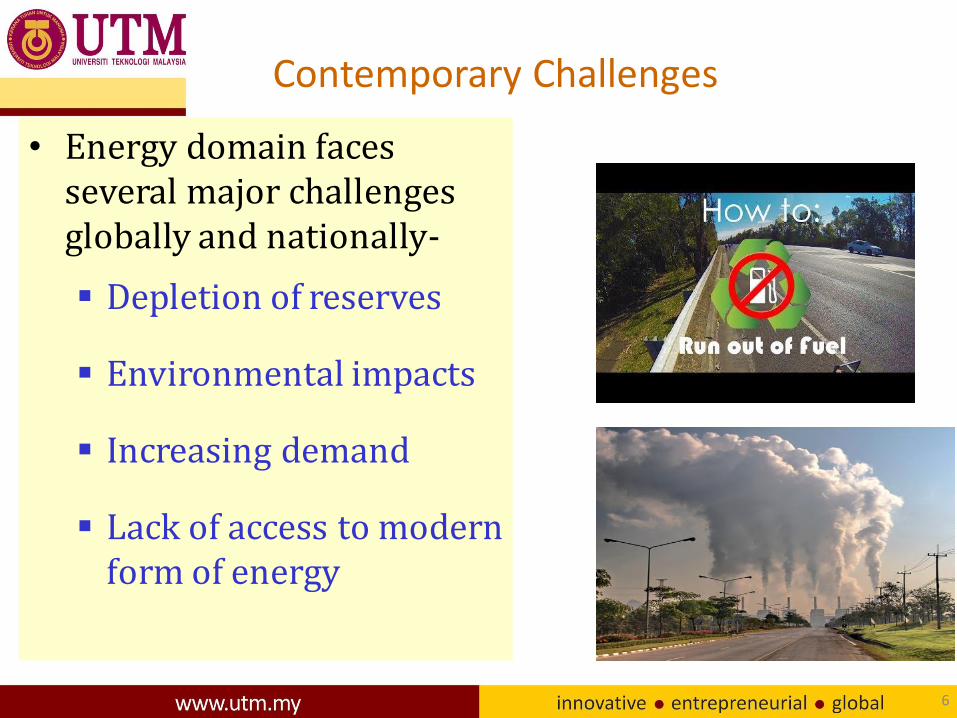
• Energy domain faces several major challenges globally and nationally-
Depletion of reserves
Environmental impacts
Increasing demand
Lack of access to modern form of energy
6
Contemporary Challenges
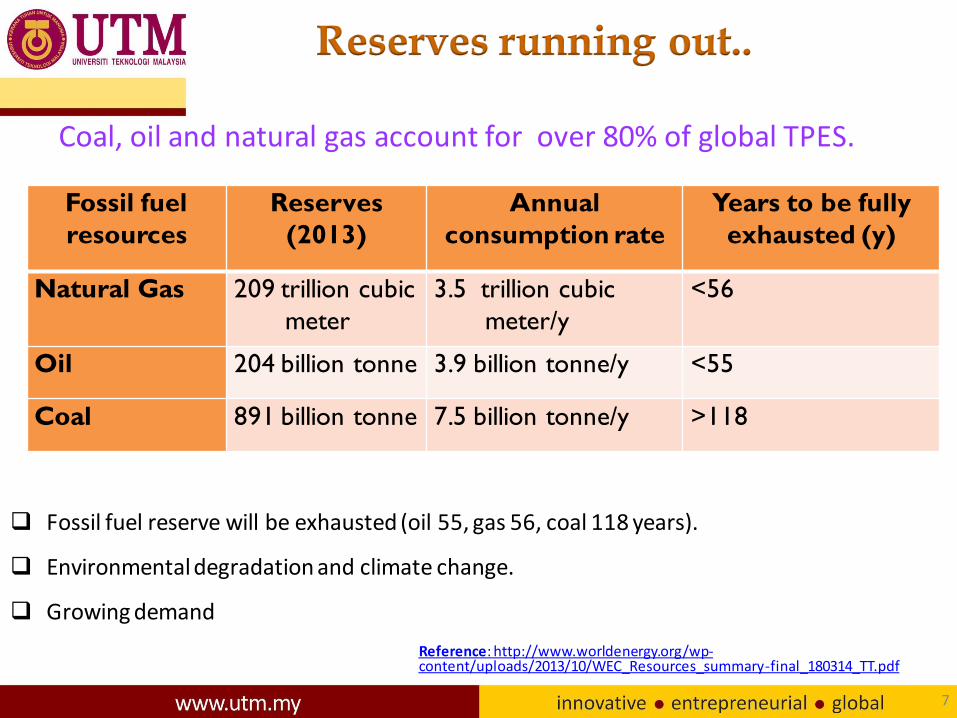
Reserves running out..
Fossil fuel
resources Reserves
(2013) Annual
consumption rate Years to be fully
exhausted (y)
Natural Gas 209 trillion cubic
meter 3.5 trillion cubic
meter/y <56
Oil 204 billion tonne 3.9 billion tonne/y <55
Coal 891 billion tonne 7.5 billion tonne/y >118
7
Reference: http://www.worldenergy.org/wp-content/uploads/2013/10/WEC_Resources_summary-final_180314_TT.pdf
Coal, oil and natural gas account for over 80% of global TPES.
Fossil fuel reserve will be exhausted (oil 55, gas 56, coal 118 years).
Environmental degradation and climate change.
Growing demand

8
2010: Equivalent to 1.5 earth planet
2030: Equivalent to 2.0 earth planets
2050: >2.5 equivalent earth planets
This means, in 2010 the earth needs 1.5 yr. to regenarate the resources what we used in a year.
Source: http://www.footprintnetwork.org
Resource footprints
9
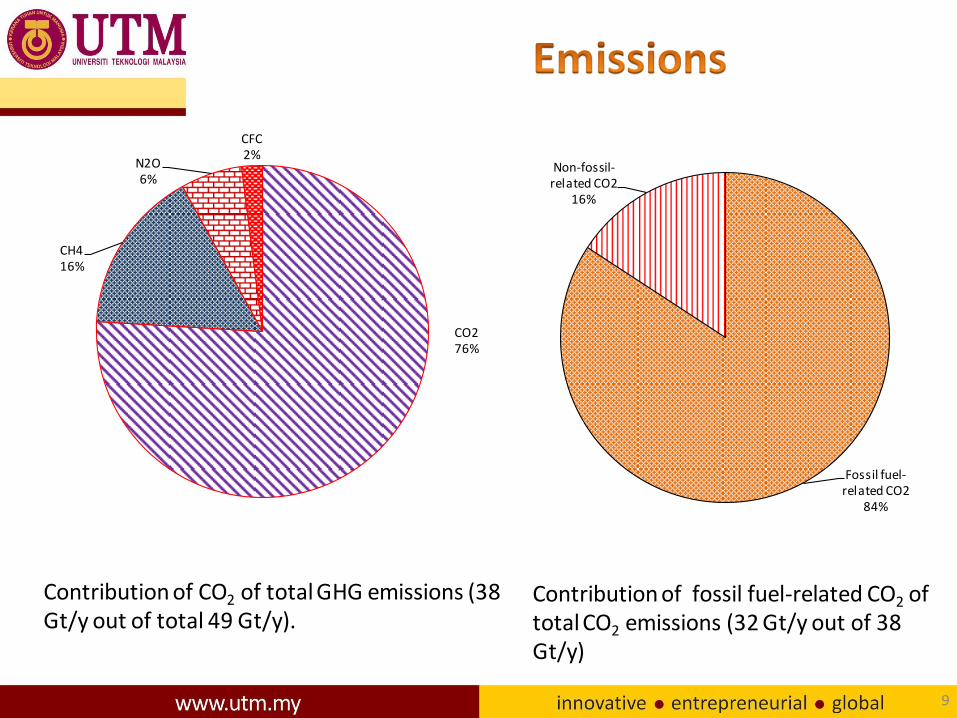
Fossil fuel-related CO2
84%
Non-fossil-related CO2
16%
CO2 76%
CH4 16%
N2O 6%
CFC 2%
Contribution of CO2 of total GHG emissions (38 Gt/y out of total 49 Gt/y).
Contribution of fossil fuel-related CO2 of total CO2 emissions (32 Gt/y out of 38 Gt/y)

Energy sector (exploration,
transformation and use)
CO2 emissions
Global warming
Climate change
Drought, cyclone, tropical storms, biodiversity loss, sea level rise, Landscape changing, sudden floods
10
Causes
Consequences
Water pollution Air pollution Soil pollution Acid rain
Noise pollution
Sight pollution Land degradation
Ocean system collapse-oil spills,
Run off chemicals, acid rain
Flora and fauna loss
Nuclear radioactive pollution
Wastes
Agriculture Deforestation, Land use change, Rice cultivation, Livestock farming Chemical fertilizers Industry Chemical and process industry Residential sector Energy use Commerce Energy use
CO2, CH4, N2O, O3, CFC emissions (35%)
11

12
World energy use is constantly growing

Region
Population without electricity millions
Traditional use of biomass for cooking Share of population %
Africa 600 67 Sub-Saharan Africa 599 79
Developing Asia 615 51 India 306 66 Rest of developing Asia 309
Latin America 24 15 Middle East 19 4 OECD 1 World 1 258 38
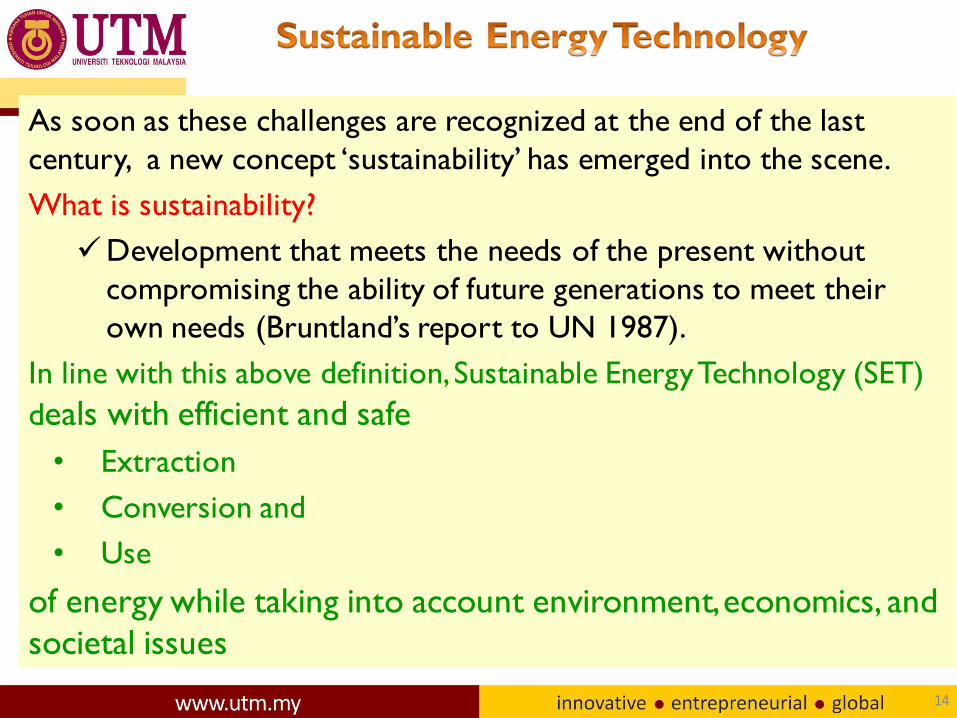
As soon as these challenges are recognized at the end of the last
century, a new concept ‘sustainability’ has emerged into the scene.
What is sustainability?
Development that meets the needs of the present without
compromising the ability of future generations to meet their
own needs (Bruntland’s report to UN 1987).
In line with this above definition, Sustainable Energy Technology (SET)
deals with efficient and safe
• Extraction
• Conversion and
• Use
of energy while taking into account environment, economics, and
societal issues
14

15
Sustainable Energy Technology (SET)
Energy efficiency and system
Renewable and new energy technologies
Energy efficiency in technology
Energy system modeling Energy economics
LCA Energy audit
EIA Energy management Smart power system
Project evaluation Carbon capture and
storage (CCS)
Renewable energy sources
Renewable energy economics
Energy storage Micro power system
Microturbine Waste to energy
Biochar Distributed generation
Technology diffusion Progress ratio/learning rate CHP Poly/tri generation Fuel cell /H2
Electric vehicle Energy system integration District energy system

• Energy efficiency
– Efficiency in technologies, economics, policy, management, planning etc.
• Utilization of alternative resources.
– Technology, modeling, policy, economics, and systems
16
Major Drivers

Challenges and their complexity require multidisciplinary approach by inter-linking
Cross disciplinary knowledge
Socioeconomic aspects and
Environmental limits
Multiple goals Economically feasible
Environmentally bearable
Socially acceptable
17
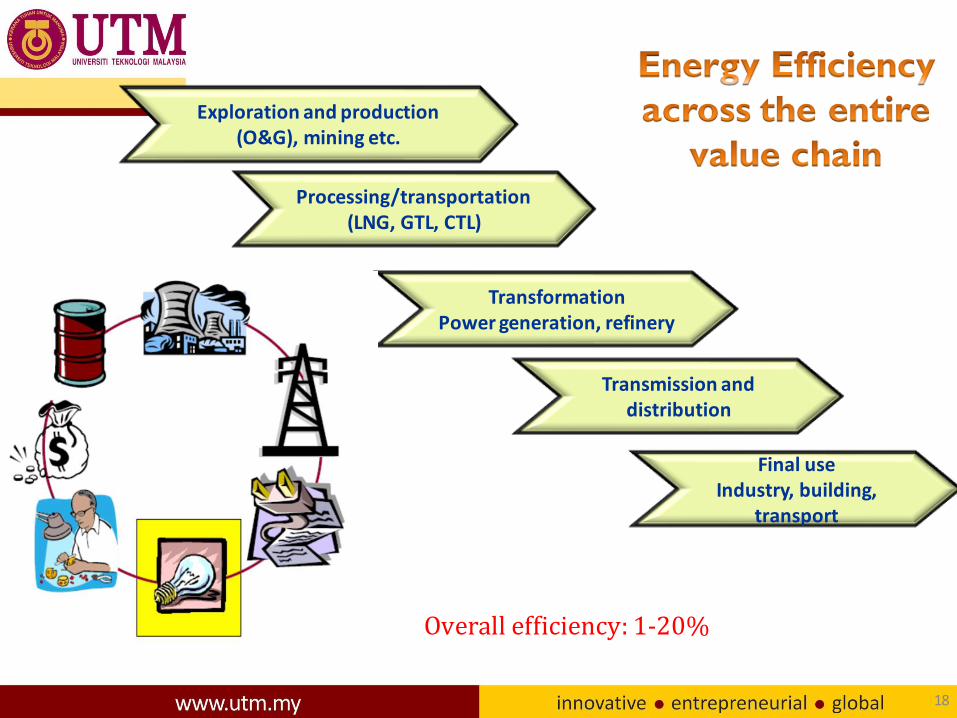
18
Exploration and production (O&G), mining etc.
Processing/transportation (LNG, GTL, CTL)
Transformation Power generation, refinery
Transmission and distribution
Final use Industry, building,
transport
Overall efficiency: 1-20%

19

Power plant
• Global average efficiency of coal fired plant is approximately 34%.
• Whereas state-of the art efficiencies for coal power plant is above 46%
20

• About 50% of global electricity consumption comes from electric motors
• Potential by increasing efficiency: 20-30%
• Where do the efficiency come
– High efficient motors, variable speed drives, application part
21

• Pumping accounts for about 15 % of global industrial electricity use .
• 10-50% improvement of energy efficiency possible through:
reducing flows through VSDs (variable speed drives)
reducing flows through effective time control
improving gears and transmission
22

• Globally, around 20% of the total electricity is consumed by the lighting sector.
• Lighting has 70% energy saving potentials
23

Example 1: Poly generation concept • Conventional thermal power generation is extremely wasteful
process.
• Efficiencies in the range 30–47%
• Over 50% of fuel value is wasted
• Heat rejected to surrounding.
• Liberates huge CO2
24

The Carnot principle shows the theoretical maximum thermal efficiency of any heat engine cycle For example, if the maximum reachable temperature in a cycle is 1450 K and the cooling water minimum temperature is 285 K
Theoretical maximum efficiency limit of a heat engine (e.g. turbine)
Poly generation concept
25

• In fact the maximum Carnot efficiency cannot be achieved -irreversibility in the process.
• Energy being lost in the form of waste heat.
• Waste heat is recovered and make use of it in poly generation process.
Poly generation concept
26

27
Integrated cogeneration and district Energy Network
Poly generation concept
Poly-generation
CHP

• Small ‘micro’ installations serve the needs of a single building (electricity and heat)
• Large systems to serve electricity and heat to even whole towns.
• Micro-CHP systems utilizing internal combustion engines, micro turbine etc.
• Gas turbines for larger installations
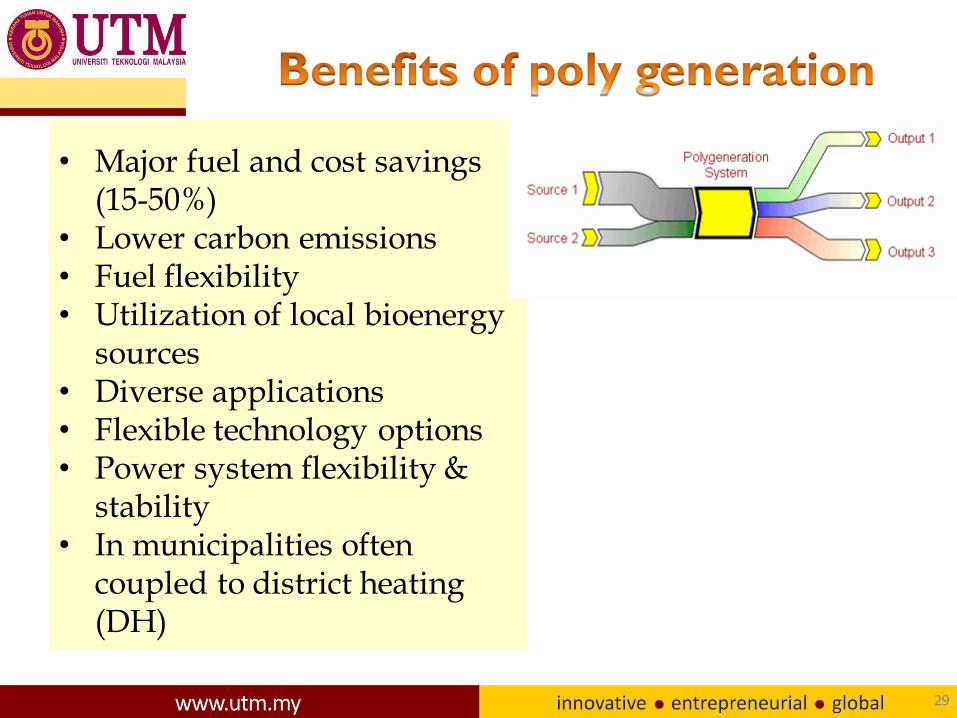
• Major fuel and cost savings (15-50%)
• Lower carbon emissions • Fuel flexibility • Utilization of local bioenergy
sources • Diverse applications • Flexible technology options • Power system flexibility &
stability • In municipalities often
coupled to district heating (DH)
29
30

31

Example 2: Energy management
• Effective energy management in industry will
increase energy efficiency significantly.
• Efficient building design can reduce
heating/cooling loss by 25 to 50% by- Passive design
High-reflectivity
building materials
Utilizing thermal
mass
32

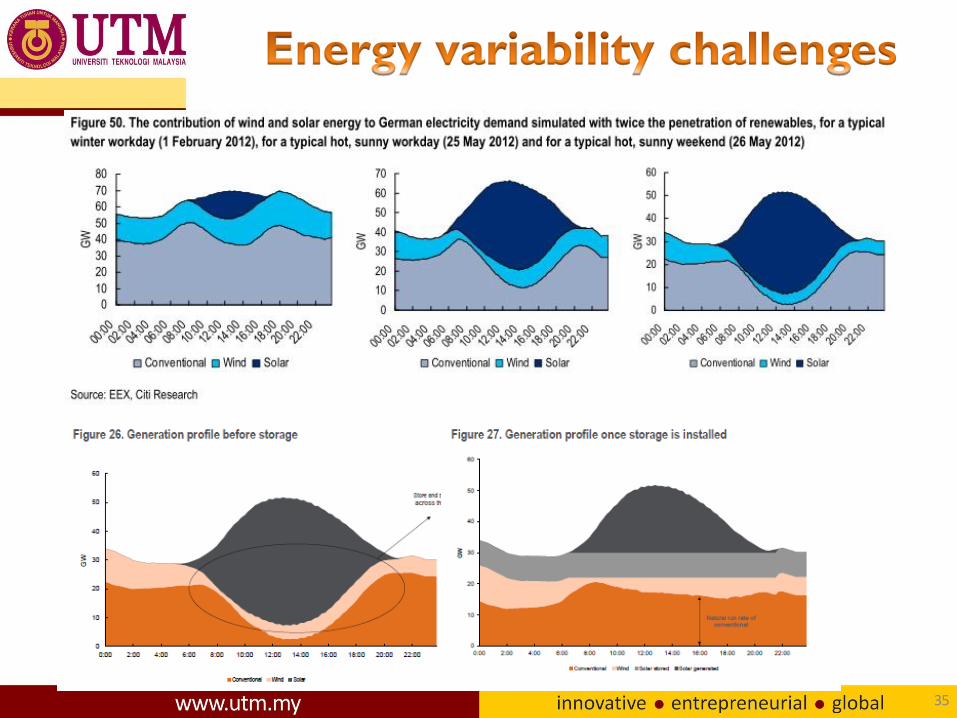
Flexibility appears as an essential element for sustainable energy

Energy variability challenges
34
• Demands are variable, f(x,y,t)
• Energy sources are transient, f(x,y,t)
• Energy demand and supply matching requirement
• On spatial and time (x, y, t) variations
• Critical for the electric system
• New energy technologies and renewable resources integration
35
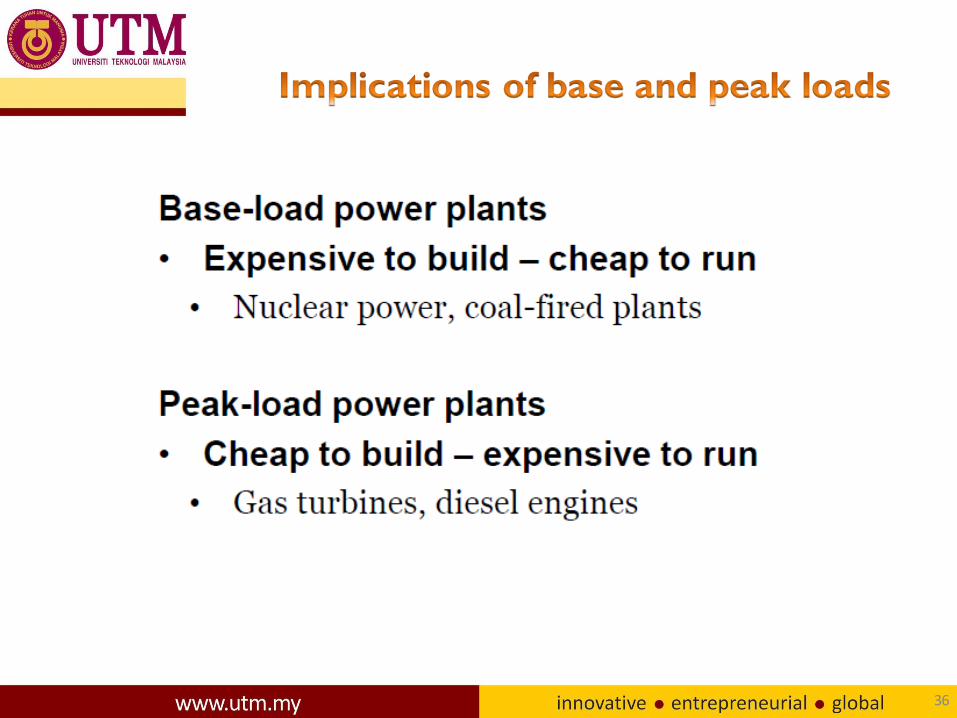
36
37
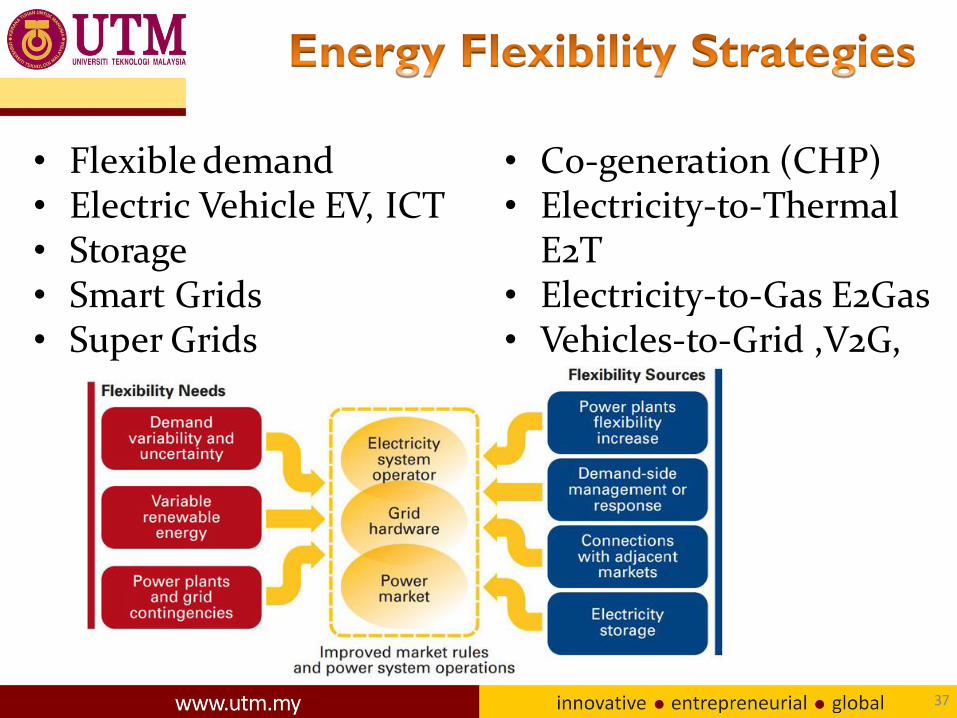
• Flexible demand • Electric Vehicle EV, ICT • Storage • Smart Grids • Super Grids
• Co-generation (CHP) • Electricity-to-Thermal
E2T • Electricity-to-Gas E2Gas • Vehicles-to-Grid ,V2G,
38
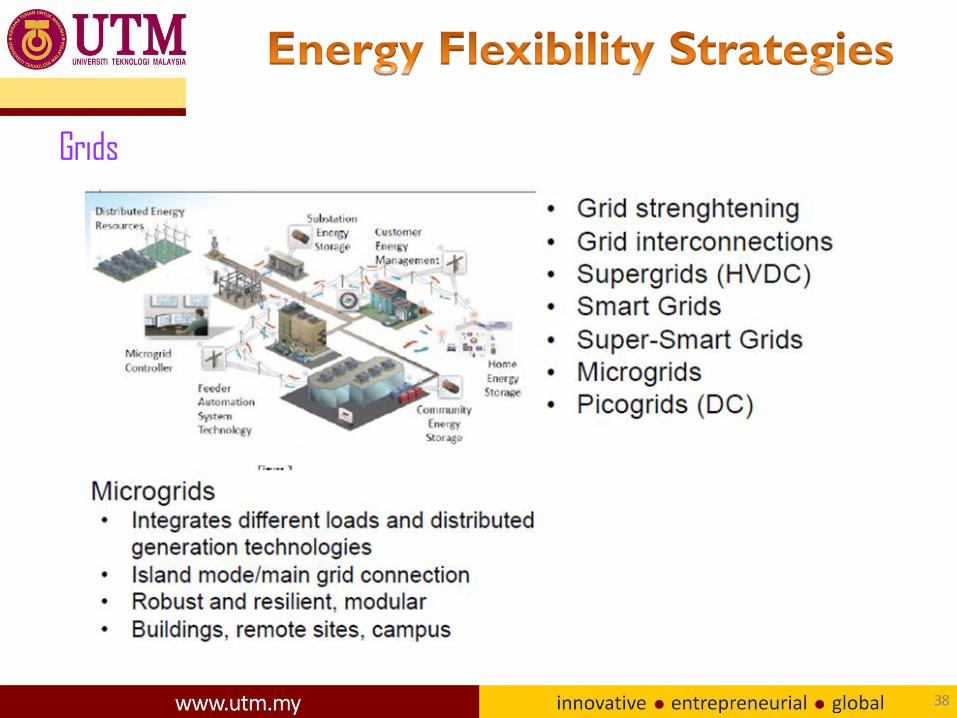
Grids

• Integrate intermittent
renewable resources
• Storage options
• Smart meters
• EV2G
• Plug-in EV
• Bidirectional power and
information flow
• Real time coordinating
39

• Supergrids serve as large transmission networks between wide geographical areas.
• Use of high-voltage direct current (HVDC) due to their very low losses specially across oceans.
• Example: ongoing supergrid linking renewable resources from North Africa and Europe
40
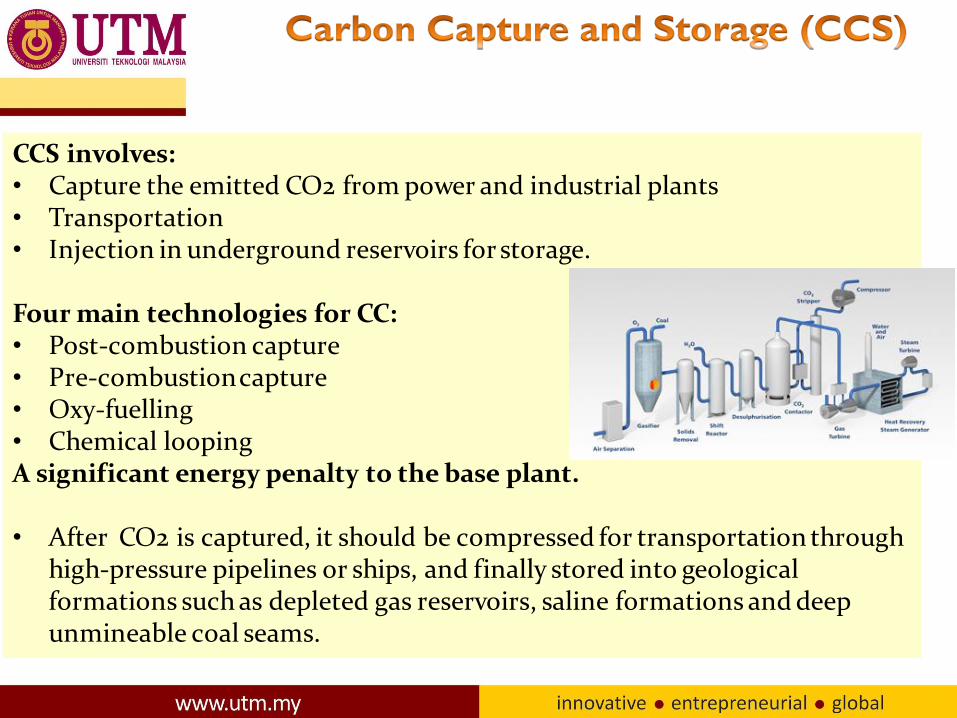
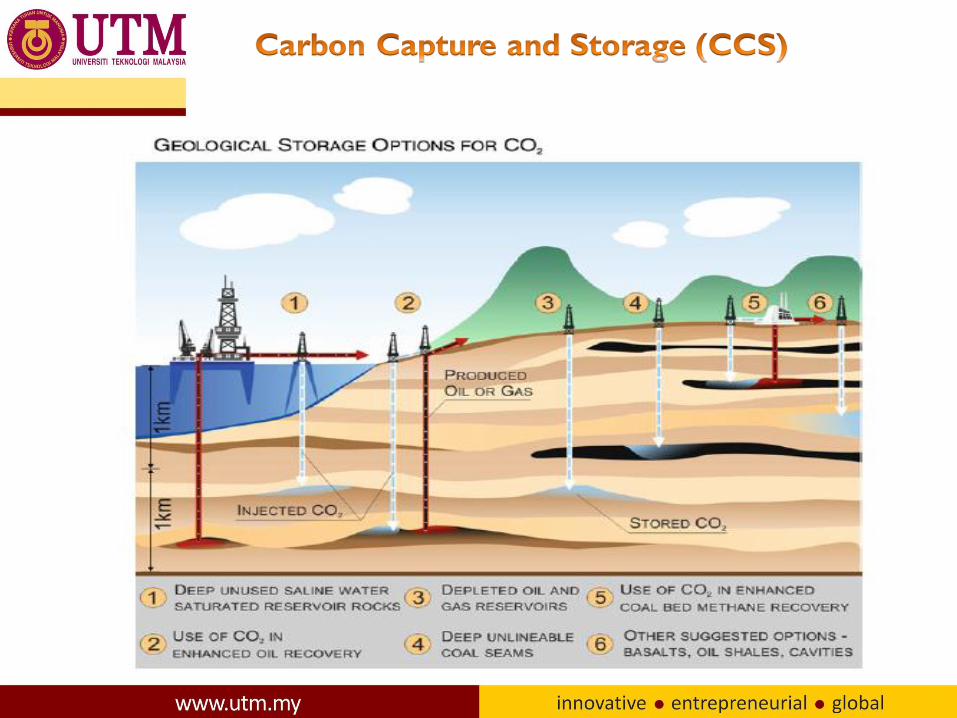
CCS involves: • Capture the emitted CO2 from power and industrial plants • Transportation • Injection in underground reservoirs for storage. Four main technologies for CC: • Post-combustion capture • Pre-combustion capture • Oxy-fuelling • Chemical looping A significant energy penalty to the base plant. • After CO2 is captured, it should be compressed for transportation through
high-pressure pipelines or ships, and finally stored into geological formations such as depleted gas reservoirs, saline formations and deep unmineable coal seams.

The 30-MW power plant was commissioned in Schwarze Pumpe in September 2008 by the company Vattenfall and is intended to serve as a test to be applied in commercial-size CCS power plants (250–350 MW).

Scheme of a BIGCC plant to produce heat and electricity from the biomass used in an ethanol production plant
IGCC is a technology that uses a gasifier to turn coal or biomass into gas and to electricity • Produce syngas (CO+H2)+
impurities (SO2, PM, NOX etc.. • Remove impurities before
combustion
• Biomass contains alkali materials k, Na
• Form KCl, KSO4 • Deposition and
corrosion • Heat xchanger
lost
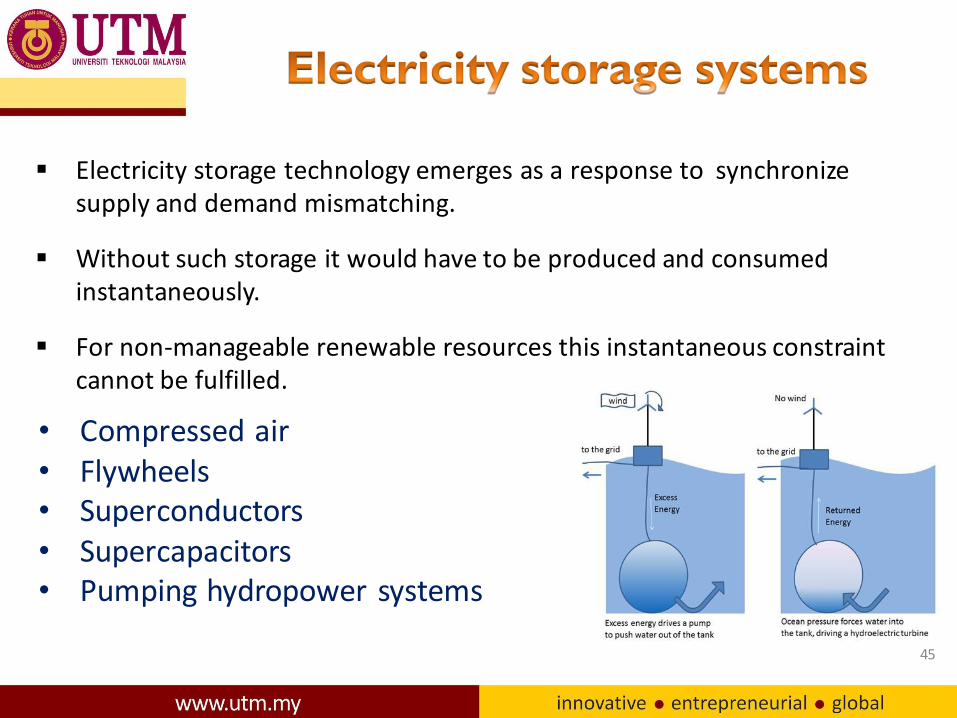
Electricity storage technology emerges as a response to synchronize supply and demand mismatching.
Without such storage it would have to be produced and consumed instantaneously.
For non-manageable renewable resources this instantaneous constraint cannot be fulfilled.
• Compressed air • Flywheels • Superconductors • Supercapacitors • Pumping hydropower systems
45

46

47

48
49

50

Inefficiency High operational
costs High losses (10-40%) Lack of quality Lack to freedom of
choice
• State monopoly • Highly subsidize prices • Distortion of demands • Private generation to a small
extent • Government control
51

Electricity market reforms
Indirect benefits
Emissions and emission trading
Green certificates
Environmental Impact assessment
52
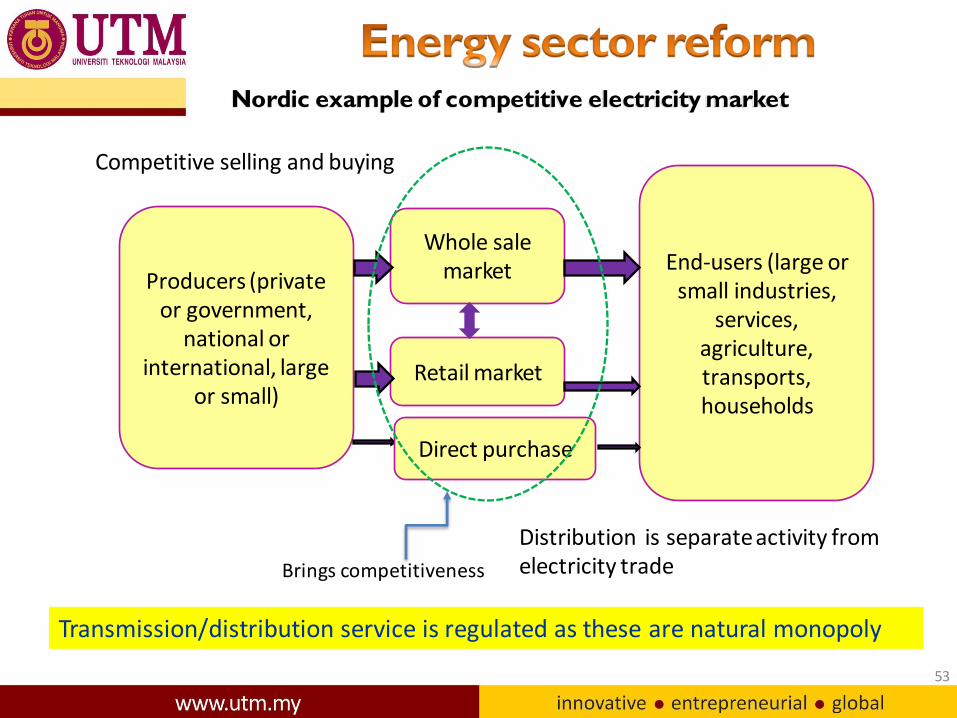
Nordic example of competitive electricity market
53
Producers (private or government,
national or international, large
or small)
Whole sale market End-users (large or
small industries, services,
agriculture, transports, households
Retail market
Brings competitiveness
Direct purchase
Competitive selling and buying
Transmission/distribution service is regulated as these are natural monopoly
Distribution is separate activity from electricity trade
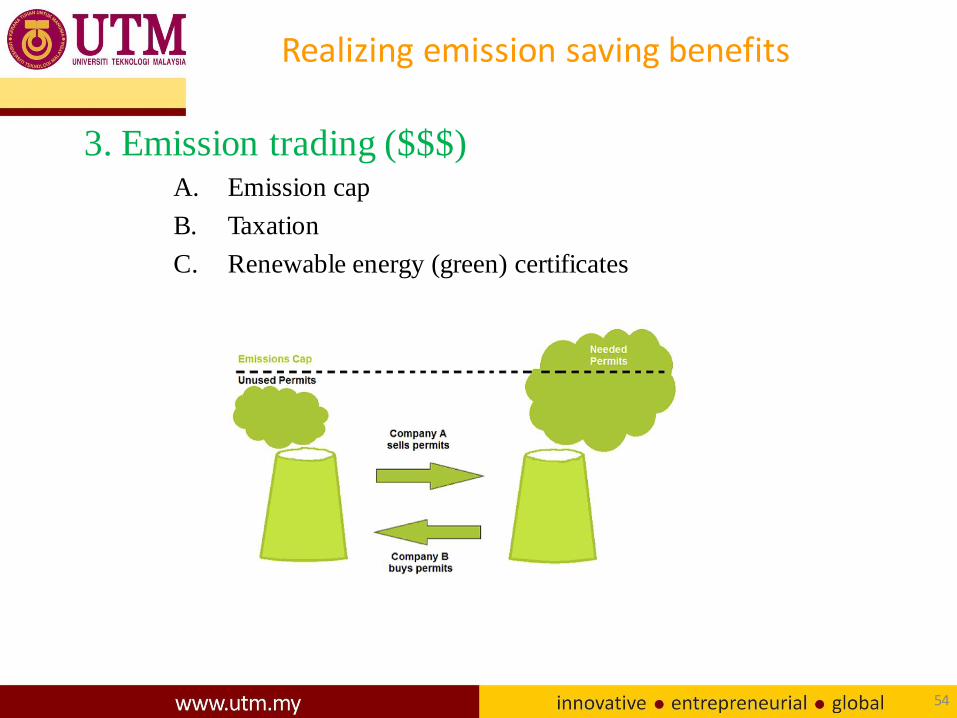
3. Emission trading ($$$) A. Emission cap
B. Taxation
C. Renewable energy (green) certificates
54
Realizing emission saving benefits
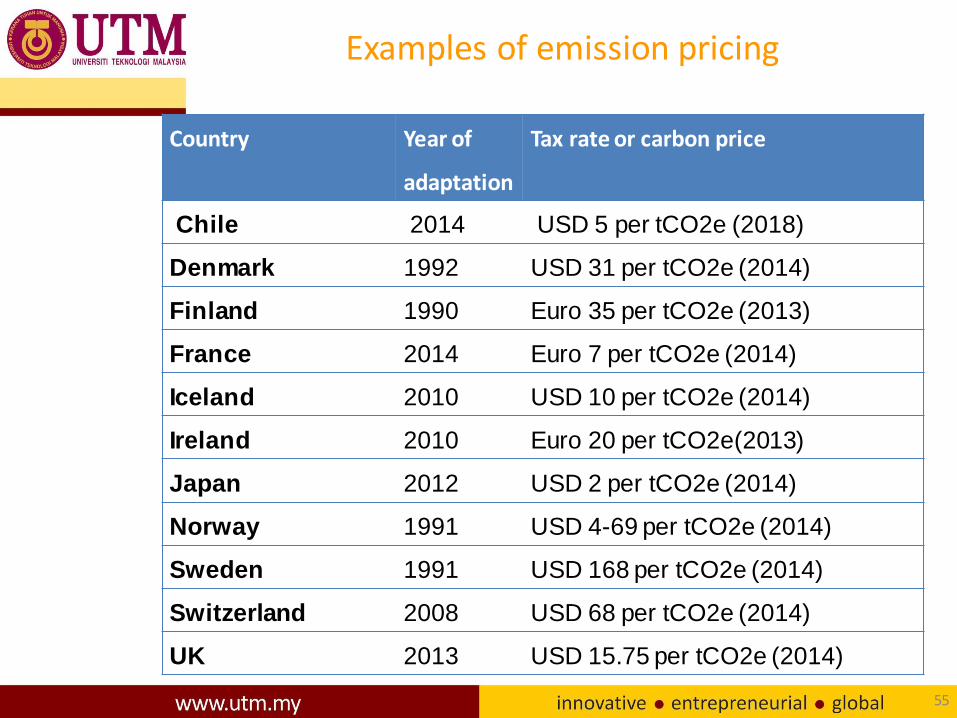
Country Year of
adaptation
Tax rate or carbon price
Chile 2014 USD 5 per tCO2e (2018)
Denmark 1992 USD 31 per tCO2e (2014)
Finland 1990 Euro 35 per tCO2e (2013)
France 2014 Euro 7 per tCO2e (2014)
Iceland 2010 USD 10 per tCO2e (2014)
Ireland 2010 Euro 20 per tCO2e(2013)
Japan 2012 USD 2 per tCO2e (2014)
Norway 1991 USD 4-69 per tCO2e (2014)
Sweden 1991 USD 168 per tCO2e (2014)
Switzerland 2008 USD 68 per tCO2e (2014)
UK 2013 USD 15.75 per tCO2e (2014)
55
Examples of emission pricing

Life cycle analysis for 1 kWh of electricity generation from natural gas
Four (4) m3 NG burnt in power plant
Refinery, processing
Extraction mining, drilling
1 kWh electricity
Dismantling and disposal
Power plant: materials and transport
Emissions
Wastes
Power plant construction
Materials and transport
Electricity T&D
Electricity use
Four (4) m3 NG storage and supply to the power plant
System boundary ฿ 1D: production and transport ฿ 2D: production transport and all
processes during LC ฿ 3D: production, transport, all
processes and capital goods during LC
Direct emission
Natural gas (NG) well
56

• Designing a energy system involves high variations in resources
availability, uncertainty in cost parameters, and transient
nature in supply and demands.
• Requires optimal system-
Simulation: Determine all feasible configurations.
Optimization: Configurations at lowest life-cycle cost, less GHGs etc.
Sensitivity analysis: Effects of uncertainty of sensitivity variables.
57

• Enormous potential
• Policy barriers
• Indirect benefits
• High startup cost
• Low demonstrations
• Market barriers
58

Implicit and explicit subsidies for fossil fuels and nuclear power
Distort level playing field
Fuel price risk ignored
Unfavorable power pricing rules (feed-in-tariffs)
Environmental externalities
59

• Determining the economic value of
renewable energy by accounting its all the
environmental, energy security, price
stability, climate saving etc. benefits.
60
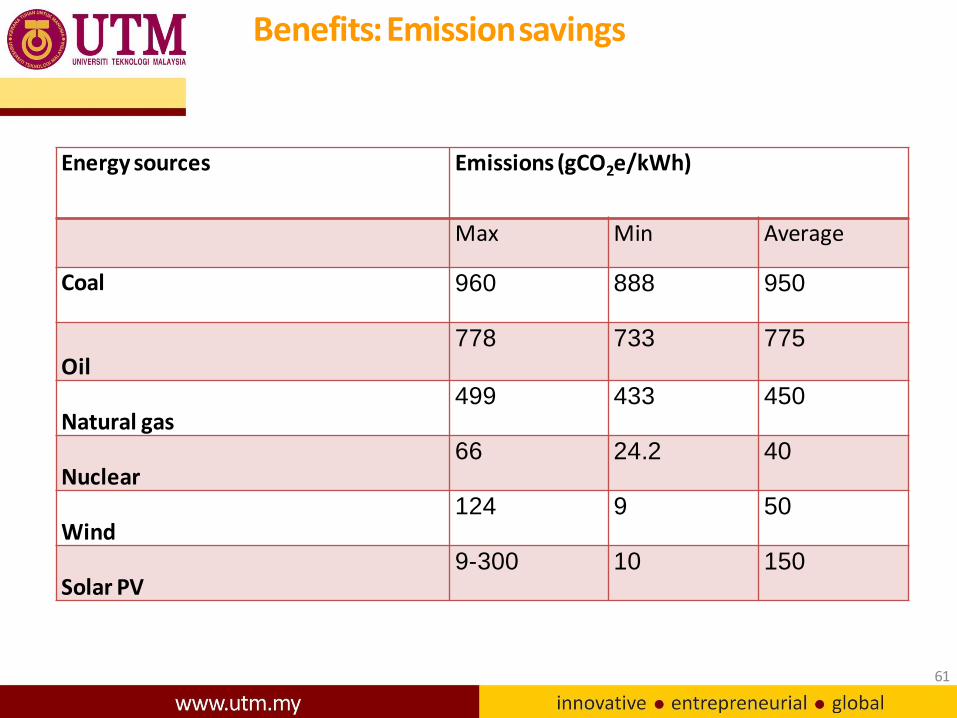
Benefits: Emission savings
Energy sources Emissions (gCO2e/kWh)
Max Min Average
Coal 960 888 950
Oil 778 733 775
Natural gas 499 433 450
Nuclear 66 24.2 40
Wind 124 9 50
Solar PV 9-300 10 150
61

The learning rate for PV modules in the period 1976-1992 was 18% (100-82), meaning that price is reduced by 18% of its previous level after a doubling of cumulative sales
Learning rate (%) = 100-progress ratio
62

• Price-setting policies
Electricity Feed-in Laws
Renewable Energy
Portfolio Standards (RPS)
Renewable energy (green)
certificates
63
Emission reduction
policies
Emissions cap
Greenhouse gas
trading
Enabling elements
Smart grid
Net metering
Real time pricing
Storage

1. The 1st law of thermodynamics: energy can neither be created nor destroyed.
– Why worry about the depletion of fossil fuel reserves?
64
2. Less than 0.1% of solar energy is enough for the world’s total demand
– What are the barriers?
3. Germany achieved 74% peak generation (electricity) from renewable sources (wind and solar)

20th century:
◘ Scientists discovered
◘ Engineers created
◘ Society inhales
21st Century: Technology, Society, and environment
are the:
◘ Integral part of the
solutions
◘ Totally interdependent
◘ Blending together in new
ways
Engineering approaches to tackle 21st Century challenges
65
Conclusions


![Dhaka Puran by Mizanur Rahman [219 Pages, 5 Mb, Amarboi.com]](https://static.fdocuments.net/doc/165x107/55cf9a1e550346d033a08c23/dhaka-puran-by-mizanur-rahman-219-pages-5-mb-amarboicom.jpg)