
MCM; An Inexpensive, Simple to Use Model Based Condition ... · MCM; An Inexpensive, Simple to Use...
12
MCM; An Inexpensive, Simple to Use Model Based Condition Monitoring Technology Christo van der Walt Ahmet Duyar, Ekrem Cestepe Engineering Dynamics, South Africa Artesis A.Ş., Turkey [email protected] [email protected] Abstract This paper presents an award-winning product, Motor Condition Monitor (MCM), for predictive maintenance of three phase systems, including electric motors, generators, transformers, and the equipment or process driven by them. MCM measures only voltages and currents. It has the ability of maintenance planning by detecting impending mechanical and electrical failures at the early stages of fault development through continuous monitoring. MCM also provides the user with the diagnostic information. The primary function of MCM is to provide early warning of progressively deteriorating machine and process conditions to prevent unplanned downtime, and improve productivity. The patented MCM core technology stems from a decade-long research effort, which previously has been applied in the U.S. to the Space Shuttle Main Engine, helicopter engines and gas turbines. MCM is an inexpensive device yielding accurate maintenance decision information that can be used by low or semi-skilled personnel. Therefore, it eliminates the shortcomings of both vibration and current signature analysis systems. Introduction In today’s competetive business environment and low profit margins, manufacturers are faced with the growing production demands while cutting the cost of manufacturing. One pervasive cost that drags down productivity is the unplanned equipment and manufacturing process downtime [1]. Unexpected failure of processes and machinery in industrial environments is always undesirable. When these processes are critical they may lead to lost production and costly repairs. Condition monitoring is used to obtain early warning of impending equipment failure to prevent costly downtime and damage to process equipment. The basic idea behind condition monitoring is to analyze data gathered on the equipment characteristics in sufficient time so as to minimize failures as well as unscheduled interruptions in production. An increasingly widespread trend is the integration of continuous condition monitoring with predictive maintenance capabilities to factory automation systems. There are two major areas of condition monitoring – vibration and corrosion. Vibration analysis is the larger (85%) segment of the two by a wide margin. Other technologies include infrared (IR) thermographs to detect temperature changes in bearings and shafts; tribology or analysis of the lubricating oil in a machine; ultrasonic analysis of bearing wear, to name a few. A major application of condition monitoring is that of electric motor and motor driven systems such as pumps, compressors, fans, presses etc. Such equipment is ubiquitous throughout industry with a wide range of motor power ranging from a few watts up to a few mega watts. Vibration analysis consists of mounting sensors on the motor and measuring the vibration energy spectrum using an external data acquisition and analysis unit, typically a pc or hand-held device. Acceleration, velocity, and displacement are some of the most commonly measured quantities in vibration analysis. The basic idea is that a mechanical fault developing within the system will be exhibited as a change in the vibration energy in specific frequency ranges. A trained engineer can detect these changes by monitoring the output from the unit. In a typical case, the data obtained periodically over an extended time period (usually a year or more) would be plotted to observe any trends indicative of possible failure. The vibration based condition monitoring can be expensive, difficult to use and the results difficult to interpret for the following reasons: Cost; both the sensors and their associated electronics are expensive. Ease of installation; the mounting position of the accelerometers on the motor has to be carefully chosen for maximum sensitivity. Also mounting sensors can be a problem in inaccessible places.
Transcript of MCM; An Inexpensive, Simple to Use Model Based Condition ... · MCM; An Inexpensive, Simple to Use...
MCM; An Inexpensive, Simple to Use Model Based Condition Monitoring Technology
Christo van der Walt Ahmet Duyar, Ekrem CestepeEngineering Dynamics, South Africa Artesis A.Ş., [email protected] [email protected]
Abstract
This paper presents an award-winning product, Motor Condition Monitor (MCM), for predictivemaintenance of three phase systems, including electric motors, generators, transformers, and theequipment or process driven by them. MCM measures only voltages and currents. It has the ability ofmaintenance planning by detecting impending mechanical and electrical failures at the early stages offault development through continuous monitoring. MCM also provides the user with the diagnosticinformation. The primary function of MCM is to provide early warning of progressively deterioratingmachine and process conditions to prevent unplanned downtime, and improve productivity. Thepatented MCM core technology stems from a decade-long research effort, which previously has beenapplied in the U.S. to the Space Shuttle Main Engine, helicopter engines and gas turbines. MCM is aninexpensive device yielding accurate maintenance decision information that can be used by low orsemi-skilled personnel. Therefore, it eliminates the shortcomings of both vibration and currentsignature analysis systems.
Introduction
In today’s competetive business environment and low profit margins, manufacturers are faced withthe growing production demands while cutting the cost of manufacturing. One pervasive cost thatdrags down productivity is the unplanned equipment and manufacturing process downtime [1].Unexpected failure of processes and machinery in industrial environments is always undesirable.When these processes are critical they may lead to lost production and costly repairs. Conditionmonitoring is used to obtain early warning of impending equipment failure to prevent costly downtimeand damage to process equipment. The basic idea behind condition monitoring is to analyze datagathered on the equipment characteristics in sufficient time so as to minimize failures as well asunscheduled interruptions in production. An increasingly widespread trend is the integration ofcontinuous condition monitoring with predictive maintenance capabilities to factory automationsystems.
There are two major areas of condition monitoring – vibration and corrosion. Vibration analysis is thelarger (85%) segment of the two by a wide margin. Other technologies include infrared (IR)thermographs to detect temperature changes in bearings and shafts; tribology or analysis of thelubricating oil in a machine; ultrasonic analysis of bearing wear, to name a few.
A major application of condition monitoring is that of electric motor and motor driven systems such aspumps, compressors, fans, presses etc. Such equipment is ubiquitous throughout industry with a widerange of motor power ranging from a few watts up to a few mega watts. Vibration analysis consists ofmounting sensors on the motor and measuring the vibration energy spectrum using an external dataacquisition and analysis unit, typically a pc or hand-held device. Acceleration, velocity, anddisplacement are some of the most commonly measured quantities in vibration analysis. The basicidea is that a mechanical fault developing within the system will be exhibited as a change in thevibration energy in specific frequency ranges. A trained engineer can detect these changes bymonitoring the output from the unit. In a typical case, the data obtained periodically over an extendedtime period (usually a year or more) would be plotted to observe any trends indicative of possiblefailure. The vibration based condition monitoring can be expensive, difficult to use and the resultsdifficult to interpret for the following reasons:
Cost; both the sensors and their associated electronics are expensive. Ease of installation; the mounting position of the accelerometers on the motor has to be
carefully chosen for maximum sensitivity. Also mounting sensors can be a problem ininaccessible places.
Ease of use; data gathering and analysis is time consuming and the interpretation of the datarequires skill and training
Repeatability; data obtained for vibration analysis is not repeatable. Also background vibrationcan interfere with the measured signal
Comprehensive coverage; vibration analysis is effective in the detection of mechanical faults,but are not applicable for the majority of electrical faults
Advanced warning; the threshold values used are affected by the operating conditions of theequipment. Therefore, continuous vibration monitoring systems use higher threshold valueswhich may reduce warning time.
Integration to factory automation systems; a significant majority of vibration systems areportable and cannot be integrated to factory automation systems.
Vibration analysis is the traditional technique that is used in industry. However, it is expensive,notoriously difficult to use, requires expertise both in acquiring the data and interpreting its results.Therefore, manufacturers increasingly demand inexpensive, simple to use condition monitoringtechnologies and products that can be integrated to factory automation systems with maintenanceplanning capabilities.
A newly developed method is introduced to overcome some of the shortcomings of vibration basedsystems, named as “current signature analysis”. In this method the information is extracted from theline current supplied to a motor. The variances in the stator-rotor air gap are reflected back in themotor’s current through the air gap flux affecting the counter electromotive force. Therefore currentcarries information related to both mechanical and electrical faults. Hence faults will exhibit a changein the frequency spectrum of the current in specific frequencies. A review of faults of an inductionmotor and specific frequencies at which they occur are given in [2].
Data acquisition is simple in current signature analysis since only electrical signals are measured. Italso provides comprehensive coverage; both mechanical as well as electrical faults are detected.However, the interpretation of the data requires expert personnel and it is time consuming as is thecase for vibration analysis. Like vibration analysis, Current signature analysis is also an outputassessment. It analyzes current data which is affected by the voltage. Therefore it is difficult toseparate if an abnormal signature is due to a problem in the motor or due to unexpected harmonics inthe voltage.
MCM was developed to eliminate the shortcomings of both the vibration and the current signatureanalysis systems. The principles underlying the operation of MCM are radically different from those ofvibration and current signature analysis systems. MCM uses a model based fault detection anddiagnostics technique. In this technique, the expected dynamic behavior (model) of the three phasesystem under varying conditions, such as load, is determined and compared with the measureddynamic behavior to monitor abnormalities. MCM first learns the system for a period of time throughacquiring and processing the real-time data from the system. The data is processed using systemidentification algorithms for the calculation of expected dynamic behavior and the model parameters.The changes in the parameters of the system indicate to abnormalities developing in the system.Further processing of these parameters is used for diagnosis.
As opposed to traditional vibration and current signature analysis, this approach uses a cause-effect(input-output) relationship and therefore immune to the surrounding noise or noise in inputs. Also thedifference between expected and actual behavior filters out and enhances ONLY abnormalitiesgenerated by the system which allows to earlier and accurate warnings. The expert system approacheliminates the needs for data base or record keeping, expert personnel, time consuming datagathering and analysis. It provides comprehensive (mechanical and electrical as well as drivensystem) fault coverage though it measures only voltages and currents.
MCM uses the electric motor of the equipment as a sensor. Therefore, any fault of the equipment thataffects the motor or the three phase system is also observed by MCM.
MCM addresses many of the objections raised by the use of vibration based and current signatureanalysis systems:
Cost; MCM and its accessories are inexpensive Ease of installation; Industry standard current and voltage transformers can be used as
sensors. These sensors are inexpensive, easily installed and familiar to all electricalmaintenance personnel. MCM can be used anywhere an electric motor driven systems can beoperated. Since the sensors and main unit are usually mounted in control cabinets. MCM unitdoes not need to be in close proximity to the monitored system
Easy of use; the expert system approach makes it possible for MCM to automatically establisha database and monitor changes in these parameters. The degree of fault is presented on asimple and intuitive sliding scale by the device itself. Therefore, it eliminates the need forexpertise of trained and skilled engineers
Repeatability; MCM data are highly repeatable. There are no external or background effectsthat can interfere with the capability of MCM to monitor systems
Comprehensive fault coverage; both electrical and mechanical faults can be detected using asingle device
Advanced warning; the thresholds are not effected by the operating conditions of the systemdue to expert system approach. Hence, MCM provides early and accurate alarms.
Integration to factory automation systems; MCM units are easily connected to an externalacquisition system for continuous monitoring via industry standard network cabling. Thistogether with its simple method of fault indication makes MCM an ideal device for use withfactory automation systems
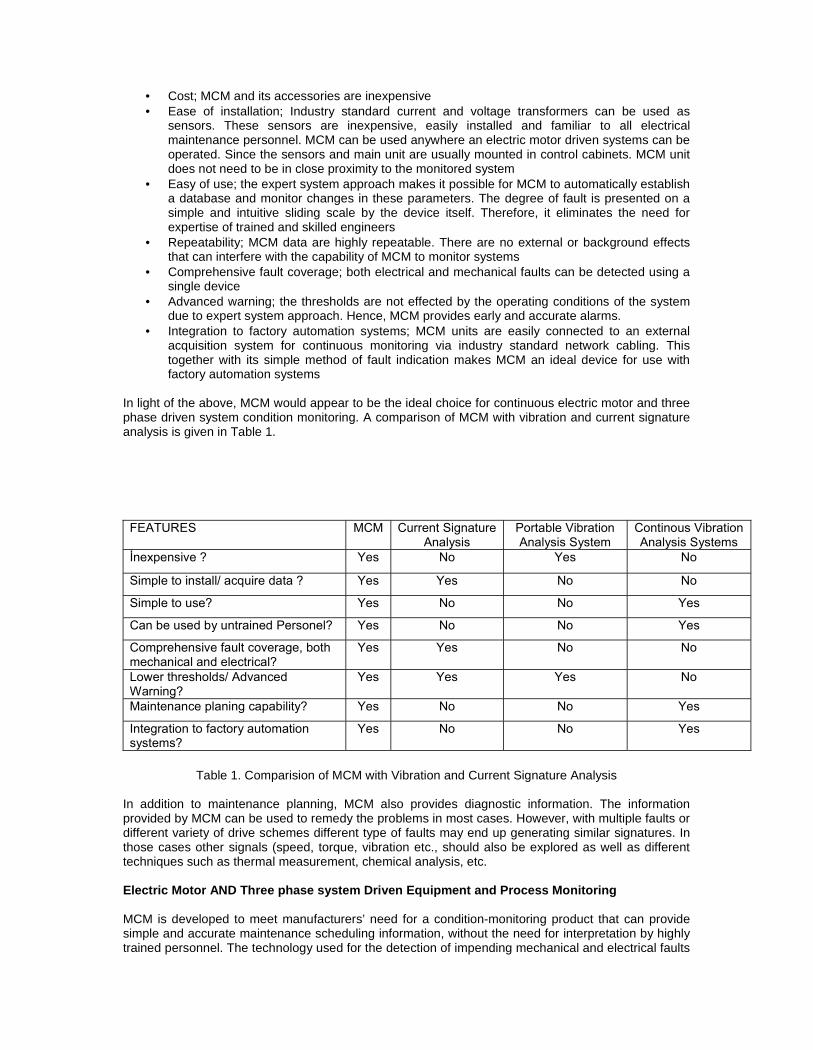
In light of the above, MCM would appear to be the ideal choice for continuous electric motor and threephase driven system condition monitoring. A comparison of MCM with vibration and current signatureanalysis is given in Table 1.
Table 1. Comparision of MCM with Vibration and Current Signature Analysis
In addition to maintenance planning, MCM also provides diagnostic information. The informationprovided by MCM can be used to remedy the problems in most cases. However, with multiple faults ordifferent variety of drive schemes different type of faults may end up generating similar signatures. Inthose cases other signals (speed, torque, vibration etc., should also be explored as well as differenttechniques such as thermal measurement, chemical analysis, etc.
Electric Motor AND Three phase system Driven Equipment and Process Monitoring
MCM is developed to meet manufacturers’ need for a condition-monitoring product that can providesimple and accurate maintenance scheduling information, without the need for interpretation by highlytrained personnel. The technology used for the detection of impending mechanical and electrical faults
FEATURES MCM Current SignatureAnalysis
Portable VibrationAnalysis System
Continous VibrationAnalysis Systems
İnexpensive ? Yes No Yes No
Simple to install/ acquire data ? Yes Yes No No
Simple to use? Yes No No Yes
Can be used by untrained Personel? Yes No No Yes
Comprehensive fault coverage, bothmechanical and electrical?
Yes Yes No No
Lower thresholds/ AdvancedWarning?
Yes Yes Yes No
Maintenance planing capability? Yes No No Yes
Integration to factory automationsystems?
Yes No No Yes
is a proven patented technology that has been previously employed in space and aviation applications[3,4,5,6]. It was rewarded as one of the 40 best products of year 2000 by Control EngineeringMagazine [7]. The operation of MCM is described below using an electric motor based system torepresent thre phase driven systems.
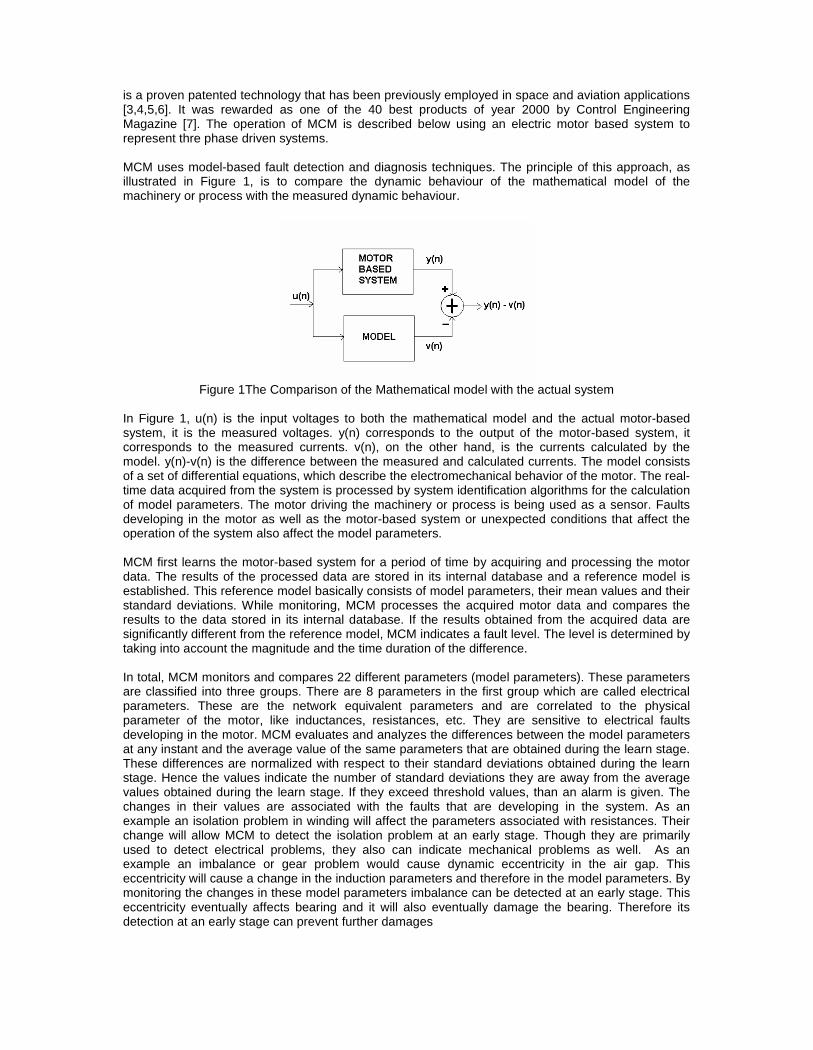
MCM uses model-based fault detection and diagnosis techniques. The principle of this approach, asillustrated in Figure 1, is to compare the dynamic behaviour of the mathematical model of themachinery or process with the measured dynamic behaviour.
Figure 1The Comparison of the Mathematical model with the actual system
In Figure 1, u(n) is the input voltages to both the mathematical model and the actual motor-basedsystem, it is the measured voltages. y(n) corresponds to the output of the motor-based system, itcorresponds to the measured currents. v(n), on the other hand, is the currents calculated by themodel. y(n)-v(n) is the difference between the measured and calculated currents. The model consistsof a set of differential equations, which describe the electromechanical behavior of the motor. The real-time data acquired from the system is processed by system identification algorithms for the calculationof model parameters. The motor driving the machinery or process is being used as a sensor. Faultsdeveloping in the motor as well as the motor-based system or unexpected conditions that affect theoperation of the system also affect the model parameters.
MCM first learns the motor-based system for a period of time by acquiring and processing the motordata. The results of the processed data are stored in its internal database and a reference model isestablished. This reference model basically consists of model parameters, their mean values and theirstandard deviations. While monitoring, MCM processes the acquired motor data and compares theresults to the data stored in its internal database. If the results obtained from the acquired data aresignificantly different from the reference model, MCM indicates a fault level. The level is determined bytaking into account the magnitude and the time duration of the difference.
In total, MCM monitors and compares 22 different parameters (model parameters). These parametersare classified into three groups. There are 8 parameters in the first group which are called electricalparameters. These are the network equivalent parameters and are correlated to the physicalparameter of the motor, like inductances, resistances, etc. They are sensitive to electrical faultsdeveloping in the motor. MCM evaluates and analyzes the differences between the model parametersat any instant and the average value of the same parameters that are obtained during the learn stage.These differences are normalized with respect to their standard deviations obtained during the learnstage. Hence the values indicate the number of standard deviations they are away from the averagevalues obtained during the learn stage. If they exceed threshold values, than an alarm is given. Thechanges in their values are associated with the faults that are developing in the system. As anexample an isolation problem in winding will affect the parameters associated with resistances. Theirchange will allow MCM to detect the isolation problem at an early stage. Though they are primarilyused to detect electrical problems, they also can indicate mechanical problems as well. As anexample an imbalance or gear problem would cause dynamic eccentricity in the air gap. Thiseccentricity will cause a change in the induction parameters and therefore in the model parameters. Bymonitoring the changes in these model parameters imbalance can be detected at an early stage. Thiseccentricity eventually affects bearing and it will also eventually damage the bearing. Therefore itsdetection at an early stage can prevent further damages
The electrical parameters are further classified in two groups. Electrical parameters 1-4 indicateproblems associated with rotor, stator, winding etc. while 5-8 indicate electrical supply problems suchas voltage imbalance, isolation problem of cabling, capacitor, motor connector, terminal slackness,defective contactors etc.
The parameters in the second group are sensitive to mechanical faults such as load imbalance,misalignment, coupling and bearing problems. They are called Mechanical Parameters 1-12. Theseparameters are obtained from the frequency spectrum of the electrical signals similar to the currentsignature analysis. However, MCM uses the spectrum obtained from the differences between theexpected current obtained from the model and the actual current. These differences include onlyabnormalities generated by the motor. Therefore, they are immune to the noise or harmonics presentin the supply voltages.
The mechanical parameters correspond to the 12 maximum values obtained in the frequencyspectrum. These parameters are also used for diagnostic purposes. Similar to the vibration as well ascurrent signature analysis techniques, the frequencies they occur indicate the type of fault, i.e., animbalance, loose foundation, oil whip, fan blades, inner or outer race of bearing etc. These parametersas well as their frequency intervals are provided to the user for trending and diagnostic purposes.
The parameters in the third group are sensitive to changes in the behavior of the system. These arecalled fit parameters (or residuals). There are 2 fit parameters. These are deviations between theactual currents (d phase and q phase) and the currents calculated from the model. If these parametersincrease above their threshold values the system is considered to behave differently than it did duringthe learn stage which indicates that a fault is developing in the system.
In addition to the above parameters MCM also monitors the supply voltage as well as the loadconditions. If the supply voltage changes abnormally, has imbalance or very high harmonic contentthen it issues a Watch Line alarm. Similarly if the load conditions do not match with the conditionsobserved during the learn stage then it issues a Watch Load alarm. Watch load alarm means thateither the load conditions changed or there is a fault developing in the system. If the user determinesthat there is a change in the process, then the user can add this new load condition into the conditionsobserved during the learn period by giving the UPDATE command to MCM.
Using the measured three phase voltage and current signals, MCM also calculates a set of physicalparameters such as rms-values of three phase voltage and current, powerfactor, etc. This set alsoincludes parameters such as total harmonic distortion, harmonic content of the incoming signal andvoltage imbalance which give an idea about the quality of supply power. Active and reactive powerparameters in this set might be used for energy consumption estimations. Therefore, it combinesmany physical quantities that are of interest to both production and maintenance operators just in onedevice.
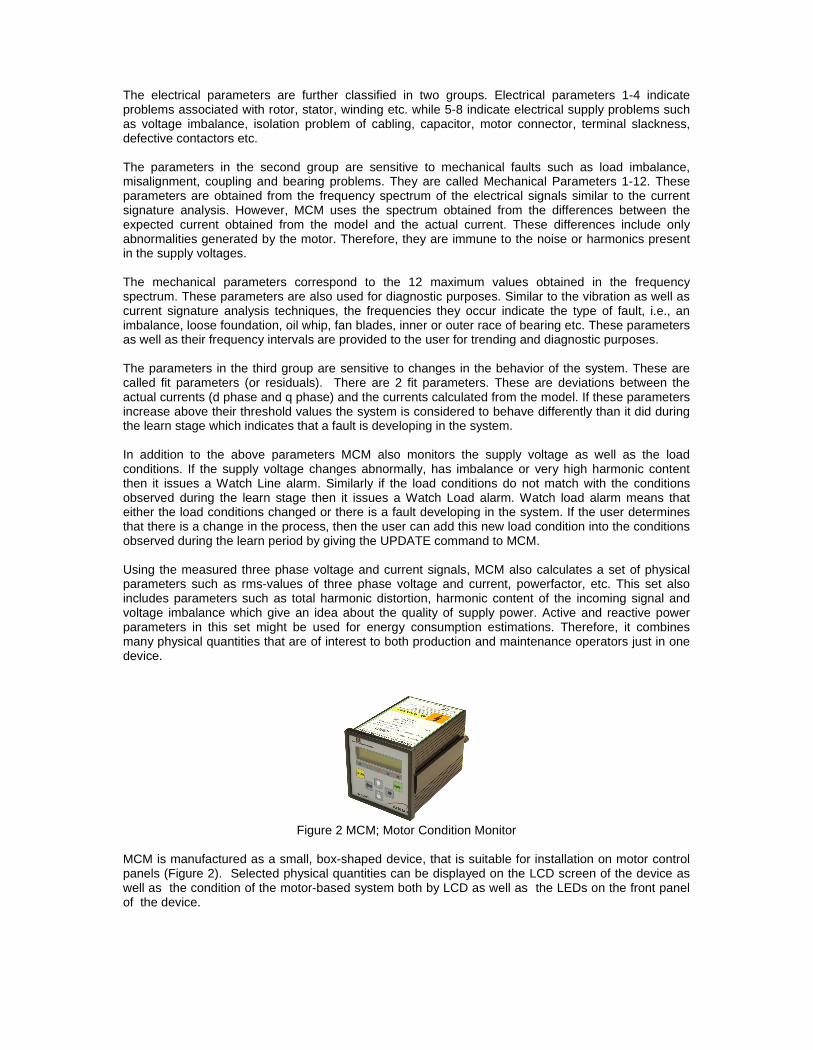
Figure 2 MCM; Motor Condition Monitor
MCM is manufactured as a small, box-shaped device, that is suitable for installation on motor controlpanels (Figure 2). Selected physical quantities can be displayed on the LCD screen of the device aswell as the condition of the motor-based system both by LCD as well as the LEDs on the front panelof the device.
MCMSoC; MCM System on a Card
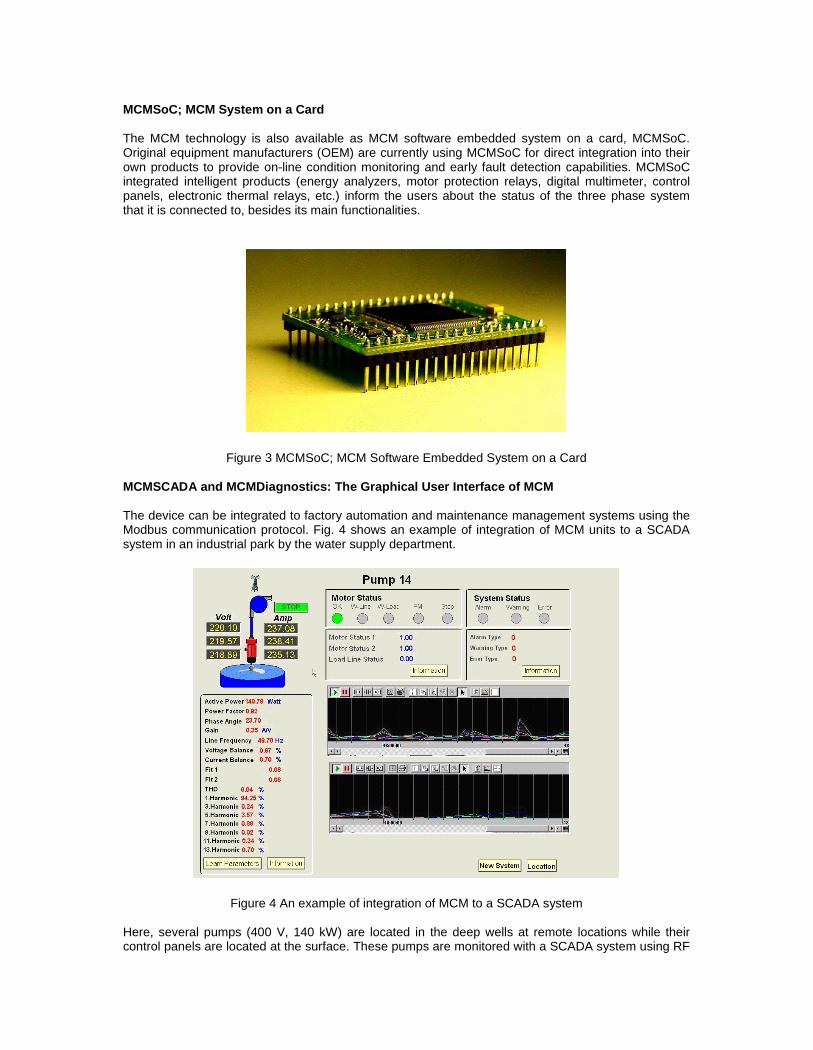
The MCM technology is also available as MCM software embedded system on a card, MCMSoC.Original equipment manufacturers (OEM) are currently using MCMSoC for direct integration into theirown products to provide on-line condition monitoring and early fault detection capabilities. MCMSoCintegrated intelligent products (energy analyzers, motor protection relays, digital multimeter, controlpanels, electronic thermal relays, etc.) inform the users about the status of the three phase systemthat it is connected to, besides its main functionalities.
Figure 3 MCMSoC; MCM Software Embedded System on a Card
MCMSCADA and MCMDiagnostics: The Graphical User Interface of MCM
The device can be integrated to factory automation and maintenance management systems using theModbus communication protocol. Fig. 4 shows an example of integration of MCM units to a SCADAsystem in an industrial park by the water supply department.
Figure 4 An example of integration of MCM to a SCADA system
Here, several pumps (400 V, 140 kW) are located in the deep wells at remote locations while theircontrol panels are located at the surface. These pumps are monitored with a SCADA system using RF
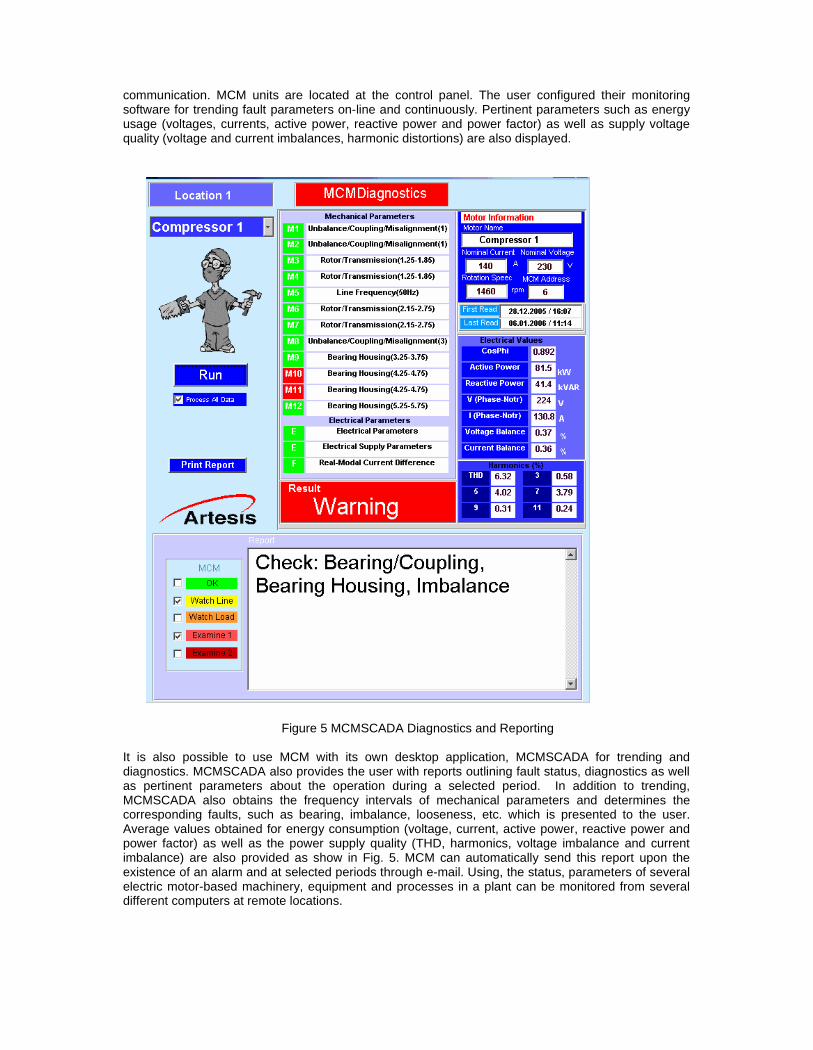
communication. MCM units are located at the control panel. The user configured their monitoringsoftware for trending fault parameters on-line and continuously. Pertinent parameters such as energyusage (voltages, currents, active power, reactive power and power factor) as well as supply voltagequality (voltage and current imbalances, harmonic distortions) are also displayed.
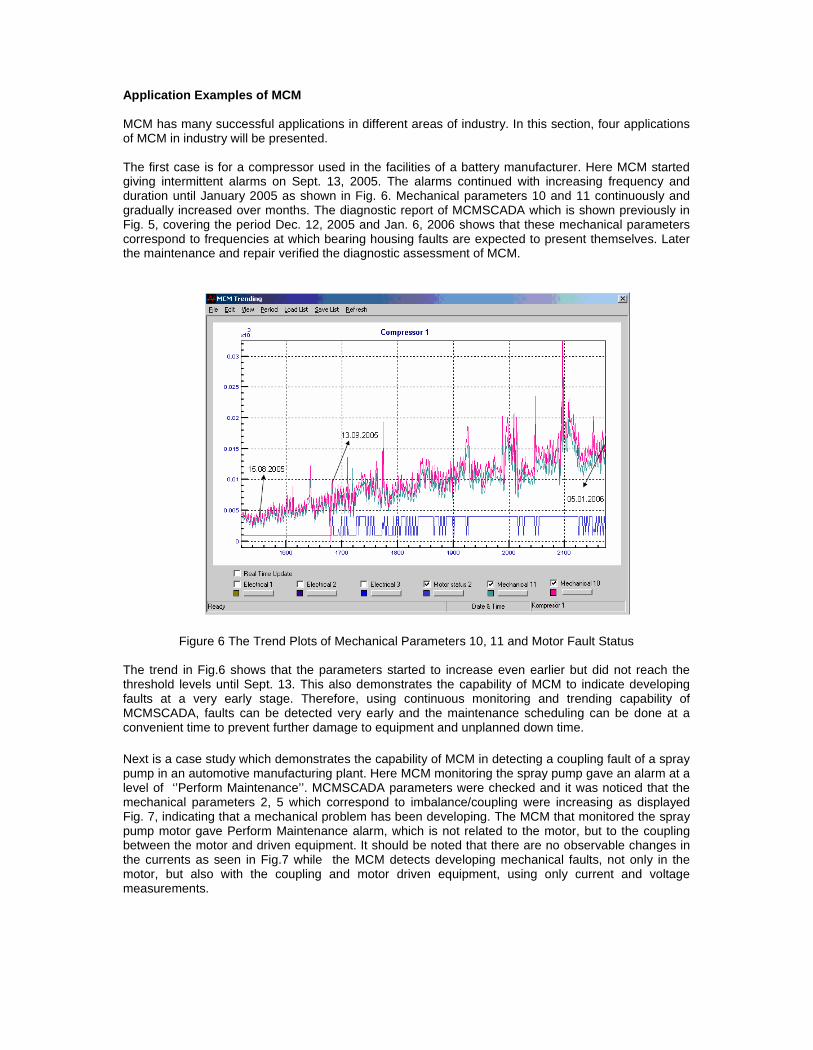
Figure 5 MCMSCADA Diagnostics and Reporting
It is also possible to use MCM with its own desktop application, MCMSCADA for trending anddiagnostics. MCMSCADA also provides the user with reports outlining fault status, diagnostics as wellas pertinent parameters about the operation during a selected period. In addition to trending,MCMSCADA also obtains the frequency intervals of mechanical parameters and determines thecorresponding faults, such as bearing, imbalance, looseness, etc. which is presented to the user.Average values obtained for energy consumption (voltage, current, active power, reactive power andpower factor) as well as the power supply quality (THD, harmonics, voltage imbalance and currentimbalance) are also provided as show in Fig. 5. MCM can automatically send this report upon theexistence of an alarm and at selected periods through e-mail. Using, the status, parameters of severalelectric motor-based machinery, equipment and processes in a plant can be monitored from severaldifferent computers at remote locations.
Application Examples of MCM
MCM has many successful applications in different areas of industry. In this section, four applicationsof MCM in industry will be presented.
The first case is for a compressor used in the facilities of a battery manufacturer. Here MCM startedgiving intermittent alarms on Sept. 13, 2005. The alarms continued with increasing frequency andduration until January 2005 as shown in Fig. 6. Mechanical parameters 10 and 11 continuously andgradually increased over months. The diagnostic report of MCMSCADA which is shown previously inFig. 5, covering the period Dec. 12, 2005 and Jan. 6, 2006 shows that these mechanical parameterscorrespond to frequencies at which bearing housing faults are expected to present themselves. Laterthe maintenance and repair verified the diagnostic assessment of MCM.
Figure 6 The Trend Plots of Mechanical Parameters 10, 11 and Motor Fault Status
The trend in Fig.6 shows that the parameters started to increase even earlier but did not reach thethreshold levels until Sept. 13. This also demonstrates the capability of MCM to indicate developingfaults at a very early stage. Therefore, using continuous monitoring and trending capability ofMCMSCADA, faults can be detected very early and the maintenance scheduling can be done at aconvenient time to prevent further damage to equipment and unplanned down time.
Next is a case study which demonstrates the capability of MCM in detecting a coupling fault of a spraypump in an automotive manufacturing plant. Here MCM monitoring the spray pump gave an alarm at alevel of ‘’Perform Maintenance’’. MCMSCADA parameters were checked and it was noticed that themechanical parameters 2, 5 which correspond to imbalance/coupling were increasing as displayedFig. 7, indicating that a mechanical problem has been developing. The MCM that monitored the spraypump motor gave Perform Maintenance alarm, which is not related to the motor, but to the couplingbetween the motor and driven equipment. It should be noted that there are no observable changes inthe currents as seen in Fig.7 while the MCM detects developing mechanical faults, not only in themotor, but also with the coupling and motor driven equipment, using only current and voltagemeasurements.
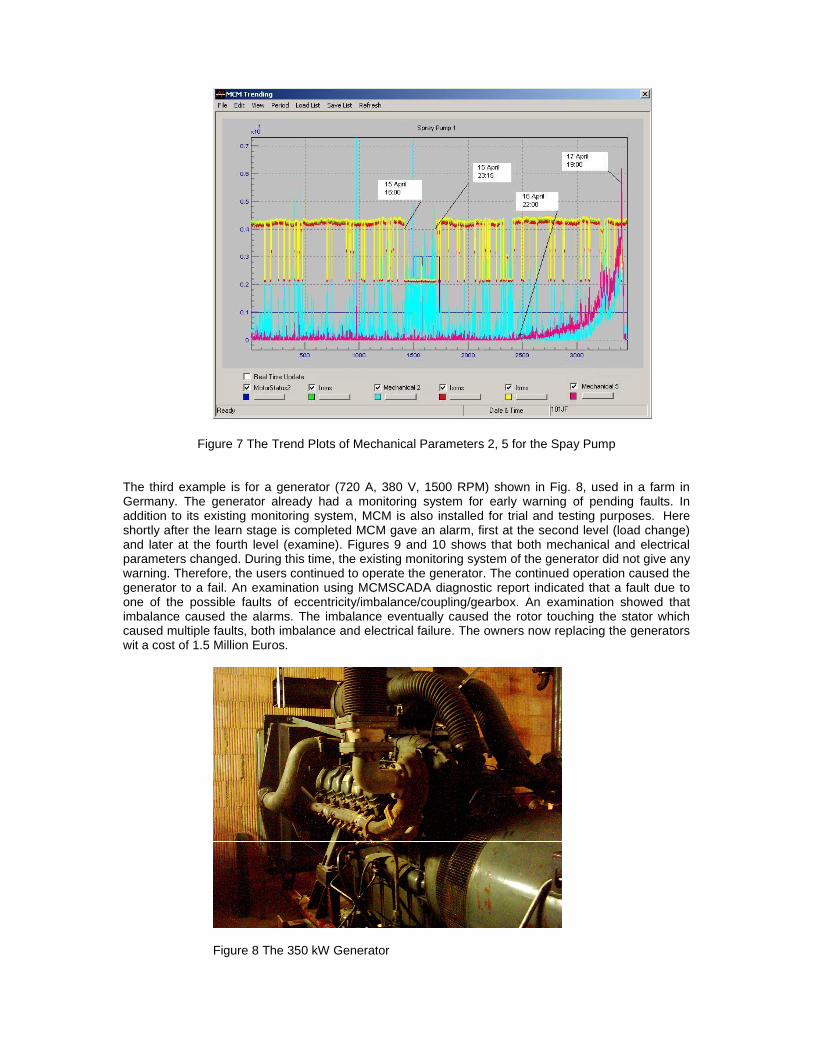
Figure 7 The Trend Plots of Mechanical Parameters 2, 5 for the Spay Pump
The third example is for a generator (720 A, 380 V, 1500 RPM) shown in Fig. 8, used in a farm inGermany. The generator already had a monitoring system for early warning of pending faults. Inaddition to its existing monitoring system, MCM is also installed for trial and testing purposes. Hereshortly after the learn stage is completed MCM gave an alarm, first at the second level (load change)and later at the fourth level (examine). Figures 9 and 10 shows that both mechanical and electricalparameters changed. During this time, the existing monitoring system of the generator did not give anywarning. Therefore, the users continued to operate the generator. The continued operation caused thegenerator to a fail. An examination using MCMSCADA diagnostic report indicated that a fault due toone of the possible faults of eccentricity/imbalance/coupling/gearbox. An examination showed thatimbalance caused the alarms. The imbalance eventually caused the rotor touching the stator whichcaused multiple faults, both imbalance and electrical failure. The owners now replacing the generatorswit a cost of 1.5 Million Euros.
Figure 8 The 350 kW Generator

Figure 9 The Trend Plots of Mechanical parameters for the Generator
Figure 10 The Trend Plots of Electrical Parameters for the Generator
The fourth case illustrates an isolation fault. MCM device was monitoring a sand cooling filter motor.Starting from October 7, 2004 electrical parameters began to increase gradually as a result of thedecrease in currents and power as seen in Fig. 11. The device started to give intermittent ’LoadChange’ warning. As electrical parameters increased, the ‘Load Change’ warnings became morefrequent in November. The increase in one of the three phase currents with respect to the others wasan indication of an isolation problem. On December, 5 the motor was repaired.
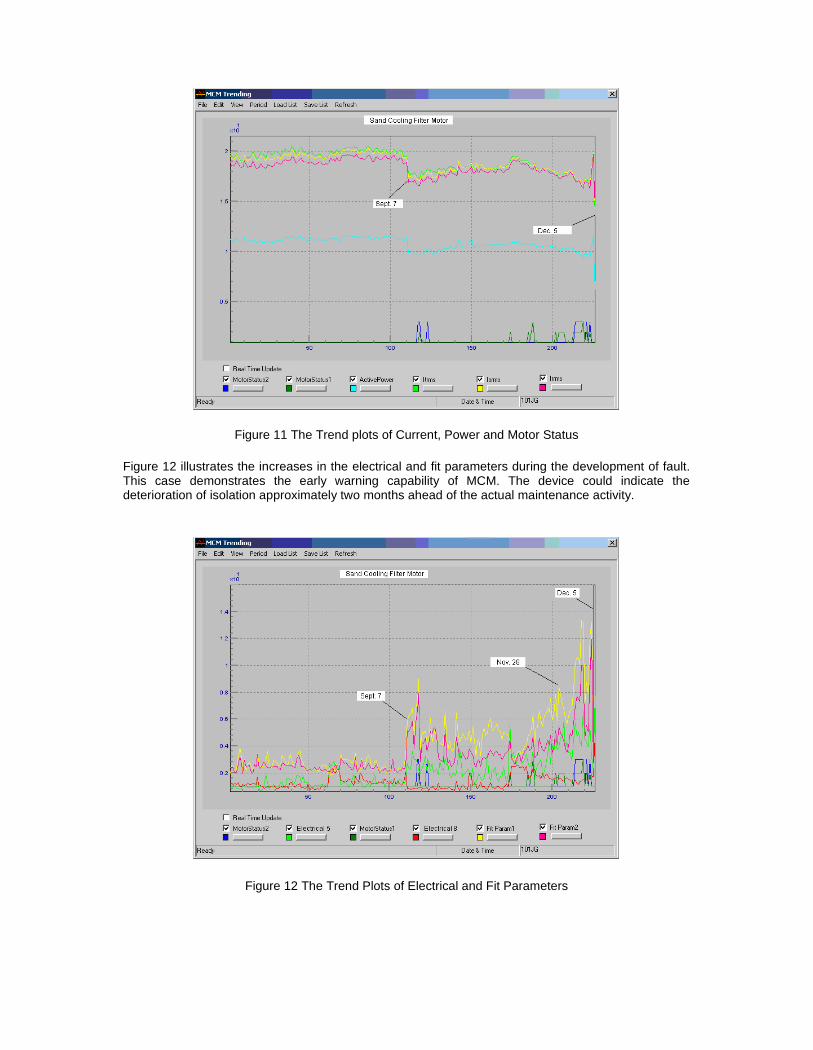
Figure 11 The Trend plots of Current, Power and Motor Status
Figure 12 illustrates the increases in the electrical and fit parameters during the development of fault.This case demonstrates the early warning capability of MCM. The device could indicate thedeterioration of isolation approximately two months ahead of the actual maintenance activity.
Figure 12 The Trend Plots of Electrical and Fit Parameters
References
[1] D. R. Bell, ”The Hidden Cost of Downtime : Strategies for Improving Return on Assets,”SmartSignal Co., USA, 2003.
[2] Nandi, S. and Toliyat, H.A., “Condition Monitoring and Fault Diagnosis of Electrical Mchines- AReview,” 1999.
[3] A. Duyar and W. C. Merrill, ”Fault Diagnosis For the Space Shuttle Main Engine,” AIAA Journal ofGuidance, Control and Dynamics, vol. 15, no. 2, pp. 384-389, 1992.
[4] A. Duyar, V. Eldem, W. C. Merrill, and T. Guo, “Fault Detection and Diagnosis in PropulsionSystems: A Fault Parameter Estimation Approach,” AIAA Journal of Guidance, Control and Dynamics,vol. 17, no. 1, pp. 104-108, 1994.
[5] J. Litt, M. Kurtkaya, and A. Duyar, ”Sensor Fault Detection and Diagnosis of the T700 TurboshaftEngine,” AIAA Journal of Guidance, Control and Dynamics, vol. 187, no. 3, pp. 640-642, 1995.
[6] J. L. Musgrave, T. Guo, E. Wong, and A. Duyar, “Real-Time Accommodation of Actuator Faults ona Reusable Rocket Engine,” IEEE Trans. Cont. Syst. Technol., vol. 5, no. 1, pp. 100-109, Jan. 1997.
[7] Editors’ Choice Award, 40 Best Products of 2000, Control Engineering Magazine, USA, 2001.