
McGill University Health Center (MUHC)
38
McGill University Health Center (MUHC) Verification report on a Greenhouse Gas Emissions (“GHG”) reduction project –Energy efficiency measures for GHG emissions reductions December 5, 2012
Transcript of McGill University Health Center (MUHC)

McGill University Health Center (MUHC)
Verification report on a Greenhouse Gas Emissions (“GHG”) reduction project –Energy efficiency measures for GHG emissions reductions
December 5, 2012

Raymond Chabot Grant Thornton LLP Suite 2000 National Bank Tower 600 De La Gauchetière Street West Montréal, Quebec H3B 4L8 Telephone: 514-878-2691 Fax: 514-878-2127 www.rcgt.com
Chartered Professional Accountants Member of Grant Thornton International Ltd
December 5, 2012
Mr Mohamed Khouchane Quality and Performance Advisor McGill University Health Center 2155 Guy Street Montréal, Quebec H3A 1A1
Dear Sir:
Subject: Verification Report on a Greenhouse Gas (“GHG”) Emissions Reduction Project –Energy efficiency measures for GHG emissions reductions
Enclosed herewith is our verification report on a GHG emissions reduction project performed at McGill University Health Center, 2155 Guy Street, Montreal, Quebec, H3A 1A1.
The quantification report that is subject to our verification is included in Appendix 1.
Please do not hesitate to contact us for any additional information you may require.
Yours truly,
Chartered Professional Accountants Gérald Daly, CPA, CA, CISA, CFE Roger Fournier CPA, CA Advisory Partner Lead Verifier
ls48
RCGT llp

Raymond Chabot Grant Thornton LLP Suite 2000 National Bank Tower 600 De La Gauchetière Street West Montréal, Quebec H3B 4L8 Telephone: 514-878-2691 Fax: 514-878-2127 www.rcgt.com
Chartered Professional Accountants Member of Grant Thornton International Ltd
Verification Notice on the Declaration of GHG Emissions Reductions
Mr Mohamed Khouchane Quality and Performance Advisor McGill University Health Center 2155 Guy Street Montréal, Quebec H3A 1A1
Dear Sir:
We have been engaged by McGill University Health Center (MUHC) to perform the verification of MUHC GHG emissions reduction project as an independent third party verifier.
We have verified the accompanying greenhouse gas (“GHG”) emissions reduction quantification report entitled Greenhouse Gas Project Report Period 2011 (the “quantification report”). This quantification report dated December 4, 2012 is included, along with the related GHG assertions, in Appendix 1 of our report which is intended to be publicly posted on CSA’s GHG CleanProjectsTM Registry. The present report is the fourth consecutive verification report issued for this project.
The project is located at these locations:
Montreal General Hospital (Hôpital général de Montréal), 1650 Cedar Avenue, Montréal, H3G 1A4; Latitude: 45o29’51.32’’N – Longitude: 73o35’18.78’’W;
Montreal Children’s Hospital (Hôpital de Montréal pour enfants), 2300 Tupper Street, Montréal, H3H 1P3; Latitude: 45o29’23.68’’N – Longitude: 73o34’56.24’’W;
Royal Victoria Hospital (Hôpital Royal Victoria), 687 des Pins Avenue West, Montréal, H3A 1A1; Latitude: 45o30’49.97’’N – Longitude: 73o34’33.46’’W;
Montreal Chest Institute (Institut thoracique de Montréal), 3650 St-Urbain Street, Montréal, H2X 2P4; Latitude : 45o 30’ 47.70’’ N - Longitude : 73o 34. 29.64’’ W
Montreal Neurological Institute and Hospital (Hôpital Neurologique de Montréal), 3801 University Street, Montréal, H3A 2B4. Latitude: 45o30’32.83’’N – Longitude: 73o34’52.97’’W.
Responsibilities
Management is responsible for the relevance, consistency, transparency, conservativeness, completeness, accuracy and method of presentation of the quantification report. This responsibility includes the design, implementation and maintenance of internal controls relevant to the preparation of a GHG emissions reduction quantification report that is free from material misstatements. Our responsibility is to express an opinion based on our verification.

2
Standards
Our verification was conducted under ISO 14064-3 International Standard, entitled: Specification with guidance for the validation and verification of greenhouse gas assertions (2006). This standard requires that we plan and perform the verification to obtain either a reasonable assurance or a limited assurance about whether the emission reductions declaration that is contained in the attached quantification report is fairly stated, is free of material misstatements, is an appropriate representation of the data and GHG information of MUHC and the materiality threshold has not been reached or exceeded.
Level of assurance
It was agreed with MUHC’s representatives that a reasonable assurance level of opinion would be issued and we planned and executed our work accordingly. Consequently, our verification included those procedures we considered necessary in the circumstances to obtain a reasonable basis for our opinion.
Scope
A reasonable assurance engagement with respect to a GHG statement involves performing procedures to obtain evidence about the quantification of emissions, and about the other information disclosed as part of the statement. Our verification procedures were selected based on professional judgment, including the assessment of the risks of material misstatement in the GHG statement. In making those risk assessments, we considered internal control relevant to the entity‘s preparation of the GHG statement. Our engagement also included:
Assessing physical and technological infrastructure, processes and control over data.
Evaluating the appropriateness of quantification methods and reporting policies used and the reasonableness of necessary estimates made by MUHC.
Identifying GHG sources sinks and reservoirs, types of GHG involved and time periods when emissions occurred.
Establishing quantitative materiality thresholds and assessing compliance of results to these thresholds.
Ensuring ownership of the project by observing that all reductions are obtained directly by the client on its own premises
The verification team
Before undertaking this assignment we ensured there were no conflicts of interest that could impair our ability to express an opinion and the conflict of interest review form was completed by all participants to this assignment (see Appendix 2). We also ensured we had the skills, competencies and appropriate training to perform this specific assignment.
The work was performed by ISO 14064-3 trained professionals. Training was provided by the Canadian Standards Association. This is an energy efficiency project that all the team members are competent to undertake since, on top of their professional training, they all have performed many similar projects.
The auditor assigned to this audit work was:
Roger Fournier, CPA, CA, Lead Verifier
Mr. Fournier is an ISO 14064-3 trained professional. He has issued more than 80 GHG reduction project verification reports. The majority of which are registered on the GHG CleanProjectsTM Registry.
Mr. Fournier was responsible for the verification work and ensured the production of this report.

3
The Lead Verifier has reviewed and understands GHG CleanProjectsTM Registry’s registrations requirements.
McGill University Health Center (MUHC)
The MUHC, located in Montreal, Quebec, is one of the most comprehensive University Health Centres in North America.
The MUHC is a University Health Centre affiliated with McGill University, and consists of the Montreal Children’s, Montreal General and Royal Victoria hospitals, as well as the Montreal Neurological Institute and Hospital, and the Montreal Chest Institute.
The emissions reduction project
The MUHC's project consists in the implementation of energy efficient measures in hospitals. Since 2002, the MUHC has implemented several energy efficient projects reducing the overall energy consumption in hospitals under its management.
The project scenario consists of MUHC’s use of new and energy efficient technologies for its buildings, for instance, replacing inefficient boilers in the heating system with new efficient ones, adding electric heating control and a new energy efficient piping system, and also, switching heat generating systems from steam to water. These energy efficiency measures are additional to a baseline scenario which is the status quo situation, meaning that MUHC would not have made any modification with the purpose of improving its energy consumption. The project has started on January 1, 2002 and the emissions reduction initiatives were completed on December 31, 2011.
The main GHG sources for the project are from energy consumption related to the occupation of buildings (heating, ventilation, air conditioning). The various gases involved at MUHC are carbon dioxide (CO2), methane (CH4), and nitrous oxide (N2O).
The expected life time of this project, as per page 7 of the attached quantification report entitled Greenhouse Gas Project Report Period 2011, is 10 years.
The project was under the responsibility of Mr. Mohamed Khouchane, Specialist in Administrative Procedures, who is the signing authority in this matter, and the persons responsible for the data collection and monitoring was Mrs. Azad El Akel, Technical Services Department, MUHC.
MUHC has implemented a monitoring system that aims at insuring that all installed elements of the project that contribute to GHG emissions reduction are in operation constantly and consistently.
The quantification report
The quantification report was prepared by L2I Financial Solutions, in accordance with ISO 14064-2 “Specification with guidance at the project level for quantification, monitoring and reporting of greenhouse gas emission reductions or removal enhancement (2006)”.
The Clean Development Mechanism (CDM) (2007), II.E version 10 – Energy efficiency and fuel switching measures for buildings was used as a guide for the quantification methodology.
The approach that was used for the quantification of the GHG emission reductions was one of comparing the emission factors of the sources of energy used for the project to those used for the baseline scenario. The quantifier determined the GHG emissions for every source of energy by using appropriate emission factors multiplied by the consumption of every GHG source and also by taking into consideration variables related to changes in total area of the buildings as well as degree days related to baseline scenarios.
The emission factors chosen are based on the National Inventory Report 1990-2010 Greenhouse Gas Sources and Sinks in Canada.

4
The verification work
Planning
At the planning phase of this verification assignment, the following points were reviewed with MUHC’s representatives: Major processes and equipments used in MUHC’s operations, comprehension of the different operation stages with the purpose of assessing the complexity of the operation and improvements, MUHC’s internal control with the purpose of assessing their risk mitigation capacity and finally, emission sources and GHG involved.
This preliminary review resulted in the assessment of the following risks:
The inherent risk which is associated with the complexity of the project and the task being performed;
The control risk which concerns the risk that the GHG project controls will not be able to prevent or detect a material discrepancy; and
The detection risk which concerns the risk that the verifier will not detect a material discrepancy that has not been detected or prevented by the GHG project controls.
As a result of the assessment of the inherent and control risks, a materiality level was defined, a verification program was designed to mitigate the detection risk and a sampling plan was developed accordingly.
Assessing performance materiality
Materiality is an amount that, if omitted or misstated, will influence the reader of the report in his decision making. Performance materiality is defined in the Canadian Auditing Standards as an amount, set by the auditor at less than materiality to reduce to an appropriately low level the probability that the aggregate of uncorrected and undetected misstatements exceeds the materiality.
We have assessed a materiality level based on the above definitions, using Raymond Chabot Grant Thornton’s performance materiality determination system. This system considers the following information:
User expectations;
Prior year’s measures of materiality;
Industry standards;
The entity’s concept of materiality;
Our assessment of detection risks;
Other entity specific information.
We have assessed performance materiality at 5% of declared emission reductions.
The inherent risk and the control risk were assessed at an acceptable level for verification purposes.
The detection risk, considering the verification program that was designed, is assessed at an acceptable level for verification purposes.
Sampling plan determination
Standard sampling and testing procedures were the following and were not modified during the verification:
5
Documentation review;
Interviews with key personnel;
Cross-checking of Quantification report’s calculations;
Reconciliation of Quantification report to worksheets;
Sampling of 25% of GHG emissions;
Obtention of a declaration of ownership of reductions and removals;
Description of relevant information systems used for data collection and monitoring.
Conclusion of planning
No outstanding issues remained unresolved after the preliminary review.
Consequently we could proceed with the verification work.
Execution
A draft of the quantification report was submitted to us on September 17, 2012. Our initial review of the documentation was undertaken on September 25, 2012 and a verification plan was prepared. We then toured MUHC’s premises on November 1, 2012. In doing so, we interviewed Mr. Khouchane and Mrs. El Akel. We subsequently received the final quantification report dated December 4, 2012.
Information systems
Each monitoring system that may have an effect on the data used for emissions reduction calculations has been identified. The staff responsible for data input and reporting of these systems was interviewed and the control procedures were described and assessed. Where deemed necessary, spot checking was used to ensure the controls had been operating properly throughout the verified period. All reports used in the calculation were reconciled to the calculations.
Assessing quantification methodology
We have assessed the appropriateness of using Energy efficiency and fuel switching measures for buildings, as a methodology.
We agree with the methodology used for this project.
Findings
Findings were listed, valued and compared to our established materiality levels. No findings or aggregates of findings exceeded the materiality level. All findings were revisited at the conclusion of the verification to determine if they should be aggregated to generate a request for correction but there were no need to do so.
During the course of our verification, we obtained all the necessary cooperation and documents required from MUHC’s management.
Criteria
1. The attached quantification report is in conformance with the requirements and principles of ISO 14064-2.
2. The approach and methodology used for the quantification are appropriate.
3. The baseline scenario is appropriate.

6
4. The supporting data are subject to sufficient controls to be considered fair and accurate and should not cause any material discrepancy.
5. The calculations supporting the GHG assertion are sufficiently accurate to be considered fair and should not cause any material discrepancy.
6. There are no competing claims to the ownership of the GHG project and the resulting emission reductions or removals.
7. The project start date is accurate and the lifetime estimation of the project is fairly stated.
8. The quantification report has a low degree of uncertainty and the materiality threshold has not been reached or exceeded.
Reasonable assurance opinion
Our verification was conducted under ISO 14064-3 International Standard, entitled: Specification with guidance for the validation and verification of greenhouse gas assertions (2006).
In our opinion:
1. The quantification report is prepared in accordance with ISO 14064-2 standard: Specification with guidance at the project level for quantification, monitoring and reporting of greenhouse gas emission reductions or removal enhancements (2006), and the principles of relevance, completeness, consistency, accuracy, transparency and conservativeness have been respected.
2. The approach and methodology used for the quantification are appropriate.
3. The baseline scenario is appropriate.
4. MUHC’s data controls management system is appropriate.
5. The quantification report and the GHG assertion are free of material misstatements and are an appropriate representation of the data and GHG information of MUHC.
6. To our knowledge, there are no competing claims to the ownership of the GHG project and the resulting emission reductions or removals.
7. The quantification report has a low degree of uncertainty and the materiality threshold has not been reached or exceeded.
8. The GHG emission reductions presented in the quantification report entitled Greenhouse Gas Project Report Period 2011 and dated December 4, 2012 are, in all material respect, fairly stated at 11 116 tCO2e and are additional to what would have occurred in the baseline scenario. The following breakdown of those emission reductions by vintage year is fairly stated:
Year CO2 CH4 N2O Total
2011 11,070 (4) 50 11,116
9. The project start date is accurate and the lifetime estimation of the project is fairly stated.
Restricted usage and confidentiality
This verification report is produced to be used by the management of MUHC and parties interested in the above described GHG emissions reduction project. Reliance on the conclusions of this verification report for any other usage may not be suitable.

7
The quantification report entitled Greenhouse Gas Project Report Period 2011 and dated December 4, 2012 is an integral part of this verification report and should in no circumstances be separated from it.
This verification report and the supporting work files are kept confidential and are available to the client on request and will not be disclosed to anyone else unless compelled by law. They will be safeguarded for 10 years after which period they will be safely destroyed.
Chartered Professional Accountants Roger Fournier, CPA, CA Gérald Daly, CPA, CA, CISA, CFE Lead Verifier Advisory Partner
Montréal, December 5, 2012
ls48
RCGT llp

Appendix 1- Quantification report

Greenhouse Gas Project ReportPeriod 2011
Project proponent: McGill University Health Centre2155 rue GuyMontréal, QuébecH3A 1A1
Prepared by: L2I Financial Solutions2015, Victoria Street, Suite 200Saint-Lambert (Québec)J4S 1H1
December 4th, 2012

GHG Report ii
TABLE OF CONTENT
TABLE OF CONTENT.................................................................................................... ii
LIST OF TABLES ........................................................................................................... iii
ABBREVIATIONS.......................................................................................................... iv
SOMMAIRE EXÉCUTIF................................................................................................ 5
1. INTRODUCTION............................................................................................ 6
2. PROJECT DESCRIPTION............................................................................. 7
2.1. Project title .......................................................................................................... 7
2.2. Objectives ........................................................................................................... 7
2.3. Project lifetime and crediting period................................................................... 7
2.4. Type of GHG project .......................................................................................... 7
2.5. Location .............................................................................................................. 7
2.6. Conditions prior to project initiation................................................................... 8
2.7. Description of how the project will achieve GHG emission reductions orremoval enhancements ....................................................................................... 8
2.8. Project technologies, products, services and expected level of activity ............. 9
Royal Victoria Hospital (RVH) .................................................................................. 9The Montreal Children’s Hospital (MCH) ............................................................... 10Montreal Chest Institute (MCI) ................................................................................ 10Montreal Neurological Hospital (MNH) .................................................................. 11Montreal General Hospital (MGH)........................................................................... 11
2.9. Aggregate GHG emission reductions and removal enhancements likely to occurfrom the GHG project....................................................................................... 12
2.10. Identification of risks ........................................................................................ 12
2.11. Roles and Responsibilities ................................................................................ 13
2.11.1. Project proponent and representative ...................................................... 132.11.2. Monitoring and data collection ............................................................... 132.11.3. Quantification and reporting responsible entity ...................................... 132.11.4. Authorized project contact ...................................................................... 14
2.12. Project eligibility under the GHG program ...................................................... 14
2.13. Environmental impact assessment .................................................................... 14
2.14. Stakeholder consultations and mechanisms for on-going communication ....... 14
2.15. Detailed chronological plan .............................................................................. 15

GHG Report iii
3. SELECTION OF THE BASELINE SCENARIO AND ASSESMENT OFADDITIONALITY ......................................................................................................... 16
4. IDENTIFICATION AND SELECTION OF GHG SOURCES, SINKSAND RESERVOIRS....................................................................................................... 17
5. QUANTIFICATION OF GHG EMISSIONS AND REMOVALS ............ 18
5.1. Baseline GHG emissions/removals................................................................... 18
5.2. Project GHG emissions/removals ..................................................................... 20
5.3. Emission reductions .......................................................................................... 21
6. DATA MONITORING AND CONTROL ................................................... 22
7. REPORTING AND VERIFICATION DETAILS....................................... 25
LIST OF TABLESTable 1: Summary of MUHC’s hospital centers................................................................. 9Table 2: Measures implemented at RVH.......................................................................... 10Table 3: Measures implemented at MCH ......................................................................... 10Table 4: Measures implemented at MCI........................................................................... 11Table 5: Measures implemented at MNH......................................................................... 11Table 6: Measures implemented at MGH......................................................................... 12Table 7: GHG Emission Reductions Summary ................................................................ 12Table 8: SSR inventory..................................................................................................... 17Table 9: Monitored data.................................................................................................... 22Table 10: Baseline scenario GHG emissions in 2011 (t CO2e) ........................................ 25Table 11: Project scenario GHG emissions in 2012 (t CO2e)........................................... 26Table 12: GHG emission reductions in 2011 (t CO2e) ..................................................... 26

GHG Report iv
ABBREVIATIONS
BS: Baseline Scenario (GHG Emission Source)
CDM: Clean Development Mechanism
CH4: Methane
CO2: Carbon dioxide
CO2e: Carbon dioxide equivalent (usually expressed in metric tons)
CSA: Canadian Standards Association
CUSM : Centre universitaire de santé McGill
EF: Emission Factor
EPA : Environmental Protection Agency (USEPA)
HDD: Heating degree day
GHG: Greenhouse gases
ISO: International Organization for Standardization
IPCC: Intergovernmental Panel on Climate Change
kWh : Kilowatt hour
MUHC : McGill University Health Centre
N2O: Nitrous oxide
PS: Project Scenario (GHG emission source)
SSR : Source, Sink and Reservoir
t : Ton (metric)
VER : Verified Emission Reduction

GHG Report 5
SOMMAIRE EXÉCUTIF(Please note that the remainder of the document is in English)
Le Centre Universitaire de Santé McGill a mis en œuvre un projet d’amélioration del’efficacité énergétique des édifices dont il a la responsabilité. Le projet du CentreUniversitaire de Santé McGill inclut plusieurs édifices situés à Montréal, dans la provincede Québec. Il s’agit par conséquent d’un projet groupé. Les mesures mises en place dès2002 font en sorte que les quantités d’électricité, de gaz et d’huile utilisées ont étéréduites, ce qui se traduit par des réductions des émissions de gaz à effet de serre.
L’implantation des mesures a débuté en 2002 et la quantification de ces dernières débuteen 2002. La période de 10 ans du projet a pris fin en décembre 2011. La reconduction dela période créditrice pur une période additionnelle de dix ans (ou moins) est à considérer.
Les édifices pris en considération lors de cette étude sont l’Hôpital général de Montréal(1650 Avenue Cedar), l’Hôpital de Montréal pour enfants (2300 rue Tupper), HôpitalRoyal Victoria (687 Avenue des Pins ouest), l’Institut thoracique de Montréal (3650 St-Urbain) et l’Hôpital neurologique de Montréal (3801 University).
Les réductions d’émission de GES pour la période 2011et pour la totalité du projet depuis2002 sont ici présentées :
Année Réductions(t CO2e)
2011 11 116
TOTAL 76 155

GHG Report 6
1. INTRODUCTION
As a high level educational and health services provider and an important player in theMontreal community, McGill Universiy is committed to demonstrate its socialresponsibility in every aspect of its operations. As part of this commitment the McGillUniversity Health Centre (MUHC) has decided to take action to reduce its impact on theenvironment. Among other measures, several energy efficiency improvements have beenimplemented resulting in both reduction of energy usage and GHG emissions mitigation.The present document gives explanation about how the project is implemented andreports factual outcomes regarding GHG emissions reduction.
This GHG report is presented in a format that meets the requirements of CSACleanProjectsTM registry and the ISO 14064-2 guidelines and principles:
Relevance:All relevant GHG sources related to energy usage at MUHC are meticulously selectedand presented in section 4. A precise methodology is used along with project specificparameters values.
Completeness:A complete assessment of GHG sources is made and all GHG types are considered in theapplied quantification methodology. Complete information regarding projectimplementation, continuing activities, new building improvements over time and GHGquantification is given through this GHG report.
Consistency:Chosen quantification methodology is appropriate for McGill University Health Centre’sspecific project. Established baseline scenario is consistent with the project level ofactivity related to the heating needs of the buildings.
Accuracy:Calculation uncertainties are kept as small as possible. Energy data are precise andcalculations are well documented.
Transparency:Project related information is transparently communicated through this document so thatthe intended user knows what the important data are, how they are collected and how theproject actually leads to GHG emissions reduction. Data monitoring and GHG emissionreductions calculation are clearly detailed in order to provide the reader sufficientinformation to confidently make decisions.
Conservativeness:GHG emission reductions are not overestimated. When accuracy is jeopardized becauseof assumptions, conservative choices are made.
This report will be made available for public consultation.

GHG Report 7
2. PROJECT DESCRIPTION
2.1. Project titleMcGill University Health Centre’s energy efficiency measures for GHG EmissionsReduction Project
2.2. ObjectivesThe main objective of the project is to reduce the GHG emissions resulting from the useof different energies in the MUHC’s buildings.
2.3. Project lifetime and crediting periodMcGill University Health Centre’s energy efficiency grouped project was graduallyimplemented from January 2003, except for the MCH which started the efficiencymeasures’ implementation in 2002. The project crediting period start date is January 1st2002. The project activities are planned to be ongoing for at least a crediting period of 10years. Renewal of the crediting period will be assessed.
2.4. Type of GHG projectThis project is an energy efficiency grouped project.
2.5. LocationMcGill University Health Centre (The buildings are located on the island of Montreal)Montreal (Quebec) Canada
McGill University Health Centre’s Energy Efficiency Projects are located at:
Montreal General Hospital (MGH)1650 Cedar AvenueMontreal, QuebecH3G 1A4Latitude: 45° 29’ 51.32’’ NLongitude: 73° 35’ 18.78’’ W
The Montreal Children’s Hospital (MCH)2300 Tupper StreetMontreal, QuebecH3H 1P3Latitude: 45° 29’ 23.68’’ NLongitude: 73° 34’ 56.24’’ W

GHG Report 8
The Royal Victoria Hospital (RVH)687 Pine Avenue WestMontreal, QuebecH3A 1A1Latitude: 45° 30’ 49.97’’ NLongitude: 73° 34’ 33.46’’ W
The Montreal Chest Institute (MCI)3650 St-UrbainMontreal, QuebecH2X 2P4Latitude: 45° 30’ 47.70’’ NLongitude: 73° 34’ 29.64’’ W
The Montreal Neurological Hospital (MNH)3801 University StreetMontreal, QuebecH3A 2B4Latitude: 45° 30’ 32.83’’ NLongitude: 73° 34’ 52.97’’ W
2.6. Conditions prior to project initiationThe conditions in place before implementation of the project were status quo on energyefficiency technologies. The conditions were also status quo on energy utilization,switching and on the steam heating systems.
2.7. Description of how the project will achieve GHG emissionreductions or removal enhancements
The project contributes to GHG emissions reduction since it makes it possible to consumeless energy than it would otherwise consume in the baseline scenario. The significantGHG reductions projects in this report are:
1) The replacement of inefficient boilers by new and efficient ones, changing theoverall piping system (thermo insulation) and installing centralized commandcenters;
2) Change of air cooling equipment;3) Energy switches for heating systems from steam to hot water.
The other projects will have a small overall impact on the total GHG emissions reduction.However it is important to mention the substantial environmental efforts carried out byMcGill University Health Centre.
The project achieves GHG emissions reduction by the installation of energy efficienttechnologies and thus the reduction of energy consumption (natural gas, oil andelectricity) than what would have happened with the baseline scenario: status quo on

GHG Report 9
energy efficiency projects, on switch of energy (steam to hot water) and status quo on theinefficient boilers within the heating system.
2.8. Project technologies, products, services and expected level ofactivity
Created in 1997, the McGill University Health Center (MUHC) is the first and mostimportant University Hospital voluntary fusion in Canada. With forty buildings on fivelocations, MUHC is responsible for the management of approximately 350,000 m2. Thefollowing table represents each Hospital Center.
Table 1: Summary of MUHC’s hospital centers
Hospital Center Abbreviation Year offoundation Total Area
Montreal General Hospital MGH 1822 102,016 m2
Royal Victoria Hospital RVH 1893 131,195 m2
Montreal Children’s Hospital MCH 1903 57,683 m2
Montreal Chest Institute MCI 1903 13,948 m2
Montreal Neurological Hospital MNH 1934 27,904 m2
As one can observe, MUHC’s Hospital Centers are composed of buildings that are morethan 100 years old, some dating from the 1800s. In 2002, MUHC started theimplementation of its Energy Optimization Plan in order to increase the energy efficiencyof its installations through the modernization and optimization of its operations andmaintenance.
Royal Victoria Hospital (RVH)
The Royal Victoria Hospital project, as a whole, cost over $4.7 million. One of the mainmeasures implemented, was the installation of a central computer controlled heatingsystem allowing for an automatic modulation based on the heating needs. A resistanceelement boiler was also installed. It ensures the main heating needs in the summer and itworks only if the electrical demand is below high peak. Furthermore, a specific effort wasmade for the recovery of the energy generated by the pipe purges and the combustionfumes. The following table summarizes the different measures implemented at RVH.

GHG Report 10
Table 2: Measures implemented at RVHInstallation of six (6) high performance boilers
Installation of a hot exhaust gas recovery system
Installation of a central computer controlled heating system allowing for anautomatic modulation based on the heating needs
Installation of a Resistance Element Boiler (electrical)
Thermal insulation of the piping network
Heat recovery during the stripping phase
New Multistack heat pump
The Montreal Children’s Hospital (MCH)
The Montreal Children’s Hospital project has a whole cost over $2.5 million. Two highefficiency centrifuge chillers condition the MCH. A frequency variable speed drive unitwas added to one of the chillers allowing to adjust the energy consumption moreefficiently and to correspond to the current norms of HCFC elimination. Furthermore, theelimination of the absorption chillers significantly reduced the vapor consumption.Finally, the frequency variable speed drive units optimize ventilation in the buildingoutside of traffic high hours.
Table 3: Measures implemented at MCHInstallation of high efficiency centrifuge chillers
Installation of a more efficient boiler
Optimization of vapor distribution network
Optimization of control panels
Installation of frequency variable speed drive units
Heat recovery from the medical air compressors
Montreal Chest Institute (MCI)
The Montreal Chest Institute project as a whole cost over $695,000. In this case, theMUHC focused on limiting the utilization of vapor to the laundry room, the kitchen andthe sterilization. Projects implemented at MCI are listed in the following table.

GHG Report 11
Table 4: Measures implemented at MCIConversion of the heating network at Pavilion J
Optimization of vapor production
Conversion of sanitary hot water production systems
Installation of a heating facility at Pavilion D
Weatherstripping of windows at Pavilion D
Montreal Neurological Hospital (MNH)
The Montreal Neurological Hospital project as a whole cost over $6.2 million. In order toreduce its environmental impact, MUHC has chosen to convert its heating system to a hotwater system and to divide the different vapor applications in the building (sterilization,labs, and humidification). Also, vapor coils were changed for hot water coils, which havemore capacity. Measures implemented at MNH are listed in the table below.
Table 5: Measures implemented at MNHConversion of heating system
Installation of a heat recovery system
Replacement of a sanitary hot water production system
Installation of a variable speed drive unit
Installation of a central control system
Montreal General Hospital (MGH)
The Montreal General Hospital project as a whole cost over $9.8 million. It was done intwo phases. Projects implemented at MGH are shown in the table below.
GHG Report 12
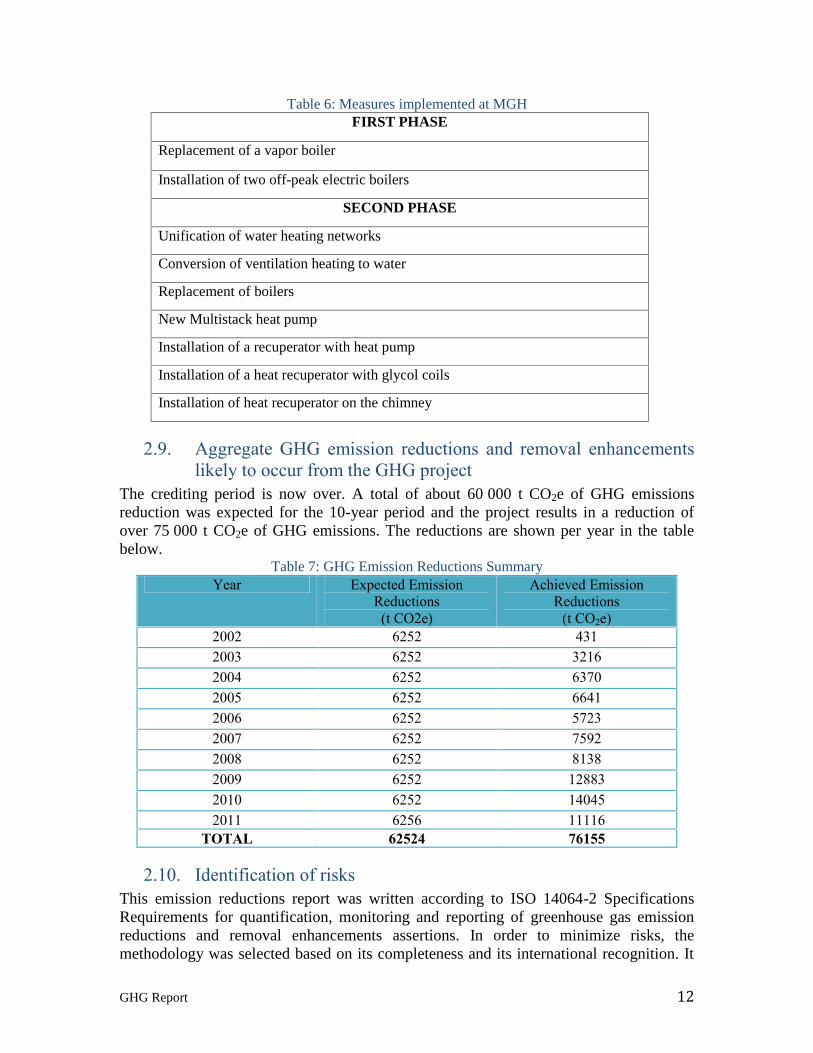
Table 6: Measures implemented at MGHFIRST PHASE
Replacement of a vapor boiler
Installation of two off-peak electric boilers
SECOND PHASE
Unification of water heating networks
Conversion of ventilation heating to water
Replacement of boilers
New Multistack heat pump
Installation of a recuperator with heat pump
Installation of a heat recuperator with glycol coils
Installation of heat recuperator on the chimney
2.9. Aggregate GHG emission reductions and removal enhancementslikely to occur from the GHG project
The crediting period is now over. A total of about 60 000 t CO2e of GHG emissionsreduction was expected for the 10-year period and the project results in a reduction ofover 75 000 t CO2e of GHG emissions. The reductions are shown per year in the tablebelow.
Table 7: GHG Emission Reductions SummaryYear Expected Emission
Reductions(t CO2e)
Achieved EmissionReductions
(t CO2e)2002 6252 4312003 6252 32162004 6252 63702005 6252 66412006 6252 57232007 6252 75922008 6252 81382009 6252 128832010 6252 140452011 6256 11116
TOTAL 62524 76155
2.10. Identification of risksThis emission reductions report was written according to ISO 14064-2 SpecificationsRequirements for quantification, monitoring and reporting of greenhouse gas emissionreductions and removal enhancements assertions. In order to minimize risks, themethodology was selected based on its completeness and its international recognition. It

GHG Report 13
was developed by the UNFCCC and published in 2007 for small scale projects.1 Noserious potential risks which could alter this GHG emissions reduction project wereidentified.
2.11. Roles and Responsibilities
2.11.1. Project proponent and representativeMr. Mohamed KhouchaneConseiller cadre - Gestion de la qualité et de la performanceMcGill University Health Centre2155 Guy, Suite 222Montreal (Québec),H3H 2R9Tel: (514) 934-1934 ext. [email protected]
2.11.2. Monitoring and data collectionThe McGill University Health Centre is responsible for the project implementation,emissions reduction and data monitoring. Mr. Khouchane is in charge of collecting thedata.
2.11.3. Quantification and reporting responsible entityL2I Financial Solutions is a firm specialized in non-traditional corporate financing. Anexpertise has been developed in the quantification of GHG emissions. Services areoffered for GHG inventory, GHG emissions reduction project implementation, GHGmarkets advising, regulatory requirements and much more.
Joséanne Bélanger-Gravel works at L2I as a carbon credits advisor. She has a mechanicalengineering degree from Université de Sherbrooke and EPF-École d’ingénieurs deSceaux in France. She also owns an engineering master degree on renewable energies andshe is about to complete a second master in environment with specialisation insustainable development. She is responsible for the update of the quantification.
Joséanne Bélanger-GravelCarbon credits advisorL2I Financial [email protected]
Mr. David Beaudoin works at L2I as director of environment and climate change services.He holds a Bachelor's Degree in Biotechnological Engineering from the University ofSherbrooke. During his career, Mr. Beaudoin has occupied several positions such asProcess Engineering Consultant, Project Manager in R&D and research assistant for
1 CDM, (2007). CDM methodology II.E/Version 10: Energy efficiency and fuel switching measures forbuildings, Internet link:http://cdm.unfccc.int/UserManagement/FileStorage/CDMWF_AM_LAVBAV8STPGYPWVKGQJLBCNEC8APNP

GHG Report 14
different environmental firms. He is responsible for the project report update based on theprevious versions. He also performs reviews of the monitored data and the GHG emissionreductions calculation.
David Beaudoin, B.Ing.Director, Environment & Climate changeL2I Financial [email protected] ext.31
Report Use and UsersThe target users are the potential offset VER (Verified Emission Reductions) buyers onthe voluntary carbon market.
Verification NotificationInitially quantified by L2I Financial Solutions, the verification of the VERs will beconducted by an external verification entity according to ISO 14064 part 3.
2.11.4. Authorized project contactChristine Lagacé is shareholder and vice-president of financial relations at L2I FinancialSolutions and has the signing authority for L2I. She is authorized by the projectproponent to perform requests and administrative tasks regarding the project registration.
Christine Lagacé, Adm.A.Vice-president, Financial relationsL2I Financial [email protected]
2.12. Project eligibility under the GHG programThe project is eligible under the GHG CleanProjectTM registry. It is implementedfollowing the ISO 14064-2 guidelines and principles, is not attempted to be registeredunder another GHG program and does not create any other environmental credit.
2.13. Environmental impact assessmentThe nature of the project does not involve a required environmental impact assessment asthe impact on the environment is limited to the GHG emissions.
2.14. Stakeholder consultations and mechanisms for on-goingcommunication
Mr. Mohamed Khouchane, Director of Technical Services at MUHC, is responsible forthe communications with the quantifier, the verifier and the MUHC’s board. Results areto be communicated to the board when they are verified.

GHG Report 15
2.15. Detailed chronological planThe project’s crediting period began on January 1st 2002 and ended on December 31st,2011. This is the fourth GHG report. The first was for the period from 2002 to 2008, asecond followed in 2009, and a third in 2010. Renewal of the crediting period will beassessed.

GHG Report 16
3. SELECTION OF THE BASELINE SCENARIO ANDASSESMENT OF ADDITIONALITY
The baseline scenario was selected among alternative scenarios representing what wouldhave happened without this project. If this grouped project had not been implemented, theconsumption of natural gas, oil and electricity would have been equivalent to whatexisted in 2001 or subsequent baseline years. This assumption is conservative since theelectricity demand is currently increasing significantly during the summer with theincreased demand for air conditioning.
Potential Baseline Scenarios:1. Status quo or keeping the current boilers, not changing the piping system and not
installing central controls, no thermal collectors, no wastewater heat recovery, andno energy switch;
2. Another scenario would be to replace the existing boilers, but not changing thepiping system and not installing a central control system. No changes for theother technologies mentioned above;
3. The project scenario includes the replacement of the less efficient boilers in placeby new efficient ones, physical modification of the piping system, installation of acentral control system and the implementation of energy efficiency measures.
The first option was considered realistic since, before the project started the boilers wereworking and usual maintenance work was necessary. The second scenario was evaluatedto be different from the first one in terms of efficiency, but there is still some energy losswith the old piping system in place and no central control to optimize the system. Thethird scenario has a financial barrier compared to the status quo, required for the analysisof the system, the modifications and the subsequent tasks. Finally, the financial barriersare significant for the third scenario and thus, this scenario is rejected as a baseline and isproposed as the project scenario.
The emission reductions achieved by the project are additional to what would haveoccurred in the absence of the GHG project since it is voluntary and faces significantinvestment barriers. Its implementation is highly motivated by the GHG emissionreductions potential.
In summary, baseline scenario: Using the inefficient boilers in place until their end-of-life utility, no physical
modification of the piping system and no central command; No switch of energy (steam to hot water) for heating mostly; No implementation of energy efficiency measures: i.e. Heat recovery from
domestic waste water.

GHG Report 17
4. IDENTIFICATION AND SELECTION OF GHGSOURCES, SINKS AND RESERVOIRS
The SSRs for the baseline and the project scenario are identified in the table below and itis stated whether they are included or excluded from the quantification.
Table 8: SSR inventorySource Incl/Excl?
Type ?Explanation
Baseline Fuel extraction,processing andtransport
ExcludedRelated
This emission source is assumed to be negligiblecompared to the combustion.
Emissions fromelectricityproduction
IncludedRelated
May be a significant source of greenhouse gasesdepending on the production means.
Fossil fuelcombustion
IncludedControlled
An important source of greenhouse gases.
ProjectFuel extraction,and processing
ExcludedRelated
This emission source is assumed to be negligiblecompared to the combustion.
Developing andinstallation of newtechnologies
ExcludedRelated
Installed equipments and technologies do notrequire significant amount of energy and do notcreate significant emissions
Emissions fromelectricityproduction
IncludedRelated
May be a significant source of greenhouse gasesdepending on the production means.
Fossil fuelcombustion
IncludedControlled
An important source of greenhouse gases.
Decommissioningof Equipments
Excluded Decommissioning of equipments activities of theproject are assumed to be negligible

GHG Report 18
5. QUANTIFICATION OF GHG EMISSIONS ANDREMOVALS
The clean development mechanism (CDM) provides an approved methodology: II.Eversion 10 – Energy efficiency and fuel switching measures for buildings 2 . Thismethodology is used as a guiding tool for the quantification.
The quantification method consists essentially of multiplying appropriate emissionfactors to the total consumption of different types of energy namely electricity, naturalgas and light fuel oil. However, the energy consumption is closely related to the heatingneeds and therefore to the weather conditions of a given year particularly in temperateregions like the province of Quebec. For accuracy purposes, it is therefore important toevaluate the effect of the weather conditions on the energy consumption and its relatedGHG emissions and emission reductions. The normalization procedure is intended to doso and is applied for this quantification. The normalization equations are outlined in thefollowing subsections.
Another element which might greatly influence the energy consumption is the size of thebuildings. Changes in buildings dimensions must be monitored and the impact on theenergy demand must be assessed. Once normalized for weather impact, the consumptionis then multiplied by the ratio of the buildings’ areas in baseline year to buildings’ areasin the year for which emissions are quantified. For the duration of this project, no changesin the area of the buildings are registered so the area parameter is not taken into account.
5.1. Baseline GHG emissions/removals
BSi, = Eelec,i,b + Eng,i,b + Efo,i,b
BSi,= Baseline Scenario emissions from building “i” (t CO2e)Eelec,i,b = Emissions associated with electricity use at building “i” in baseline year (t
CO2e)Eng,i,b= Emissions associated with natural gas combustion at building “i” in
baseline year (t CO2e)Efo,i,b= Emissions associated with light fuel oil combustion at building “i” in
baseline year (t CO2e)
Eelec,i,b = [EECO2 + (EECH4 * GWPCH4) + (EEN2O *GWPN2O)] * AQEi,b
Eng,i,b= [ENGCO2 + (ENGCH4 * GWPCH4) + (ENGN2O *GWPN2O)] * AQNGi,b
Efo,i,b= [EFOCO2 + (EFOCH4 * GWPCH4) + (EFON2O *GWPN2O)] * AQFOi,b
2 CDM, (2007). CDM methodology II.E/Version 10: Energy efficiency and fuel switching measures for buildings, p.1.Internet link:http://cdm.unfccc.int/UserManagement/FileStorage/CDMWF_AM_LAVBAV8STPGYPWVKGQJLBCNEC8APNP

GHG Report 19
AQEi,b = Adjusted (normalized) quantity of electricity consumed at building“i” in baseline year (kWh)
AQNGi,b = Adjusted (normalized) quantity of fossil fuel consumed at building“i” in baseline year (m3)
AQFOi,b = Adjusted (normalized) quantity of fossil fuel consumed at building“i” in baseline year (litres)
EECO2, EECH4, EEN2O = GHG emission factors for electricity (2g CO2/kWh;0,0002g CH4/kWh; 0,0001g N2O/kWh)3
ENGCO2, ENGCH4, ENGN2O = GHG emission factors for fossil fuel combustion(Natural Gas: 1878 g CO2/m
3, 0.037 g CH4/m3,
0.035 g N2O/m3)4
EFOCO2, EFOCH4, EFON2O = GHG emission factors for fossil fuel combustion(Light Fuel Oil: 2725 g CO2/L, 0.026 g CH4/L,0.031 g N2O/L)5
GWPCH4 = Global Warning Potential of methane (21)GWPN2O = Global Warning Potential of nitrous oxide (310)
AQEi,b = [0.3 + 0.7 *(HDDr/HDDb)] * QEi,b
AQNGi,b = [0.3 + 0.7 *(HDDr/HDDb)] * QNGi,b
AQFOi,b = [0.3 + 0.7 *(HDDr/HDDb)] * QFOi,b
QEi,b= Quantity of electricity consumed at building “i” in baselineyear (kWh)
QNGi,b= Quantity of natural gas consumed at building “i” in baselineyear (m3)
QFOi,b= Quantity of fossil fuel consumed at building “i” in baselineyear (litres)
HDDr= Heating Degree-day of a 30 years reference period6
HDDb= Heating Degree-day of the baseline year “b”
The above equation for weather-adjustment is the same wherever the weather-adjustedconsumption of energy is required and is taken from the VCS methodology7. In this case,degree-days data are from the Montreal Trudeau Airport weather station.
3 National Inventory Report 1990-2010, Greenhouse Gas Sources and Sinks in Canada, Part 3, Table A13-6, p.414 National Inventory Report 1990-2010, Greenhouse Gas Sources and Sinks in Canada, Part 2, pp.194-1955 National Inventory Report 1990-2010, Greenhouse Gas Sources and Sinks in Canada, Part 2, p.1966 Heating degree-days of each region are taken from Environment Canada weather office :http://climate.weatheroffice.gc.ca/climate_normals/stnselect_f.html?pageid=1&lang=f&province=QUE&provBut=Recherche7 VM0008 Methodology for Weatherization of Single and Multi-Family Buildings, p16; Internet link:http://www.v-c-s.org/VM0008.html

GHG Report 20
5.2. Project GHG emissions/removals
PSi,y = PSElec,i,y + PSng,i,y + PSfo,i,y
PSi,y= Project Scenario emissions for building “i” in year “y” (t CO2e)PSElec,i,y = Project Scenario emissions associated with electricity use for building “i”
in year “y” (t CO2e)PSNG,i,y = Project Scenario emissions associated with natural gas combustion for
building “i” in year “y” (t CO2e)PSFO,i,y = Project Scenario emissions associated with light fuel oil combustion for
building “i” in year “y” (t CO2e)
PSElec,i,y = [EECO2 + (EECH4 * GWPCH4) + (EEN2O *GWPN2O)] * APQEi,y
PSNG,i,y = [ENGCO2 + (ENGCH4 * GWPCH4) + (ENGN2O *GWPN2O)] * APQNGi,y
PSFO,i,y = [EFOCO2 + (EFOCH4 * GWPCH4) + (EFON2O *GWPN2O)] *APQFOi,y
APQEi,y = Project scenario adjusted (normalized) quantity of electricityconsumed for building “i” in year “y” (kWh)
APQNGi,y = Project scenario adjusted (normalized) quantity of natural gasconsumed for building “i” in year “y” (m3)
APQFOi,y = Project scenario adjusted (normalized) quantity of light fuel oilconsumed for building “i” in year “y” (litres)
APQEi,p = [0.3 + 0.7 *(HDDr/HDDb)] * QEi,y
APQNGi,p = [0.3 + 0.7 *(HDDr/HDDb)] * QNGi,y
APQFOi,p = [0.3 + 0.7 *(HDDr/HDDb)] * QFOi,y
QEi,y= Quantity of electricity consumed for project scenario atbuilding “i” in year “y” (kWh)
QNGi,y= Quantity of natural gas consumed for project scenario atbuilding “i” in year “y” (m3)
QFOi,y= Quantity of light fuel oil consumed for project scenario atbuilding “i” in year “y” (litres)
HDDr= Heating Degree-day of a 30 years reference period8
HDDy= Heating Degree-day of the year “y”
8 Idem 5.

GHG Report 21
5.3. Emission reductionsThese following equations illustrate the GHG emissions reduction quantification.
TPERy = Σ ERi,y
TPERy = Total Project Emission Reductions in year “y” (t CO2e)ERi,y = Emission reductions for building “i” in year “y” (t CO2e)
ERi,y = BSi, – PSi,y
GHG Report 22
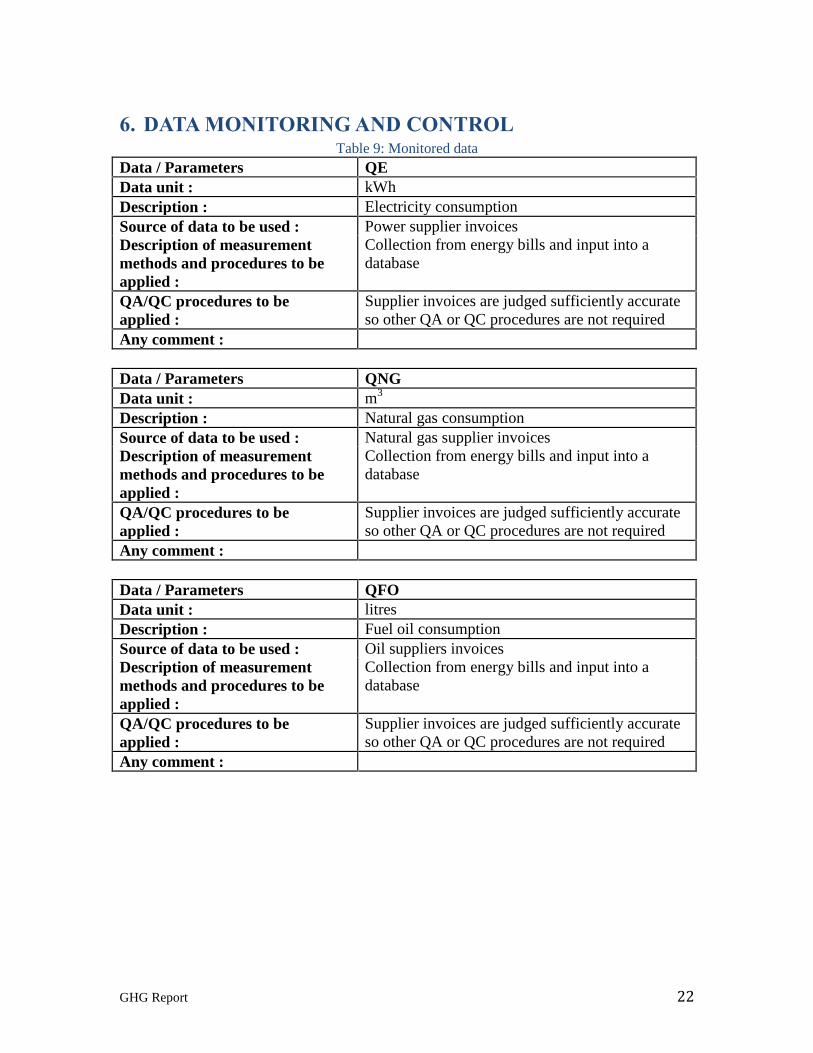
6. DATA MONITORING AND CONTROLTable 9: Monitored data
Data / Parameters QEData unit : kWhDescription : Electricity consumptionSource of data to be used : Power supplier invoicesDescription of measurementmethods and procedures to beapplied :
Collection from energy bills and input into adatabase
QA/QC procedures to beapplied :
Supplier invoices are judged sufficiently accurateso other QA or QC procedures are not required
Any comment :
Data / Parameters QNGData unit : m3
Description : Natural gas consumptionSource of data to be used : Natural gas supplier invoicesDescription of measurementmethods and procedures to beapplied :
Collection from energy bills and input into adatabase
QA/QC procedures to beapplied :
Supplier invoices are judged sufficiently accurateso other QA or QC procedures are not required
Any comment :
Data / Parameters QFOData unit : litresDescription : Fuel oil consumptionSource of data to be used : Oil suppliers invoicesDescription of measurementmethods and procedures to beapplied :
Collection from energy bills and input into adatabase
QA/QC procedures to beapplied :
Supplier invoices are judged sufficiently accurateso other QA or QC procedures are not required
Any comment :
GHG Report 23
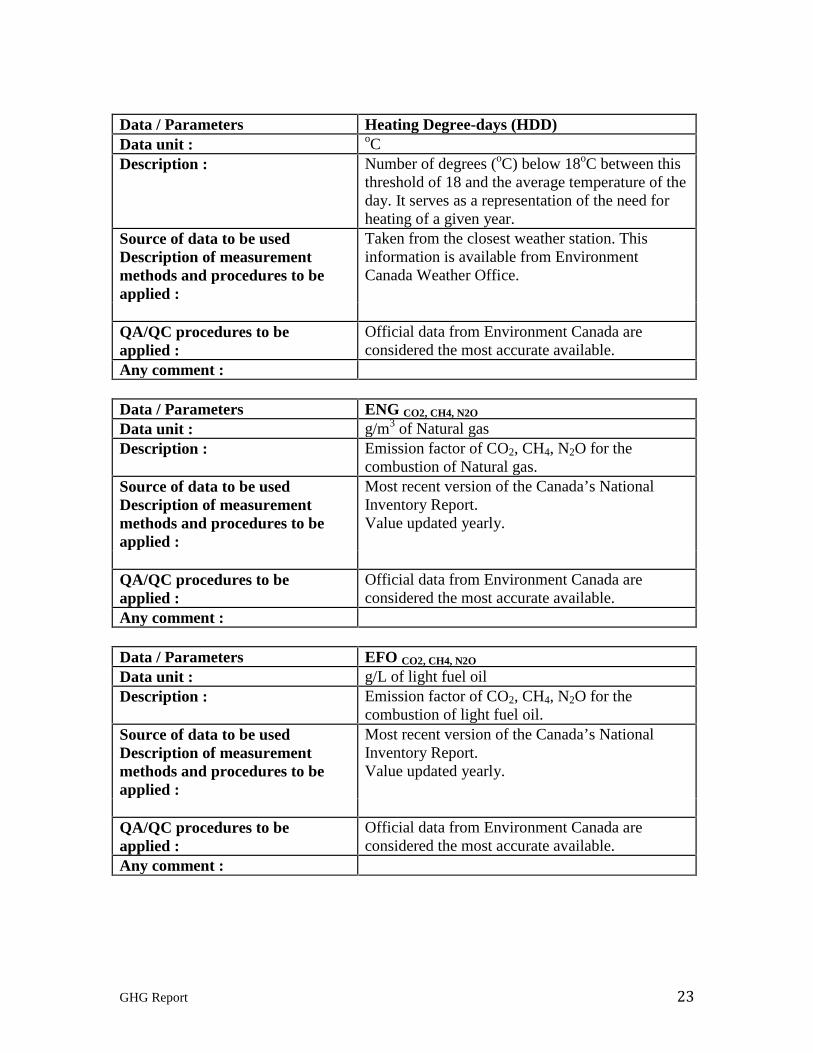
Data / Parameters Heating Degree-days (HDD)Data unit : oCDescription : Number of degrees (oC) below 18oC between this
threshold of 18 and the average temperature of theday. It serves as a representation of the need forheating of a given year.
Source of data to be usedDescription of measurementmethods and procedures to beapplied :
Taken from the closest weather station. Thisinformation is available from EnvironmentCanada Weather Office.
QA/QC procedures to beapplied :
Official data from Environment Canada areconsidered the most accurate available.
Any comment :
Data / Parameters ENG CO2, CH4, N2O
Data unit : g/m3 of Natural gasDescription : Emission factor of CO2, CH4, N2O for the
combustion of Natural gas.Source of data to be usedDescription of measurementmethods and procedures to beapplied :
Most recent version of the Canada’s NationalInventory Report.Value updated yearly.
QA/QC procedures to beapplied :
Official data from Environment Canada areconsidered the most accurate available.
Any comment :
Data / Parameters EFO CO2, CH4, N2O
Data unit : g/L of light fuel oilDescription : Emission factor of CO2, CH4, N2O for the
combustion of light fuel oil.Source of data to be usedDescription of measurementmethods and procedures to beapplied :
Most recent version of the Canada’s NationalInventory Report.Value updated yearly.
QA/QC procedures to beapplied :
Official data from Environment Canada areconsidered the most accurate available.
Any comment :

GHG Report 24
Data / Parameters EE CO2, CH4, N2O
Data unit : g/kWhDescription : Emission factor of CO2, CH4, N2O for use of
electricitySource of data to be usedDescription of measurementmethods and procedures to beapplied :
Most recent version of the Canada’s NationalInventory Report.Value updated yearly.
QA/QC procedures to beapplied :
Official data from Environment Canada areconsidered the most accurate available.
Any comment :

GHG Report 25
7. REPORTING AND VERIFICATION DETAILS
The project plan and report is prepared in accordance with ISO 14064-2 standard and theGHG CleanProjectTM program requirements. The methodology that is used, the choice ofregion specific emission factors and a rigorous monitoring plan allow for a reasonablylow level of uncertainty. L2I Solutions is confident that the emission reductions are notoverestimated and that the numbers of emission reductions that are reported here are realand reflect the actual impacts of the project.
The GHG report is prepared in accordance with ISO 14064-2 and GHG CleanProjectsTM
requirements. Emission reductions will be verified by an independent third party to areasonable level of assurance. Raymond Chabot Grant Thornton will be the verifyingfirm for this reporting period and will verify in conformance with ISO 14064-3. Emissionreductions are reported here for the year 2011.
Table 10: Baseline scenario GHG emissions in 2011 (t CO2e)RVH+MNH MCH MGH MCI TOTAL
Naturalgas
CO2 17 433 7 644 9 548 1 507CH4 7 3 3 0N2O 100 44 55 8Total 17 540 7 691 9 606 1 515 36 352
Electricity CO2 76 27 62 5CH4 0 0 0 0N2O 0 0 0 0Total 76 27 62 5 170
Light fueloil
CO2 332 219 964 0CH4 0 0 0 0N2O 1 0 3 0Total 333 219 967 0 1 519
TOTAL 17 949 7 937 10 635 1 520 38 041

GHG Report 26
Table 11: Project scenario GHG emissions in 2012 (t CO2e)RVH+MNH MCH MGH MCI TOTAL
Naturalgas
CO2 14 374 5 345 5 807 1 033CH4 6 3 3 1N2O 84 31 34 6Total 14 464 5 379 5 844 1 040 26 727
Electricity CO2 68 32 79 9CH4 1 1 1 1N2O 2 1 2 1Total 71 34 82 11 198
Light fueloil
CO2 0 0 0 0CH4 0 0 0 0N2O 0 0 0 0Total 0 0 0 0 0
TOTAL 14 535 5 413 5 926 1 051 26 925
Table 12: GHG emission reductions in 2011 (t CO2e)RVH+MNH MCH MGH MCI TOTAL
Baselineemissions 17 949 7 937 10 635 1 520 38 041Project emissions 14 535 5 413 5 926 1 051 26 925Emissionreductions 3 414 2 524 4 709 469 11 116

Appendix 2 – Conflict of interest review checklist

Conflict of interest review checklist
The verifier and the verification team must ensure that they are truly independent from the project, project proponent(s), quantifier, and/or other agents related to the project. The verifier shall avoid any actual or potential conflicts of interest with the project proponent and the intended users of the GHG information.
Client name: McGill University Health Center
Report identification: Verification report on a Greenhouse Gas Emissions (“GHG”) reduction project – Energy efficiency measures for GHG emissions reductions
Date of report: December 5, 2012
Professional: Roger Fournier, CPA, CA, Lead Verifier
I confirm the following:
Yes No Details
Independence
I remained independent of the activity being verified, and free from bias and conflict of interest.
I maintained objectivity throughout the verification to ensure that the findings and conclusions will be based on objective evidence generated during the verification.
Ethical conduct
I have demonstrated ethical conduct through trust, integrity, confidentiality and discretion throughout the verification process.
Fair presentation
I have reflected truthfully and accurately verification activities, findings, conclusions and reports.
I have reported significant obstacles encountered during the verification process, as well as unresolved, diverging opinions among verifiers, the responsible party and the client.
Due professional care
I have exercised due professional care and judgment in accordance with the importance of the task performed and the confidence placed by clients and intended users.
I have the necessary skills and competences to undertake the verification.
Signature Date
ls48
Roger Fournier
ls48
Texte tapé à la machine
December 5, 2012
ls48
Texte tapé à la machine

![MUHC Department of Pediatrics - McGill University · J Neurooncol 86(1):101-8, 2008 [Electronically published in 2007]. Peer-Reviewed Article PubMed: 17619825 V Page 3 of 34 * Note:](https://static.fdocuments.net/doc/165x107/5e7bcb35968f7676557cd1dd/muhc-department-of-pediatrics-mcgill-university-j-neurooncol-861101-8-2008.jpg)


