
MBAA EMPLOYMENT REPORT · MBA EMPLOYMENT REPORT TUCK SCHOOL OF BUSINESS AT DARTMOUTH 2019 A TUCK...
12
MBA EMPLOYMENT REPORT TUCK SCHOOL OF BUSINESS AT DARTMOUTH 2019
Transcript of MBAA EMPLOYMENT REPORT · MBA EMPLOYMENT REPORT TUCK SCHOOL OF BUSINESS AT DARTMOUTH 2019 A TUCK...

M B AE M P L O Y M E N T
R E P O R T
TUCK SCHOOL OF BUSINESSAT DARTMOUTH
2019
M B AE M P L O Y M E N T
R E P O R T
TUCK SCHOOL OF BUSINESSAT DARTMOUTH
2019

2
MESSAGE FROM THE EXECUTIVE DIRECTOR
A Tuck education is transformative in many ways—from the trans-formative impact our graduates have on organizations and broader society to the way the experience transforms our students’ lives and careers.
The record-breaking employment results of the class of 2019 are a powerful example of the latter. Ninety-eight percent of Tuck’s newest graduates received job offers within three months of gradu-ating, nearing our all-time record of 99 percent offers for the same time frame. Just as inspiring is the record-high compensation they received. Median total compensation for our 2019 graduates soared to $170,000, from $155,000 a year prior, with the mean first-year base salary and signing bonus totaling $169,947.
A tremendous amount of effort goes into these numbers, and I am proud of the role our Career Services team plays in this success, as well as the distinctive approach we bring to supporting every MBA student as they take the next step in their career journey.
Our career advisers are industry experts, many of whom have worked at the same leading organi-zations our students seek to join. The generous size of our advising team ensures we have the time and ability to get to know each student individually and to work with them side by side. A new and noteworthy addition to this team in the last year is Laura Mogilner T’08. As Tuck’s first dedicated West Coast career adviser, Laura works with students interested in the tech industry from her home base in San Francisco and connects them with Tuck’s strong network of Bay Area alumni and re-cruiters.
In addition to building relationships with students, our team also maintains and cultivates collabo-rative relationships with the world’s most desirable MBA employers. As industry trends and student preferences evolve, we continually work to grow this list and provide students with the most reward-ing opportunities.
Finally, we are fortunate at Tuck to have the world’s most responsive and loyal alumni network. Our graduates are extraordinarily accomplished and deeply invested in our students’ success, helping Tuck MBAs learn about—and gain entry into—their fields and their companies.
Indeed, when these elements come together, it is no surprise that our students achieve such great success in recruiting. Tuck’s mission of developing wise, decisive leaders who better the world through business is one our team takes to heart, and I look forward to seeing the impact our talent-ed 2019 graduates will have on the world in the years to come.
Sincerely,
Stephen Pidgeon T'07Executive Director, Career ServicesTuck School of Business at Dartmouth

3
TUCK CLASS OF 2019FULL-TIME EMPLOYMENTCLASS OF 2019 COMPENSATION SUMMARY
TYPEANNUAL BASE SALARYSIGNING BONUS
RECEIVING (%)100
88
MEAN ($)139,046
30,901
MEDIAN ($)140,000
30,000
MAX ($)200,000
90,000
MIN ($)38,505
3,000
Compensation information is self-reported. Salary data was obtained from 90% of thosegraduates who were seeking employment and accepted a job offer by 3 months after graduation.
CLASS OF 2019 EMPLOYMENT, BY INDUSTRY
CONSULTINGFINANCIAL SERVICESTECHNOLOGYHEALTH CARE, PHARMA, BIOTECHMANUFACTURINGCONSUMER GOODS, RETAILREAL ESTATE TRANSPORTATIONMEDIA, ENTERTAINMENT, SPORTSGOVERNMENT, NONPROFIT, EDUCATIONHOSPITALITY ENERGY
CLASS OF 2019 OFFERS AND ACCEPTANCES, AT 3 MONTHS AFTER GRADUATION
GRADUATESU.S. PERMANENT WORK AUTHORIZATIONNON-PERMANENT WORK AUTHORIZATION (U.S.)TOTAL GRADUATES SEEKING JOBS
SEEKING JOBS183
66249
%989798
#179
64243
%929593
#168
63231
OFFERS ACCEPTANCES
The graduation date for the full-time MBA class of 2019 was June 9, 2019.
38%24%19%
5%4%4%2%2%1%1%1%1%
CONSULTINGFINANCEGENERAL MANAGEMENTMARKETINGOPERATIONS, LOGISTICSOTHERHUMAN RESOURCES
44%17%15%10%
7%7%1%
CLASS OF 2019 EMPLOYMENT, BY JOB FUNCTION
Values that are greater than 0 but less than 1 are rounded to 1 to show presence. Numbers may not add to 100 due to rounding.
Values that are greater than 0 but less than 1 are rounded to 1 to show presence. Numbers may not add to 100 due to rounding.
Tuck’s career services team, vast corporate network,and supportive alumni combine to offer you extraor-dinary opportunities from more than 1,000 compa-nies and organizations.

4
BASE SALARIES, BY LOCATION
LOCATIONUNITED STATESNORTHEAST (CT, ME, MA, NH, NJ, NY, RI, VT) BOSTON NEW YORK OTHERWEST (AK, CA, HI, ID, MT, NV, OR, UT, WA, WY) SAN FRANCISCO SEATTLE OTHERMIDWEST (IL, IN, IA, KS, MI, MN, MO, NE, ND, OH, SD, WI) CHICAGO MINNEAPOLIS-ST. PAUL OTHERMID-ATLANTIC (DC, DE, MD, PA, VA, WV)SOUTHWEST (AZ, CO, NM, OK, TX)SOUTH (AL, AR, FL, GA, KY, LA, MI, NC, SC, TN)OUTSIDE U.S.ASIACENTRAL AMERICA, CARIBBEANSOUTH AMERICAEUROPECANADAAFRICAALL LOCATIONS
PERCENT (%)90543022
215
7538611651
10422111
100
MEDIAN145,000150,000145,000150,000130,000140,000141,000136,000133,500150,000163,750152,500125,000125,000150,000
*108,160129,785
81,05292,839
107,781**
140,000
MEAN142,329141,785142,381141,664133,750142,174147,279141,000130,700148,026152,679152,500123,333135,892139,750
*106,217124,324
81,40292,839
105,793**
139,046
MAX200,000200,000200,000170,000150,000180,000180,000165,000150,000170,000170,000165,000125,000165,000170,000
*135,000135,000125,000103,322108,160
**
200,000
MIN80,00080,00080,00092,000
125,000114,400114,400118,000115,000115,000115,000140,000120,000109,700105,000
*38,50597,46138,50582,356
101,438**
38,505
BASE SALARY ($)
BASE SALARIES, BY INDUSTRY
INDUSTRYCONSULTINGFINANCIAL SERVICES INVESTMENT BANKING PRIVATE EQUITY, VENTURE CAPITAL INVESTMENT MANAGEMENT OTHERTECHNOLOGYHEALTH CARE, PHARMA, BIOTECHMANUFACTURINGCONSUMER GOODS, RETAILREAL ESTATETRANSPORTATIONMEDIA, ENTERTAINMENT, SPORTSGOVERNMENT, NONPROFIT, EDUCATIONHOSPITALITY ENERGYALL INDUSTRIES
PERCENT (%)3824
9438
19544221111
100
MEDIAN165,000145,000150,000147,500135,000125,000126,000130,000120,000130,000127,500
*****
140,000
MEAN152,522136,098146,588141,667136,250121,900128,499130,400120,652125,933125,359
*****
139,046
MAX170,000200,000150,000200,000150,000170,000180,000145,000140,000140,000145,000
*****
200,000
MIN53,67338,50592,00095,000
125,00038,50580,000
115,000104,685105,000101,438
*****
38,505
BASE SALARY ($)
FUNCTIONCONSULTINGFINANCE INVESTMENT BANKING PRIVATE EQUITY, VENTURE CAPITAL CORPORATE FINANCE INVESTMENT MANAGEMENT RESEARCH REAL ESTATE PRIVATE WEALTH MANAGEMENTGENERAL MANAGEMENTMARKETING OPERATIONS, LOGISTICSOTHERHUMAN RESOURCESALL FUNCTIONS
PERCENT (%)4417
8321111
1510
771
100
MEDIAN160,000150,000150,000123,219130,000135,000
***
125,000120,000130,000132,500
*140,000
MEAN150,359139,346147,941133,573130,000136,667
***
126,145123,095126,305129,883
*139,046
MAX170,000200,000150,000200,000150,000150,000
***
145,000180,000140,000175,000
*200,000
MIN53,67395,000
115,00095,000
110,000125,000
***
116,00080,000
104,86538,505
*38,505
BASE SALARY ($)
BASE SALARIES, BY FUNCTION
TUCK CLASS OF 2019BASE SALARIES
Our extraordinarily distinguished, loyal, and supportive global network of alumni is deeply invested in Tuck’s success and yours.
Values are excluded where the sample size is too small. Values that are greater than 0 but less than 1 are rounded to show presence. Totals may not add to 100 due to rounding. City names listed include the surrounding
metropolitan areas. All data as of October 2019.
5
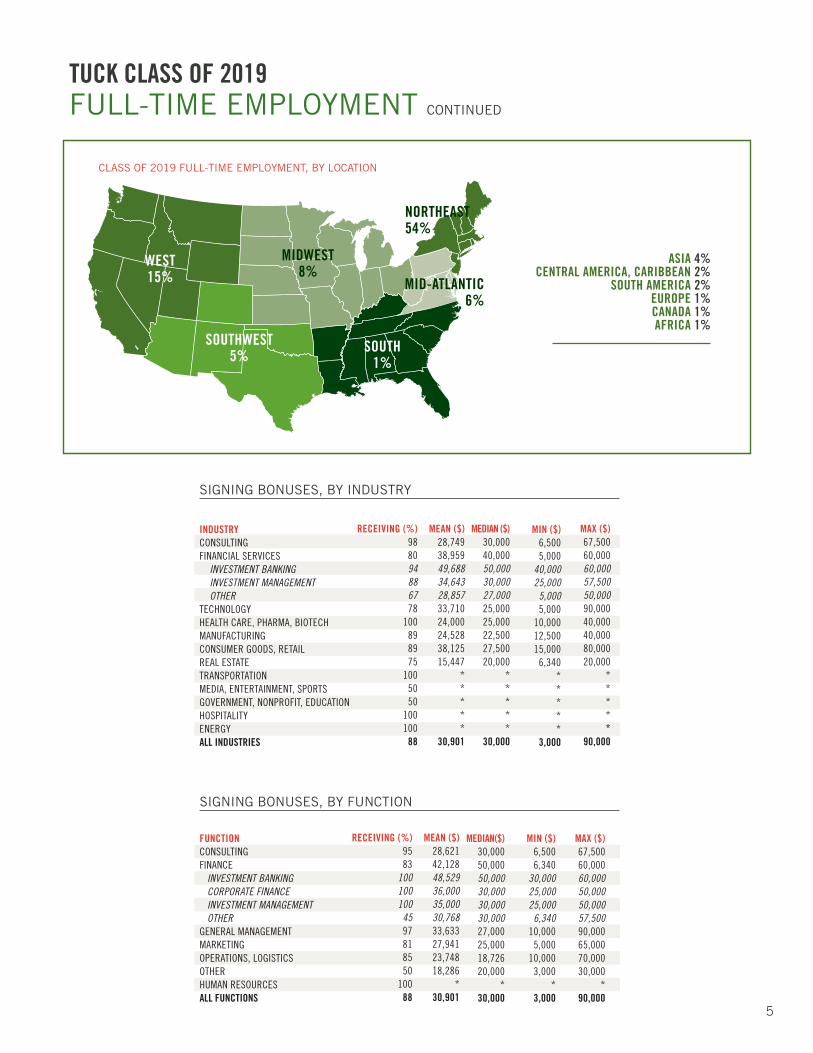
CLASS OF 2019 FULL-TIME EMPLOYMENT, BY LOCATION
WEST15%
NORTHEAST54%
SOUTHWEST5%
MIDWEST8%
ASIA 4%CENTRAL AMERICA, CARIBBEAN 2%
SOUTH AMERICA 2% EUROPE 1%CANADA 1%AFRICA 1%
SOUTH1%
MID-ATLANTIC6%
TUCK CLASS OF 2019FULL-TIME EMPLOYMENT CONTINUED
SIGNING BONUSES, BY INDUSTRY
MAX ($)67,50060,00060,00057,50050,00090,00040,00040,00080,00020,000
*****
90,000
MIN ($)6,5005,000
40,00025,000
5,0005,000
10,00012,50015,000
6,340*****
3,000
FUNCTIONCONSULTINGFINANCE INVESTMENT BANKING CORPORATE FINANCE INVESTMENT MANAGEMENT OTHERGENERAL MANAGEMENTMARKETING OPERATIONS, LOGISTICSOTHERHUMAN RESOURCESALL FUNCTIONS
RECEIVING (%)9583
100100100
4597818550
10088
MEDIAN($)30,00050,00050,00030,00030,00030,00027,00025,00018,72620,000
*30,000
MEAN ($)28,62142,12848,52936,00035,00030,76833,63327,94123,74818,286
*30,901
MAX ($)67,50060,00060,00050,00050,00057,50090,00065,00070,00030,000
*90,000
MIN ($)6,5006,340
30,00025,00025,000
6,34010,000
5,00010,000
3,000*
3,000
SIGNING BONUSES, BY FUNCTION
INDUSTRYCONSULTINGFINANCIAL SERVICES INVESTMENT BANKING INVESTMENT MANAGEMENT OTHERTECHNOLOGY HEALTH CARE, PHARMA, BIOTECHMANUFACTURINGCONSUMER GOODS, RETAILREAL ESTATETRANSPORTATIONMEDIA, ENTERTAINMENT, SPORTSGOVERNMENT, NONPROFIT, EDUCATIONHOSPITALITYENERGYALL INDUSTRIES
RECEIVING (%)988094886778
100898975
1005050
100100
88
MEDIAN ($)30,00040,00050,00030,00027,00025,00025,00022,50027,50020,000
*****
30,000
MEAN ($)28,74938,95949,68834,64328,85733,71024,00024,52838,12515,447
*****
30,901

6
TUCK CLASS OF 2019INTERNATIONAL STUDENTS
BASE SALARIES, BY FUNCTION [INTERNATIONAL STUDENTS ONLY]
FUNCTIONCONSULTINGFINANCE INVESTMENT BANKING CORPORATE FINANCE RESEARCH REAL ESTATE PRIVATE WEALTH MANAGEMENTGENERAL MANAGEMENTMARKETINGOPERATIONS, LOGISTICSOTHERALL FUNCTIONS
PERCENT (%)5314
54222
14974
100
MEDIAN151,000127,500150,000
****
132,500124,000130,000
*135,000
MEAN141,169133,750138,333
****
132,750133,500126,850
*135,184
MAX165,000170,000150,000
****
145,000180,000133,000
*180,000
MIN56,673
110,000115,000
****
120,000110,000114,400
*38,505
BASE SALARY ($)
LOCATIONUNITED STATESNORTHEAST (CT, ME, MA, NH, NJ, NY, RI, VT) BOSTON NEW YORK OTHERWEST (AK, CA, HI, ID, MT, NV, OR, UT, WA, WY) SAN FRANCISCO SEATTLE OTHERMIDWEST (IL, IN, IA, KS, MI, MN, MO, NE, ND, OH, SD, WI) CHICAGO MINNEAPOLIS-ST. PAUL OTHERMID-ATLANTIC (DC, DE, MD, PA, VA, WV)SOUTHWEST (AZ, CO, NM, OK, TX)OUTSIDE UNITED STATESASIACENTRAL AMERICA, CARIBBEANSOUTH AMERICAEUROPEAFRICAALL LOCATIONS
PERCENT (%)77402316
216
772
1172254
2311
5422
100
MEDIAN140,000150,000150,000150,000
*133,000149,000136,000
*165,000165,000
**
165,000*
140,000129,785
53,673***
135,000
MEAN144,407147,065149,692145,167
*139,600148,100136,000
*149,167152,500
**
151,667*
103,968127,855
66,870***
135,184
MAX180,000170,000165,000170,000
*180,000180,000142,000
*165,000165,000
**
165,000*
135,000135,000108,432
***
180,000
MIN110,000111,500124,000111,500
*114,400114,400130,000
*115,000115,000
**
125,000*
38,505110,000
38,505***
38,505
BASE SALARY ($)
BASE SALARIES, BY LOCATION [INTERNATIONAL STUDENTS ONLY]
BASE SALARY ($)
BASE SALARIES, BY INDUSTRY [INTERNATIONAL STUDENTS ONLY]
PERCENT (%)531412
427554421
100
MEAN141,002135,875126,215150,000125,000114,626126,333125,500
****
135,184
MAX165,000180,000170,000200,000200,000200,000135,000135,000
****
180,000
MEDIAN151,000131,500125,000140,000140,000140,000124,000130,000
****
135,000
MIN53,673
110,00038,50538,50538,50538,505
120,000111,500
****
38,505
INDUSTRYCONSULTINGTECHNOLOGYFINANCIAL SERVICES INVESTMENT BANKING INVESTMENT MANAGEMENT OTHERHEALTH CARE, PHARMA, BIOTECHCONSUMER GOODS, RETAILMANUFACTURINGREAL ESTATETRANSPORTATIONENERGYALL INDUSTRIES
Values are excluded where the samplesize is too small. Values that are greater than 0 but less than 1 are rounded to show presence. Totals may not add to 100 due to rounding. City names listed include the surrounding
metropolitan areas. All data as of October 2019.
From the Consulting Club to the Entre-preneurship Club, there are a number of extracurricular opportunities for students to further explore their career interests.

7
CLASS OF 2019 FULL-TIME EMPLOYERS
Anheuser-Busch InBevAccentureActivision BlizzardAdobeAEW Capital Management, L.P.Altman Vilandrie & CompanyAmazonAmerican ExpressAmerican Tower CorporationAmerican WellAmgenAnalysis GroupAzevtecBain & CompanyBank of America SecuritiesBarclaysBird RidesBoston Consulting GroupBreakaway VenturesCapital OneCaterpillarCelonisCernerChaseChewyciitizenCitiColgate-PalmoliveCollins AerospaceComcastCorningCredit SuisseDanaherDanoneDartmouth-Hitchcock Medical CenterDatavantDeloitteDoblinDuPonteBayEcolabEdwards LifesciencesEvercore PartnersExeter Property GroupEY-ParthenonFidelity InvestmentsFitch SolutionsFortiveGaleraGenpatGM CruiseGoldman Sachs
Google Inc.Harris WilliamsHomeAwayhomebaseHuron Consulting GroupIBMInvestor Group Services (IGS)InnosightiRobotJ.P. MorganKaideeL.E.K. ConsultingLazardLiberty MutualLinkedInLyra HealthMarathon CapitalMcKinsey & CompanyMetLifeMicrosoftModern MeadowMorgan StanleyNautic PartnersNew BalanceOliver WymanOpenview Venture PartnersPalo Alto NetworksPharma CCXPimcoPiper JaffrayPricewaterhouseCoopersProvidence Health & ServicesRidgewood InfrastructureSamsungSearch Fund AcceleratorsessionMTamrThe Bridgespan GroupThe Chartis GroupVanguardThermo Fisher ScientificTRINITYTripAdvisorUberUBSuCardiaUlysses HoldingsUnitedHealth GroupValor PerformanceWalmartWayfairZiff Davis

8
TUCK CLASS OF 2020SUMMER INTERNSHIPS
BASE MONTHLY SALARY ($)
BASE MONTHLY SALARIES, BY INDUSTRY
INDUSTRYCONSULTING FINANCIAL SERVICES
INVESTMENT BANKING PRIVATE EQUITY, VENTURE CAPITAL INVESTMENT MANAGEMENT OTHER
TECHNOLOGYCONSUMER GOODS, RETAILHEALTH CARE, PHARMA, BIOTECHMANUFACTURINGMEDIA, ENTERTAINMENT, SPORTSTRANSPORTATIONENERGYGOVERNMENT, NONPROFIT, EDUCATIONREAL ESTATEALL INDUSTRIES
PERCENT (%)282711
744
1787632111
100
MEAN12,515
9.23711,777
5,1649,8118,3107,9927,5007,6598,0475,8644,7247,116
**
9,553
BASE MONTHLY SALARIES, BY FUNCTION
FUNCTIONCONSULTINGFINANCE
INVESTMENT BANKING PRIVATE EQUITY, VENTURE CAPITAL INVESTMENT MANAGEMENT CORPORATE FINANCE PRIVATE WEALTH MANAGEMENT RESEARCH REAL ESTATE
MARKETING GENERAL MANAGEMENTOTHEROPERATIONS, LOGISTICSINFORMATION TECHNOLOGYHUMAN RESOURCESALL FUNCTIONS
PERCENT (%)332511
643111
2210
6311
100
MEDIAN13,00010,15112,500
4,8009,7507,475
***
8,0008,5008,0007,500
**
9,533
MEAN12,112
9,31511,832
5,0369,1307,437
***
7,4548,3757,1536,725
**
9,553
MAX13,75013,54113,54112,50010,833
9,208***
14,86913,50010,058
9,533**
14,869
MIN4,000
9278,533
9274,3336,067
***
1,6004,0001,4281,667
**
927
BASE MONTHLY SALARY ($)
MAX13,75013,54113,54113,00010,74712,50010,83314,869
9,58310,000
9,4036,5008,333
**
14,869
MEDIAN13,05010,30312,500
5,1009.9209,1008.2007,8008,0008,5005,0274,4918,333
**
9,533
MIN4,333
9278,533
9278,6673,0002,0001,6004,0004,3334,0003,4114,680
**
927
LOCATIONUNITED STATESNORTHEAST (CT, ME, MA, NH, NJ, NY, RI, VT)
BOSTON NEW YORK OTHERWEST (AK, CA, HI, ID, MT, NV, OR, UT, WA, WY)
SAN FRANCISCO SEATTLE OTHERMIDWEST (IL, IN, IA, KS, MI, MN, MO, NE, ND, OH, SD, WI)
CHICAGO MINNEAPOLIS-ST. PAUL OTHERMID-ATLANTIC (DC, DE, MD, PA, VA, WV)SOUTHWEST (AZ, CO, NM, OK, TX)SOUTH (AL, AR, FL, GA, KY, LA, MI, NC, SC, TN)OUTSIDE U.S.ASIAEUROPESOUTH AMERICACANADAALL LOCATIONS
PERCENT (%)92472619
32311
76832264483311
100
MEDIAN9,558
10,83310,83312,500
4,1678,6678,3208,9299,4659,210
12,5008,7928,8549,920
13,2509,1678,8779,4388,9503,783
*9,533
MEAN9,744
10,04910,40210,413
5,3488,8148,2999,1419,683
10,24511,026
9,9619,3569,355
10,7209,5857,5227,0278,3195,251
*9,553
MAX14,86913,75013,75013,750
9,53314,86913,70013,75014,86913,75013,75013,50013,50013,75013,75013,75010,94410,306
9,6398,558
*14,869
MIN1000
1,6002,4002,0001,6001,0001,0004,8004,0007.3857,9087,3857,7654,3331,4283,987
927927
3,0003,411
*927
BASE MONTHLY SALARY ($)
BASE MONTHLY SALARIES, BY LOCATION
Values are excluded where the samplesize is too small. Values that are greater than 0 but less than 1 are rounded to show presence. Totals may not add to 100 due to rounding. City names listed include the surrounding
metropolitan areas. All data as of October 2019.
As part of TuckGO, Tuck’s global learning program, all students must take an experiential learning course in a country that is new to them.

9
A.T. KearneyAdobeAltman Vilandrie & CompanyAmazonAmerican WellAnalysis GroupArcLight CapitalAudax Private EquityBain & CompanyBank of America SecuritiesBarclaysBertelsmann Asia InvestmentsBill & Melinda Gates FoundationBiogen IdecBlackRockBoston Consulting GroupBoulder CareBristol-Myers SquibbBrooks SportsCaaStleCambridge AssociatesCamp Six LabsCarbon BlackChewyCIC CapitalCitiColgate-PalmoliveColumbia Wanger Asset ManagementComcastConverseCorningCreatorlandCredit KarmaCredit SuisseCurologyCVS HealthDanaherDBL VenturesDell TechnologiesDeloitteDuPontEcolabEDP RenewablesEli Lilly and CompanyEnvivaEY-ParthenonFarmers Business NetworkFidelity Investments
Fifth Wall VenturesFortiveGoldman SachsGoodwater CapitalGoogleGraham CapitalGraham PartnersGreenSkyHarris WilliamsHearst CorporationHoulihan LokeyHPHubSpotHyperthermIDEOInvestor Group Services (IGS)Indigo AgricultureIngenuity FoodsInnosightIn-Q-TelIora HealthJ.M. Huber CorporationJ.P. MorganKraft Analytics GroupL.E.K. ConsultingLand O'LakesLazardLDV CapitalLiberty MutualLidyaLong Path PartnersMacquarie CapitalMaine Venture FundMars & CoMcKinsey & CompanyMetLifeMicrosoftMorgan StanleyNBC UniversalNew BalanceNew RelicNextEra EnergyNikeNordicaNorthwestern Mutual CapitalOptumPalm Drive CapitalParker Ranch
PayoneerPegasystemsPill ClubImpact First InvestmentsPizza HutPJT Partnersplain vanillaQuantified VenturesRevolvRobert W. Baird & CompanySamsungSanofiSchool of RockSegmentSiguler GuffSirius Investment AdvisorsSlackSnap Inc.Stanford Health CareStarwood Capital GroupTakeoff TechnologiesThe Honest CompanyVanguardToastTomTomTransfixTrilogy Search PartnersTRINITYTruland HomesUberUBSUnitedHealth GroupUrban Leaders FellowshipVBI VaccinesVisaWag!Warner BrothersWayfairWellWellington Management CompanyWestern DigitalWeWorkWilliam BlairWolverine WorldwideWWEZiff Davis
CLASS OF 2020 INTERNSHIP EMPLOYERS
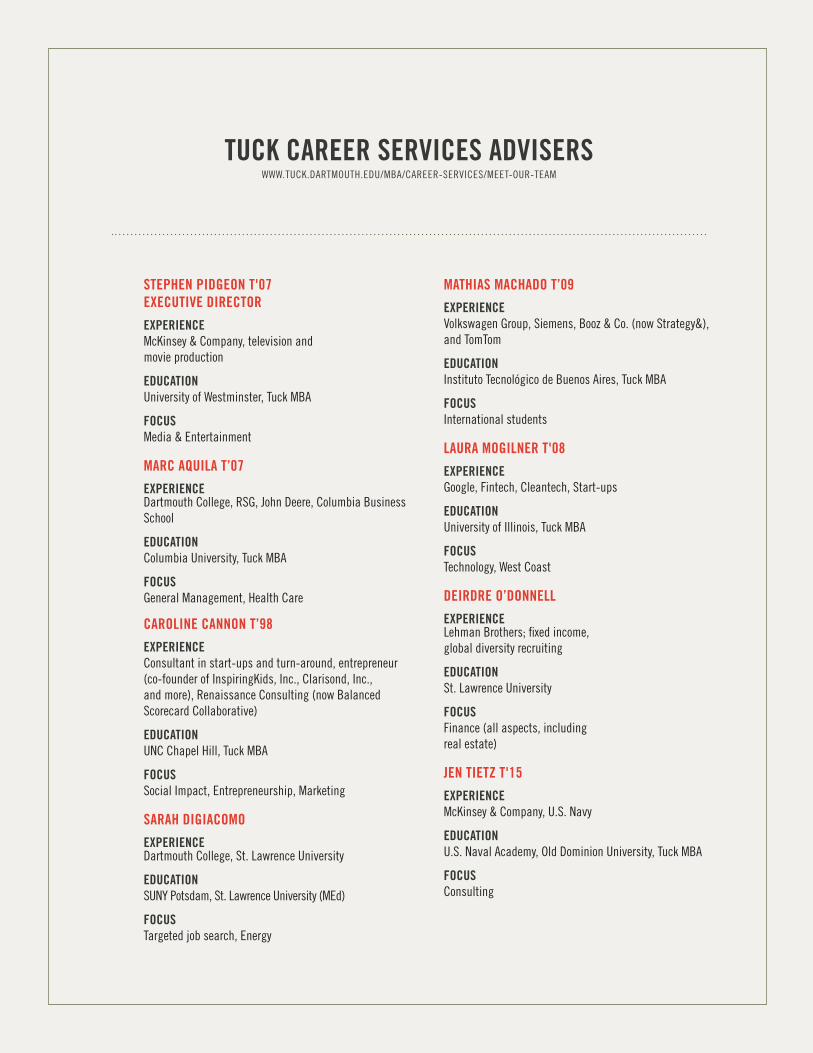
TUCK CAREER SERVICES ADVISERSWWW.TUCK.DARTMOUTH.EDU/MBA/CAREER-SERVICES/MEET-OUR-TEAM
STEPHEN PIDGEON T'07 EXECUTIVE DIRECTOR
EXPERIENCEMcKinsey & Company, television andmovie production
EDUCATIONUniversity of Westminster, Tuck MBA
FOCUSMedia & Entertainment
MARC AQUILA T’07
EXPERIENCEDartmouth College, RSG, John Deere, Columbia Business School
EDUCATIONColumbia University, Tuck MBA
FOCUSGeneral Management, Health Care
CAROLINE CANNON T’98
EXPERIENCEConsultant in start-ups and turn-around, entrepreneur (co-founder of InspiringKids, Inc., Clarisond, Inc.,and more), Renaissance Consulting (now BalancedScorecard Collaborative)
EDUCATIONUNC Chapel Hill, Tuck MBA
FOCUSSocial Impact, Entrepreneurship, Marketing
SARAH DIGIACOMO
EXPERIENCEDartmouth College, St. Lawrence University
EDUCATIONSUNY Potsdam, St. Lawrence University (MEd)
FOCUSTargeted job search, Energy
MATHIAS MACHADO T’09
EXPERIENCEVolkswagen Group, Siemens, Booz & Co. (now Strategy&), and TomTom
EDUCATIONInstituto Tecnológico de Buenos Aires, Tuck MBA
FOCUSInternational students
LAURA MOGILNER T'08
EXPERIENCEGoogle, Fintech, Cleantech, Start-ups
EDUCATIONUniversity of Illinois, Tuck MBA
FOCUSTechnology, West Coast
DEIRDRE O’DONNELL
EXPERIENCELehman Brothers; fixed income,global diversity recruiting
EDUCATIONSt. Lawrence University
FOCUSFinance (all aspects, includingreal estate)
JEN TIETZ T'15
EXPERIENCEMcKinsey & Company, U.S. Navy
EDUCATIONU.S. Naval Academy, Old Dominion University, Tuck MBA
FOCUSConsulting

While each student cultivates their own path to what comes next professionally, Tuck Career Services provides tools, resources, and support to empower students to identify and reach their goals.

Career ServicesTuck School of Business at Dartmouth100 Tuck HallHanover, NH 03755-9000Tel: 603-646-2461
tuck.career.services@tuck.dartmouth.eduwww.tuck.dartmouth.eduwww.tuck.dartmouth.edu/careers
© 2020 Trustees of Dartmouth College. All rights reserved.


