
MBA RESEARCH DATANOTE - Mortgage Bankers Association · PDF ONE VOICE. ONE VISION. ONE...
13
MBA. ORG/ RESEARCH ONE VOICE. ONE VISION. ONE RESOURCE. Sources of Commercial and Multifamily Mortgage Financing in 2016 Jamie Woodwell Vice President, Commercial Real Estate Research Mortgage Bankers Association 16047 MBA RESEARCH DATANOTE
Transcript of MBA RESEARCH DATANOTE - Mortgage Bankers Association · PDF ONE VOICE. ONE VISION. ONE...

mba.org/research
ONE VOICE. ONE VISION. ONE RESOURCE.
Sources of Commercial and Multifamily Mortgage Financing in 2016
Jamie Woodwell Vice President, Commercial Real Estate Research
Mortgage Bankers Association
16047
MBA RESEARCH DATANOTE

Sources of Commercial and Multifamily Mortgage Financing in 2016 2 © Mortgage Bankers Association March 2016. All rights reserved.
Executive Summary
Office buildings, apartment buildings, shopping malls, warehouse facilities and other income-producing commercial real estate in the United States are supported by nearly $3 trillion in mortgages. The availability of this financing fosters investment in the sector, distributes investment risk and return, and reduces the costs of building and maintaining properties — thus reducing end-user costs.
The nearly $3 trillion commercial real estate finance industry draws capital from a variety of sources, including bank balance sheets, securitization markets, government sponsored enterprises, life insurance company invest-ment portfolios and others. The assorted sources bring competition, a diversity of appetites and meaningful alternatives to the market. Individually, they also bring a variety of potential market and regulatory challenges.
KEY FINDINGS• Commercial and multifamily mortgage borrowing and
lending have been strong in recent years, with nearly $500 billion in mortgage bankers originations in 2015, bringing commercial and multifamily mortgage debt outstanding to $2.8 trillion.
• Commercial real estate finance markets are both large and diverse. Banks’ balance sheets are the largest — and fastest growing — source of commercial real estate (CRE) mortgage financing. The commercial mortgage-backed securities (CMBS) market, at roughly half the size of the banks and shrinking, is the second largest source of CRE debt, followed by Fannie Mae, Freddie Mac and FHA — which focus on multifamily and health care properties — and by life insurance companies.
• Banks have been very active in the commercial and multifamily real estate finance markets in recent years. Recent regulatory actions appear to be aimed at mod-erating some activity, which could limit the availability of mortgage debt from depositories in coming years.
• A series of market and regulatory changes have lim-ited liquidity in the CMBS market in recent quarters. Coupled with upcoming reductions in the outstanding balance of CMBS and regulations that will fundamen-tally change elements of the market infrastructure, the availability of mortgage debt from the CMBS market could face significant pressure.
• The GSEs and FHA have been key sources of mortgage debt for the multifamily and health care markets in recent years, and the markets have become increas-ingly reliant on them. Regulators are actively managing the entities’ roles and shares in the market, which will determine the availability of mortgage debt Fannie Mae, Freddie Mac and FHA provide going forward.
• Life insurance companies have remained a steady source of mortgage debt. Absent significant market or regulatory changes, they are likely to remain a reliable source of mortgage debt for commercial and multifamily properties.
Commercial real estate finance markets have been expe-riencing very strong conditions, with financing readily available across a range of capital sources. As we enter 2016, market and regulatory challenges present the potential to limit some of that financing, with probable spill-over to different parts of the market. Concerns about future liquidity and where the market goes from here are palpable within the industry.

Sources of Commercial and Multifamily Mortgage Financing in 2016 3 © Mortgage Bankers Association March 2016. All rights reserved.
Commercial Real Estate Finance
Office buildings, apartment buildings, shopping malls, warehouse facilities and other income-producing commercial real estate in the United States are supported by nearly $3 trillion in mortgages. The availability of this financing fosters investment in the sector, distributes investment risk and return, and reduces the costs of building and maintaining properties — thus reducing end-user costs.
Commercial and multifamily property markets are cur-rently experiencing strong conditions. Vacancy rates are down, rents are up, property incomes are up and property values are up. Investor demand for commercial real estate has pushed capitalization rates (the yield on a property, or the amount of net operating income divided by the property price) to record lows. This reduced yield is driven partly by investors’ beliefs in the strength of the commercial and multifamily markets, and partly by the overall low-yield environment and a lack of attractive alternative investments.
With improving property fundamentals, increasing prop-erty values and low interest rates, mortgage borrowing and lending have rebounded in recent years. After fall-ing to just $82 billion in 2009 during the depths of the recession, mortgage bankers’ originations are estimated to have climbed to almost $500 billion in 2015, just shy of the $508 billion of loans closed in 2007. According to MBA’s Commercial / Multifamily Mortgage Bankers Origi-nation Index, the fourth quarter of 2015 set new records for mortgage originations for Fannie Mae and Freddie Mac, for bank portfolios and for life insurance companies.
10-year Treasury O�ceApartment
IndustrialRetail
0% 1% 2% 3% 4% 5% 6% 7% 8% 9%
10%
01Q
1
02Q
1
03Q
1
04
Q1
05Q
1
06
Q1
07Q
1
08
Q1
09
Q1
10Q
1
11Q
1
12Q
1
13Q
1
14Q
1
15Q
1
Source: Real Capital Analytics and the Federal Reserve
Commercial and Multifamily Multifamily Only
0
100,000
200,000
300,000
400,000
500,000
600,000
200
5
200
6
200
7
200
8
200
9
2010
2011
2012
2013
2014
2015
e
$ Millions
Source: MBA
FIGURE 1. COMMERCIAL / MULTIFAMILY PROPERTY CAPITALIZATION RATES AND THE TEN-YEAR TREASURY YIELD
FIGURE 2. COMMERCIAL / MULTIFAMILY MORTGAGE BANKERS ORIGINATIONS

Sources of Commercial and Multifamily Mortgage Financing in 2016 4 © Mortgage Bankers Association March 2016. All rights reserved.
The rising volumes of borrowing and lending have made for a competitive market. The headline underwriting parameters of loan-to-value (LTV) and debt-service-coverage-ratio (DSCR) remain more conservative than what was seen during the 2006–2007 period. In 2007, the average underwritten LTV for CMBS loans was 69.5 percent, compared to an average LTV of 64.7 percent in 2015. The average DSCR for CMBS loans — representing the ratio of net operating income to mortgage payments,
or the amount of cushion between what the property earns and what is paid to support its mortgage debt — was 1.40 in 2007, compared to 1.80 in 2015. It is important to note that underwritten terms do not necessarily reflect in-place conditions, that the relatively low underwritten LTV is affected by and compensating for high property valua-tions and low capitalization rates, and that the relatively high underwritten DSCR is affected by and compensating for low mortgage rates.
REGULATORS’ PERSPECTIVEIn a December 2015 release, the Federal Reserve, OCC and FDIC noted:
The agencies have observed that many CRE asset and lending markets are experiencing substantial growth, and that increased competitive pressures are contrib-uting significantly to historically low capitalization rates and rising property values. For example, between 2011 and 2015, multi-family loans at insured depository institutions increased 45 percent and comprised 17 percent of all CRE loans held by financial institutions, and prices for multi-family properties rose to record levels while capitalization rates fell to record lows.
At the same time, other indicators of CRE market conditions (such as vacancy and absorption rates) and portfolio asset quality indicators (such as non-performing loan and charge-off rates) do not currently indicate weaknesses in the quality of CRE portfolios. Influenced in part by the continuing strong demand for such credit and the reassuring trends in asset-quality metrics, many institutions’ CRE concentration levels have been rising.
Source: www.federalreserve.gov/newsevents/press/bcreg/bcreg20151218a1.pdf
0.0
0.5
1.0
1.5
2.0
2.5
0
2
4
6
8
1Q0
4
1Q0
5
1Q0
6
1Q0
7
1Q0
8
1Q0
9
1Q10
1Q11
1Q12
1Q13
1Q14
1Q15
0
20
40
60
80
LTV
Cap Rate Contract Interest Rate / WAC
DSCR
0
2
4
6
8
10
1Q0
4
1Q0
5
1Q0
6
1Q0
7
1Q0
8
1Q0
9
1Q10
1Q11
1Q12
1Q13
1Q14
1Q15
CMBS Level in Q3 2007CMBSLife Company
Source: ACLI and JPMorgan Securities
FIGURE 3. UNDERWRITING TRENDS FOR LIFE COMPANY AND CMBS LOANS

Sources of Commercial and Multifamily Mortgage Financing in 2016 5 © Mortgage Bankers Association March 2016. All rights reserved.
With the growth in originations, the amount of mortgage credit outstanding has begun to grow again as well. At the end of the third quarter of 2015, $2.8 trillion in com-mercial and multifamily mortgage debt was outstanding, of which more than $1 trillion was backed by multifamily properties.
Commercial real estate finance markets are both large and diverse. Banks’ balance sheets are the largest — and fast-est growing — source of commercial real estate mortgage financing. The commercial mortgage-backed securities (CMBS) market, at roughly half the size of the banks and shrinking, is the second largest source of CRE debt, followed by Fannie Mae, Freddie Mac and FHA — which focus on multifamily and health care properties — and by life insurance companies.
A great deal of attention has also been paid to the volume of commercial and multifamily mortgages maturing this year and next. Many commercial and multifamily mort-gages have a ten-year term, after which a loan must be
refinanced or otherwise paid-off. As a result, many of the loans made in 2006 and 2007, at the previous market peak, will be maturing in 2016 and 2017. MBA’s survey of upcoming loan maturities tracked $1.7 trillion of loans held by non-banks, of which $183 billion (11 percent) will mature in 2016, with another $208 billion of outstanding loans set to mature in 2017. Maturity volumes vary significantly by capital source, with 19 percent of the outstanding bal-ance of CMBS loans set to mature in 2016 and another 20 percent in 2017. Among loans held or insured by Fannie Mae, Freddie Mac and FHA, just two percent will mature in 2016, with an additional five percent coming due in 2017.
The increased volume of loans maturing has focused attention on the availability of new mortgage debt to refinance these loans. As mentioned above, the assorted commercial / multifamily mortgage capital sources bring competition, a diversity of appetites and meaningful alternatives to the market. Individually, they also bring a variety of potential market and regulatory challenges.
GSEs and FHACMBSBank
OthersLife and Pension
Source: MBA Commercial and Multifamily Mortgage Debt Outstanding
0
200,000
400,000
600,000
800,000
1,000,000
200
0
200
1
200
2
200
3
200
4
200
5
200
6
200
7
200
8
200
9
2010
2011
2012
2013
2014
2015
$ Millions
FIGURE 4. COMMERCIAL / MULTIFAMILY MORTGAGE DEBT OUTSTANDING
$ Billions
Source: MBA Annual Commercial / Multifamily Loan Maturity Volume
0
50
100
150
200
250
300
350
200
9
2010
2011
2012
2013
2014
2015
2016
2017
2018
2019
2020
2021
2022
2023
2024
2025
Late
r
0
50
100
150
200
250
300
350
Fannie, Freddie, FHA and Ginnie Mae Life Insurance Companies
CMBS, CDO or other ABS Credit Companies, Warehouse and Others
FIGURE 5. NON-BANK COMMERCIAL /MULTIFAMILY MORTGAGE MATURITIES

Sources of Commercial and Multifamily Mortgage Financing in 2016 6 © Mortgage Bankers Association March 2016. All rights reserved.
BANKS AND OTHER DEPOSITORIESBanks’ primary means of committing funds to commer-cial and multifamily mortgages is through making and holding whole loans. At the end of the third quarter of 2015, depositories held $1.04 trillion in commercial and multifamily mortgages, 10 percent more than they held one year earlier and 38 percent of the total amount of commercial and multifamily mortgage debt outstanding. 1 Banks’ increased holdings of commercial real estate loans have come at a time when property incomes and values are rising, loan delinquencies are declining, and when banks’ alternative investments may not be as appealing as CRE loans.
Banks’ recent experience with commercial and multi-family mortgages has been positive. During the Great Recession, multifamily and commercial mortgages had the lowest charge-off rates of any of the major loan
1. The numbers cited here generally refer to banks’ mortgages backed by multifamily and non-owner-occupied commercial properties. Many sources also include loans backed by owner-occupied commercial properties, as well as construction loans. We exclude the former because they are dependent on the ongoing operations of the owner enterprise, not on the commercial real estate space markets, for their repayment. We exclude the latter because, particularly during the most recent recession, banks’ construction books were dominated by single-family construction loans and had little connection to commercial real estate markets.
types, supporting bank balance sheets during a difficult period. As of the third quarter of 2015, the net charge-off rate for multifamily property loans held by banks was –0.01% and for other income-producing commercial properties was 0.04%.
A large number of banks also hold commercial and multi-family mortgage-backed securities (either private label or agency or government-related) as a part of their securities portfolio. As of the third quarter, banks reported holding $215 billion of such mortgage backed securities (including both private label and agency and GSE-backed).
As market conditions have drawn banks further into commercial real estate, a series of recent government actions have the potential to diminish banks’ appetites for commercial and multifamily mortgages. These include Basel capital requirements, recent rules regarding high volatility commercial real estate (HVCRE), a regulatory “reminder” of existing CRE guidance for banks, and other rules affecting both whole loan and CMBS holdings.
Source: FDIC
–2%
0%
2%
4%
6%
8%
10%
12%
14%
Construction& Development
Loans
1–4 Family ResidentialProperties
Multifamily Residential Properties
Nonfarm Nonresidential
Properties
Commercial &Industrial Loans
Credit Cards Other Loans to Individuals
200
6
200
8
2010
2012
2014
200
6
200
8
2010
2012
2014
200
6
200
8
2010
2012
2014
200
6
200
8
2010
2012
2014
200
6
200
8
2010
2012
2014
200
6
200
8
2010
2012
2014
200
6
200
8
2010
2012
2014
FIGURE 6. BANKS’ ANNUALIZED NET CHARGE OFF RATES FOR VARIOUS LOAN TYPES, Q1 2006–Q3 2015

Sources of Commercial and Multifamily Mortgage Financing in 2016 7 © Mortgage Bankers Association March 2016. All rights reserved.
HVCREAs part of the Basel III capital standards, regulators created a class of loans referred to as high volatility commercial real estate (HVCRE) loans. HVCRE are acquisition, development and construction loans that have certain characteristics, and regulators increased the capital requirement for loans meeting these criteria. As banks work to understand the rules, different inter-pretations are leading to different implementations. In addition, certain aspects of the rules challenge long-running practices in construction lending. The result is uncertainty for lenders and borrowers, and changes in the pricing and availability of some construction loans.
REAL ESTATE GUIDANCEIn December 2015, the Federal Reserve, OCC and FDIC issued a joint statement reminding depository institutions of existing rules and guidance related to commercial real estate lending. The reminder did not institute new rules or change existing rules, but did signal increased regulatory attention to CRE lending by banks.
CCARThrough the Comprehensive Capital Analysis and Review (CCAR), the Federal Reserve has unprecedented informa-tion on and analysis of large banks’ holdings, including commercial real estate portfolios. The analysis affects banks’ capital requirements and incorporates a series of scenarios, including a severe stress scenario in which commercial real estate prices drop 30 percent in the span of two years.
BOTTOM-LINEBanks have been very active in the commercial and multi-family real estate finance markets in recent years. Recent regulatory actions appear to be aimed at moderating some activity, which could limit the availability of mortgage debt from depositories in coming years.
COMMERCIAL MORTGAGE- BACKED SECURITIESThe commercial mortgage-backed securities (CMBS) market connects local commercial real estate owners to international fixed-income investors — providing investors with a range of asset-backed fixed-income investment options, and providing property owners access to the broader capital markets.
CMBS are securities backed by pools of commercial and multifamily mortgages. Investors in the securities are repaid as property owners make their mortgage pay-ments and / or pay-off their mortgages. The bonds are often structured to allow different investors to take on different levels of risk and to receive different returns based on the risks they assume.
At the peak of the market in 2007, $230 billion of CMBS was issued. With the onset of the financial crisis, issuance fell to essentially zero in 2009. The CMBS market has been rebounding in the years since, with $11 billion issued in 2010, $30 billion issued in 2011, $44 billion issued in 2012, $80 billion issued in 2013, $90 billion issued in 2014 and $94 billion issued in 2015.
In recent quarters, however, the market has slowed con-siderably. Since June 2015, CMBS spreads (like spreads for many other fixed income products) have risen, and greater volatility has entered the market. Spreads to swap for new-issue AAA 10-year bonds have risen from 82 basis-points to more than 150 basis points.
At the end of 2007, at the market’s peak, there was more than $750 billion in commercial and multifamily mortgages packaged as private-label commercial mortgage-backed securities. At the end of the third quarter of 2015, the balance of loans held in CMBS had fallen to $520 billion, three percent less than it had been one year earlier and 19 percent of the total amount of commercial and multi-family mortgage debt outstanding.
Source: JPMorgan Securities
10-year Treasury
0.0%
0.5%
1.0%
1.5%
2.0%
2.5%
3.0%
3.5%
4.0%
0
100
200
300
400
500
600
700
09
/16
/11
09
/16
/12
09
/16
/13
09
/16
/14
09
/16
/15
New Issue 10-year AAA
New Issue AA New Issue A
FIGURE 7. CMBS SPREADS TO SWAPS AND THE TEN-YEAR TREASURY YIELD

Sources of Commercial and Multifamily Mortgage Financing in 2016 8 © Mortgage Bankers Association March 2016. All rights reserved.
In addition to recent market headwinds, the CMBS mar-ket is currently facing a series of regulatory actions that have — and will — affect its capacity to provide mortgage financing in the coming year. Some analysts recently reduced their expectations for CMBS issuance in 2016 by 25 to 30 percent.
RISK RETENTIONThe risk retention rules coming out of the Dodd-Frank legislation become effective for CMBS in December of 2016, meaning the market must start incorporating the new rules into mortgage originations beginning in the summer of 2016. The new rules change the nature of some of the key roles played in the market, most fundamentally that of the B-piece buyer. The Dodd-Frank legislation included a specific provision allowing for B-piece buyers to fulfill the required risk retention, but the approach in the final rule changes the nature of the investment those buyers have traditionally made. Market players are working to develop new approaches and structures to work within the regulations, but participants have yet to announce structures that will accommodate the risk retention rule.
FUNDAMENTAL REVIEW OF THE TRADING BOOKIn mid-January, the Basel Committee on Banking Supervi-sion (BCBS) released a final Consultative Document on the Fundamental Review of the Trading Book (FRTB). The document was seen by many as a positive step from earlier proposals, but CMBS still received punitive treat-ment, with credit spread shocks equaled only by subprime RMBS in their severity. There is concern the approach, if adopted by U.S. regulators, will further erode / eliminate profitability for dealers and diminish liquidity for CMBS.
BOTTOM-LINEA series of market and regulatory changes have limited liquidity in the CMBS market in recent quarters. Coupled with upcoming reductions in the outstanding balance of CMBS and regulations that will fundamentally change elements of the market infrastructure, the availability of mortgage debt from the CMBS market could face significant pressure.
FANNIE MAE, FREDDIE MAC AND FHAFannie Mae and Freddie Mac (the GSEs) and FHA are government-related entities that hold and / or insure mort-gages backed by multifamily and health care properties. During the financial crisis, as investors shied away from other real estate-related investments, the government guarantee on Fannie Mae, Freddie Mac and FHA-backed loans and securities continued to attract investors. As the market has rebounded, the GSEs and FHA have remained a large source of credit for the multifamily market.
At the end of the third quarter of 2015, Agency and GSE portfolios and MBS held or insured $443 billion in mul-tifamily and health care mortgages, seven percent more than one year earlier. Their holdings and guarantees rep-resent 16 percent of the total amount of commercial and multifamily mortgage debt outstanding and 43 percent of outstanding multifamily mortgage debt.
IG Corp 7–10 yr Cash BondAA CMBSAAA CMBS
Source: JP Morgan Securities
0
100
200
300
400
500
600
01/
07/
11
04
/07/
11
07/
07/
11
10/0
7/11
01/
07/
12
04
/07/
12
07/
07/
12
10/0
7/12
01/
07/
13
04
/07/
13
07/
07/
13
10/0
7/13
01/
07/
14
04
/07/
14
07/
07/
14
10/0
7/14
01/
07/
15
04
/07/
15
07/
07/
15
10/0
7/15
01/
07/
16
FIGURE 8. CMBS AND CORPORATE SPREADS TO SWAPS
Source: MBA Annual Commercial/Multifamily Loan Maturity Volume
Fannie Mae Freddie Mac FHA
Life Companies CMBS
Fannie Mae and Freddie Mac Non-GSEs
Banks
025,00050,00075,000
100,000125,000150,000175,000
200,000225,000250,000275,000
200
5
200
6
200
7
200
8
200
9
2010
2011
2012
2013
2014
210
5e
$ Millions
FIGURE 9. MULTIFAMILY LENDING VOLUME, BY CAPITAL SOURCE
Sources of Commercial and Multifamily Mortgage Financing in 2016 9 © Mortgage Bankers Association March 2016. All rights reserved.
FANNIE MAE’s, FREDDIE MAC’s AND FHA’s PROGRAMS WORK IN DIFFERENT WAYSFannie Mae’s multifamily program largely runs through the Delegated Underwriting and Servicing (DUS) model, in which lenders originate and underwrite loans, with prior approval that Fannie Mae will purchase closed loans that meet certain criteria. The DUS lender agrees to service the loan and retains risk should the loan default. Most Fannie Mae DUS loans are sold into the securitization market as stand-alone, guaranteed pass-through securities.
Freddie Mac’s program relies heavily on their “K-series” multifamily securities. Freddie Mac re-underwrites loans brought to it by lender partners, who then close the loans and sell them to Freddie Mac. Freddie Mac pools groups of loans, and issues structured securities that tranche the repayment risk. Freddie Mac adds a guarantee to the senior bonds and sells them, and sells junior bonds, which hold the bulk of the credit risk, unguaranteed.
Most FHA multifamily and health care loans are underwrit-ten by lenders according to HUD’s Multifamily Acceler-ated Processing (MAP) Guide and HUD’s LEAN program, respectively. FHA guarantees the loans’ repayments. Most FHA guaranteed multifamily and healthcare mortgages are issued in securities further guaranteed by Ginnie Mae. The FHA guarantee covers the credit risk of the loan, while the Ginnie Mae guarantee covers the timely repayment to the end investor.
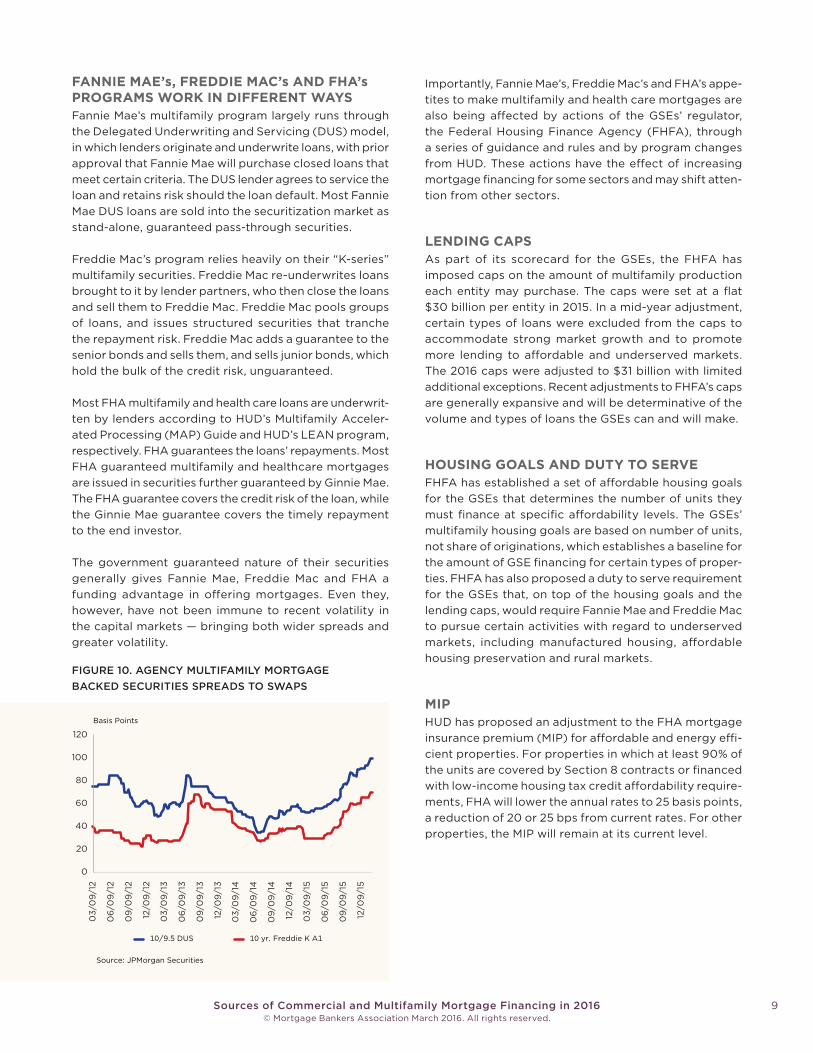
The government guaranteed nature of their securities generally gives Fannie Mae, Freddie Mac and FHA a funding advantage in offering mortgages. Even they, however, have not been immune to recent volatility in the capital markets — bringing both wider spreads and greater volatility.
Importantly, Fannie Mae’s, Freddie Mac’s and FHA’s appe-tites to make multifamily and health care mortgages are also being affected by actions of the GSEs’ regulator, the Federal Housing Finance Agency (FHFA), through a series of guidance and rules and by program changes from HUD. These actions have the effect of increasing mortgage financing for some sectors and may shift atten-tion from other sectors.
LENDING CAPSAs part of its scorecard for the GSEs, the FHFA has imposed caps on the amount of multifamily production each entity may purchase. The caps were set at a flat $30 billion per entity in 2015. In a mid-year adjustment, certain types of loans were excluded from the caps to accommodate strong market growth and to promote more lending to affordable and underserved markets. The 2016 caps were adjusted to $31 billion with limited additional exceptions. Recent adjustments to FHFA’s caps are generally expansive and will be determinative of the volume and types of loans the GSEs can and will make.
HOUSING GOALS AND DUTY TO SERVEFHFA has established a set of affordable housing goals for the GSEs that determines the number of units they must finance at specific affordability levels. The GSEs’ multifamily housing goals are based on number of units, not share of originations, which establishes a baseline for the amount of GSE financing for certain types of proper-ties. FHFA has also proposed a duty to serve requirement for the GSEs that, on top of the housing goals and the lending caps, would require Fannie Mae and Freddie Mac to pursue certain activities with regard to underserved markets, including manufactured housing, affordable housing preservation and rural markets.
MIPHUD has proposed an adjustment to the FHA mortgage insurance premium (MIP) for affordable and energy effi-cient properties. For properties in which at least 90% of the units are covered by Section 8 contracts or financed with low-income housing tax credit affordability require-ments, FHA will lower the annual rates to 25 basis points, a reduction of 20 or 25 bps from current rates. For other properties, the MIP will remain at its current level.
10/9.5 DUS 10 yr. Freddie K A1
Source: JPMorgan Securities
Basis Points
0
20
40
60
80
100
120
03/
09
/12
06
/09
/12
09
/09
/12
12/0
9/1
2
03/
09
/13
06
/09
/13
09
/09
/13
12/0
9/1
3
03/
09
/14
06
/09
/14
09
/09
/14
12/0
9/1
4
03/
09
/15
06
/09
/15
09
/09
/15
12/0
9/1
5
FIGURE 10. AGENCY MULTIFAMILY MORTGAGE BACKED SECURITIES SPREADS TO SWAPS

Sources of Commercial and Multifamily Mortgage Financing in 2016 10 © Mortgage Bankers Association March 2016. All rights reserved.
BOTTOM-LINEThe GSEs and FHA have been key sources of mortgage debt for the multifamily and health care markets in recent years, and the markets have become increasingly reliant on them. Regulators are actively managing the entities’ roles and shares in the market, which will determine the availability of mortgage debt Fannie Mae, Freddie Mac and FHA provide going forward. Should the amount of financing available from other sources diminish, regulators will need to determine if and how they wish to further adjust the entities’ roles.
LIFE COMPANIESLife insurance companies have a long track record of making commercial and multifamily mortgages. Life companies use mortgages as a means of investing the premiums they receive from insurance contracts and annuities, with the long-term nature of their commercial and multifamily mortgage assets well aligned with the duration of their insurance and other liabilities.
In recent years, the strong performance and attractive yields of commercial and multifamily mortgages, coupled with increases in the amount of funds companies have to invest, have drawn increased lending by life companies.
At the end of the third quarter of 2015, life insurance companies and private pension funds held $400 billion in commercial and multifamily mortgages, seven percent more than one year earlier and 14 percent of the total amount of commercial and multifamily mortgage debt outstanding. According to the National Association of Insurance Commissioners, at the end of 2014, life insur-ance companies had just less than 10 percent of their cash and invested assets in first-lien mortgages.
Given their deep real estate knowledge, life insurance companies have also been significant investors in CMBS. At the end of 2104, they held $134 billion in private label CMBS, which made up five percent of the total bond portfolios held by life companies.
RISK BASED CAPITALIn the wake of the recession, the National Association of Insurance Commissioners updated the risk-based capital regime for commercial and multifamily mortgages held by life insurance companies. The new system assesses mortgage risk based on the loan-to-value and debt-service-coverage of a loan. The new system is regarded as being less punitive to outlier defaults and as more accurately capturing the risks of a portfolio, generally making com-mercial mortgage investments more attractive.
BOTTOM-LINELife insurance companies have remained a steady source of mortgage debt. Absent significant market or regula-tory changes, they are likely to remain a reliable source of mortgage debt for commercial and multifamily properties.

Sources of Commercial and Multifamily Mortgage Financing in 2016 11 © Mortgage Bankers Association March 2016. All rights reserved.
CONCLUSION
The recent steady growth in mortgage debt outstanding comes as commercial and multifamily property prices have made up the value lost during the downturn. After falling approximately 40 percent during the recession, commercial and multifamily property prices now exceed their previous peak. Importantly, prices and mortgage debt outstanding are now back to the relationship seen during the early and mid 2000s.
Commercial and multifamily mortgage performance has been strong. Despite the depth and length of the reces-sion, delinquency rates for commercial and multifamily mortgages held by Fannie Mae, Freddie Mac and life insurance companies all remained extremely low. And while bank delinquency rates rose during the recession, the rate remained well below levels seen during the last real estate downturn in the late 1980s / early 1990s. As discussed earlier, during the recession multifamily and commercial mortgages were the best performing of the major loan types at banks. The CMBS market has received the greatest attention with regard to loan performance, as the headline delinquency rate rose to nine percent during the downturn. It is important to note, however, that the delinquency rate for CMBS loans is measured differently than it is for other investor groups, and that a more com-parable rate would likely show CMBS delinquency rates performing quite similarly to those of bank loans.All Property Prices Total MDO
Apartment Prices Apartment MDO
Source: MBA and Moody’s / RCA
Index: Nov. 2007 = 100
0
20
40
60
80
100
120
140
160
200
1
200
2
200
3
200
4
200
5
200
6
200
7
200
8
200
9
2010
2011
2012
2013
2014
2015
FIGURE 11. COMMERCIAL / MULTIFAMILY PROPERTY PRICES AND MORTGAGE DEBT OUTSTANDING

Sources of Commercial and Multifamily Mortgage Financing in 2016 12 © Mortgage Bankers Association March 2016. All rights reserved.
Commercial real estate finance markets have been expe-riencing very strong conditions, with financing readily available across a range of capital sources. As we enter 2016, market and regulatory challenges present the potential to limit some of that financing, with probable spill-over to different parts of the market. Concerns about future liquidity and where the market goes from here are palpable within the industry.
Source: FDIC, Wells Fargo Securities and Intex, ACLI, Fannie Mae and Freddie Mac.
0%
1%
2%
3%
4%
5%
6%
7%
8%
9%
10%
199
019
91
199
219
93
199
419
95
199
619
97
199
819
99
200
020
01
200
220
03
200
420
05
200
620
07
200
820
09
2010
2011
2012
2013
2014
2015
Multifamily
Nonfarm Residential
0%
1%
2%
3%
4%
5%
6%
7%
8%
9%
10%
199
019
91
199
219
93
199
419
95
199
619
97
199
819
99
200
020
01
200
220
03
200
420
05
200
620
07
200
820
09
2010
2011
2012
2013
2014
2015
0%
1%
2%
3%
4%
5%
6%
7%
8%
9%
10%
199
019
91
199
219
93
199
419
95
199
619
97
199
819
99
200
020
01
200
220
03
200
420
05
200
620
07
200
820
09
2010
2011
2012
2013
2014
2015
0%
1%
2%
3%
4%
5%
6%
7%
8%
9%
10%
199
019
91
199
219
93
199
419
95
199
619
97
199
819
99
200
020
01
200
220
03
200
420
05
200
620
07
200
820
09
2010
2011
2012
2013
2014
2015
Bank & Thrift(90+ day delinquency or nonaccrual)
CMBS(30+ day delinquency including REO)
Life Companies(60+ day delinquency including in process of foreclosure)
Fannie Mae and Freddie Mac(60+ day delinquency)
FC/REO
90+ Day
60–90 Day
30–60 Day
Multifamily
All Commercial
Fannie Mae
Freddie Mac
FIGURE 12. COMMERCIAL / MULTIFAMILY MORTGAGE DELINQUENCY RATES


![MORTGAGE COACH DELIVER THE ULTIMATE MORTGAGE …downloads.mortgagecoach.com/training/MCScripts.pdf · [Lori], as you know from working with me, one of the key things that differentiate](https://static.fdocuments.net/doc/165x107/5fab2e82e93e8b185610da65/mortgage-coach-deliver-the-ultimate-mortgage-lori-as-you-know-from-working-with.jpg)


