Mayan riviera bpm samples 1
31
Super Tower Seoul, South Korea Energy Cost Analysis
Transcript of Mayan riviera bpm samples 1
Super TowerSeoul, South Korea
Energy Cost Analysis

Building Performance Modeling
1. Background (Climate Summary)
2. Energy Model Inputs and Results
3. Glazing Studies
4. Shading Studies
30% DD Phase Review

Background – Climate Summary
Cooling 560 CDD
Heating 2782 HDD Comfort
Source: TMY2 Weather Data
Annual Rainfall 53 inches

Total Annual Energy Total Annual Cost
ASHRAE Baseline 266,212 MMBtus $6,416,198
Proposed Design 189,374 MMBtus $4,485,136
Energy/Cost Savings 76,838 MMBtus $1,931,062
Percentage Savings 28.9% 30.1%
YRG developed a baseline case energy model compliant with ASHRAE 90.1 YRG developed a Proposed Design case energy model representing the actual project design with all Energy Efficiency MeasuresThe model was able to estimate energy savings of the project relative to the ASHRAE baselineUtilizing energy costs of the project for the site, these energy savings translate to operational cost savingsThe energy model predicted return on investment of the project within 4 years of the project operations
Energy Analysis Results
10 LEED Points

Total Annual Energy Total Annual Cost
Energy/Cost Savings 76,838 MMBtus $1,931,062
Energy Analysis Results

Energy Analysis Results- Cost Savings Breakdown
30.1%
The energy model determines energy savings in all aspects of the building, particularly in Ventilation and Heating systems
38.7%
25.5%
26.2%
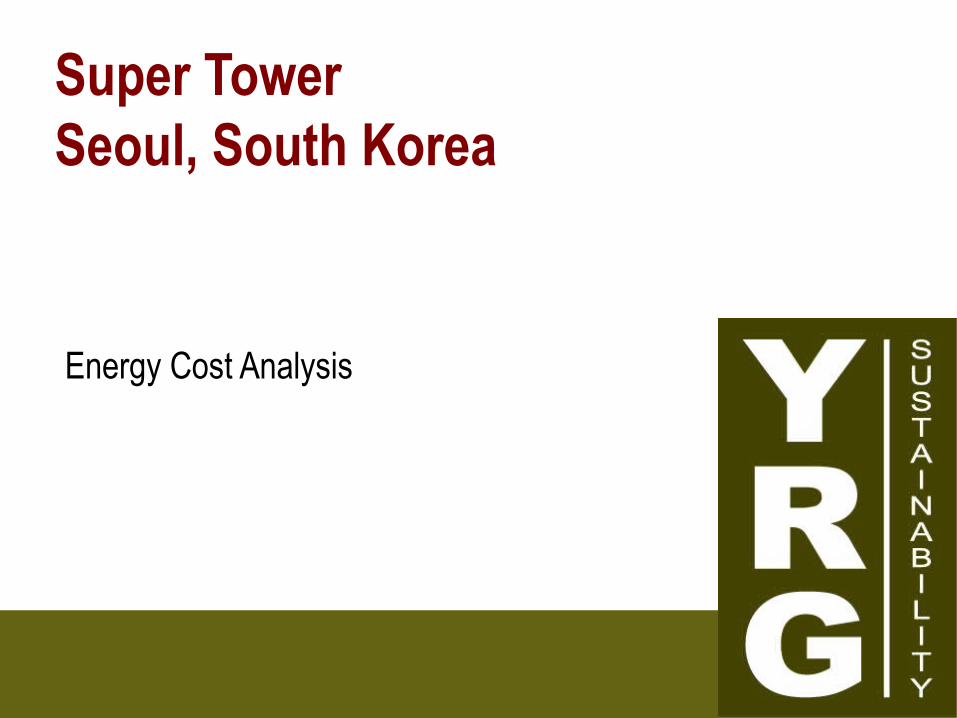
Energy Cost Savings by Space Type
The project consists of different space typesThe energy model was able to identify that the cost savings with energy efficiency would be more in the residential portion followed by the hotel and offices.

Background – Building Energy Picture
Energy Use vs. Energy Cost
BaselineProposed Baseline Proposed

Shading Analysis – Sun Path
S E S E S
N W N W

Shading Analysis – Solar Exposure
06:00 07:00 08:00 09:00 10:00 11:00 12:00 13:00 14:00 15:00 16:00 17:00 18:00 19:00Jan Feb Mar Apr May Jun Jul Aug Sep Oct Nov Dec
06:00 07:00 08:00 09:00 10:00 11:00 12:00 13:00 14:00 15:00 16:00 17:00 18:00 19:00Jan Feb Mar Apr May Jun Jul Aug Sep Oct Nov Dec
North-facingFaçade(s)
East-facingFaçade(s)
Higher Cooling Cost
Glare Potential
Shading Analysis – Solar Exposure
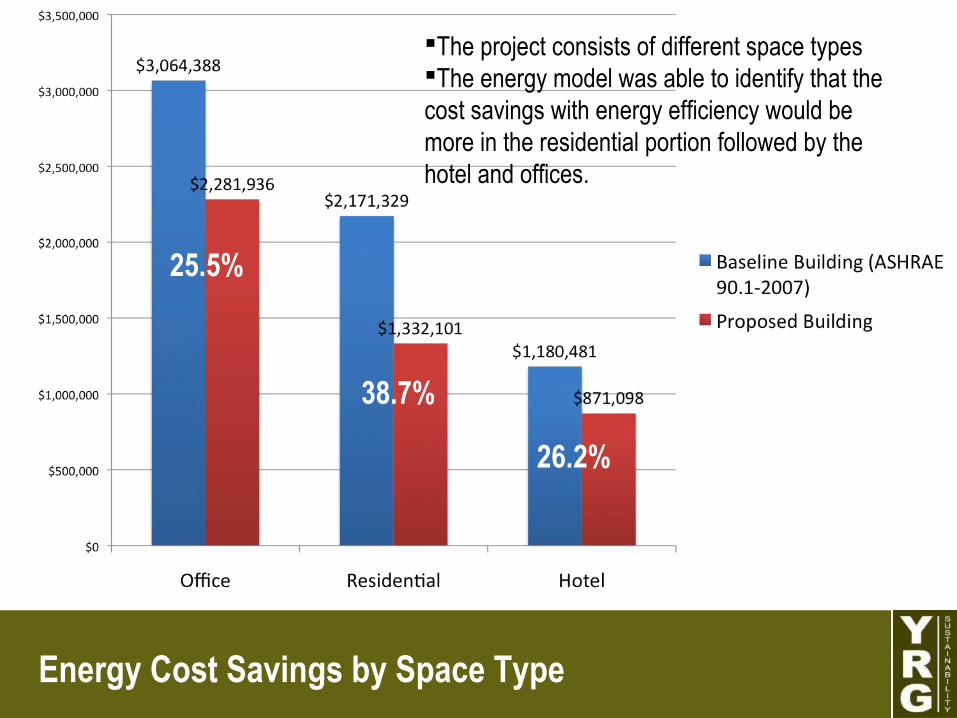
Summer ConditionEast and West façades
Impact: Direct and high
altitude solar gains
Best Practice: Use
shading screens, vertical
fins
East Facade
West Facade

Shading Analysis – Solar Exposure
Winter ConditionAll façades
Impact: Low solar altitude
and desirable heat gain
Best Practice: Use low-e
thermal glass, interior
roller shades for glare
protection

Glazing – Range of Performance- U value
U-Value Sensitivity Test
U-ValueBtu/h-ft2-°F
Solar Heat Gain Co-efficient (SHGC)
Visible Light Transmittance (VLT)
U-0.35
0.28 0.45
U-0.30
U-0.25
U-0.20
U-0.15
Improved
Improved
YRG developed parametric models of glazing performance to identify energy and daylight impact

Glazing – Energy Cost to U valueProposed Case U Value: 0.29
Annual Building Energy Cost

Glazing – Spandrel Glass Performance (46.55% of wall area)
Comparing Building Energy Cost
0.49%
0.61%
YRG developed parametric models of spandrel glass performance to identify energy savings

Results
Changing shading property (SHGC) would be more valuable than moving to a triple glazed window
Improving the U-Value of spandrel glass can save an additional 0.5% in annual energy cost
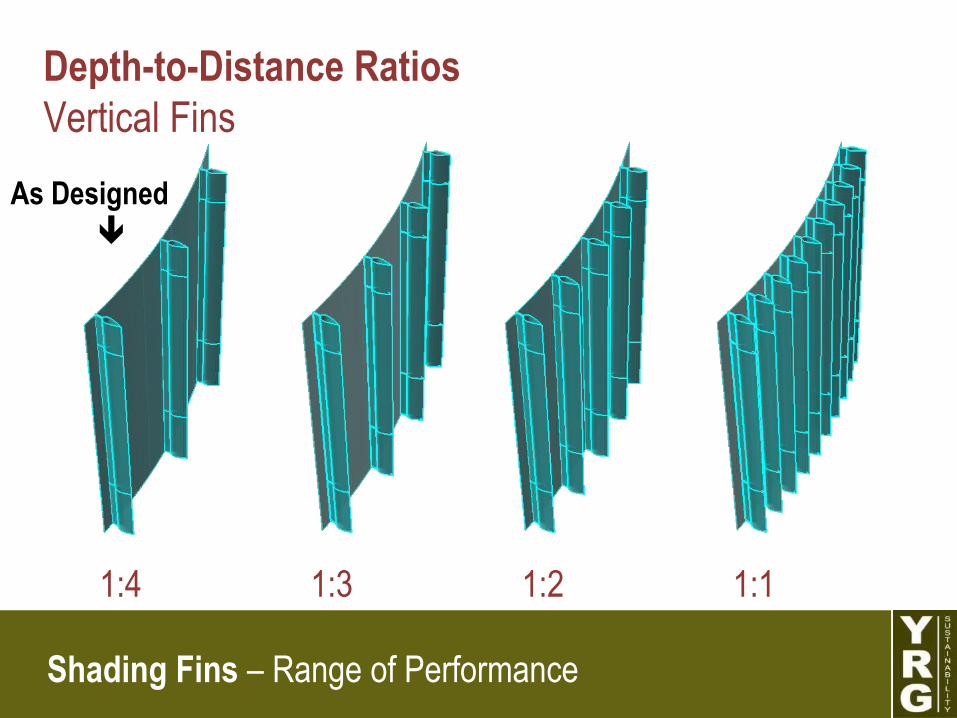
Shading Fins – Range of Performance
1:4 1:3 1:2 1:1
Depth-to-Distance RatiosVertical Fins
As Designed

Shading System Optimization- Solar Radiation Analysis
30%
All Horizontal Shades
40%
Combination
All Vertical Fins
20%

Shading Fins – Range of Performance
Depth-to-Distance RatiosHorizontal Fins
Max Incline Condition
1 to 2.8 ratio
Façade (~84°)
Façade (~90°)
Tower Interior
Max Summer (75.9°)Max Winter (29.0°)
Tower Interior
Max Summer (75.9°)Max Winter (29.0°)
Fin
Fin
Typical Condition
1 to 3.6 ratio
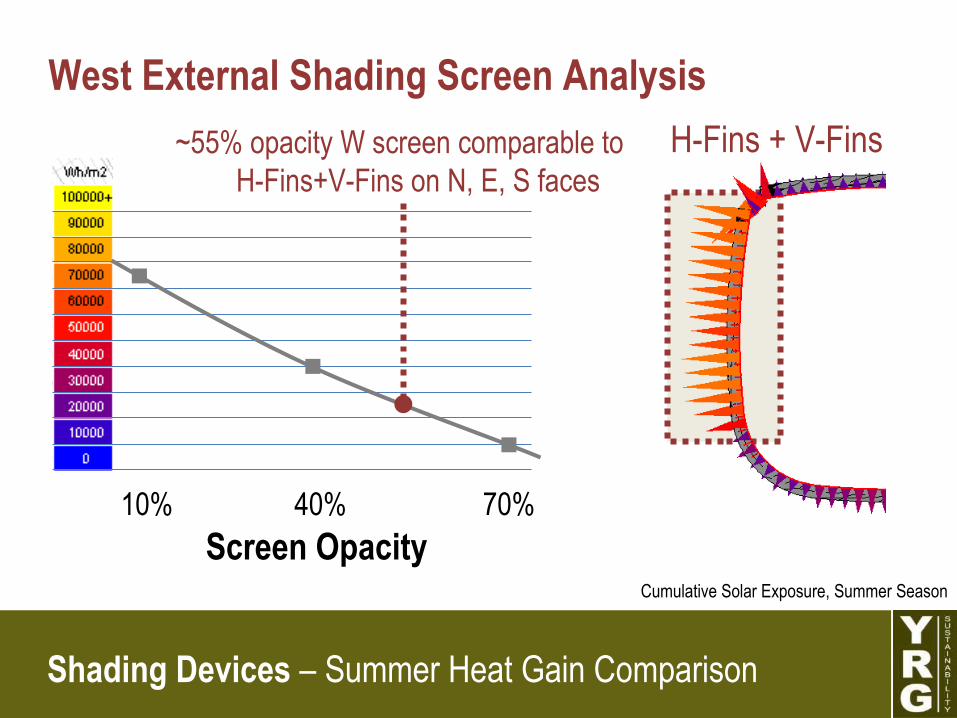
Shading Devices – Summer Heat Gain Comparison
Cumulative Solar Exposure, Summer Season
H-Fins + V-Fins
West External Shading Screen Analysis
10% 40% 70%Screen Opacity
~55% opacity W screen comparable to H-Fins+V-Fins on N, E, S faces

Comfort Optimization- Daylight Analysis

Library Project
Fort Collens, CO

Envelope Construction Cooling Plant Impact
Unshaded,Fully Glazed
Fully Shaded,Fully Glazed
Fully Shaded,Partially Glazed
YRG evaluated envelope systems for reduction in cooling peak demand

Shading Impact on Total Energy Use
TotalEnergy
CoolingBreakdown
SolarBreakdown
Other Consumption
85%
Cooling15%
Solar13%
Conduction 2%
Diffused 5%
Direct Up to 8%(Shading)

Climate
Wind
Temperature
Thermal Stress
Site
Concept Design Energy Analysis for Optimized Design
Climate and Site

Red is the warm temperature Blue is the cold temperature Inner circle are high and low
temperature identifying coldest and hottest days
Green is comfort temperature and humidity
Recommendations- Explore natural ventilation and
passive conditioning like night flushing in July and August
Temperature and Humidity
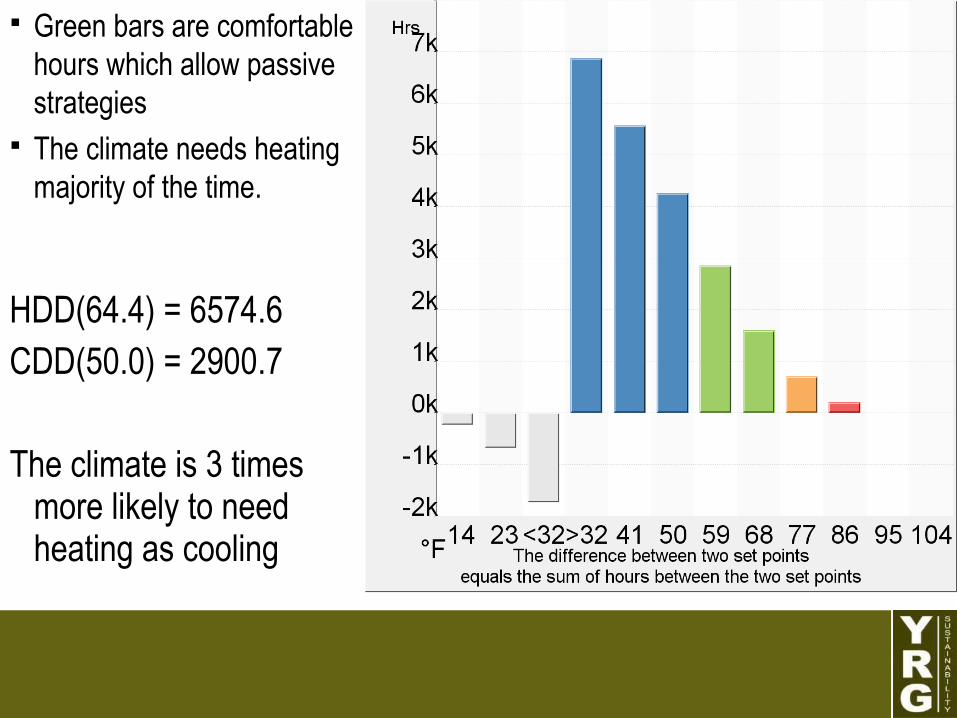
HDD(64.4) = 6574.6CDD(50.0) = 2900.7
The climate is 3 times more likely to need heating as cooling
Green bars are comfortable hours which allow passive strategies
The climate needs heating majority of the time.
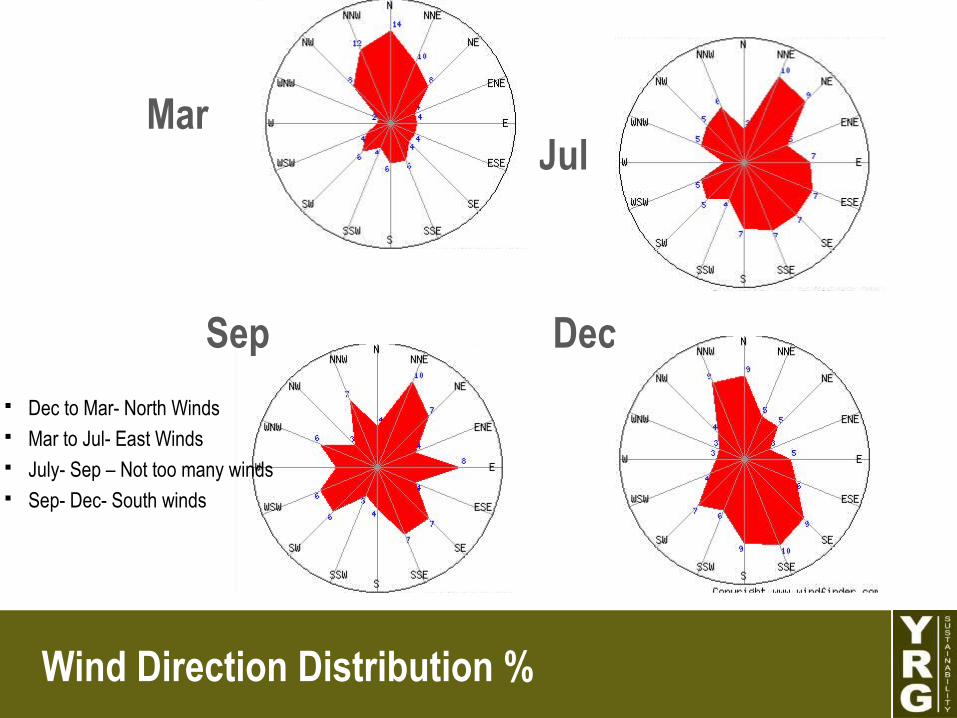
Wind Direction Distribution %
JulMar
DecSep
Dec to Mar- North Winds Mar to Jul- East Winds July- Sep – Not too many winds Sep- Dec- South winds
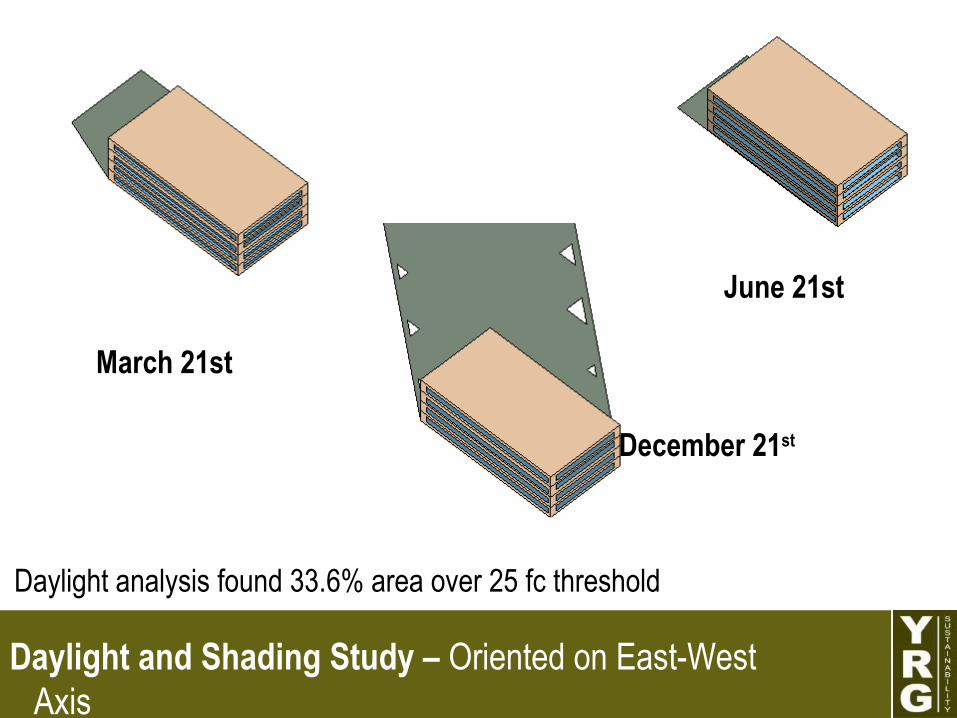
Daylight and Shading Study – Oriented on East-West Axis
June 21st
March 21st
December 21st
Daylight analysis found 33.6% area over 25 fc threshold
Building Loads
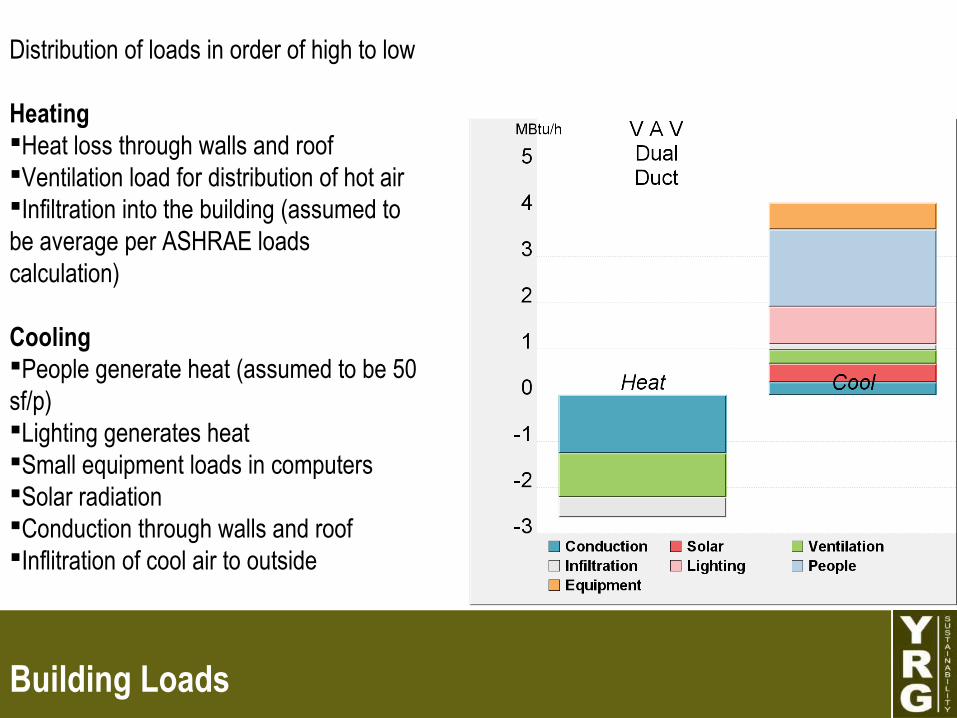
Distribution of loads in order of high to low
HeatingHeat loss through walls and roofVentilation load for distribution of hot airInfiltration into the building (assumed to be average per ASHRAE loads calculation)
CoolingPeople generate heat (assumed to be 50 sf/p)Lighting generates heatSmall equipment loads in computersSolar radiation Conduction through walls and roofInflitration of cool air to outside
Preliminary Energy Analysis
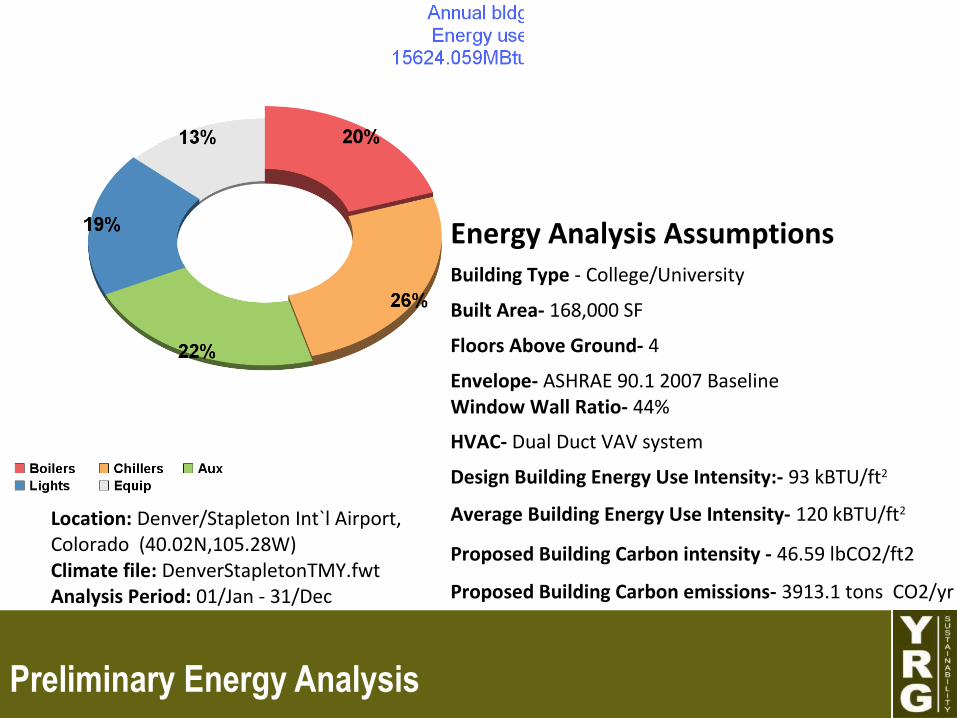
Energy Analysis AssumptionsBuilding Type - College/University
Built Area- 168,000 SF
Floors Above Ground- 4
Envelope- ASHRAE 90.1 2007 BaselineWindow Wall Ratio- 44%
HVAC- Dual Duct VAV system
Design Building Energy Use Intensity:- 93 kBTU/ft2
Average Building Energy Use Intensity- 120 kBTU/ft2
Proposed Building Carbon intensity - 46.59 lbCO2/ft2
Proposed Building Carbon emissions- 3913.1 tons CO2/yr
Location: Denver/Stapleton Int`l Airport, Colorado (40.02N,105.28W)Climate file: DenverStapletonTMY.fwtAnalysis Period: 01/Jan - 31/Dec