May-June 2002 Investor Roadshow - CommBank · 2019-08-19 · May-June 2002 Investor Roadshow David...
36
May-June 2002 Investor Roadshow David Murray Chief Executive Officer Stuart Grimshaw Group Executive Financial and Risk Management www.commbank.com.au
Transcript of May-June 2002 Investor Roadshow - CommBank · 2019-08-19 · May-June 2002 Investor Roadshow David...
May-June 2002 Investor Roadshow
David Murray
Chief Executive Officer
Stuart Grimshaw
Group Executive Financial and Risk Management
www.commbank.com.au

2
The material that follows is a presentation of general
background information about the Bank‟s activities
current at the date of the presentations, 27 May 2002.
It is information given in summary form and does not
purport to be complete. It is not intended to be relied
upon as advice to investors or potential investors and
does not take into account the investment objectives,
financial situation or needs of any particular investor.
These should be considered, with or without
professional advice when deciding if an investment is
appropriate.
Disclaimer

3
Speaker’s Notes
Speaker‟s notes for these presentations
are attached below each slide.
To access them, you may need to save
the slides in PowerPoint and view/print
in “notes view.”

4
Agenda
Introduction
Australian economy
Australian share market
History of Commonwealth Bank
Financial performance
Strategy
Strategic issues
Competitive advantage
Strategic imperatives
Looking Forward
Strategic plan

Introduction

Australian Economy & Share Market
Relative GDP performance
Credit growth
MSCI index weighting

7
Relative GDP Performance
Source: Goldman Sachs
GDP Growth
-3.00
-2.00
-1.00
0.00
1.00
2.00
3.00
4.00
5.00
6.00
7.00
% G
row
th G
DP
yo
y
US UK Japan Australia

8
Credit Growth
Source: Commonwealth Research
Mar-02
G r o w t h in O u t s t a n d in g s
( 3 m o n t h - e n d e d a n n u a l r a t e s )
- 1 0
0
1 0
2 0
3 0
J u l- 9 7 J u l- 9 8 J u l- 9 9 J u l- 0 0 J u l- 0 1
- 1 0
0
1 0
2 0
3 0
B u s in e s s H o u s e h o ld
H o u s in g O t h e r p e r s o n a l
% %

9
0
10
20
30
40
50
60
USA UK
Japan
Fra
nce
Germ
any
Sw
itzerland
Neth
erlands
Canada
Italy
Australia
Spain
Sw
eden
Fin
aln
d
Hong K
ong
Beguim
Sin
gapore
Denm
ark
Irela
nd
Norw
ay
Portugal
Gre
ece
Austria
New
Zeala
nd
MSCI % Weightings
1.58%
Recent increase in relative weighting
to 10th from 14th on MSCI Index
Source: Australian Stock Exchange

Commonwealth Bank Group
10 Year Share Price Performance
Full Year to 30 June 2001
Half Year to 31 December 2001
Asset Quality

11
$0
$5
$10
$15
$20
$25
$30
$35
$40
9/09
/91
9/06
/92
9/03
/93
9/12
/93
9/09
/94
9/06
/95
9/03
/96
9/12
/96
9/09
/97
9/06
/98
9/03
/99
9/12
/99
9/09
/00
9/06
/01
9/03
/02
December 1990 - the Bank
was converted into a public
company with share capital.
70% shareholding retained by
the Commonwealth
Government.
1991 - The Bank acquired
State Bank of Victoria $1.6
billion.
October 1993 - the
Commonwealth Government
shareholding was reduced to
50.4% and in 1996 the Bank
was fully privatised.
June 2000 - the Bank
acquired Colonial Group
Limited $10 billion.
Commonwealth Bank Group Share Price
Performance Last 10 Years
December 2001 - the Bank‟s
restructure announced.

12
Financial Performance :
Full Year to 30 June 2001
Net operating profit after tax up 9% to $2,262m („cash basis‟*)
- Banking up 12% to $1,793m
- Strong performance from Funds Management, up 34% to $149m
- Weaker life insurance operating margins & investment earnings
below long term expectations
Retail Integration completed ahead of time & to business case
Home lending market share beginning to stabilise
Operating expenses increased above expectations
*before goodwill amortisation and appraisal value uplift

13
Financial Performance :
Half Year to 31 December 2001
Net operating profit after tax up 7% to $1,192m („cash basis‟*)
Banking result up 11% driven by a steady net interest margin
and growth in other banking income
Funds under management result up 23% with strong momentum
in funds inflow maintained through September 11
Australian life insurance operating margin up 22% offset by a weak
offshore life insurance result
Increase in bad and doubtful debt expense, driven by two large
impaired corporate exposures
*before goodwill amortisation and appraisal value uplift

14
Credit Risk: Historical P&L Charge
* Excludes Colonial
% C
harg
e P
er
Half
Bad Debt Expense / RWA
0.00%
0.10%
0.20%
0.30%
Sep-98*
Dec-98*
Mar
-99*
Jun-
99*
Sep-99
Dec-99
Mar
-00
Jun-
00
Sep-00
Dec-00
Mar
-01
Jun-
01
Sep-01
Dec-01
Mar
-02
CBA Other Major Australian Banks (Average)

15
Aggregate Provisions
* Includes Colonial
$m
illio
ns
0
200
400
600
800
1,000
1,200
1,400
1,600
1,800
2,000
0
50
100
150
200
250
300
%
General Provision (Left Axis)
Specific Provision (Left Axis)
Other Major Australian Banks (Average): Total Provisions/Gross Impaired Assets (%)
CBA: Total Provisions/Gross Impaired Assets (%)

Strategy
Strategic Issues
Competitive Advantage
Strategic Imperatives

Strategic Issues
Domestic Growth
Wealth Management
Distribution
Technology & Productivity

Competitive Advantage
Brand
Scale
Innovation

19
Brand : Commonwealth Bank
Share of Mind*
• CBA’s share of mind remains at a consistent level, leading the Big Four.
• Share of mind for Westpac, ANZ and NAB continue to measure at similar
levels.
* Research International November 2001
68 71 6863
7065 63 66 65 64
68 6965 63 66
0
25
50
75
Sept Nov Jan
'01
Mar May Jul Sep Nov
(%)
CBA
Westpac
ANZ
NAB

20
Rank Company
1
2
3
4
5
Source: ASSIRT Service Level Survey - 2001
Adviser brand awareness - overall opinion of organisation
Brand : Colonial First State
7.28
7.52
7.81
7.85
7.98
8.16
5 6 7 8 9 10
Industry
Average
AMP
AMP Financial
Services
Perpetual
Navigator
Colonial First
State

21
Brand: CommSec

22
Australia’s Most Accessible Bank
10 million customers
$
Personal
Lenders
over 700
staff
Direct
Banking
over 62 million
calls *
Branches
1,045
branches
ATMs
nearly
4,000
Premium
Banking
13 Centres
Ezy Banking
over 700 Stores
NetBank
1.5 million
registered
customers
Business Banking
80 centres
Agencies
(Postal &
Private)
over 3,900
Mobile
Bankers
over 180
Statistics as at 31 December 2001
* for 6 months to Dec „01
EFTPOS
over 120,000
merchant
terminals
Financial
Planners
over 620
Third Party Distribution
over 15,000 individual
advisers, brokers and
agents

23
Scale : Low Cost per Customer
Non Interest Expense / Customer
Source: Commonwealth Bank illustration
Revenue per Customer
0
CBA
Increasing
Incre
asin
gpeer banks

24
Dec 2000 Jun 2001 Dec 2001
Home Loans 20.8% 20.4% 20.1%
(Residentially Secured)
Credit Cards^ 21.9% 21.4% 21.4%
Retail Deposits 24.6% 24.0% 24.1%
Retail FUM (Plan for Life) 16.0% 16.5% 16.8%
Superannuation/Annuities 15.7% 15.8% 16.4%
Retail Broking 8.5% 8.7% 8.5%
Inforce Premiums 14.6% 14.4% 14.6%
^ Colonial data captured as part of market share calculation from June 2001
Australian Market Share
Scale : Strong Market Share Positioning
Rank
1
1
1
1
1
2
2

25
Market Share of ASX Transactions
0
5,000
10,000
15,000
20,000
($ 000)
1997 1998 1999 2000 2001
Profitability of CommSec
Innovation : Commsec & NetBank
0 %
2 %
4 %
6 %
8 %
1 0 %
1 9 9 7 1 9 9 8 1 9 9 9 2 0 0 0 2 0 0 1
0
300
600
900
1200
(000
's)
1997 1998 1999 2000 2001
Growth in Customer Numbers
0
40
80
120
160
mil
lio
ns
of
tra
ns
ac
tio
n
1997 1998 1999 2000 2001
Growth in Transaction Volumes

26
Innovation : e-Commerce footprint
NetBank CommSec (discount broking)
Online Home Loan Application BPay Online
Commonwealth Bank Web Site
Funds Direct
> 170,000 Online CustomersVodafone alliance
HomePath
Dec 95
Feb-Mar 97
Sep-Nov 97
Aug 98
Jun 99
Aug-Sep99
Sep 01
Dec 01
> 2,300,000 Online Customers
1,500,000 NetBank Customers

Strategic Imperatives
Segmentation
Productivity
Strategic Issues
Domestic Growth
Wealth Management
Distribution
Technology & Productivity

28
Segmentation: Aligned Domestic
Structure with Customer Needs
Retail BankingServices
PremiumFinancialServices
Investment &InsuranceServices
Institutional &BusinessServices
CustomerGroup
Personalbankingcustomers,Small businessbankingcustomers
Premium clientsincludingprofessionalsand business
Agents, Brokers,Financial Advisers
Institutional,Corporate,Commercialbusinesscustomers
Channels Branch, Ezy-Banking, ATM,EFTPOS,Phone, On-line,Mortgagebrokers
Relationshipmanagers,Premiuminvestmentcentres, phone,on-line.
Agents, Branches,Brokers, FinancialAdvisers, Premiuminvestment centresDirectDealerships
Relationshipmanagers,Business centres
Services Group Technology, Back Office Operations, Procurement, Shared Services
Support Finance, Risk Management, Human Resources, Strategy, Legal, Secretariat

29
Retail Share of Wallet and Cost to Serve
Source : Commonwealth Bank of Australia ^ Excludes Finance Companies
Banking
0
10
20
30
40
50
60
70
80
90
100
Total Complex
Needs
Mainstream
/Transactors
Youth
%
CBA WBC ^ NAB ANZ ^
Investment
0
10
20
30
40
50
60
70
80
90
100
Total Complex
Needs
Mainstream
/Transactors
Youth
%
CBA WBC ^ NAB ANZ ^
CBA Personal Customers :
Segment share
6%
34%
31%
29%
Complex Needs Mainstream Transactors Youth
Overall
0
10
20
30
40
50
60
70
80
90
100
Total Complex
Needs
Mainstream
/Transactors
Youth
%
CBA WBC ^ NAB ANZ ^
30
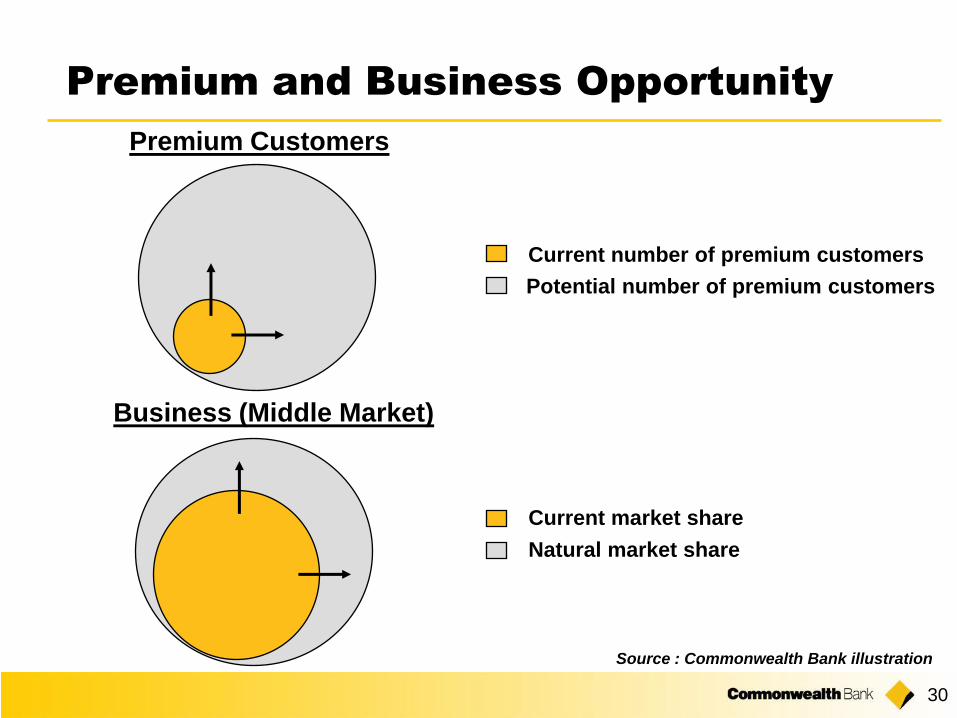
Premium and Business Opportunity
Business (Middle Market)
Premium Customers
Source : Commonwealth Bank illustration
Current market share
Natural market share
Current number of premium customers
Potential number of premium customers

31
Funds Management Opportunity
Source: Plan for Life, CBA
Retail Funds Management
(Non-Life & Life)
0
100
200
300
400
500
600
1997 1999 2001 2003 2005 2007
$B
illio
n
Retail FUM (Commonwealth Bank Group)
Retail FUM (Industry)

32
Growth through Retail Masterfunds

33
Segmentation : premium banking
Simplified transaction accounts
Browser based workflow enabled systems
Credit risk architecture
7 level organisation structure
Shared services : HR and finance
Productivity

Looking Forward

35
Business Driver Profile 5 Year Plan
Growth in Market Share
Funds under managementHome LoansCredit CardsLife InsuranceCredit ProductsBusiness FinancingRetail Deposits
At or above market
Margins Comparable for business mix Continuing decline
Sources of Income Comparable Financial Institutions Rebalance toward non-interest income
Costs Reduction in cost/income – Bestpractice
3%-6% p.a. productivitychange
Capital ManagementOptimise regulatory capital andmaintain rating.
Rating AA-
Total Shareholder Return Top quartile Deliver top quartile TSR.
Strategic Plan to June 2006 is
Underpinned by Growth Assumptions

May-June 2002 Investor Roadshow
David Murray
Chief Executive Officer
Stuart Grimshaw
Group Executive Financial and Risk Management
www.commbank.com.au