
Pension Benefit Guaranty Corporation in Workouts and Bankruptcy ...

May 4, 2000
Mr. David StraussExecutive DirectorPension Benefit Guaranty Corp.1200 K St. NWWashington, DC
Dear Mr. Strauss:
The American Academy of Actuaries (Academy) and Conference of Consulting Actuaries(Conference) are pleased to provide you with a copy of our study of PBGC Plan TerminationCost. The purpose of the Academy-Conference study was to compare, for a sample oftransactions, actual costs to terminate a plan with those that would have resulted had PBGCassumptions been used. The study also identifies potential areas for future research regardingthe use and derivation of these assumptions. The analysis underlying the study was conductedby an independent consulting firm, Oliver Consulting.
Some of the study’s key findings include:
• The data do not show a large difference between PBGC estimates and actualannuity settlements for the plans studied. The annuity results show a relatively smalloverstatement of termination liability (averaging 3% to 4%). The difference wasapparently primarily due to mild interest rate conservatism. Further study, particularly ofdeferred versus immediate annuity settlement amounts, would shed more light in this area.
• Large annuity purchases were underrepresented. Available data did not cover verylarge plan terminations, with the mean cost for annuity purchases being less than $5million. Since large annuity purchases were underrepresented in the study, no conclusionsshould be drawn regarding the application of the results to such purchases.
• Annuity results should be looked at separately from lump sum results. Lump sumswere based on plan provisions, so it is not surprising that they did not mimic the potentialcost of annuity purchases. As such, the lump sums varied depending on whether the planincluded early retirement subsidies in the cashout value. Where optional lump sums wereoffered, incidence of electing that option was high.
• There was insufficient data to compare PBGC expected retirement age methodologyto the assumptions used by insurance companies in annuity purchases, or to the actualrates of retirement for ongoing plans. The PBGC is encouraged to use their data fortrusteed plans to improve on their outdated XRA methodology.
Although our study only included a sample of plans, we believe the data are sufficient to drawmeaningful conclusions and will be helpful to your agency as it explores ways to improve thecalculation of plan termination liabilities. The Academy would be pleased to work with youand your staff in this endeavor.
Sincerely,
James E. Turpin, MAAA, FCA, MSPA Elinor V. Bowman, MAAA, FCA, FSAVice President, Pensions Vice President, PensionsAmerican Academy of Actuaries Conference of Consulting Actuaries
Cc: David Gustafson, Jane Pacelli

American Academy of Actuaries-Conference of Consulting ActuariesPBGC Plan Termination Cost Study
May 4, 2000
Prepared by Oliver Consulting
Marilyn M. Oliver, F.S.AGregory S. Schlappich, A.S.A.

TABLE OF CONTENTS
Section
1. Summary of Findings
1.1 Background 11.2 Annuity Settlements 21.3 Cashout Settlements 21.4 Total Settlements 31.5 Conclusions 3
2. Study Description and Methodology
2.1 Purpose 52.2 Data 52.3 Methodology and Assumptions 6
3. Comparison of Annuity Purchase Settlements with PBGC Valuation Results
3.1 Data 73.2 Calculation Results 73.3 Analysis 93.4 Conclusions 13
4. Comparison of Cashout Settlements with PBGC Valuation Results
4.1 Data 144.2 Calculation Results 144.3 Analysis 174.4 Conclusions 20
5. Comparison of Total Settlements with PBGC Valuation Results
5.1 Data 215.2 Calculation Results 215.3 Analysis 235.4 Conclusion 23
AppendixA. Actuarial Assumptions A-1B. Plan Provisions
1. Normal and Early Retirement Provisions A-22. Normal Form of Payment of Retirement Benefits A-33. Automatic Form of Retirement Benefits for Married Participants A-34. Deferred Lump Sums after Annuity Purchase A-3

PBGC Plan Termination Cost Study
Page 1
Summary of Findings
1.1 BackgroundFor some time Pension Benefit Guaranty Corporation (PBGC) actuarial assumptions have
been used as a basis for a variety of calculations including: valuations of PBGC trusteed
pension plans, preliminary estimates for standard plan terminations, and calculations in IRC
414(l) spinoff situations. This study was designed as a pilot study to pinpoint potential areas
for future research regarding the use and derivation of these assumptions. The technique used
was to analyze differences between the actual costs of non-trusteed pension plan terminations
and those predicted using Pension Benefit Guaranty Corporation (PBGC) actuarial
assumptions for annuities.
Data for the study was solicited from the actuarial community. Responses, along with
comprehensive individual participant data, were received from 5 companies for a total of 38
plans. Most of the data received related to plan terminations that occurred between 1994 and
1997 and thus fell under the current PBGC assumption structure. Thirty-five of the cases
involved annuity purchases. It is estimated that around 75% of the total premiums applied to
immediate annuities. The purchases would generally be considered medium to small in terms
of total premium as illustrated below.
Distribution of Cases by Total Premium
Minimum: $19,257
Maximum: $30,300,000
Mean: $4,930,352
Quartiles:
1st $370,067
2nd $2,877,372
3rd $5,700,000
The study focuses on annuitized participants. However, data regarding cashouts was supplied
in some (sixteen) cases and where provided was included in the study.

PBGC Plan Termination Cost Study
Page 2
1.2 Annuity SettlementsFor the 35 cases involving annuity purchases, termination costs on a PBGC basis exceeded
actual settlement costs by 3% on average, with a standard deviation of 7%. When two outliers
were eliminated, the mean excess increased to 4%, with a standard deviation of 5%.
For these cases, PBGC costs exceeded settlement costs for 74% of these cases. For about ½
of the cases this excess was under 5%. For about 1/3 of the cases it was between 5% and 10%.
Insurer’s pricing assumptions were supplied for seven plans terminating in late 1995 and 1996.
In all but one case the insurer’s interest rate exceeded both the PBGC’s i1 interest rate and the
30-year Treasury rate. For these seven cases the insurer’s interest rate exceeded the PBGC i1
rate by 71 basis points on average and the 30-year Treasury rate by 21 basis points on
average.
For four of these cases, which primarily involved immediate annuities, individual data was
supplied. Estimated PBGC termination costs for these cases exceeded annuity purchase costs
by an average of 7%. This was mostly due to the insurers' higher interest rate assumptions,
which were on average 81 basis points above the PBGC i1 rate.
1.3 Cashout SettlementsFor the 16 cases for which comprehensive cashout settlement data was provided, results were
grouped by cashout methodology as follows:
(1) Minimum GATT1: 30-Year Treasury rate, 1983 Group Annuity Mortality Table on unisex
basis, retirement at plan’s Normal Retirement Age
(2) Minimum GATT with Early Retirement: 30-Year Treasury rate, 1983 Group Annuity
Mortality Table on unisex basis, early retirement for those eligible
(3) Old PBGC Lump Sum: “Old” PBGC Interest Rates, UP-1984 Mortality, early retirement
for those eligible
1 This refers to the GATT Act (Uruguay Round Agreements Act, implementing the Uruguay Round of theGeneral Agreement on Tariffs and Trade), which included provisions regarding the calculation of cashouts onthis basis.
PBGC Plan Termination Cost Study
Page 3
For comparability purposes, these results were further adjusted to reflect (1) cashout amounts
based on interest rates one month prior to the cashout date for plans using an interest rate tied
to an earlier date and (2) PBGC plan termination costs based on unisex mortality. On this
basis, PBGC termination costs exceeded cashout amounts by 17%, 21%, and (9%),
respectively, for the three different types of cashouts and the average excess of PBGC
termination costs over cashout amounts was 9%.
An analysis of the cashout results indicated that the primary factor influencing differences
between PBGC estimates and cashout amounts under the different cashout methodologies was
the interest rate. Use of the PBGC XRA assumption accounted for about 1/3 of the 9% excess.
1.4 Total SettlementsResults for the 17 cases where both annuity purchase and cashout data were supplied were
highly influenced by cashout basis. The average adjusted excess of PBGC termination costs
over settlement costs was 9%. For these 17 cases average termination costs on a PBGC basis
exceeded total settlement costs by 13%, 17%, and (4%) respectively for the three groups
outlined above using adjustments (1) and (2) in the previous paragraph. The average cashout
election percent was 94% for actives and vested terminations and 37% on average for the two
cases in which retirees were allowed to cash out.
1.5 ConclusionsData used in this study was provided by five cooperating firms. Thus, it is not clear as to how
representative the results are of plan terminations in general. Certainly due to both the manner
in which the sample was gathered and the sample size, the results cannot be considered
statistically significant. In particular, no large plan terminations were included in the study.
Potential areas for future study are highlighted below.
• Further Study Of Interest and Mortality Rate Structure
The data do not show a large difference between PBGC estimates and actual annuity
settlements. However, in all but 6 cases out of 35, PBGC estimates exceeded annuity
costs. The small amount of data available regarding insurer pricing assumptions suggests
that this difference may lie in the interest rate assumptions. Further study – particularly
of deferred versus immediate annuity settlement amounts – would be helpful to shed
more light in this area.
PBGC Plan Termination Cost Study
Page 4
• Review Of Retirement Age Methodology used in PBGC Annuity Calculations
An individual’s choice of early retirement age may be based on a variety of factors
including economic considerations (i.e. total retirement income relative to current
income), availability of part-time employment, disablement, job satisfaction, and joint
planning for married couples.
Depending on the circumstances surrounding the plan termination, the PBGC
methodology calculates the assumed retirement age (XRA) as either:
• the earliest possible retirement age, or
• an age between the earliest possible retirement age and the earliest age for
unreduced retirement benefits – where (for active employees, if termination of
employment is required for benefit receipt) the calculation of this age is based on the
magnitude of the unreduced benefit, adjusted for the years until it is payable.
Outliers in the study point out areas of deficiency in this method – namely the absence of
consideration of the plan’s early retirement factors including: (1) the impact of alternate
early retirement schedules, and (2) differences in the level of subsidization at various
retirement ages. Other items also seem to be relevant. For instance, other sources of
retirement income are not directly taken into account – particularly potential income
from Social Security at age 62 and income from other retirement plans.
In most medium and large retirement plan valuations, these factors are taken into
account by the use of retirement rates based, at least in part, on the plan’s experience.
The considerations involved in setting retirement ages for terminated plans – particularly
the additional incentive to commence payment at the first age for unreduced benefits due
to the frozen benefit accruals, and potential differences in experience for plan
terminations of financially troubled vs. ongoing employers – argues for a separate review
of the data applicable to this group. Data available for plans the PBGC has trusteed
would be one such source of data, keeping in mind that it generally applies to financially
troubled employers. This data could be reviewed and contrasted with the results of other
studies – for instance the retirement rate studies conducted by the Society of Actuaries.
Another approach would be to attempt to provide some quantification of the factors
underlying retirement decisions for employees nearing retirement – including the impact
of early retirement reduction factors – using focus groups or statistical sampling
techniques.

PBGC Plan Termination Cost Study
Page 5
Study Description and Methodology
2.1 PurposeThis study was designed as a pilot study to pinpoint potential areas for future research
regarding the use and derivation of PBGC assumptions. The technique used was to analyze
differences between the actual costs of non-trusteed pension plan terminations and those
predicted using Pension Benefit Guaranty Corporation (PBGC) actuarial assumptions for
annuities.
Data for the study was solicited from the actuarial community for plan terminations.
Responses with comprehensive individual participant data were received from 5 companies for
a total of 38 plans. Most of the data received related to plan terminations that occurred
between 1994 and 1997 and thus fell under the current PBGC assumption structures.
2.2 DataData requested included individual participant data and plan provisions supplied to insurers for
annuity quotes and individual participant data for cashouts. Data supplied included individual
participant data for 38 plans. Thirty-five of these plans purchased annuities for at least some
of their participants and most provided a cashout election to deferred annuitants. Individual
cashout data was provided for 16 cases. With this additional information, complete plan
termination data was available for 17 cases. The data was not audited. A summary of the data
provided appears in Table 1. Relevant plan provisions are summarized in Appendix B.
Table 1: Summary of Data Provided for 38 Plans Included in the Study
Number of Participants
Data For: Plans
Employees
and Vested
Terminations Retired Total
Total
Settlement
Amount
Average
Settlement
Amount
Annuity Settlements 35 2,923 4,003 6,926 $172,562,323 $24,915
Cashout Settlements 16 7,754 27 7,781 $44,504,451 $5,720
Total Plan Settlements 17 8,972 855 9,827 $72,412,492 $7,369
2.3 Methodology and Assumptions

PBGC Plan Termination Cost Study
Page 6
For each plan, PBGC plan termination costs were determined as of each plan’s settlement date
using then-current PBGC annuity assumptions for trusteed single-employer plans. For plans
terminating on or after November 1, 1993 (the majority of plan’s included in the study), these
assumptions included:
• PBGC select and ultimate interest rates (i1 and i2)
• The 1983 Group Annuity Mortality Table
• Retirement at a single assumed retirement age (XRA), based on earliest possible
retirement age, earliest age for unreduced benefits, whether termination of employment
was required for benefit commencement, and, in certain cases, monthly benefit amount
and year of eligibility for unreduced benefits
• The PBGC administrative load based on $200 per participant plus a percentage of the
plan termination liability based on the liability’s size and the i1 interest rate.
Providing the employment relationship was not severed at plan termination, employees at
the plan termination date were assumed to continue to earn service for early retirement
eligibility purposes and not to terminate employment until retirement.
A more detailed description of the assumptions is provided in Appendix A.
PBGC Plan Termination Cost Study
Page 7
Comparison of Annuity Purchase Settlements withPBGC Valuation Results
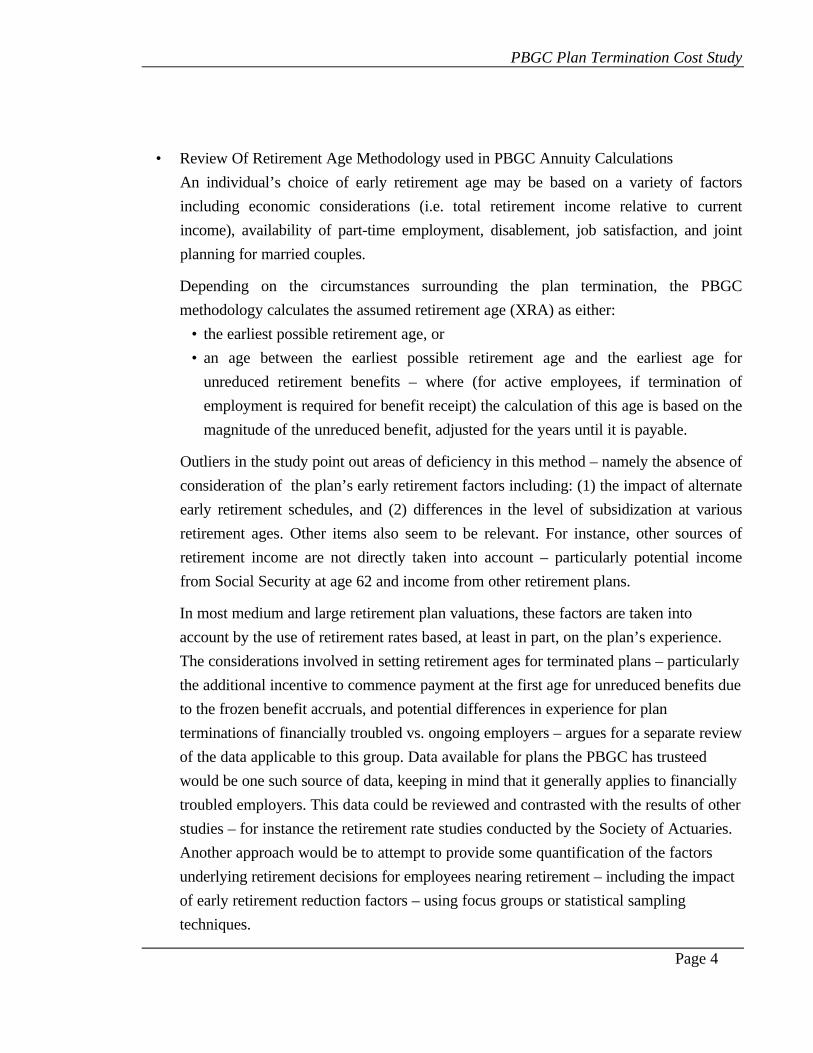
3.1 DataIndividual data was supplied for a total of 35 plans. Cashouts were offered in most of the
cases causing the data to be weighted towards immediate annuities. An estimated 75% of the
total settlement amount was devoted to purchases of immediate annuities. The remaining 25%
represented deferred annuity purchases. The data is summarized in Table 2 below by number
of participants per plan.
Table 2: Distribution of Number of Annuitants by Plan
Number of Participants
Receiving Annuities Number of Plans
1 - 24 11
25 - 99 8
100 - 999 15
>= 1,000 1
Total 35
3.2 Calculation ResultsFor each retirement plan PBGC plan termination costs were calculated as of the annuity
purchase date using the participant data supplied to insurers. These valuation results were then
compared to the amount of the actual cost of annuities.
To facilitate the comparison, the ratio of:
(1) The estimated PBGC plan termination costs for annuitized participants, to
(2) The actual cost of annuities
was calculated. This type of ratio is referred to as a PBGC Plan Termination Ratio for the
remainder of this report. A PBGC Plan Termination Ratio greater than 1.0 indicates that
estimated PBGC plan termination costs were higher than the actual settlement amount.

PBGC Plan Termination Cost Study
Page 8
Figure 1 below shows the distribution of the PBGC Plan Termination Ratios for the 35
annuity purchases in the study. The mean of the distribution is 1.03 and the standard deviation
is .07. If the two outliers less than .90 are eliminated, the mean becomes 1.04 and the standard
deviation is .05.
Figure 1 - Ratios of PBGC Costs to Plan Termination CostsFor Annuity Settlements
0
2
4
6
8
10
12
14
16
<= .74 .75 - .79 .80 - .84 .85 - .89 .90 - .94 .95 - .99 1.00 - 1.04 1.05 - 1.09 1.10 - 1.14 1.15 - 1.19 1.20 - 1.24 >1.24
Ratios
Num
ber
of P
lans

PBGC Plan Termination Cost Study
Page 9
3.3 Analysis
3.3.1 Insurer’s Pricing AssumptionsCertain insurer pricing assumptions (generally interest rate, mortality table, and expense loads)
were supplied for seven cases. These assumptions were analyzed and it appeared that among
them the primary factor causing PBGC plan termination ratios to exceed 1.0 was higher
insurer interest rate assumptions. In six of the seven cases, insurer interest rates exceeded the
PBGC i1 interest rate. For all seven cases, on average, the insurer interest rates exceeded the
PBGC i1 rate by 71 basis points.
PBGC plan termination ratios for the four cases for which individual data was available are
broken down below. For these cases the insurer interest rates exceeded the PBGC i1 rate by
81 basis points on average and, ignoring expenses, the average of the estimated percentage of
premium devoted to immediate annuities was 77%. We were able to reconcile closely to the
purchase prices using the assumptions provided by the insurers. Thus, the net effect of other
factors for which we were not provided insurer assumptions, including the PBGC retirement
age assumptions versus those of the insurer, did not appear to be significant. However, these
plans were fairly simple. They included no lump sums or unusual ancillary benefits and, where
deferred annuities were material, the early retirement provisions were fairly standard – normal
retirement at age 65, retirement as early as age 55, 6.67% / 3.33% per year early retirement
reductions from age 65.
Table 3: Analysis of PBGC Ratio for Four (4) Plan’s Providing Pricing Assumptions
PBGC Plan
Termination Ratio
Average 1.07
Portion Over 1.0 Due to:
Lower PBGC Interest Rates 0.08
Higher PBGC Mortality Rates -0.02
Higher PBGC Administrative Expense 0.01
0.07

PBGC Plan Termination Cost Study
Page 10
Figure 2 below compares PBGC interest rates to insurer interest rates by date of annuity
purchase for the seven cases. In all cases but one, the insurer interest rates exceed the PBGC
interest rates. Similarly, in all but one case, the insurer interest rates exceed the 30-year
Treasury rates, on average by 21 basis points. Figure 3 on the next page illustrates results if
PBGC rates are moved back two months.
Figure 2: Insurer Interest Rates vs. PBGC Interest Rates and 30-year Treasury Rates
6.48%
7.20%7.52%
7.22%
5.76%
7.27%
0.00%
1.00%
2.00%
3.00%
4.00%
5.00%
6.00%
7.00%
8.00%
9.00%
Nov-9
3
Mar-
94Ju
l-94
Nov-9
4
Mar-
95Ju
l-95
Nov-9
5
Mar-
96Ju
l-96
Nov-9
6
Mar-
97Ju
l-97
Nov-9
7
Mar-
98
Month
Inte
rest
Rat
e
30yr Treasuryi1
i2
Insurer
Average of two points, 6.35% &6.60%
PBGC Plan Termination Cost Study
Page 11
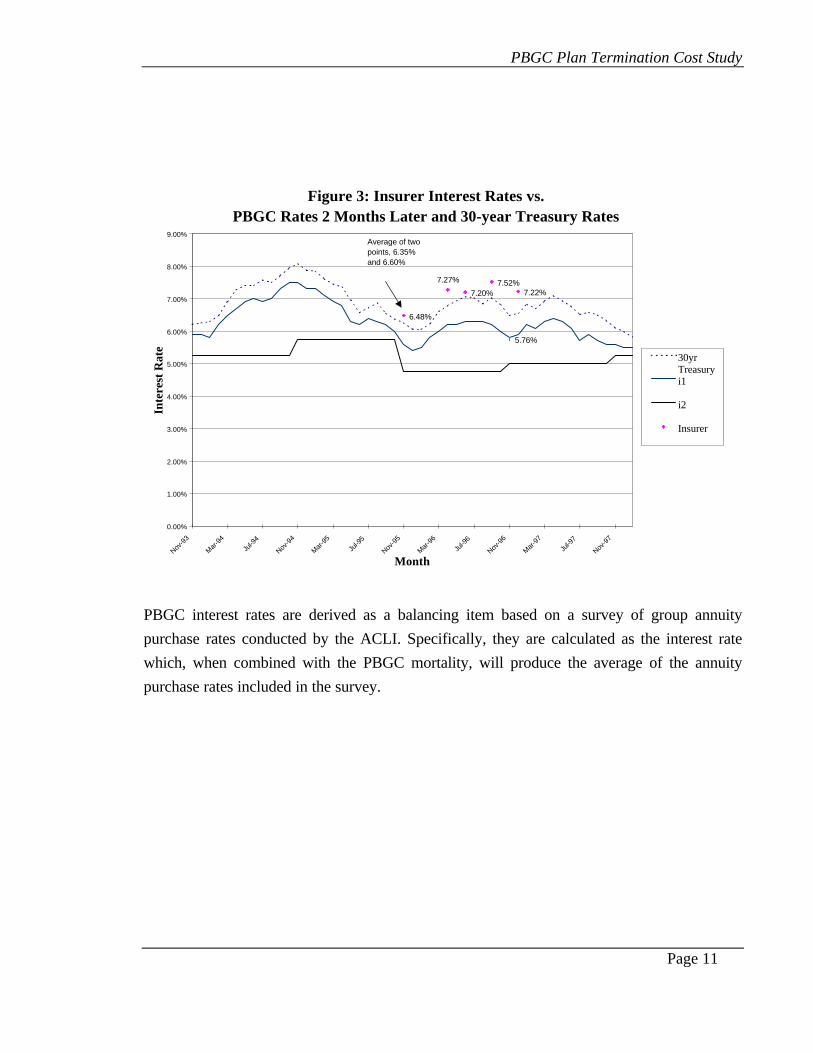
Figure 3: Insurer Interest Rates vs. PBGC Rates 2 Months Later and 30-year Treasury Rates
6.48%
7.20%7.52%
5.76%
7.22%
7.27%
0.00%
1.00%
2.00%
3.00%
4.00%
5.00%
6.00%
7.00%
8.00%
9.00%
Nov-9
3
Mar-9
4
Jul-9
4
Nov-9
4
Mar-9
5
Jul-9
5
Nov-9
5
Mar-9
6
Jul-9
6
Nov-9
6
Mar-9
7
Jul-9
7
Nov-9
7
Month
Inte
rest
Rat
e
30yr Treasuryi1
i2
Insurer
Average of two points, 6.35% and 6.60%
PBGC interest rates are derived as a balancing item based on a survey of group annuity
purchase rates conducted by the ACLI. Specifically, they are calculated as the interest rate
which, when combined with the PBGC mortality, will produce the average of the annuity
purchase rates included in the survey.
PBGC Plan Termination Cost Study
Page 12
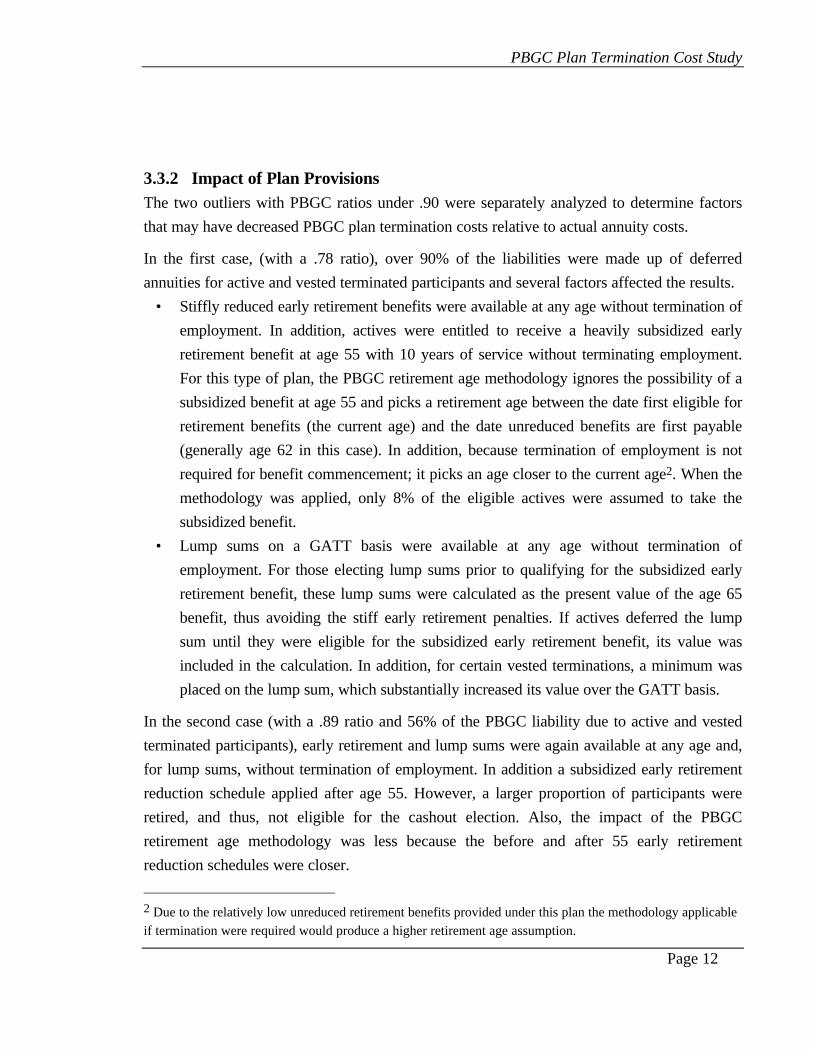
3.3.2 Impact of Plan ProvisionsThe two outliers with PBGC ratios under .90 were separately analyzed to determine factors
that may have decreased PBGC plan termination costs relative to actual annuity costs.
In the first case, (with a .78 ratio), over 90% of the liabilities were made up of deferred
annuities for active and vested terminated participants and several factors affected the results.
• Stiffly reduced early retirement benefits were available at any age without termination of
employment. In addition, actives were entitled to receive a heavily subsidized early
retirement benefit at age 55 with 10 years of service without terminating employment.
For this type of plan, the PBGC retirement age methodology ignores the possibility of a
subsidized benefit at age 55 and picks a retirement age between the date first eligible for
retirement benefits (the current age) and the date unreduced benefits are first payable
(generally age 62 in this case). In addition, because termination of employment is not
required for benefit commencement; it picks an age closer to the current age2. When the
methodology was applied, only 8% of the eligible actives were assumed to take the
subsidized benefit.
• Lump sums on a GATT basis were available at any age without termination of
employment. For those electing lump sums prior to qualifying for the subsidized early
retirement benefit, these lump sums were calculated as the present value of the age 65
benefit, thus avoiding the stiff early retirement penalties. If actives deferred the lump
sum until they were eligible for the subsidized early retirement benefit, its value was
included in the calculation. In addition, for certain vested terminations, a minimum was
placed on the lump sum, which substantially increased its value over the GATT basis.
In the second case (with a .89 ratio and 56% of the PBGC liability due to active and vested
terminated participants), early retirement and lump sums were again available at any age and,
for lump sums, without termination of employment. In addition a subsidized early retirement
reduction schedule applied after age 55. However, a larger proportion of participants were
retired, and thus, not eligible for the cashout election. Also, the impact of the PBGC
retirement age methodology was less because the before and after 55 early retirement
reduction schedules were closer.
2 Due to the relatively low unreduced retirement benefits provided under this plan the methodology applicableif termination were required would produce a higher retirement age assumption.

PBGC Plan Termination Cost Study
Page 13
Summaries of early and normal retirement provisions for plans in the study are provided in
Appendix B.
3.3.3 Impact of Case SizePBGC plan termination cost ratios were calculated by case size. The results are summarized in
Table 4 below. The ratios appear to increase somewhat by total annuity purchase price, but a
larger sample and an analysis of other factors – such as the percentage of premium devoted to
immediate versus deferred annuities − would be necessary to reach any conclusions. For the
cases shown below, the percentage of premium devoted to immediate annuities was higher
(87%) for the $10,000,000 plus premium group than for the remainder of the group (72%).
For these results the two outliers discussed above, which fell in the lower purchase price
categories, have been removed.
Table 4: Distribution of PBGC Plan Termination Ratios by Annuity Purchase Price3
Average Price per Participant
Total Annuity Purchase Price
Under
$25,000
$25,000 to
$49,999
$50,000
or More Total
Less than $1,000,000 1.04 1.05 1.10 1.05
$1,000,000 - $4,999,999 1.03 1.03 1.01 1.02
$5,000,000 - $9,999,999 1.06 .97 1.06 1.05
$10,000,000 or More 1.00 1.14 1.08 1.07
Total 1.04 1.04 1.05 1.04
3.4 Conclusions• For the group of annuity purchases reviewed, PBGC plan termination costs are close to,
but consistently somewhat higher than, annuity settlement costs. In some cases these
differences can be explained by differences in assumed interest rates.
• The PBGC XRA methodology is not well suited to cases where multiple early retirement
schedules are involved.
3 Numbers of plans associated with this chart are: Row 1: 8, 3, 1, 12 Row 2: 4, 3, 3, 10 Row 3: 5, 1, 2, 8 Row4: 1, 1, 1,3 Row 5: 18, 8, 7, 33.

PBGC Plan Termination Cost Study
Page 14
Comparison of Cashout Settlements with PBGC Valuation Results
4.1 DataIndividual data was supplied for a total of 16 plans. It is summarized below in Table 5 by
number of participants per plan.
Table 5: Distribution of Number of Participants Receiving Lump Sums by Plan
Number of Plan Participants
Receiving Lump Sums Number of Plans
1 - 24 4
25 - 99 4
100 - 999 7
>= 1,000 1
Total 16
4.2 Calculation ResultsFor each retirement plan for which cashout data was supplied, PBGC plan termination costs
were calculated as of the cashout date. For this calculation, PBGC plan termination costs were
calculated based on PBGC annuity assumptions for all cashouts, including those under
$5,0004. These valuation results were then compared to the actual cashout amounts.
To facilitate the comparison, the ratio of:
(1) the PBGC plan termination costs for cashed out participants and
(2) the actual cashout amounts
was calculated. As in the previous section, this ratio is referred to as the “PBGC Plan
Termination Ratio.” A “PBGC Plan Termination Ratio” greater than 1.0 indicates that
estimated PBGC plan termination costs were higher than the sum of the lump sum cashouts
paid upon plan termination.
4 Had PBGC cashout assumptions been used instead of PBGC annuity assumptions for cashouts under $5,000,PBGC plan termination costs for the 16 plans under consideration would have increased by an average ofapproximately 5%.
PBGC Plan Termination Cost Study
Page 15
Plan termination ratios averaged 1.10, but varied substantially from plan to plan. Different
cashout methodologies explained much of the variation. In order to take into account these
differences, the cashout results were split into three categories:
(1) GATT Lump Sum Basis
• 30-Year Treasury Rate
• 1983 Group Annuity Mortality Table on unisex basis
• Retirement at Plan’s Normal Retirement Age
(2) GATT Lump Sum Basis with Recognition of Early Retirement (ER)
• 30-Year Treasury Rate
• 1983 Group Annuity Mortality Table on unisex basis
• Retirement, for those currently eligible, at either PBGC assumed retirement
age (XRA) or earliest possible retirement age
(3) PBGC Lump Sum Basis with Recognition of Early Retirement (ER)
• “Old” PBGC Interest Rates
• UP-1984 Mortality Table
• Retirement, for those currently eligible, at either PBGC assumed retirement
age (XRA) or earliest possible retirement age.
Table 6 on the next page shows average PBGC Plan Termination Ratios by cashout basis.
Figure 4 on the next page shows the distribution of PBGC Plan Termination Ratios for these
cases. As would be expected, the ratios for the two GATT bases are greater than 1 due to the
use of 30-year Treasury rates, while the ratio for the PBGC lump sum basis is less than one,
due to the use of the “Old PBGC assumptions.

PBGC Plan Termination Cost Study
Page 16
Table 6: PBGC Plan Termination Ratios by Cashout Basis
Cashout Basis Plans
Average
PBGC Plan
Termination
Ratio
1) GATT Lump Sum 4 1.38
2) GATT Lump Sum with Recognition of Early Retirement 6 1.14
3) PBGC Lump Sum with Recognition of Early Retirement 6 .88
Total 16 1.10
Figure 4 - Ratios of PBGC Costs to Plan Termination Costs For Cashout Settlements
0
1
2
3
4
5
6
<= .74 .75 - .79 .80 - .84 .85 - .89 .90 - .94 .95 - .99 1.00 - 1.04 1.05 - 1.09 1.10 - 1.14 1.15 - 1.19 1.20 - 1.24 >1.24
Ratios
Num
ber
of P
lans
PBGC Lump Sum Basis - all with early retirement recognition
GATT Lump Sum Basis - 3 with early retirement recognition

PBGC Plan Termination Cost Study
Page 17
4.3 Analysis
4.3.1 Plan Termination CostsIn order to analyze the impact of the PBGC assumptions, the portion of the difference
between PBGC valuation results and actual cashout amounts was broken down by
assumption:
PBGC XRA –Difference between the use of the PBGC retirement age assumption (XRA) and
the cashout basis retirement age assumption5
Sex-distinct Mortality – Difference between PBGC mortality on a sex-distinct basis and
PBGC mortality using a unisex blend of 50/50.
PBGC Mortality – Difference between the PBGC mortality basis on a 50/50 unisex basis and
the cashout basis mortality6.
PBGC Interest Rates – Difference between PBGC interest rates (i1 / i2 basis) and 30-year
Treasuries, for GATT basis, and “old” PBGC interest rates, for PBGC Lump sum basis.
Lag in Cashout Interest Rate – Difference due to use of an interest rate prior to the month
preceding cashout. Due to declining interest rates, the lag produced gains during the study
period.
PBGC Administrative Expenses – Difference between PBGC administrative expenses and
actual expenses charged to trust. This difference has been set to zero since no estimate of
administrative expenses for cashouts was available.
Table 7 shows the impact of each assumption on the PBGC Ratios by cashout basis. It also
shows the PBGC Ratios if differences due to sex-distinct versus unisex mortality and the
5 The cashout retirement age assumptions are: normal retirement age for Basis (1) and for those not eligiblefor early retirement under Bases (2) and (3); either attained age or PBGC XRA for those eligible for earlyretirement under Bases (2) and (3).6 The difference for cases where the UP-1984 table applies also reflects the difference between the 50/50unisex basis and the unisex basis that underlies that table (80/20).

PBGC Plan Termination Cost Study
Page 18
timing of interest rates are eliminated. On this basis, the average PBGC Plan Termination
Ratio for the total group is 1.09.
Table 7: Analysis of PBGC Annuity Assumption vs. Cashout Results by Assumption
GATT Lump
Sum
GATT Lump
Sum w/ER PBGC w/ER
PBGC Ratio 1.38 1.14 .88
Difference due to:
1) PBGC XRA .02 .03 .02
2) Sex-distinct Mortality .02 -.07 -.03
3) PBGC Mortality .00 .00 .12
4) PBGC Interest Rates .17 .18 -.23
5) Lag in Cashout Interest Rate .17 .00 .00
6) Administrative Expenses .00 .00 .00
Total .38 .14 -.12
PBGC Ratio recalculated without 2)
and 5)7
1.17 1.21 .91
The average male/female distribution for the cases included in the cashout group is 69%/31%.
However the proportions for the various subgroups (33%/67%, 92%/8%, 69%/31%) vary
considerably. Unisex mortality differences have been eliminated from the remainder of the
study on the grounds that they may not be representative of results for a larger population.
Differences due to the use of interest rates at the beginning of the calendar year or at some
other date prior to the actual cashout date have also been eliminated from the remainder of the
study. The majority of the plans with cashouts utilized interest rates for the month prior to the
month of cashout. Results for the cases with larger lags were adjusted to this basis for the
remainder of the report.
7 Not subtractive in all cases due to impact of changing both numerator and denominator of PBGC Ratio
PBGC Plan Termination Cost Study
Page 19
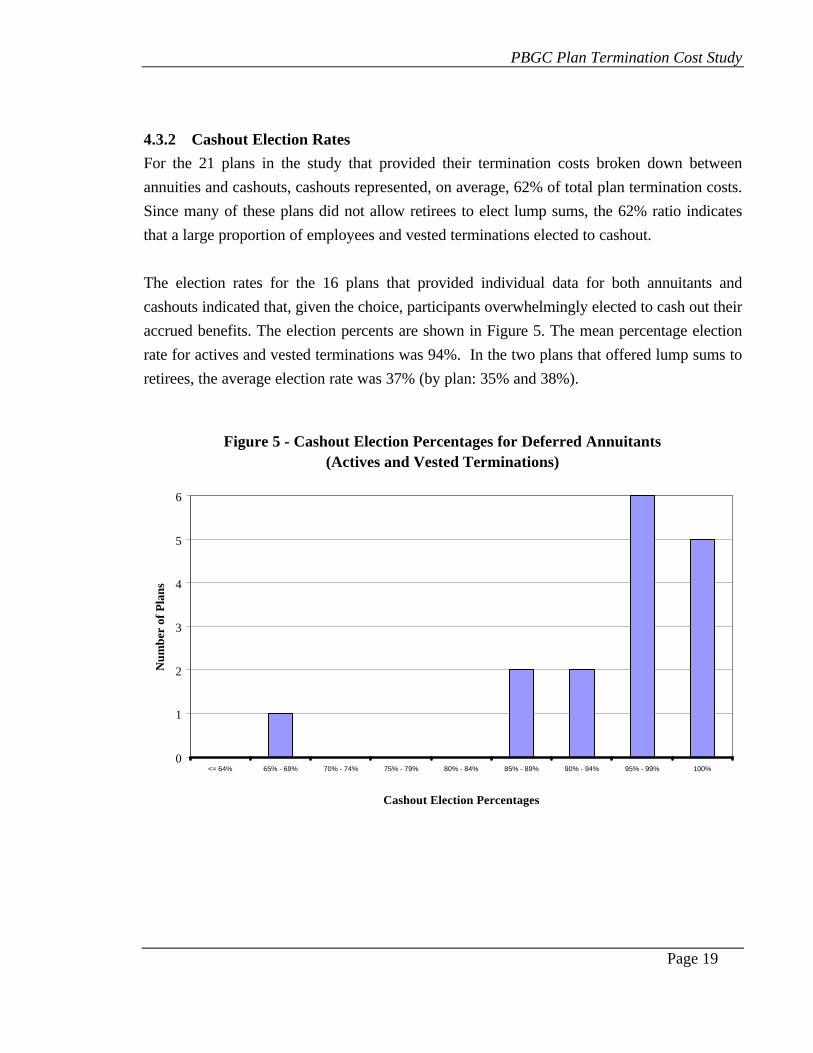
4.3.2 Cashout Election Rates
For the 21 plans in the study that provided their termination costs broken down between
annuities and cashouts, cashouts represented, on average, 62% of total plan termination costs.
Since many of these plans did not allow retirees to elect lump sums, the 62% ratio indicates
that a large proportion of employees and vested terminations elected to cashout.
The election rates for the 16 plans that provided individual data for both annuitants and
cashouts indicated that, given the choice, participants overwhelmingly elected to cash out their
accrued benefits. The election percents are shown in Figure 5. The mean percentage election
rate for actives and vested terminations was 94%. In the two plans that offered lump sums to
retirees, the average election rate was 37% (by plan: 35% and 38%).
Figure 5 - Cashout Election Percentages for Deferred Annuitants (Actives and Vested Terminations)
0
1
2
3
4
5
6
<= 64% 65% - 69% 70% - 74% 75% - 79% 80% - 84% 85% - 89% 90% - 94% 95% - 99% 100%
Cashout Election Percentages
Num
ber
of P
lans

PBGC Plan Termination Cost Study
Page 20
4.4 Conclusions• Given the opportunity, a significant percentage of participants in the plans contained in the
study elected to cash out their accrued benefits.
• For this sample of cases, the relationship of PBGC plan termination costs to cashout
amount is heavily dependent on the interest rate and mortality basis used in calculating
cashout amounts (GATT vs. “Old PBGC”). For GATT basis cashouts, the average PBGC
Plan Termination Ratios were 1.17 and 1.21, depending on whether or not early
retirement was recognized. For “Old PBGC” basis cashouts, the average PBGC Ratio was
.91.

PBGC Plan Termination Cost Study
Page 21
Comparison of Total Settlements with PBGC Valuation Results
5.1 DataIndividual data was supplied for a total of 17 plans. It is summarized below in Table 8 by
number of participants per plan.
Table 8: Distribution of Number of Participants by Plan
Number of Participants Number of Plans
1 - 24 4
25 - 99 3
100 - 999 9
>= 1,000 1
Total 17
5.2 Calculation ResultsPBGC plan termination costs were summed for cashouts and annuitants. These valuation
results were then compared to the total actual settlement amounts.
To facilitate the comparison, the ratio of:
(1) The PBGC plan termination costs for cashouts and annuitants and
(2) The actual settlement amounts, including cashouts with the adjustments outlined in
Section 4,
was calculated. As in the previous sections, this ratio is referred to as the “PBGC Plan
Termination Ratio.” A “PBGC Plan Termination Ratio” greater than 1.0 indicates that
estimated PBGC plan termination costs were higher than the total settlement amount paid
upon plan termination.
Figure 6 on the next page shows the actual distribution of PBGC Plan Termination Ratios for
the 17 plans. When compared to the earlier results for annuity settlements, the introduction of
the cashout element increases the variation in results between plans.

PBGC Plan Termination Cost Study
Page 22
Figure 6 - Ratios of PBGC Cost to Plan Termination Costs for Annuity and Cashout Settlements Combined
0
1
2
3
4
5
<= .74 .75 - .79 .80 - .84 .85 - .89 .90 - .94 .95 - .99 1.00 - 1.04 1.05 - 1.09 1.10 - 1.14 1.15 - 1.19 1.20 - 1.24 >1.24
Ratios
Num
ber
of P
lans
PBGC Lump Sum Basis all with early retirement recognition
GATT Lump Sum Basis and 1 without cashout provisions

PBGC Plan Termination Cost Study
Page 23
5.3 AnalysisAverage results are summarized by cashout type in Table 9. Again, the type of cashout plays
an important role in the comparison of the final settlement amount to the estimated PBGC
plan termination cost. In making comparisons between results for annuities and cashouts it
should be noted that the annuitized group is composed primarily of immediate annuities, while
the cashout group is composed primarily of deferred annuitants.
Table 9: PBGC Plan Termination Ratios by Cashout Basis
Cashout Average PBGC Plan Termination Ratio For:
Cashout Basis Plans Elections8 Annuities Cashouts Plan
1) GATT Lump Sum 4 94% 1.03 1.17 1.13
2) GATT Lump Sum w/ER 6 97% 1.04 1.21 1.17
3) PBGC Lump Sum w/ER 6 92% 1.04 .91 .96
4) Only Annuities 1 NA 1.16 NA 1.16
Total 17 1.05 1.08 1.09
5.4 Conclusion• For the plans in this study offering GATT minimum lump sums at plan termination,
cashouts appear to have a significant impact on actual settlement costs; however, any
comparison of annuity and cashout results should consider the different demographics of
the two groups.
8 Percentages of active and vested terminated participants electing to cash out. In addition, one plan inCashout Basis Group 1) and one plan in Cashout Basis Group 2) allowed cashouts by retirees.

PBGC Plan Termination Cost Study
Appendix Page 1
Appendix A – Actuarial Assumptions
XRA – Calculated according to PBGC Regulations. Participants actively employed at the plan
termination were assumed to remain employed until retirement, unless the plan termination
was due a stock sale or a plant closing or the annuity bid specifications indicated that future
service did not apply towards early retirement eligibility.
Interest Rates – PBGC interest rates for annuities as of the date of settlement. Cashouts by the
PBGC of amounts under $5,000 were ignored.
Mortality –
For settlements on or after November 1, 1993:
Healthy Lives – 1983 GAM Male Table with 6-year setback for females
Disabled Lives – PBGC disability mortality rates for retirees not eligible for Social
Security Disability Benefits.
For settlements before November 1, 1993:
Healthy Lives – UP-1984 Mortality Table on sex distinct basis
Disabled Lives – UP-1984 table set forward 3 years for males and females
PBGC Administrative Expenses – Calculated according to PBGC Regulations. Figures for
annuitized lives and cashouts utilize the formula, which is weighted more heavily for present
values under $200,000, independently based on the present value for the type of settlement
under consideration. Combined plan results utilize the formula based on total plan liabilities.
Joint and Survivor Forms and REA Death Benefits – Load of .7%, based on valuations of
joint and survivor forms and REA death benefits for 17 cases using PBGC assumptions which
are:
Percent Married – 100%
Spouse age Difference – Husband 4 years older than wife.

PBGC Plan Termination Cost Study
Appendix Page 2
Appendix B –Plan Provisions
Pertinent plan provisions are summarized in the tables below. Early retirement schedules ofoutliers are in bold.
Table B.1 – Normal and Early Retirement Provisions
Type of Retirement Provisions: Number Of Plans That Provided Data For:
NRA ERA Reduction Annuitants Cashouts
Both
Annuitants
and Cashouts
65, 1 0 0
65, any, Act Equiv 1 0 0
65, 55, Act Equiv 3 0 0
65, 55/10, Act Equiv 3 1 1
62, 58, Act Equiv 1 1 1
65, 55, 6.67% 1 0 0
65, 62, 6.67% 0 1 1
65, 60/10, 6.67% 0 1 1
65, 62/10, 6.67% 1 1 1
65, 55, 6.67%/3.33% 2 1 2
65, 55/5, 6.67%/3.33% 2 0 0
65, 55/10, 6.67%/3.33% 3 3 3
65, 55/15, 6.67%/3.33% 1 0 0
65, 60/5, 6.67%/3.33% 1 1 1
65, 60/15, 6.67%/3.33% 1 1 1
64, 55, 6.67%/3.33% 1 1 1
65, 55, 6.00% 1 0 0
65, 55/5, 6.00% 1 1 1
65, 55/10, 6.00%/4.00% 1 0 0
65, 55, 6.00%/3.36% 1 1 1
65, 55/10, 6.00%/3.00% 1 1 1
65, 55/10, 5.00% 1 1 1
65, 55/15, 4.00% 1 0 0

PBGC Plan Termination Cost Study
Appendix Page 3
65, 55/30, 3.00%/5.00% 1 0 065, 55/10, Act Equiv
Prior Plan: 3%/5% 1 0 0
65, any age*, Act Equiv
or 62, 55/10, 5.00% (for actives) 1 0 0
65, 55, 6.00%(salaried)
or 65, 55, Act Equiv (union) 1 0 0
65, < 55*, Act Equiv
or 55*, 6.67%/3.33% 1 0 0
Total 35 16 17
* Termination of employment not required
Table B.2. -- Normal Form of Payment of Retirement Benefits
Normal Form Number of Cases
Straight Life 29
10yr C&L 8
5yr C&L 1
Total 38
Table B.3. -- Automatic Form of Retirement Benefits for Married Participants
Automatic Form Number of Cases
50% Joint & Survivor 35
100% Joint & Survivor 3
Total 38
Table B.4. – Deferred Lump Sums after Annuity Purchase
Automatic Form Number of Cases
Not available or for small amounts
Available w/o termination of employment
31
2
Available at termination of employment 5
Total 38


![PENSION BENEFIT GUARANTY CORPORATION 29 CFR Parts …[Billing Code 7709-02-P] PENSION BENEFIT GUARANTY CORPORATION 29 CFR Parts 4001, 4204, 4206, 4207, 4211, 4219 RIN 1212–AB36 Methods](https://static.fdocuments.net/doc/165x107/60fedfdda8101c5239552b98/pension-benefit-guaranty-corporation-29-cfr-parts-billing-code-7709-02-p-pension.jpg)