MAY 2019 ARO - nahb.org · 2007 ARO 2015 ARO 2017 ARO PILOT 2018 ARO PILOT Scope: • Land...
48
MAY 2019 Evaluating its Effects, One Year In AR0 PILOT STUDY AR O
Transcript of MAY 2019 ARO - nahb.org · 2007 ARO 2015 ARO 2017 ARO PILOT 2018 ARO PILOT Scope: • Land...
MAY 2019
Evaluating its Effects, One Year In
A R 0 P I L O T S T U D YARO
CONTENTS
ARO HIST0RY & GOALS ................................................................................................................................................................................. 03
CURRENT ARO PROGRAM ............................................................................................................................................................................. 04
DEVELOPMENT FEASIBILITY CASE STUDY ............................................................................................................................................. 06
DEVELOPMENT FEASIBILITY CASE STUDY ............................................................................................................................................. 08
MARKET RATE PRODUCTION TRENDS ...................................................................................................................................................... 10
LAND SALES BY PRICE PER FAR 2012 - 2018 .......................................................................................................................................... 11
POTENTIAL TAXBASE ..................................................................................................................................................................................... 13
NEW CONSTRUCTION PERMIT ANALYSIS ................................................................................................................................................ 14
REPLACEMENT OF MULTI-UNIT HOUSING WITH SINGLE FAMILY PRODUCT ................................................................................ 18
OVERVIEW OF CITY AFFORDABLE PROGRAMS .................................................................................................................................... 20
AFFORDABLE UNIT PRODUCTION BY AMI ............................................................................................................................................... 22
ARO TRACK RECORD ...................................................................................................................................................................................... 24
ARO PILOT DEVELOPMENT PIPELINE ........................................................................................................................................................ 25
DEVELOPABLE LAND TRANSACTIONS ..................................................................................................................................................... 27
IN-LIEU FEES ..................................................................................................................................................................................................... 28
DOWNTOWN AFFORDABLE DENSITY BONUS PROGRAM ................................................................................................................... 29
CHICAGO POPULATION GROWTH .............................................................................................................................................................. 30
CHICAGO TALENT GROWTH ......................................................................................................................................................................... 31
DOWNTOWN WORKERS LIVING IN PILOT AREAS ................................................................................................................................. 32
COLLEGE GRADUATES CHOOSE CHICAGO ............................................................................................................................................. 34
DOWNTOWN JOB GROWTH ......................................................................................................................................................................... 35
CORPORATE EXPANSIONS ........................................................................................................................................................................... 36
INCLUSIONARY PROGRAMS ACROSS THE US ........................................................................................................................................ 38
COMPARISON OF INCLUSIONARY PROGRAMS ...................................................................................................................................... 40
CONCLUSIONS .................................................................................................................................................................................................. 42
SOLUTIONS ........................................................................................................................................................................................................ 43
SOURCES ............................................................................................................................................................................................................ 44
2011 Q
2012 Q
2013 Q
2015 Q
2015 Q
2015 Q
2014 Q
2014 Q
2016 Q
2016 Q
2017 Q
2017 Q
2018 Q
2018 Q
P R E S E N T E D T O
This research paper was commissioned by the Home Builders Association of Greater Chicago and funded in part by a grant from the State and Local Issues Fund of the National Association of Home Builders.
01
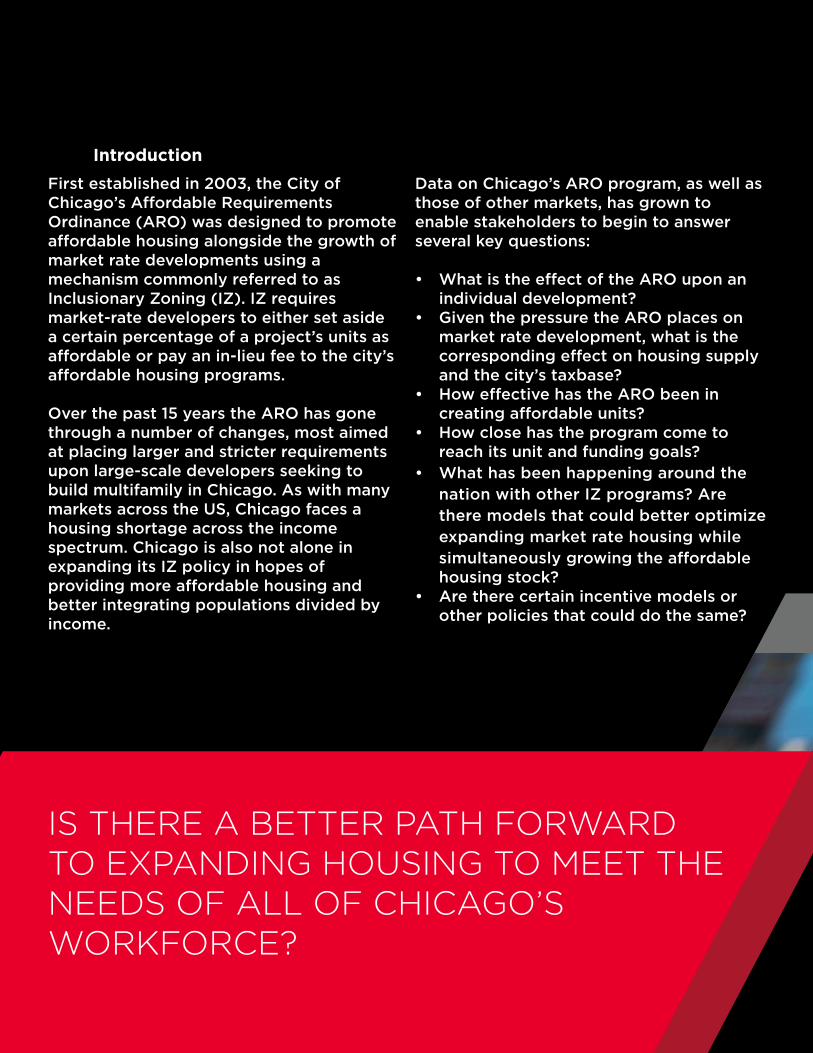
First established in 2003, the City of Chicago’s Affordable Requirements Ordinance (ARO) was designed to promote affordable housing alongside the growth of market rate developments using a mechanism commonly referred to as Inclusionary Zoning (IZ). IZ requires market-rate developers to either set aside a certain percentage of a project’s units as affordable or pay an in-lieu fee to the city’s affordable housing programs.
Over the past 15 years the ARO has gone through a number of changes, most aimed at placing larger and stricter requirements upon large-scale developers seeking to build multifamily in Chicago. As with many markets across the US, Chicago faces a housing shortage across the income spectrum. Chicago is also not alone in expanding its IZ policy in hopes of providing more affordable housing and better integrating populations divided by income.
Data on Chicago’s ARO program, as well as those of other markets, has grown to enable stakeholders to begin to answer several key questions:
• What is the effect of the ARO upon an individual development?
• Given the pressure the ARO places on market rate development, what is the corresponding effect on housing supply and the city’s taxbase?
• How effective has the ARO been in creating affordable units?
• How close has the program come to reach its unit and funding goals?
• What has been happening around the nation with other IZ programs? Are there models that could better optimize expanding market rate housing while simultaneously growing the affordable housing stock?
• Are there certain incentive models or other policies that could do the same?
Introduction
IS THERE A BETTER PATH FORWARD TO EXPANDING HOUSING TO MEET THE NEEDS OF ALL OF CHICAGO’S WORKFORCE?
02
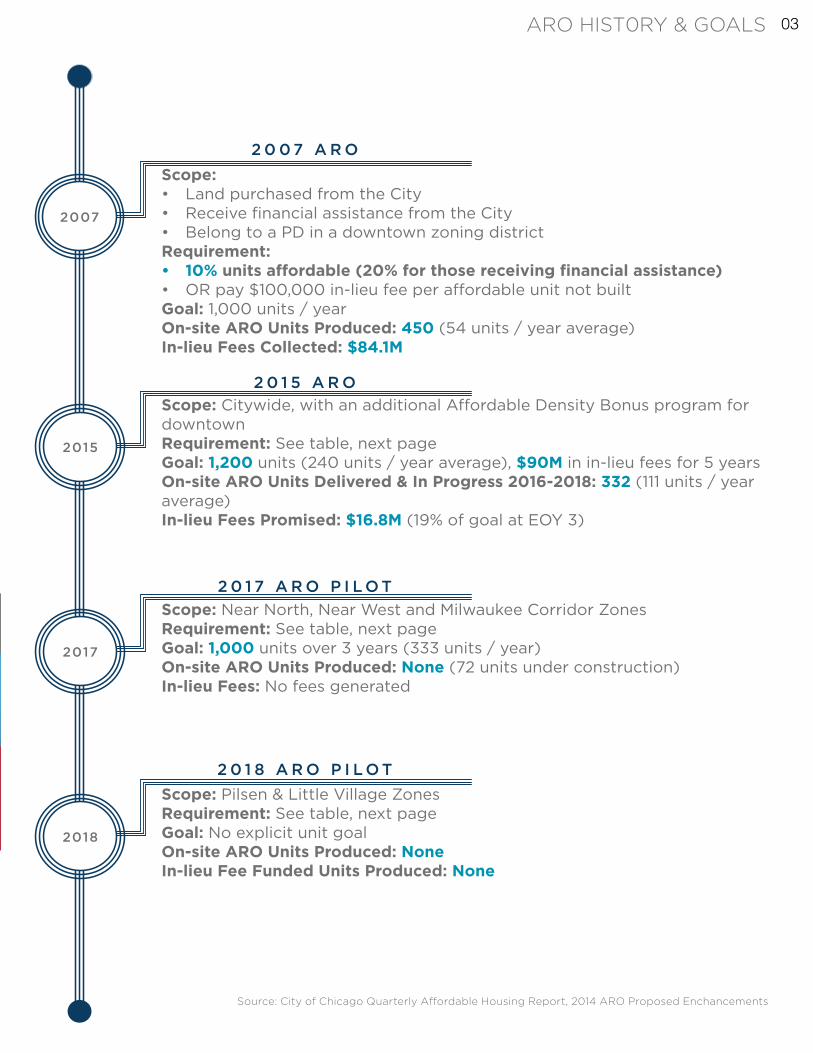
2 0 0 7 A R O
2 0 1 5 A R O
2 0 1 7 A R O P I L O T
2 0 1 8 A R O P I L O T
Scope: • Land purchased from the City• Receive financial assistance from the City• Belong to a PD in a downtown zoning districtRequirement:• 10% units affordable (20% for those receiving financial assistance)• OR pay $100,000 in-lieu fee per affordable unit not builtGoal: 1,000 units / yearOn-site ARO Units Produced: 450 (54 units / year average)In-lieu Fees Collected: $84.1M
Scope: Citywide, with an additional Affordable Density Bonus program for downtownRequirement: See table, next pageGoal: 1,200 units (240 units / year average), $90M in in-lieu fees for 5 yearsOn-site ARO Units Delivered & In Progress 2016-2018: 332 (111 units / year average)In-lieu Fees Promised: $16.8M (19% of goal at EOY 3)
Scope: Near North, Near West and Milwaukee Corridor ZonesRequirement: See table, next pageGoal: 1,000 units over 3 years (333 units / year)On-site ARO Units Produced: None (72 units under construction)In-lieu Fees: No fees generated
Scope: Pilsen & Little Village ZonesRequirement: See table, next pageGoal: No explicit unit goalOn-site ARO Units Produced: NoneIn-lieu Fee Funded Units Produced: None
2007
2015
2017
2018
Source: City of Chicago Quarterly Affordable Housing Report, 2014 ARO Proposed Enchancements
ARO HIST0RY & GOALS 03
Unit Obligation (for multifamily above 10 units)Eligibility
Requirements for Affordable Renters
In-lieu Fee (per unit)
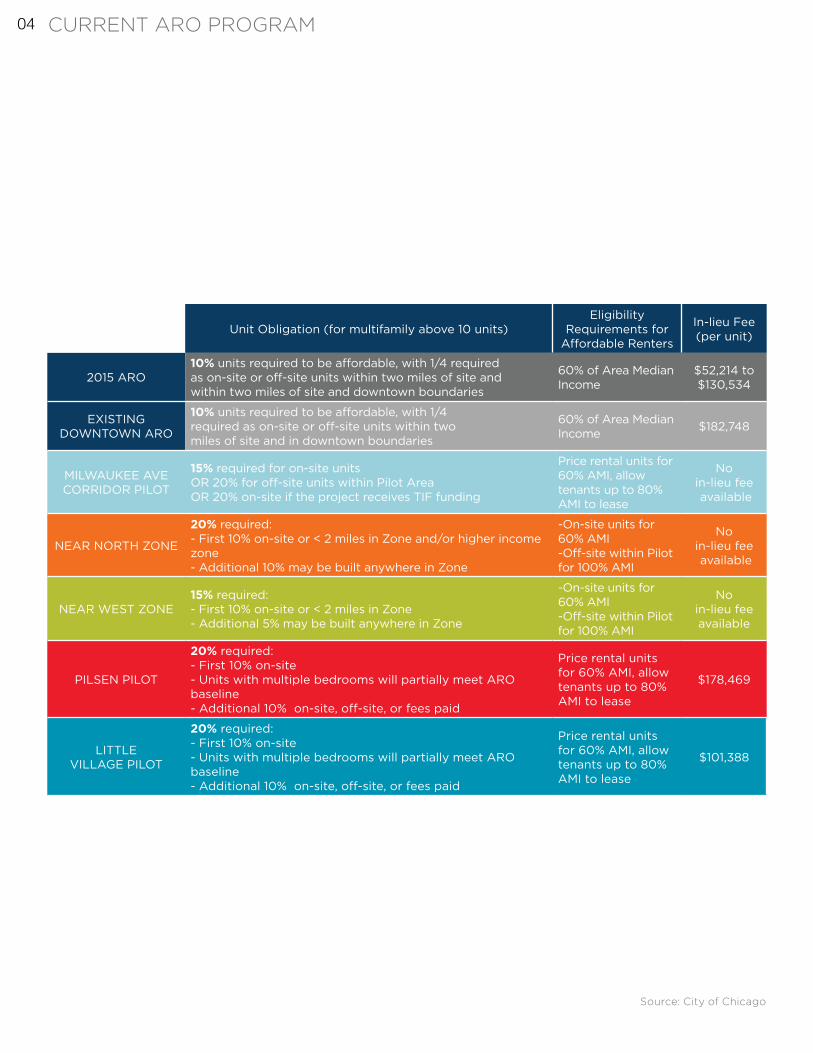
2015 ARO10% units required to be affordable, with 1/4 required as on-site or off-site units within two miles of site and within two miles of site and downtown boundaries
60% of Area Median Income
$52,214 to $130,534
EXISTING DOWNTOWN ARO
10% units required to be affordable, with 1/4 required as on-site or off-site units within two miles of site and in downtown boundaries
60% of Area Median Income $182,748
MILWAUKEE AVE CORRIDOR PILOT
15% required for on-site units OR 20% for off-site units within Pilot Area OR 20% on-site if the project receives TIF funding
Price rental units for 60% AMI, allow tenants up to 80% AMI to lease
No in-lieu fee available
NEAR NORTH ZONE
20% required: - First 10% on-site or < 2 miles in Zone and/or higher income zone - Additional 10% may be built anywhere in Zone
-On-site units for 60% AMI -Off-site within Pilot for 100% AMI
No in-lieu fee available
NEAR WEST ZONE15% required: - First 10% on-site or < 2 miles in Zone - Additional 5% may be built anywhere in Zone
-On-site units for 60% AMI -Off-site within Pilot for 100% AMI
No in-lieu fee available
PILSEN PILOT
20% required: - First 10% on-site - Units with multiple bedrooms will partially meet ARO baseline - Additional 10% on-site, off-site, or fees paid
Price rental units for 60% AMI, allow tenants up to 80% AMI to lease
$178,469
LITTLE VILLAGE PILOT
20% required: - First 10% on-site - Units with multiple bedrooms will partially meet ARO baseline - Additional 10% on-site, off-site, or fees paid
Price rental units for 60% AMI, allow tenants up to 80% AMI to lease
$101,388
Source: City of Chicago
CURRENT ARO PROGRAM 04
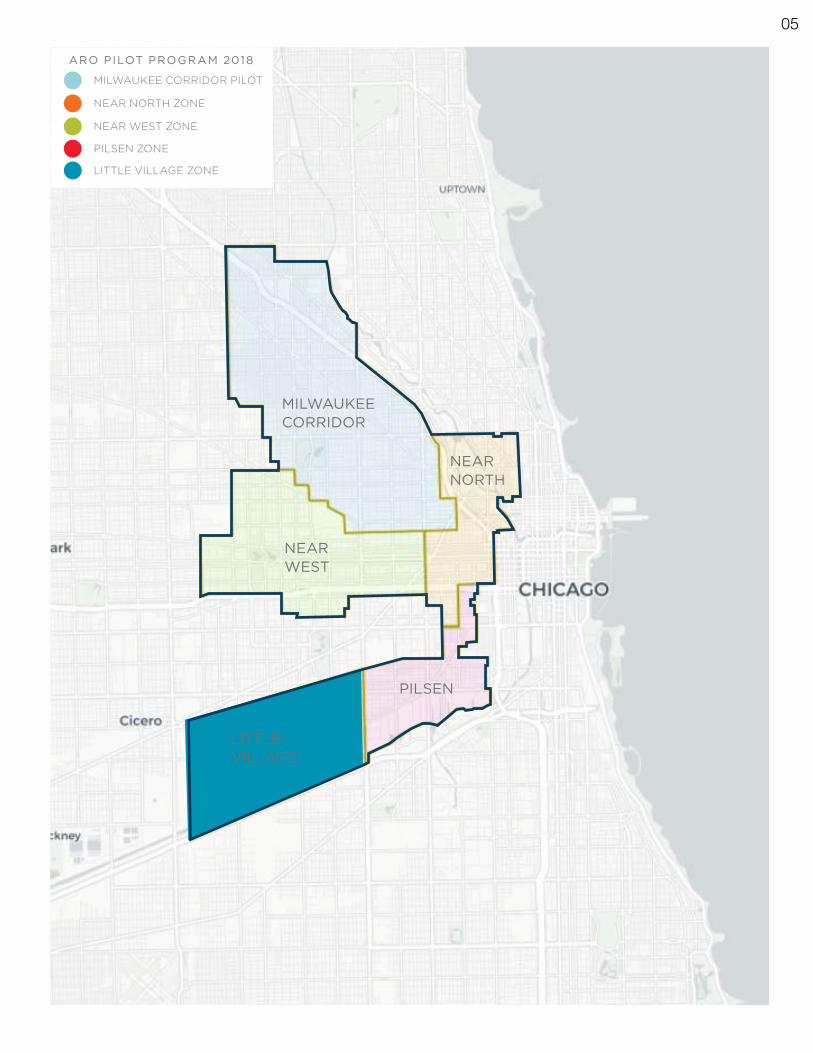
MILWAUKEE CORRIDOR
NEAR NORTH
NEAR WEST
PILSEN
LITTLE VILLAGE
LITTLE VILLAGE ZONE
ARO PILOT PROGRAM 2018
MILWAUKEE CORRIDOR PILOT
NEAR NORTH ZONE
NEAR WEST ZONE
PILSEN ZONE
05
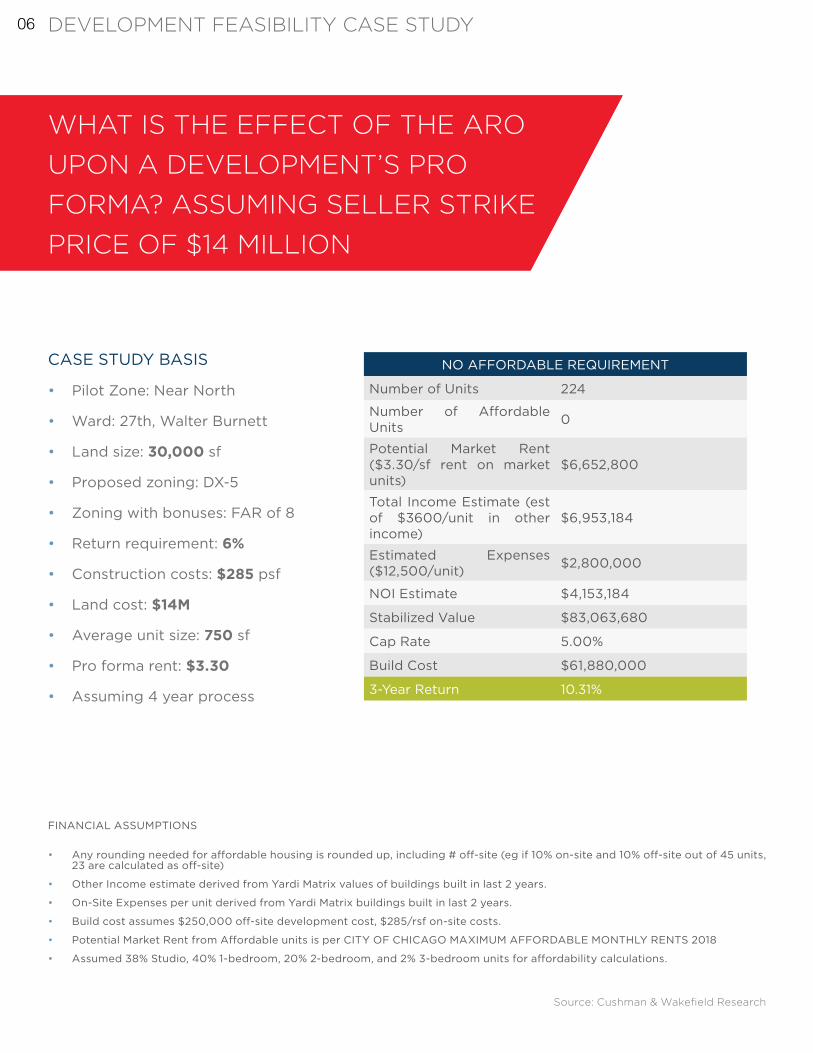
WHAT IS THE EFFECT OF THE ARO UPON A DEVELOPMENT’S PRO FORMA? ASSUMING SELLER STRIKE PRICE OF $14 MILLION
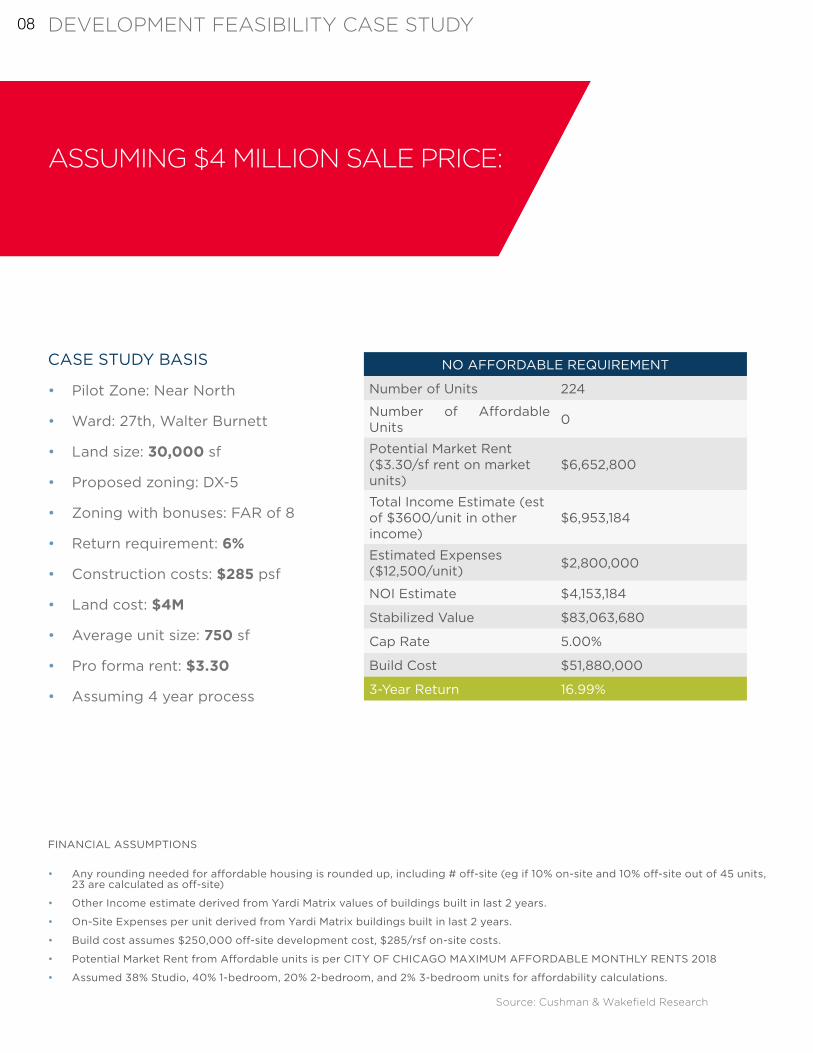
CASE STUDY BASIS
• Pilot Zone: Near North
• Ward: 27th, Walter Burnett
• Land size: 30,000 sf
• Proposed zoning: DX-5
• Zoning with bonuses: FAR of 8
• Return requirement: 6%
• Construction costs: $285 psf
• Land cost: $14M
• Average unit size: 750 sf
• Pro forma rent: $3.30
• Assuming 4 year process
FINANCIAL ASSUMPTIONS
• Any rounding needed for affordable housing is rounded up, including # off-site (eg if 10% on-site and 10% off-site out of 45 units, 23 are calculated as off-site)
• Other Income estimate derived from Yardi Matrix values of buildings built in last 2 years.
• On-Site Expenses per unit derived from Yardi Matrix buildings built in last 2 years.
• Build cost assumes $250,000 off-site development cost, $285/rsf on-site costs.
• Potential Market Rent from Affordable units is per CITY OF CHICAGO MAXIMUM AFFORDABLE MONTHLY RENTS 2018
• Assumed 38% Studio, 40% 1-bedroom, 20% 2-bedroom, and 2% 3-bedroom units for affordability calculations.
NO AFFORDABLE REQUIREMENT
Number of Units 224
Number of Affordable Units 0
Potential Market Rent ($3.30/sf rent on market units)
$6,652,800
Total Income Estimate (est of $3600/unit in other income)
$6,953,184
Estimated Expenses ($12,500/unit) $2,800,000
NOI Estimate $4,153,184
Stabilized Value $83,063,680
Cap Rate 5.00%
Build Cost $61,880,000
3-Year Return 10.31%
Source: Cushman & Wakefield Research
DEVELOPMENT FEASIBILITY CASE STUDY 06
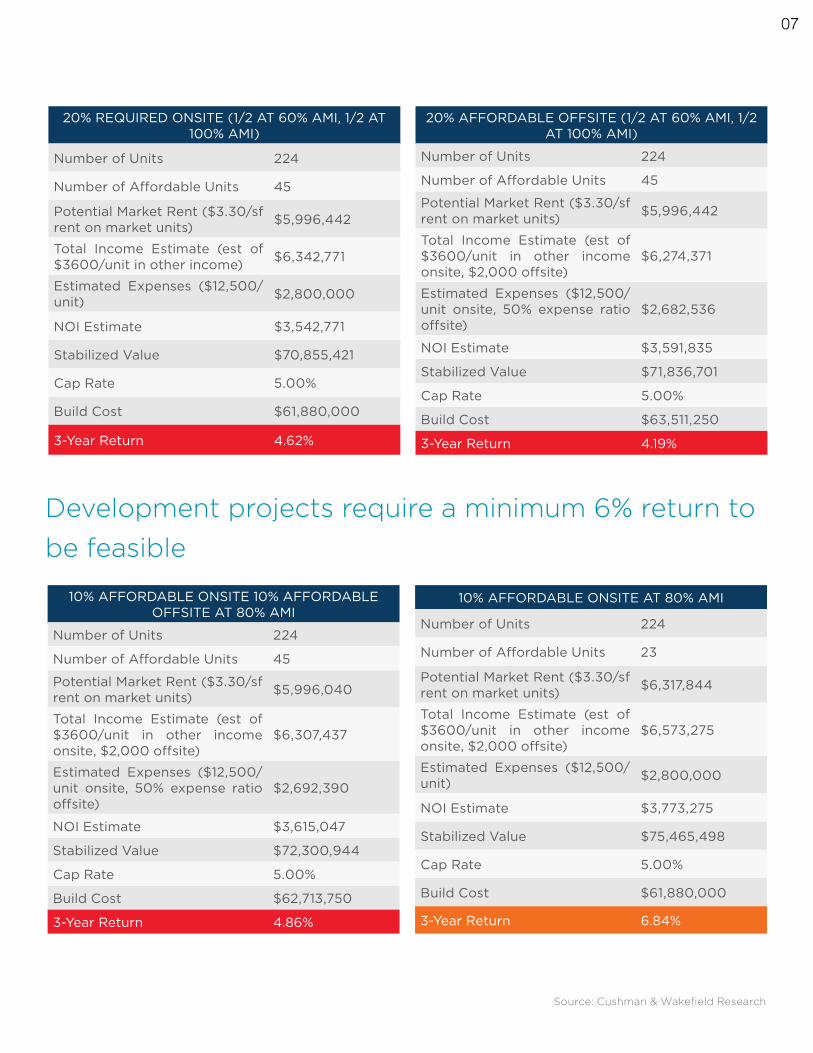
20% REQUIRED ONSITE (1/2 AT 60% AMI, 1/2 AT 100% AMI)
Number of Units 224
Number of Affordable Units 45
Potential Market Rent ($3.30/sf rent on market units) $5,996,442
Total Income Estimate (est of $3600/unit in other income) $6,342,771
Estimated Expenses ($12,500/unit) $2,800,000
NOI Estimate $3,542,771
Stabilized Value $70,855,421
Cap Rate 5.00%
Build Cost $61,880,000
3-Year Return 4.62%
20% AFFORDABLE OFFSITE (1/2 AT 60% AMI, 1/2 AT 100% AMI)
Number of Units 224
Number of Affordable Units 45
Potential Market Rent ($3.30/sf rent on market units) $5,996,442
Total Income Estimate (est of $3600/unit in other income onsite, $2,000 offsite)
$6,274,371
Estimated Expenses ($12,500/unit onsite, 50% expense ratio offsite)
$2,682,536
NOI Estimate $3,591,835
Stabilized Value $71,836,701
Cap Rate 5.00%
Build Cost $63,511,250
3-Year Return 4.19%
10% AFFORDABLE ONSITE 10% AFFORDABLE OFFSITE AT 80% AMI
Number of Units 224
Number of Affordable Units 45
Potential Market Rent ($3.30/sf rent on market units) $5,996,040
Total Income Estimate (est of $3600/unit in other income onsite, $2,000 offsite)
$6,307,437
Estimated Expenses ($12,500/unit onsite, 50% expense ratio offsite)
$2,692,390
NOI Estimate $3,615,047
Stabilized Value $72,300,944
Cap Rate 5.00%
Build Cost $62,713,750
3-Year Return 4.86%
10% AFFORDABLE ONSITE AT 80% AMI
Number of Units 224
Number of Affordable Units 23
Potential Market Rent ($3.30/sf rent on market units) $6,317,844
Total Income Estimate (est of $3600/unit in other income onsite, $2,000 offsite)
$6,573,275
Estimated Expenses ($12,500/unit) $2,800,000
NOI Estimate $3,773,275
Stabilized Value $75,465,498
Cap Rate 5.00%
Build Cost $61,880,000
3-Year Return 6.84%
Source: Cushman & Wakefield Research
Development projects require a minimum 6% return to be feasible
07
CASE STUDY BASIS
• Pilot Zone: Near North
• Ward: 27th, Walter Burnett
• Land size: 30,000 sf
• Proposed zoning: DX-5
• Zoning with bonuses: FAR of 8
• Return requirement: 6%
• Construction costs: $285 psf
• Land cost: $4M
• Average unit size: 750 sf
• Pro forma rent: $3.30
• Assuming 4 year process
FINANCIAL ASSUMPTIONS
• Any rounding needed for affordable housing is rounded up, including # off-site (eg if 10% on-site and 10% off-site out of 45 units, 23 are calculated as off-site)
• Other Income estimate derived from Yardi Matrix values of buildings built in last 2 years.
• On-Site Expenses per unit derived from Yardi Matrix buildings built in last 2 years.
• Build cost assumes $250,000 off-site development cost, $285/rsf on-site costs.
• Potential Market Rent from Affordable units is per CITY OF CHICAGO MAXIMUM AFFORDABLE MONTHLY RENTS 2018
• Assumed 38% Studio, 40% 1-bedroom, 20% 2-bedroom, and 2% 3-bedroom units for affordability calculations.
NO AFFORDABLE REQUIREMENT
Number of Units 224
Number of Affordable Units 0
Potential Market Rent ($3.30/sf rent on market units)
$6,652,800
Total Income Estimate (est of $3600/unit in other income)
$6,953,184
Estimated Expenses ($12,500/unit) $2,800,000
NOI Estimate $4,153,184
Stabilized Value $83,063,680
Cap Rate 5.00%
Build Cost $51,880,000
3-Year Return 16.99%
Source: Cushman & Wakefield Research
ASSUMING $4 MILLION SALE PRICE:
DEVELOPMENT FEASIBILITY CASE STUDY 08
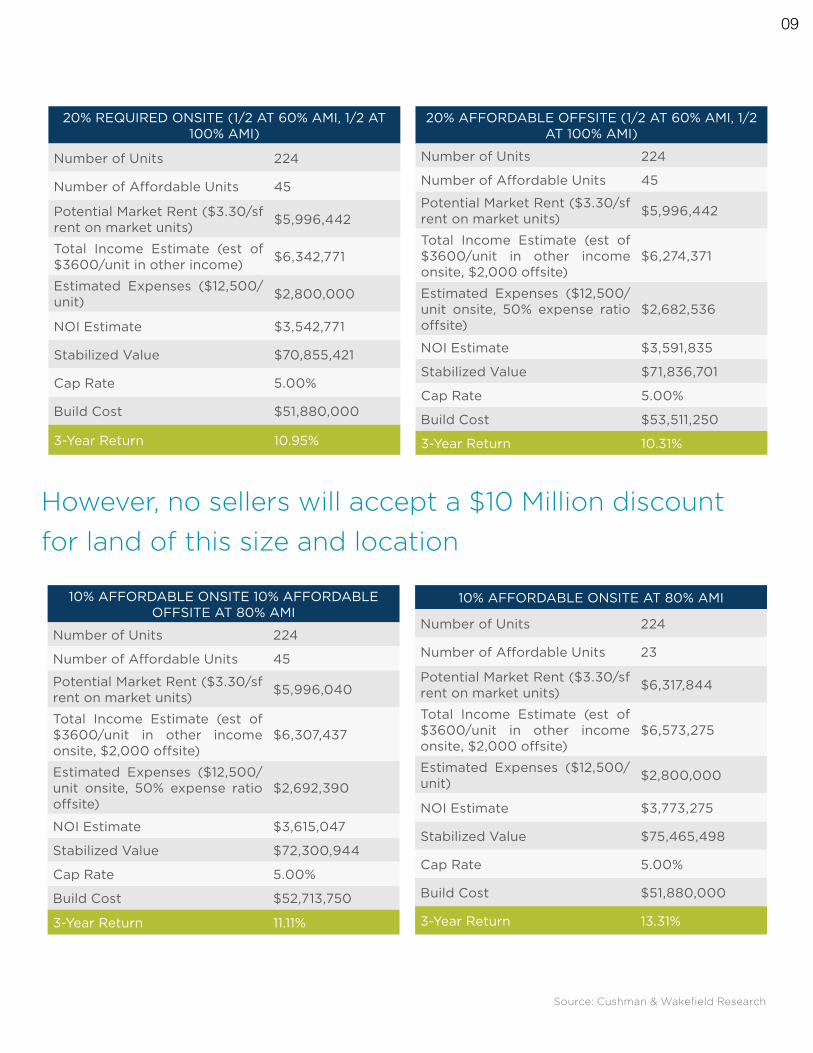
20% REQUIRED ONSITE (1/2 AT 60% AMI, 1/2 AT 100% AMI)
Number of Units 224
Number of Affordable Units 45
Potential Market Rent ($3.30/sf rent on market units) $5,996,442
Total Income Estimate (est of $3600/unit in other income) $6,342,771
Estimated Expenses ($12,500/unit) $2,800,000
NOI Estimate $3,542,771
Stabilized Value $70,855,421
Cap Rate 5.00%
Build Cost $51,880,000
3-Year Return 10.95%
20% AFFORDABLE OFFSITE (1/2 AT 60% AMI, 1/2 AT 100% AMI)
Number of Units 224
Number of Affordable Units 45
Potential Market Rent ($3.30/sf rent on market units) $5,996,442
Total Income Estimate (est of $3600/unit in other income onsite, $2,000 offsite)
$6,274,371
Estimated Expenses ($12,500/unit onsite, 50% expense ratio offsite)
$2,682,536
NOI Estimate $3,591,835
Stabilized Value $71,836,701
Cap Rate 5.00%
Build Cost $53,511,250
3-Year Return 10.31%
10% AFFORDABLE ONSITE 10% AFFORDABLE OFFSITE AT 80% AMI
Number of Units 224
Number of Affordable Units 45
Potential Market Rent ($3.30/sf rent on market units) $5,996,040
Total Income Estimate (est of $3600/unit in other income onsite, $2,000 offsite)
$6,307,437
Estimated Expenses ($12,500/unit onsite, 50% expense ratio offsite)
$2,692,390
NOI Estimate $3,615,047
Stabilized Value $72,300,944
Cap Rate 5.00%
Build Cost $52,713,750
3-Year Return 11.11%
10% AFFORDABLE ONSITE AT 80% AMI
Number of Units 224
Number of Affordable Units 23
Potential Market Rent ($3.30/sf rent on market units) $6,317,844
Total Income Estimate (est of $3600/unit in other income onsite, $2,000 offsite)
$6,573,275
Estimated Expenses ($12,500/unit) $2,800,000
NOI Estimate $3,773,275
Stabilized Value $75,465,498
Cap Rate 5.00%
Build Cost $51,880,000
3-Year Return 13.31%
Source: Cushman & Wakefield Research
However, no sellers will accept a $10 Million discount for land of this size and location
09
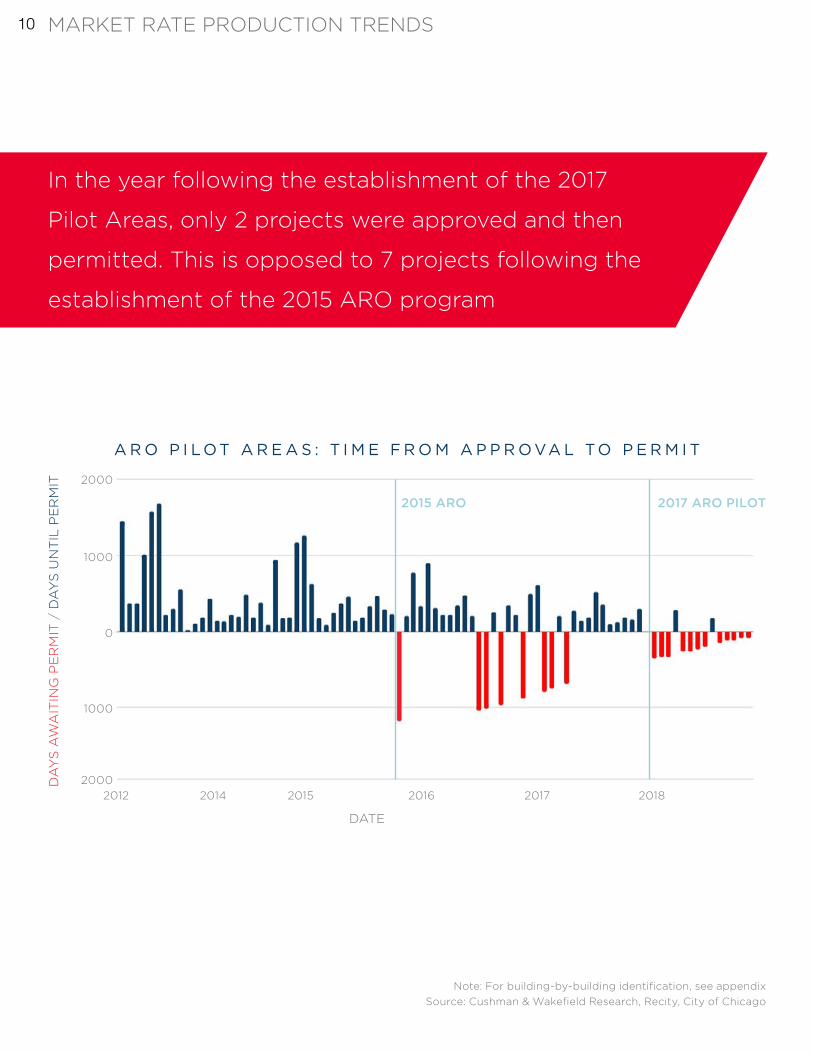
In the year following the establishment of the 2017
Pilot Areas, only 2 projects were approved and then
permitted. This is opposed to 7 projects following the
establishment of the 2015 ARO program
Source: Cushman & Wakefield Research, Recity, City of ChicagoNote: For building-by-building identification, see appendix
A R O P I L O T A R E A S : T I M E F R O M A P P R O VA L T O P E R M I T
2000
1000
1000
DATE
DA
YS
AW
AIT
ING
PE
RM
IT /
DA
YS
UN
TIL
PE
RM
IT
20002012 2014 20162015 2017 2018
0
2015 ARO 2017 ARO PILOT
MARKET RATE PRODUCTION TRENDS 10
$90
$80
DO
LL
AR
PE
R F
AR
YEAR
2007 ARO
25 units
100 units
300+ units
2015 ARO
2017 ARO pilot
$70
$60
$50
$40
$30
$20
$10
2013 2014 2015 2016 2017 2018$0
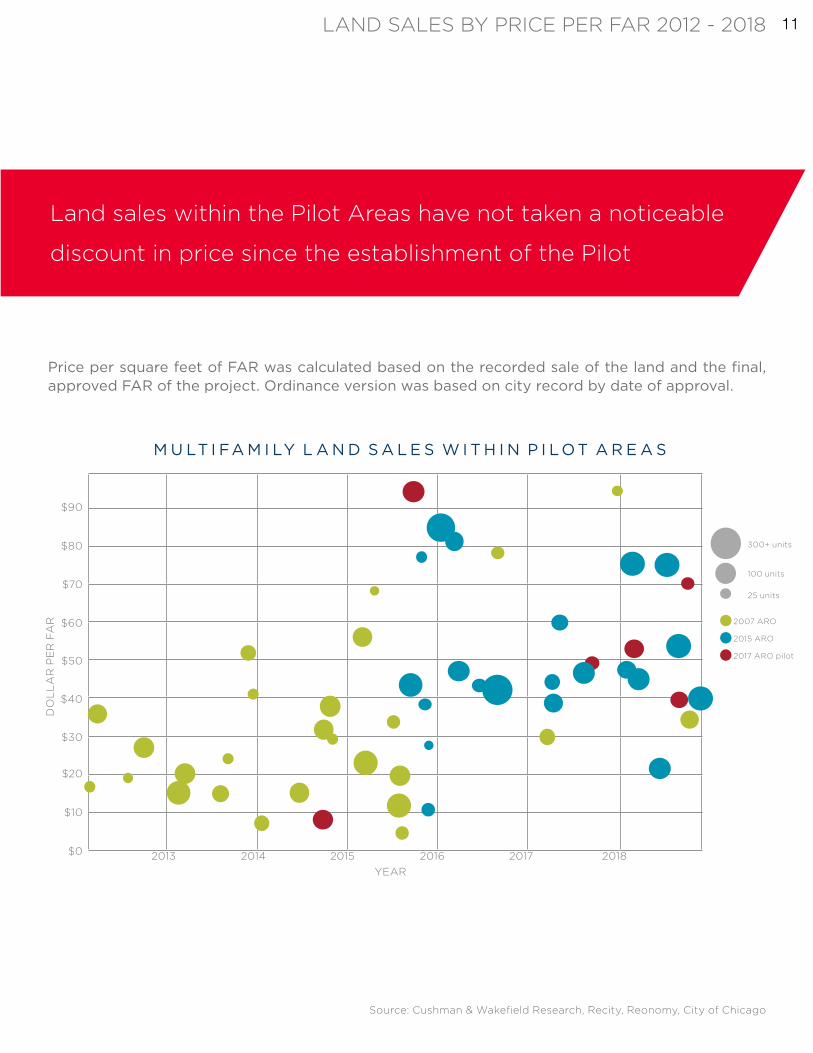
M U LT I FA M I LY L A N D S A L E S W I T H I N P I L O T A R E A S
Price per square feet of FAR was calculated based on the recorded sale of the land and the final, approved FAR of the project. Ordinance version was based on city record by date of approval.
Land sales within the Pilot Areas have not taken a noticeable
discount in price since the establishment of the Pilot
Source: Cushman & Wakefield Research, Recity, Reonomy, City of Chicago
LAND SALES BY PRICE PER FAR 2012 - 2018 11
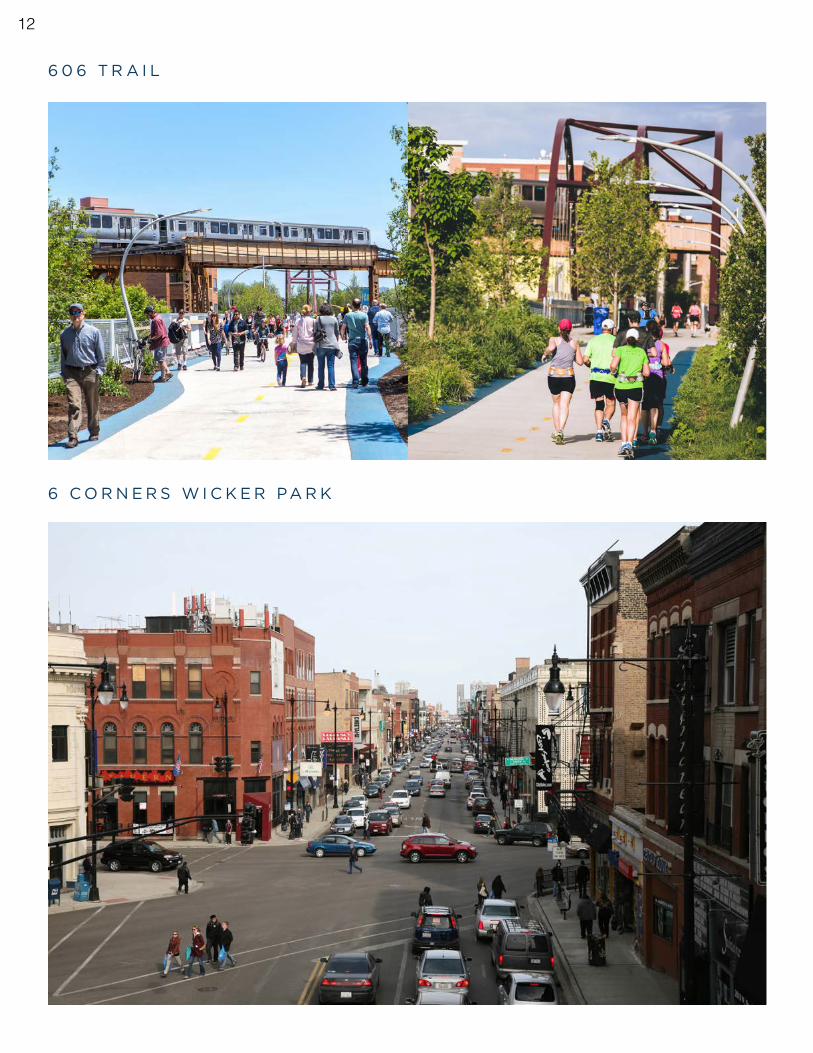
6 0 6 T R A I L
6 C O R N E R S W I C K E R PA R K
12
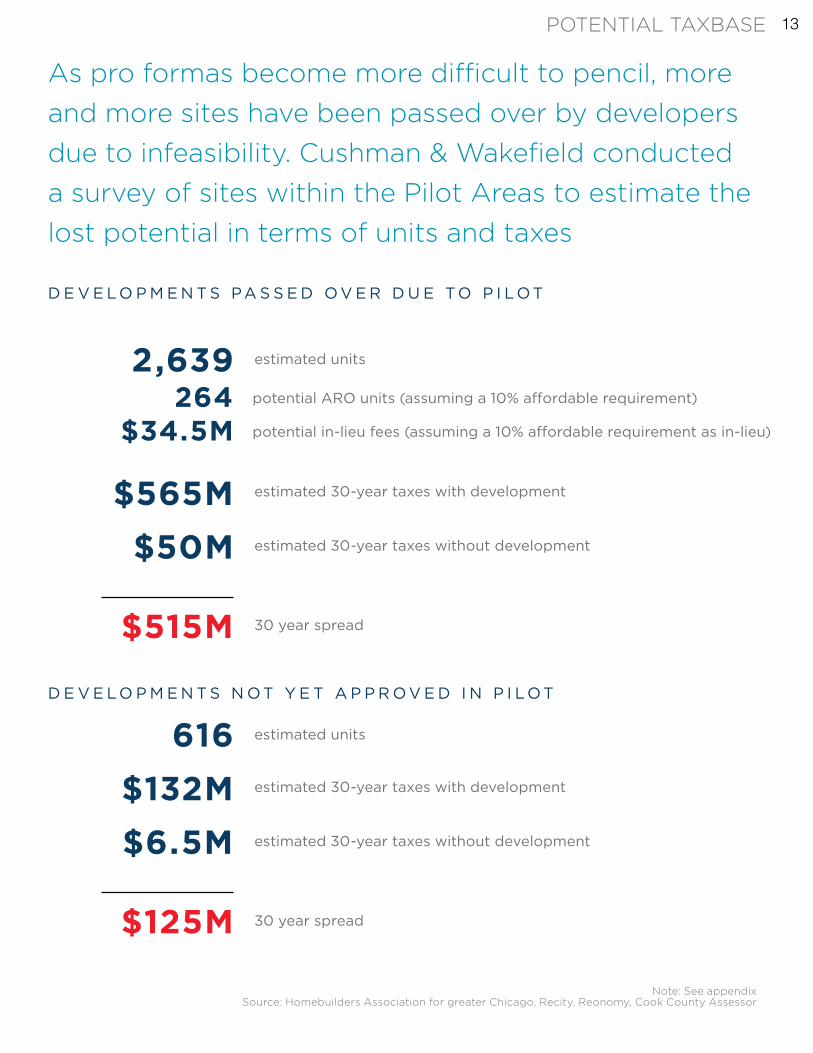
Source: Homebuilders Association for greater Chicago, Recity, Reonomy, Cook County Assessor
As pro formas become more difficult to pencil, more and more sites have been passed over by developers due to infeasibility. Cushman & Wakefield conducted a survey of sites within the Pilot Areas to estimate the lost potential in terms of units and taxes
D E V E L O P M E N T S PA S S E D O V E R D U E T O P I L O T
D E V E L O P M E N T S N O T Y E T A P P R O V E D I N P I L O T
2,639264
$34.5M
616
$565M
$132M
$50M
$6.5M
$515M
$125M
estimated units
potential ARO units (assuming a 10% affordable requirement)
potential in-lieu fees (assuming a 10% affordable requirement as in-lieu)
estimated units
estimated 30-year taxes with development
estimated 30-year taxes with development
estimated 30-year taxes without development
estimated 30-year taxes without development
30 year spread
30 year spread
Note: See appendix
POTENTIAL TAXBASE 13
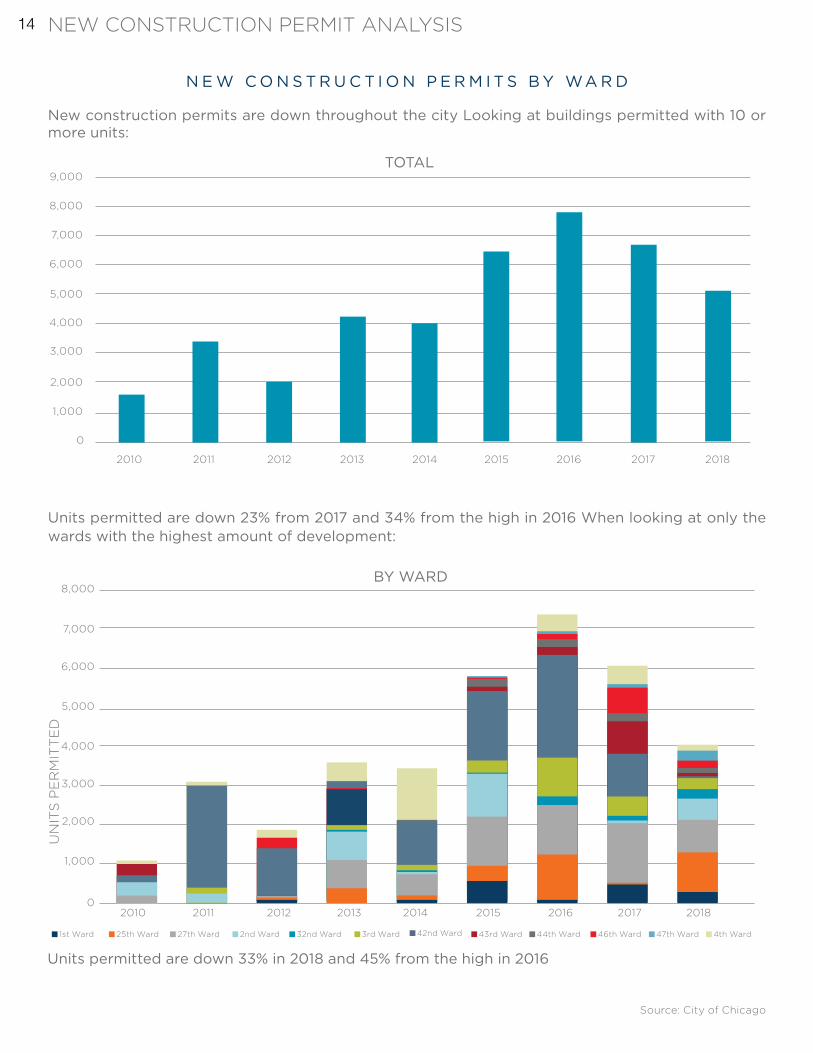
N E W C O N S T R U C T I O N P E R M I T S B Y WA R D
New construction permits are down throughout the city Looking at buildings permitted with 10 or more units:
Units permitted are down 23% from 2017 and 34% from the high in 2016 When looking at only the wards with the highest amount of development:
Units permitted are down 33% in 2018 and 45% from the high in 2016
Source: City of Chicago
UN
ITS
PE
RM
ITT
ED
2010
9,000
8,000
7,000
6,000
5,000
4,000
3,000
2,000
1,000
TOTAL
0
2011 2012 2013 2014 2015 2016 2017 2018
BY WARD8,000
7,000
6,000
5,000
4,000
3,000
2,000
1,000
02010 2011 2012 2013 2014 2015 2016 2017 2018
1st Ward 32nd Ward 44th Ward27th Ward 42nd Ward 47th Ward25th Ward 3rd Ward 46th Ward2nd Ward 43rd Ward 4th Ward
NEW CONSTRUCTION PERMIT ANALYSIS 14
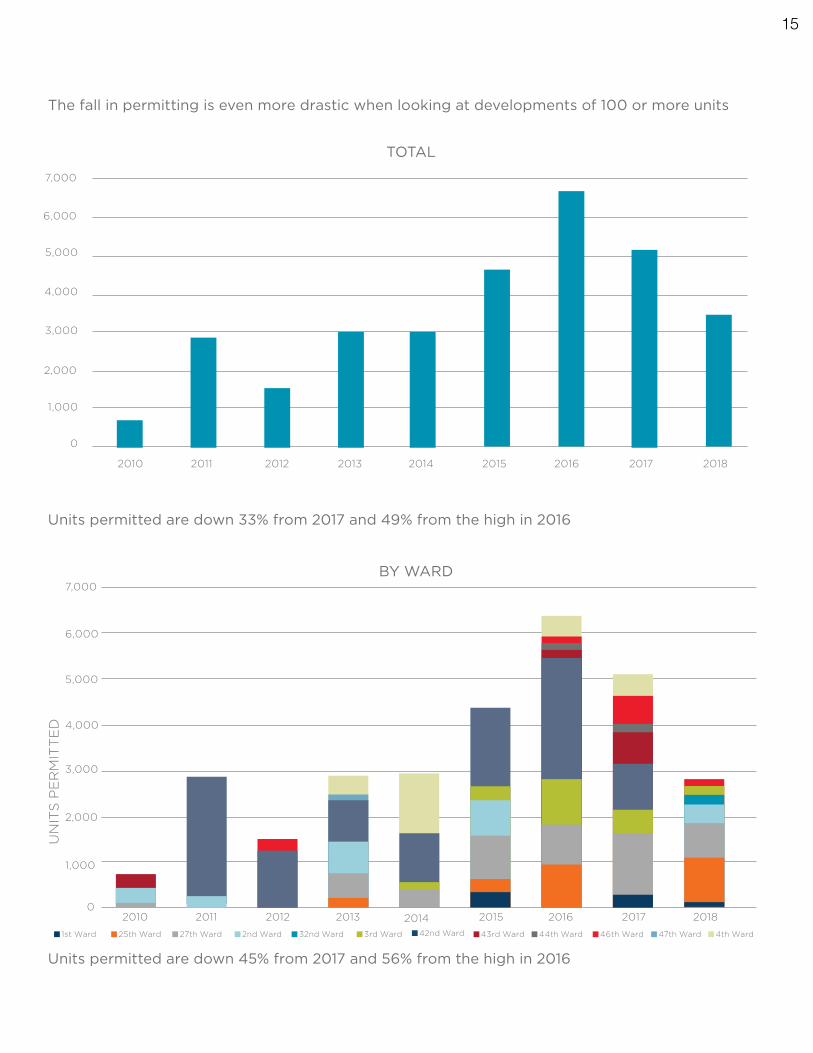
The fall in permitting is even more drastic when looking at developments of 100 or more units
UN
ITS
PE
RM
ITT
ED
Units permitted are down 33% from 2017 and 49% from the high in 2016
Units permitted are down 45% from 2017 and 56% from the high in 2016
7,000
6,000
5,000
4,000
3,000
2,000
1,000
0
2010 2011 2012 2013 2014 2015 2016 2017 2018
TOTAL
1st Ward 32nd Ward 44th Ward27th Ward 42nd Ward 47th Ward25th Ward 3rd Ward 46th Ward2nd Ward 43rd Ward 4th Ward
7,000
6,000
5,000
4,000
3,000
2,000
1,000
0
BY WARD
2010 2011 2012 2013 2014 2015 2016 2017 2018
15
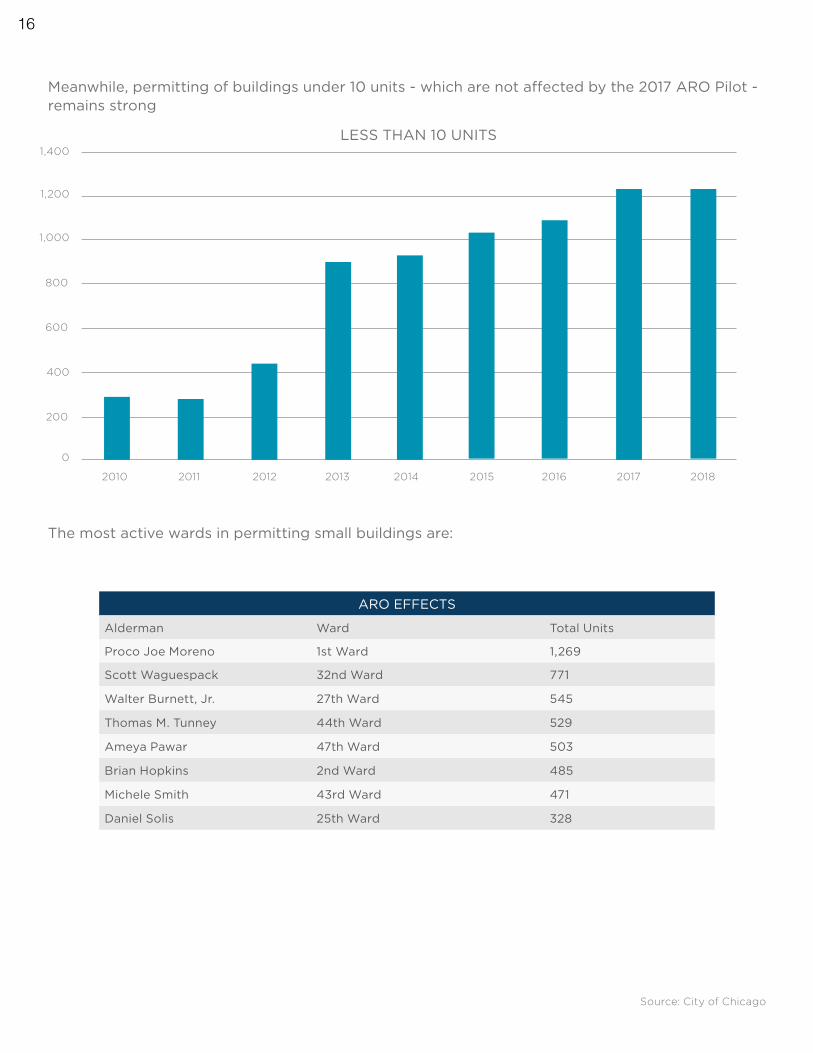
Meanwhile, permitting of buildings under 10 units - which are not affected by the 2017 ARO Pilot - remains strong
The most active wards in permitting small buildings are:
ARO EFFECTS
Alderman Ward Total Units
Proco Joe Moreno 1st Ward 1,269
Scott Waguespack 32nd Ward 771
Walter Burnett, Jr. 27th Ward 545
Thomas M. Tunney 44th Ward 529
Ameya Pawar 47th Ward 503
Brian Hopkins 2nd Ward 485
Michele Smith 43rd Ward 471
Daniel Solis 25th Ward 328
Source: City of Chicago
2010
1,400
1,200
1,000
800
600
400
200
0
2011 2012 2013 2014 2015 2016 2017 2018
LESS THAN 10 UNITS
16
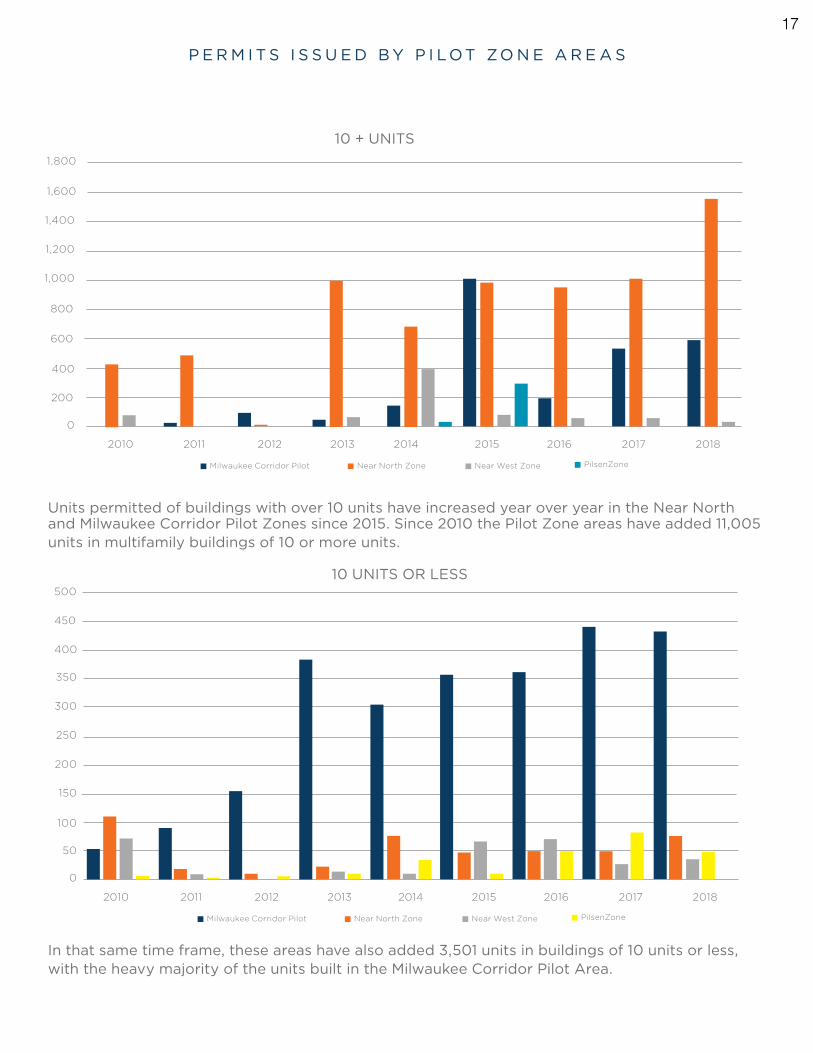
P E R M I T S I S S U E D B Y P I L O T ZO N E A R E A S
Units permitted of buildings with over 10 units have increased year over year in the Near North and Milwaukee Corridor Pilot Zones since 2015. Since 2010 the Pilot Zone areas have added 11,005 units in multifamily buildings of 10 or more units.
In that same time frame, these areas have also added 3,501 units in buildings of 10 units or less, with the heavy majority of the units built in the Milwaukee Corridor Pilot Area.
2010
Milwaukee Corridor Pilot
Milwaukee Corridor Pilot
Near North Zone
Near North Zone
Near West Zone
Near West Zone
PilsenZone
PilsenZone
1,400
350
1,600
400
1,800
450
500
1,200
300
1,000
250
800
200
400
100
600
150
200
50
0
0
2011
20112010
2012
2012
2013
2013
2014
2014
2015
2015
2016
2016
2017
2017
2018
2018
10 + UNITS
10 UNITS OR LESS
17
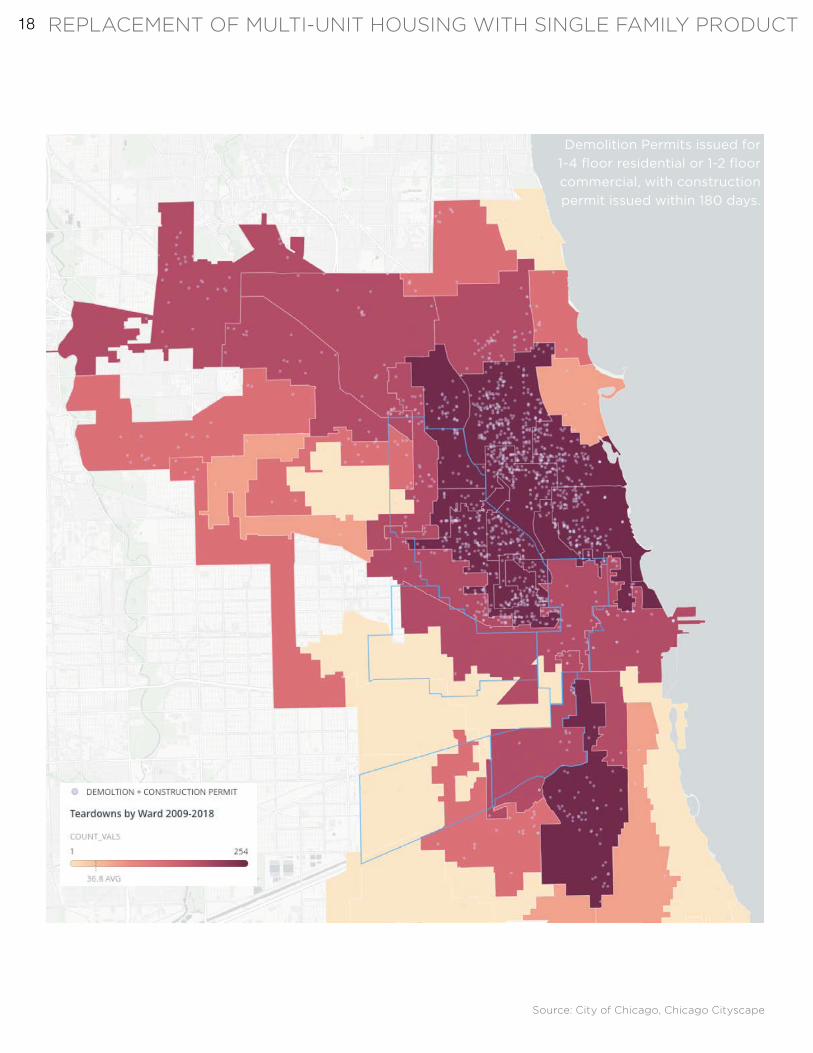
Demolition Permits issued for 1-4 floor residential or 1-2 floor commercial, with construction permit issued within 180 days.
Source: City of Chicago, Chicago Cityscape
REPLACEMENT OF MULTI-UNIT HOUSING WITH SINGLE FAMILY PRODUCT 18
Chicago’s housing stock in Pilot neighborhoods has been eroded by the teardown and replacement of existing 1-4 flats with smaller, single family product
Removal of 1,500+ older buildings - residences that would otherwise be the “naturally-occuring” affordable housing - has resulted in a much more dramatic loss than the 844 on-site/off-site units created by the ARO program in the same period.
These flats would also represent a perfect opportunity for providing off-site options for developers seeking to fulfill the ARO requirement. However, the erosion of this product, coupled with stringent like-kind unit requirements has led to only 10 units created in this manner according to city records.
19
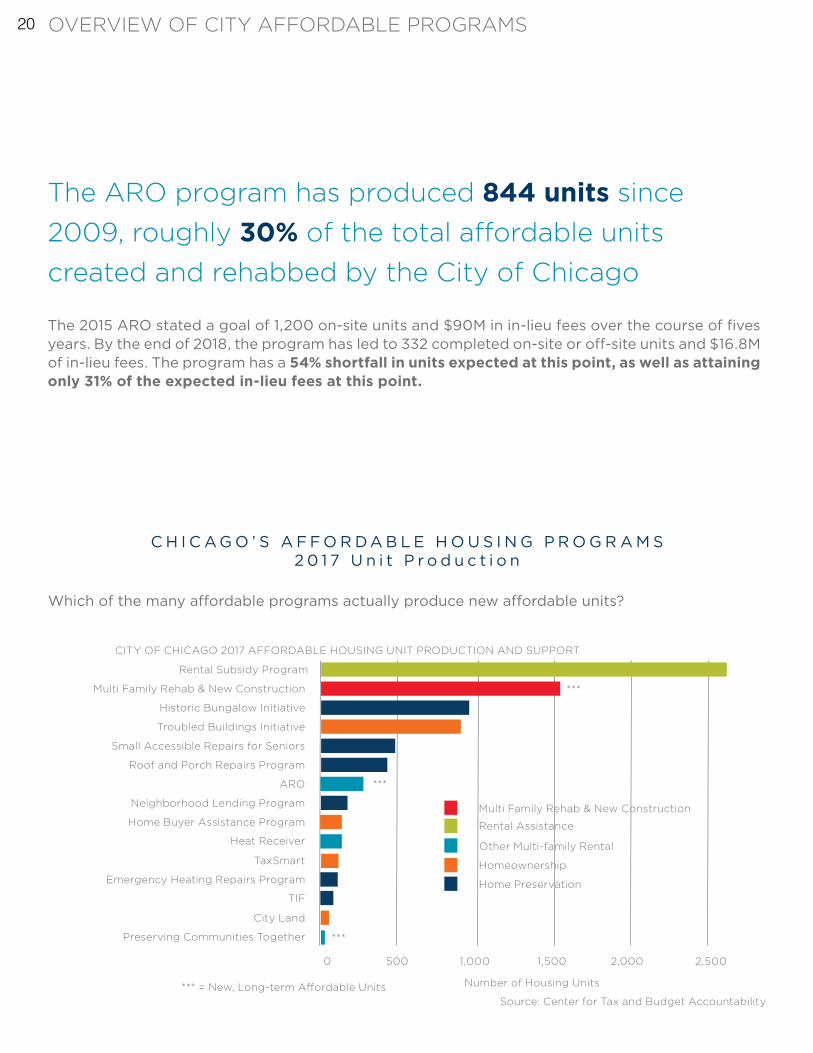
Which of the many affordable programs actually produce new affordable units?
C H I C A G O ’ S A F F O R D A B L E H O U S I N G P R O G R A M S2 0 1 7 U n i t P r o d u c t i o n
The ARO program has produced 844 units since 2009, roughly 30% of the total affordable units created and rehabbed by the City of Chicago
Source: Center for Tax and Budget Accountability
Rental Subsidy Program
Rental Assistance
Number of Housing Units*** = New, Long-term Affordable Units
Other Multi-family Rental
Homeownership
Home Preservation
Multi Family Rehab & New Construction
Multi Family Rehab & New Construction
Historic Bungalow Initiative
Troubled Buildings Initiative
Small Accessible Repairs for Seniors
Roof and Porch Repairs Program
ARO ***
***
***
Neighborhood Lending Program
Home Buyer Assistance Program
Heat Receiver
TaxSmart
Emergency Heating Repairs Program
TIF
City Land
Preserving Communities Together
2,5002,0001,5001,0005000
CITY OF CHICAGO 2017 AFFORDABLE HOUSING UNIT PRODUCTION AND SUPPORT
The 2015 ARO stated a goal of 1,200 on-site units and $90M in in-lieu fees over the course of fives years. By the end of 2018, the program has led to 332 completed on-site or off-site units and $16.8M of in-lieu fees. The program has a 54% shortfall in units expected at this point, as well as attaining only 31% of the expected in-lieu fees at this point.
OVERVIEW OF CITY AFFORDABLE PROGRAMS 20
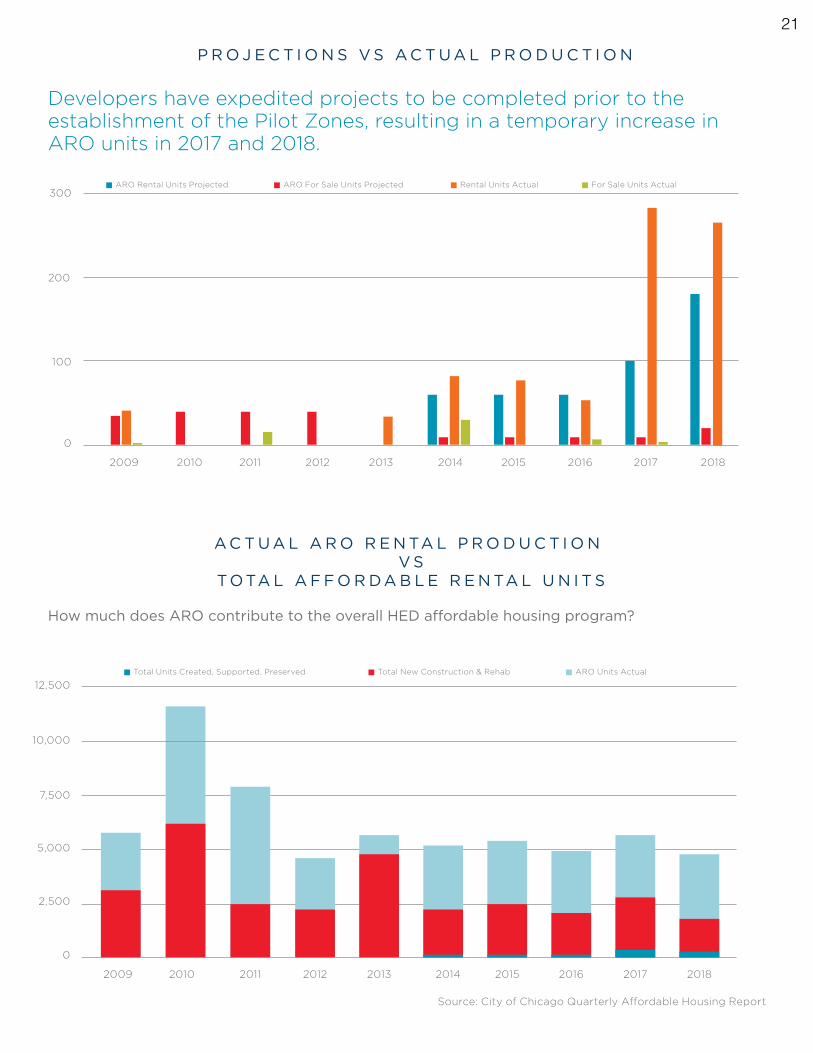
Developers have expedited projects to be completed prior to the establishment of the Pilot Zones, resulting in a temporary increase in ARO units in 2017 and 2018.
P R O J E C T I O N S V S A C T U A L P R O D U C T I O N
How much does ARO contribute to the overall HED affordable housing program?
A C T U A L A R O R E N TA L P R O D U C T I O N V S
T O TA L A F F O R D A B L E R E N TA L U N I T S
Source: City of Chicago Quarterly Affordable Housing Report
20102009
300
200
100
0
2011 2012 2013 2014 2015 2016 2017 2018
ARO Rental Units Projected ARO For Sale Units Projected Rental Units Actual For Sale Units Actual
20102009
12,500
10,000
7,500
5,000
2,500
0
2011 2012 2013 2014 2015 2016 2017 2018
Total Units Created, Supported, Preserved Total New Construction & Rehab ARO Units Actual
21
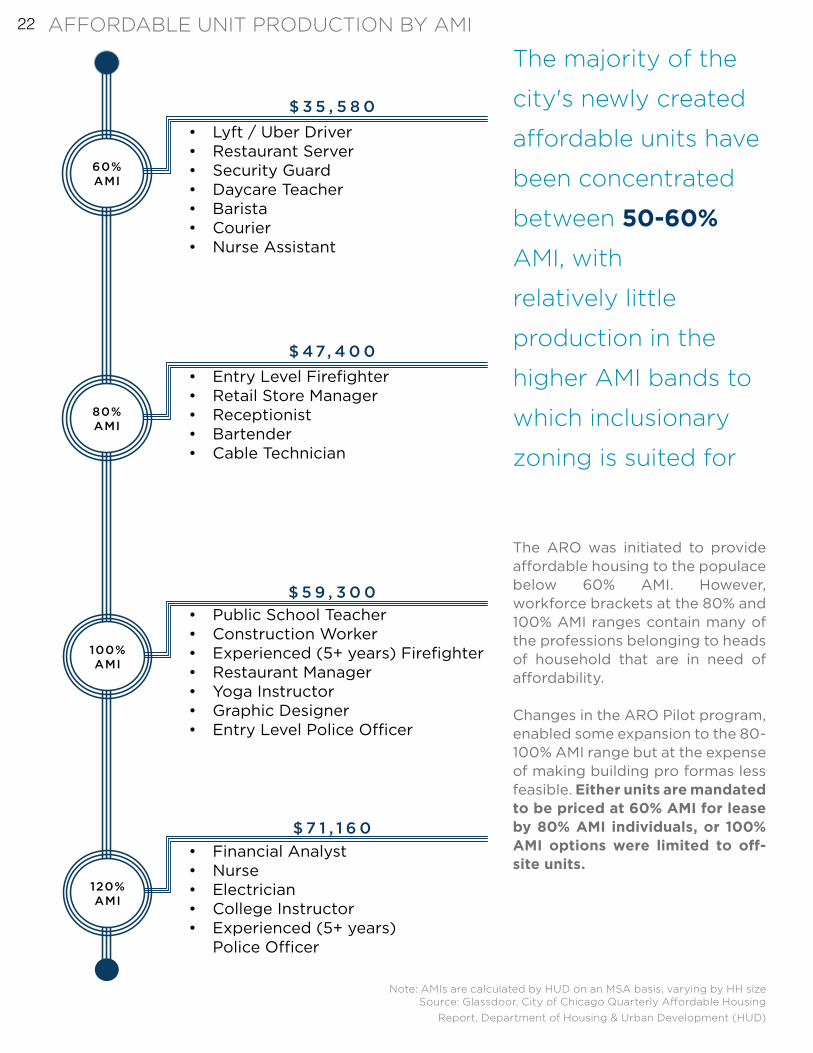
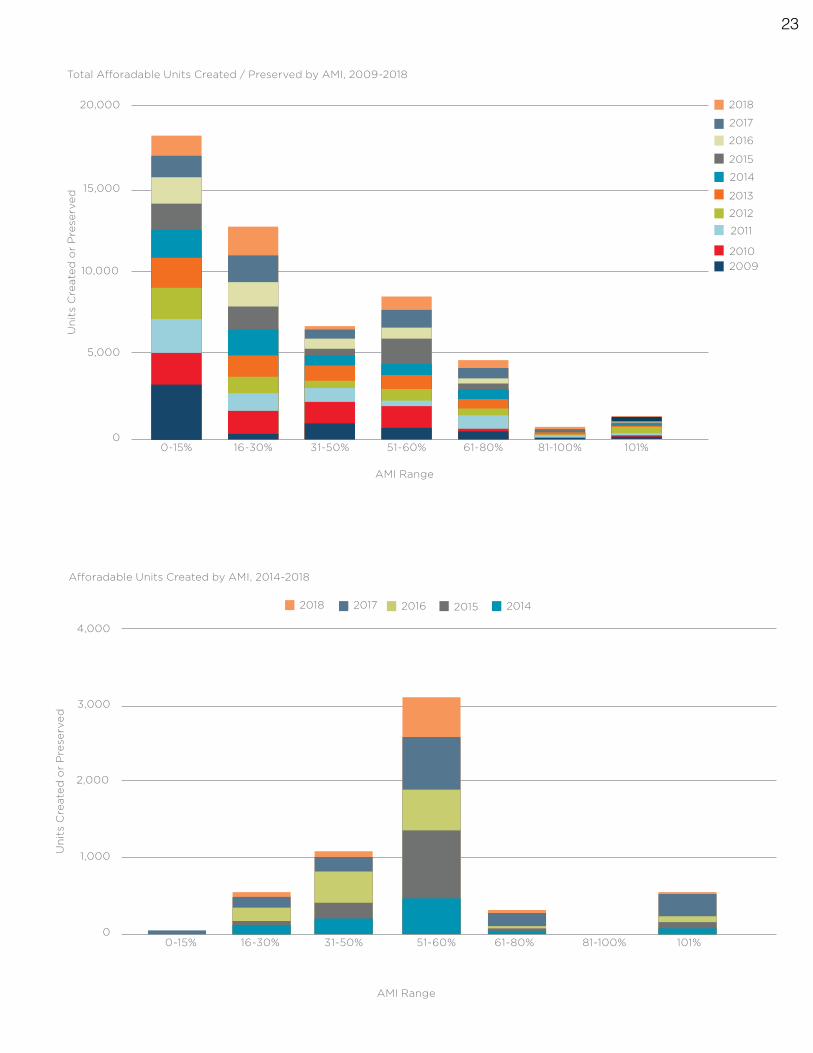
The majority of the
city's newly created
affordable units have
been concentrated
between 50-60%
AMI, with
relatively little
production in the
higher AMI bands to
which inclusionary
zoning is suited for
$ 3 5 , 5 8 0
$ 47, 4 0 0
$ 5 9 , 3 0 0
$ 7 1 , 1 6 0
• Entry Level Firefighter• Retail Store Manager• Receptionist• Bartender• Cable Technician
• Public School Teacher• Construction Worker• Experienced (5+ years) Firefighter• Restaurant Manager• Yoga Instructor• Graphic Designer• Entry Level Police Officer
• Financial Analyst• Nurse• Electrician• College Instructor• Experienced (5+ years)
Police Officer
60% AMI
80% AMI
100% AMI
120% AMI
• Lyft / Uber Driver• Restaurant Server• Security Guard• Daycare Teacher• Barista• Courier• Nurse Assistant
Source: Glassdoor, City of Chicago Quarterly Affordable Housing Report, Department of Housing & Urban Development (HUD)
Note: AMIs are calculated by HUD on an MSA basis, varying by HH size
The ARO was initiated to provide affordable housing to the populace below 60% AMI. However, workforce brackets at the 80% and 100% AMI ranges contain many of the professions belonging to heads of household that are in need of affordability.
Changes in the ARO Pilot program, enabled some expansion to the 80-100% AMI range but at the expense of making building pro formas less feasible. Either units are mandated to be priced at 60% AMI for lease by 80% AMI individuals, or 100% AMI options were limited to off-site units.
AFFORDABLE UNIT PRODUCTION BY AMI 22
20102009
20,000
15,000
10,000
5,000
0-15% 16-30% 31-50% 51-60% 61-80% 81-100% 101%
AMI Range
Un
its
Cre
ate
d o
r P
rese
rve
d
0
2011
2012
2013
2014
2015
2016
2017
2018
Total Afforadable Units Created / Preserved by AMI, 2009-2018
AMI Range
Un
its
Cre
ate
d o
r P
rese
rve
d
4,000
3,000
2,000
1,000
00-15% 16-30% 31-50% 51-60% 61-80% 81-100% 101%
20142015201620172018
Afforadable Units Created by AMI, 2014-2018
23
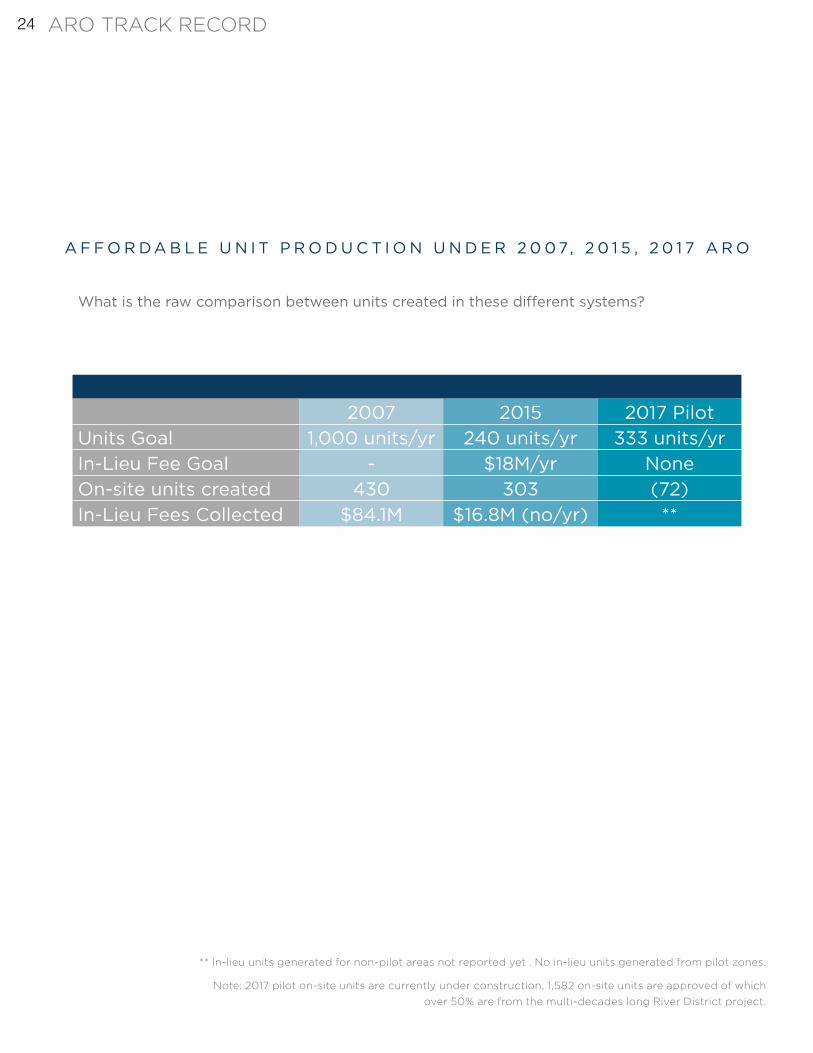
What is the raw comparison between units created in these different systems?
A F F O R D A B L E U N I T P R O D U C T I O N U N D E R 2 0 0 7, 2 0 1 5 , 2 0 1 7 A R O
** In-lieu units generated for non-pilot areas not reported yet . No in-lieu units generated from pilot zones.
Note: 2017 pilot on-site units are currently under construction, 1,582 on-site units are approved of which over 50% are from the multi-decades long River District project.
2007 2015 2017 PilotUnits Goal 1,000 units/yr 240 units/yr 333 units/yrIn-Lieu Fee Goal - $18M/yr NoneOn-site units created 430 303 (72)In-Lieu Fees Collected $84.1M $16.8M (no/yr) **
ARO TRACK RECORD 24
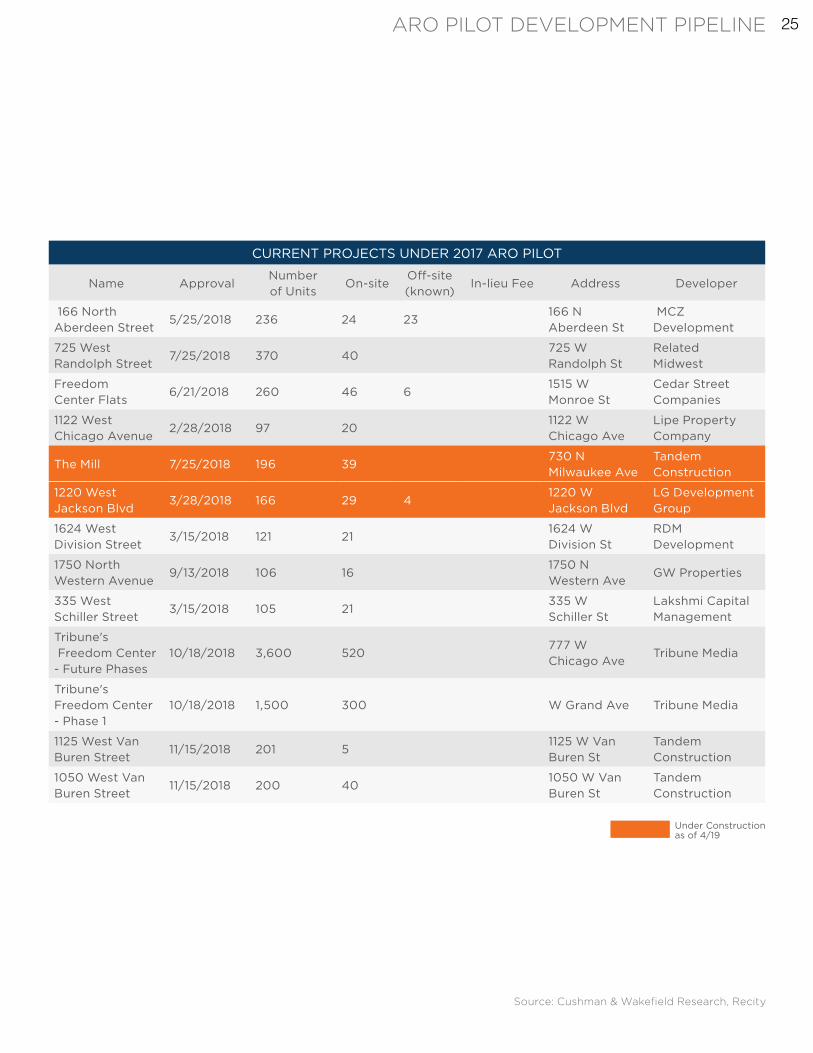
CURRENT PROJECTS UNDER 2017 ARO PILOT
Name ApprovalNumber of Units
On-siteOff-site (known)
In-lieu Fee Address Developer
166 North Aberdeen Street
5/25/2018 236 24 23 166 N Aberdeen St
MCZ Development
725 West Randolph Street
7/25/2018 370 40 725 W Randolph St
Related Midwest
Freedom Center Flats
6/21/2018 260 46 6 1515 W Monroe St
Cedar Street Companies
1122 West Chicago Avenue
2/28/2018 97 20 1122 W Chicago Ave
Lipe Property Company
The Mill 7/25/2018 196 39 730 N Milwaukee Ave
Tandem Construction
1220 West Jackson Blvd
3/28/2018 166 29 4 1220 W Jackson Blvd
LG Development Group
1624 West Division Street
3/15/2018 121 21 1624 W Division St
RDM Development
1750 North Western Avenue
9/13/2018 106 16 1750 N Western Ave
GW Properties
335 West Schiller Street
3/15/2018 105 21 335 W Schiller St
Lakshmi Capital Management
Tribune's Freedom Center - Future Phases
10/18/2018 3,600 520 777 W Chicago Ave
Tribune Media
Tribune's Freedom Center - Phase 1
10/18/2018 1,500 300 W Grand Ave Tribune Media
1125 West Van Buren Street
11/15/2018 201 5 1125 W Van Buren St
Tandem Construction
1050 West Van Buren Street
11/15/2018 200 40 1050 W Van Buren St
Tandem Construction
Under Construction as of 4/19
Source: Cushman & Wakefield Research, Recity
ARO PILOT DEVELOPMENT PIPELINE 25

26
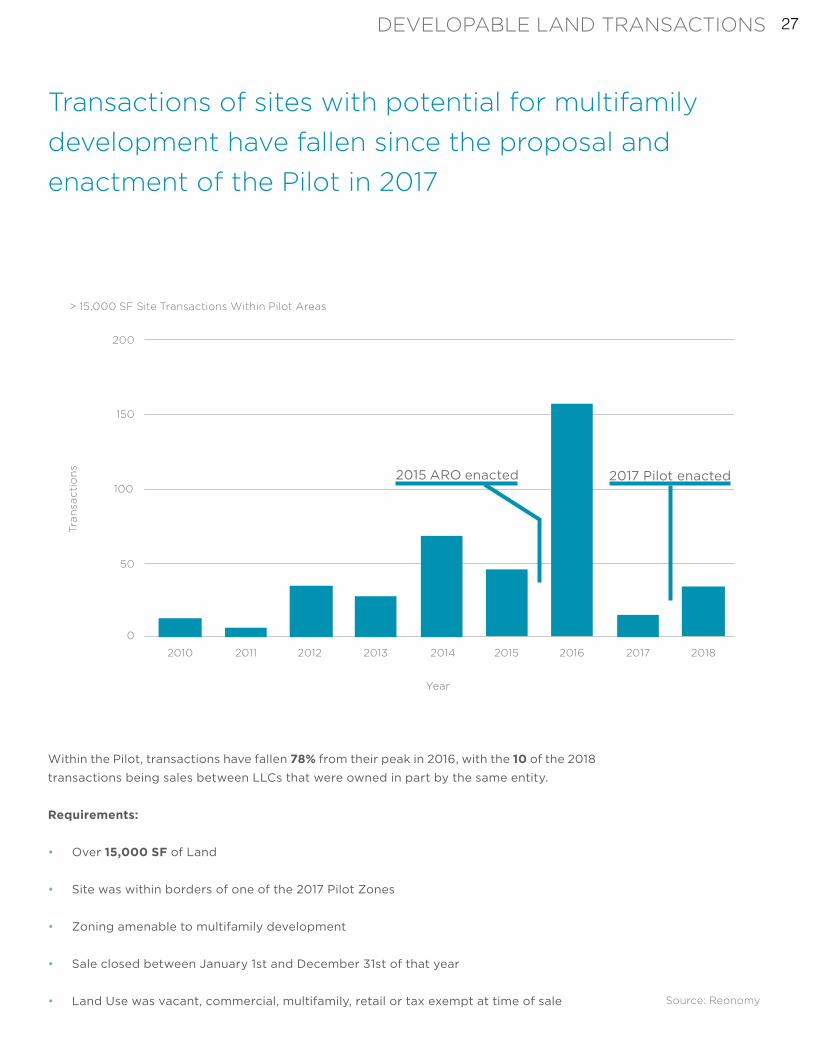
Within the Pilot, transactions have fallen 78% from their peak in 2016, with the 10 of the 2018
transactions being sales between LLCs that were owned in part by the same entity.
Requirements:
• Over 15,000 SF of Land
• Site was within borders of one of the 2017 Pilot Zones
• Zoning amenable to multifamily development
• Sale closed between January 1st and December 31st of that year
• Land Use was vacant, commercial, multifamily, retail or tax exempt at time of sale
Transactions of sites with potential for multifamily development have fallen since the proposal and enactment of the Pilot in 2017
Source: Reonomy
2010
200
150
100
Tran
sact
ion
s
50
0
2011 2012 2013 2014
Year
2015 2016 2017 2018
> 15,000 SF Site Transactions Within Pilot Areas
2017 Pilot enacted2015 ARO enacted
DEVELOPABLE LAND TRANSACTIONS 27
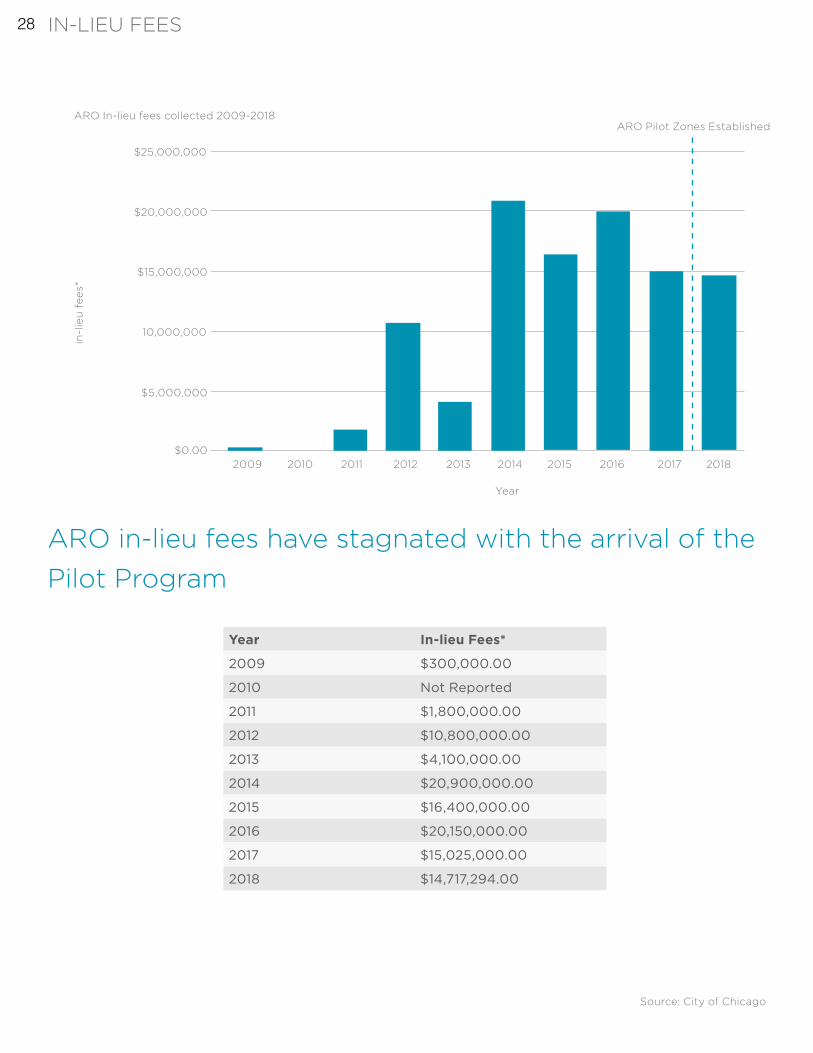
Year In-lieu Fees*
2009 $300,000.00
2010 Not Reported
2011 $1,800,000.00
2012 $10,800,000.00
2013 $4,100,000.00
2014 $20,900,000.00
2015 $16,400,000.00
2016 $20,150,000.00
2017 $15,025,000.00
2018 $14,717,294.00
Source: City of Chicago
20102009
$20,000,000
$25,000,000
$15,000,000
10,000,000
in-l
ieu
fe
es*
ARO Pilot Zones Established
$5,000,000
$0.002011 2012 2013 2014
Year
2015 2016 2017 2018
ARO In-lieu fees collected 2009-2018
ARO in-lieu fees have stagnated with the arrival of the Pilot Program
IN-LIEU FEES 28
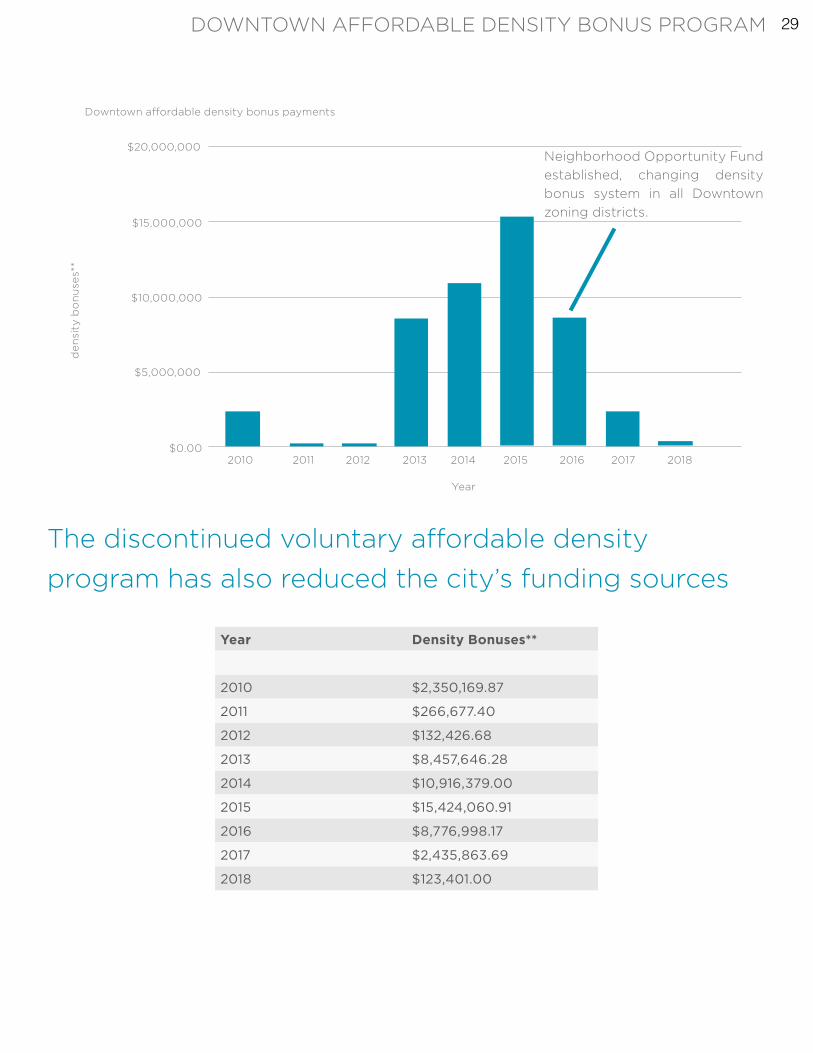
Year Density Bonuses**
2010 $2,350,169.87
2011 $266,677.40
2012 $132,426.68
2013 $8,457,646.28
2014 $10,916,379.00
2015 $15,424,060.91
2016 $8,776,998.17
2017 $2,435,863.69
2018 $123,401.00
Neighborhood Opportunity Fund established, changing density bonus system in all Downtown zoning districts.
2010
$20,000,000
$15,000,000
$10,000,000
de
nsi
ty b
on
use
s**
$5,000,000
$0.002011 2012 2013 2014
Year
2015 2016 2017 2018
Downtown affordable density bonus payments
The discontinued voluntary affordable density program has also reduced the city’s funding sources
DOWNTOWN AFFORDABLE DENSITY BONUS PROGRAM 29
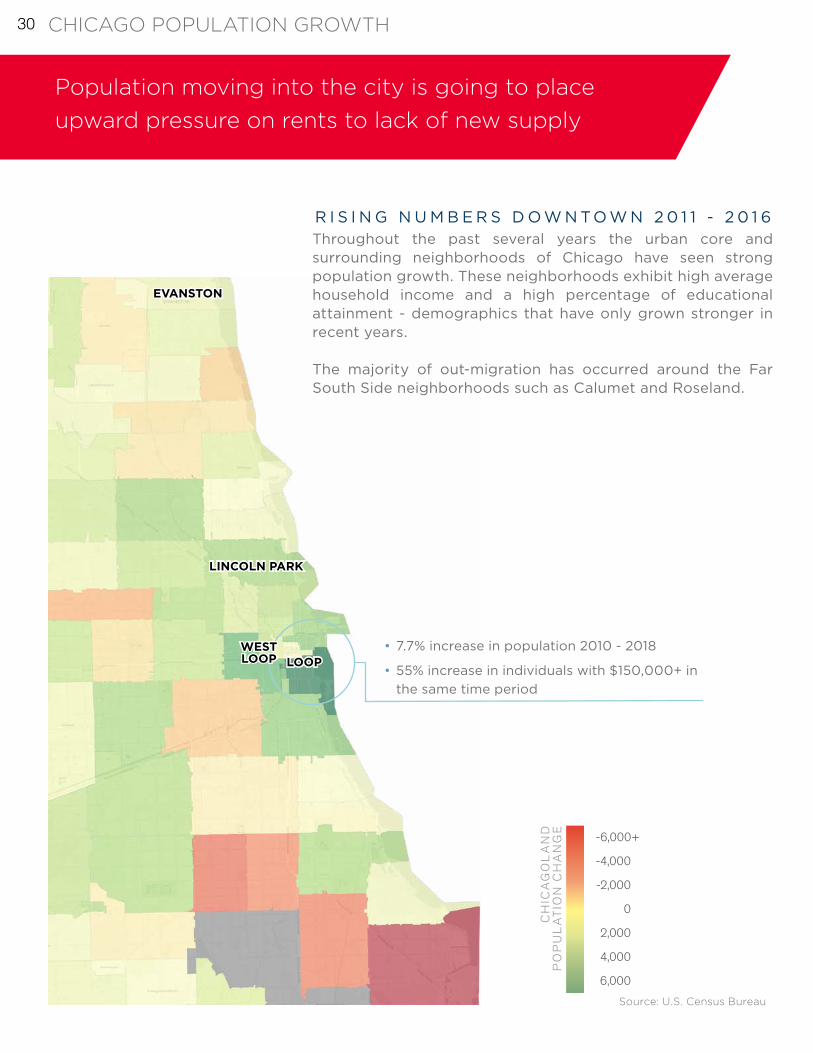
Throughout the past several years the urban core and surrounding neighborhoods of Chicago have seen strong population growth. These neighborhoods exhibit high average household income and a high percentage of educational attainment - demographics that have only grown stronger in recent years.
The majority of out-migration has occurred around the Far South Side neighborhoods such as Calumet and Roseland.
CH
ICA
GO
LA
ND
PO
PU
LA
TIO
N C
HA
NG
E
-6,000+
6,000
4,000
2,000
0
-2,000
-4,000
LOOP
LINCOLN PARK
EVANSTON
• 7.7% increase in population 2010 - 2018
• 55% increase in individuals with $150,000+ in the same time period
WEST LOOP
R I S I N G N U M B E R S D O W N T O W N 2 0 1 1 - 2 0 1 6
Population moving into the city is going to place upward pressure on rents to lack of new supply
Source: U.S. Census Bureau
CHICAGO POPULATION GROWTH 30
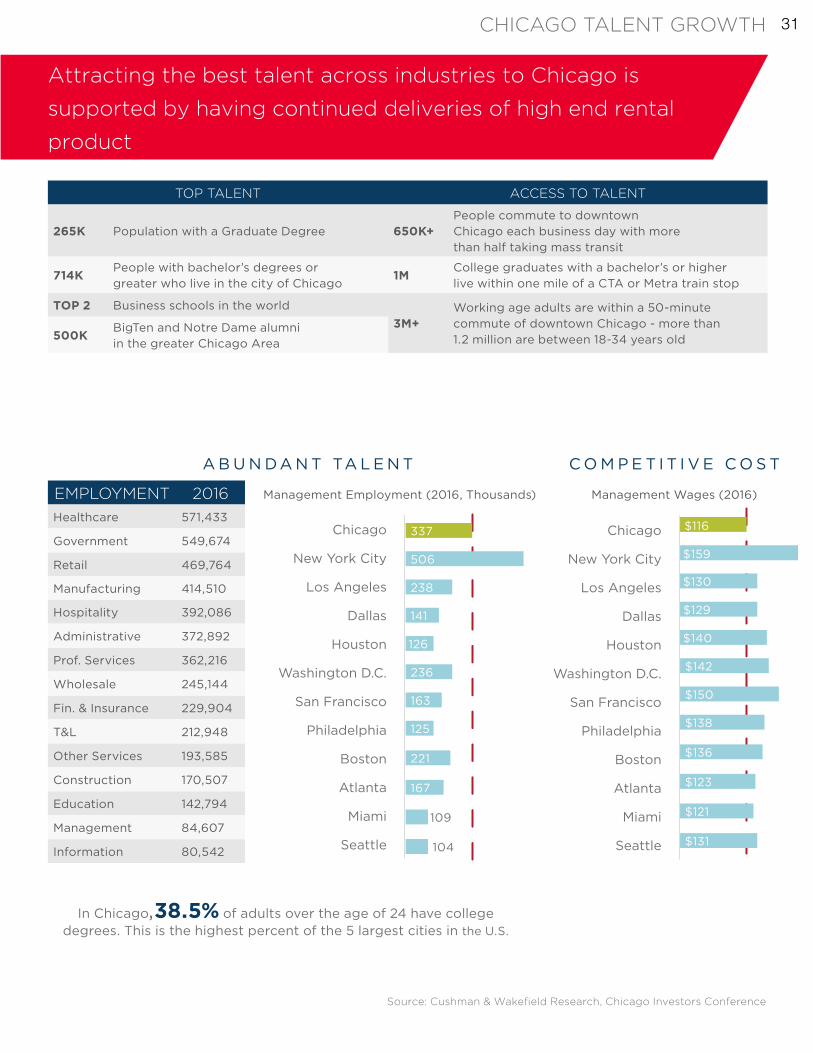
TOP TALENT ACCESS TO TALENT
265K Population with a Graduate Degree 650K+People commute to downtown Chicago each business day with more than half taking mass transit
714KPeople with bachelor’s degrees or greater who live in the city of Chicago
1MCollege graduates with a bachelor’s or higher live within one mile of a CTA or Metra train stop
TOP 2 Business schools in the world3M+
Working age adults are within a 50-minute commute of downtown Chicago - more than 1.2 million are between 18-34 years old500K
BigTen and Notre Dame alumni in the greater Chicago Area
Attracting the best talent across industries to Chicago is
supported by having continued deliveries of high end rental
product
EMPLOYMENT 2016Healthcare 571,433
Government 549,674
Retail 469,764
Manufacturing 414,510
Hospitality 392,086
Administrative 372,892
Prof. Services 362,216
Wholesale 245,144
Fin. & Insurance 229,904
T&L 212,948
Other Services 193,585
Construction 170,507
Education 142,794
Management 84,607
Information 80,542
C O M P E T I T I V E C O S TA B U N D A N T TA L E N T
Management Employment (2016, Thousands) Management Wages (2016)
Chicago
New York City
Los Angeles
Dallas
Houston
Washington D.C.
San Francisco
Philadelphia
Boston
Atlanta
Miami
Seattle
337
506
238
141
126
236
163
125
221
167
109
104
Chicago
New York City
Los Angeles
Dallas
Houston
Washington D.C.
San Francisco
Philadelphia
Boston
Atlanta
Miami
Seattle
$116
$159
$130
$129
$140
$142
$150
$138
$136
$123
$121
$131
In Chicago,38.5% of adults over the age of 24 have college degrees. This is the highest percent of the 5 largest cities in the U.S.
Source: Cushman & Wakefield Research, Chicago Investors Conference
CHICAGO TALENT GROWTH 31
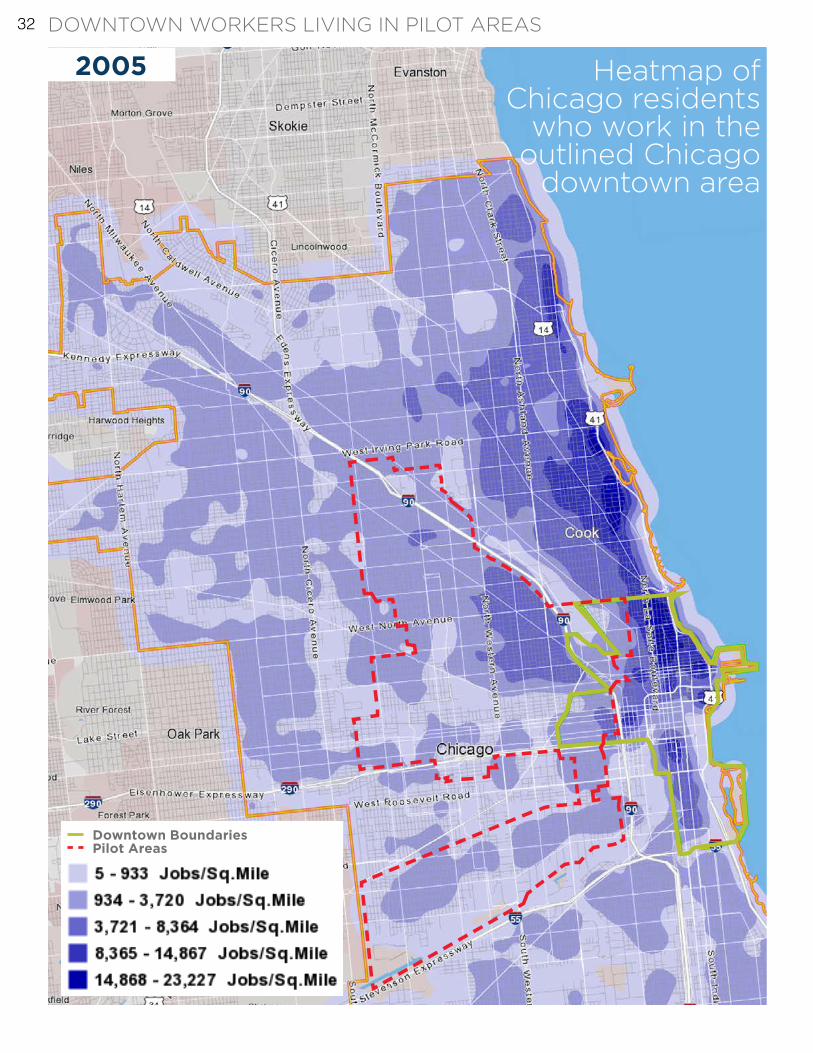
Heatmap of Chicago residents
who work in the outlined Chicago
downtown area
Downtown BoundariesPilot Areas
2005DOWNTOWN WORKERS LIVING IN PILOT AREAS 32
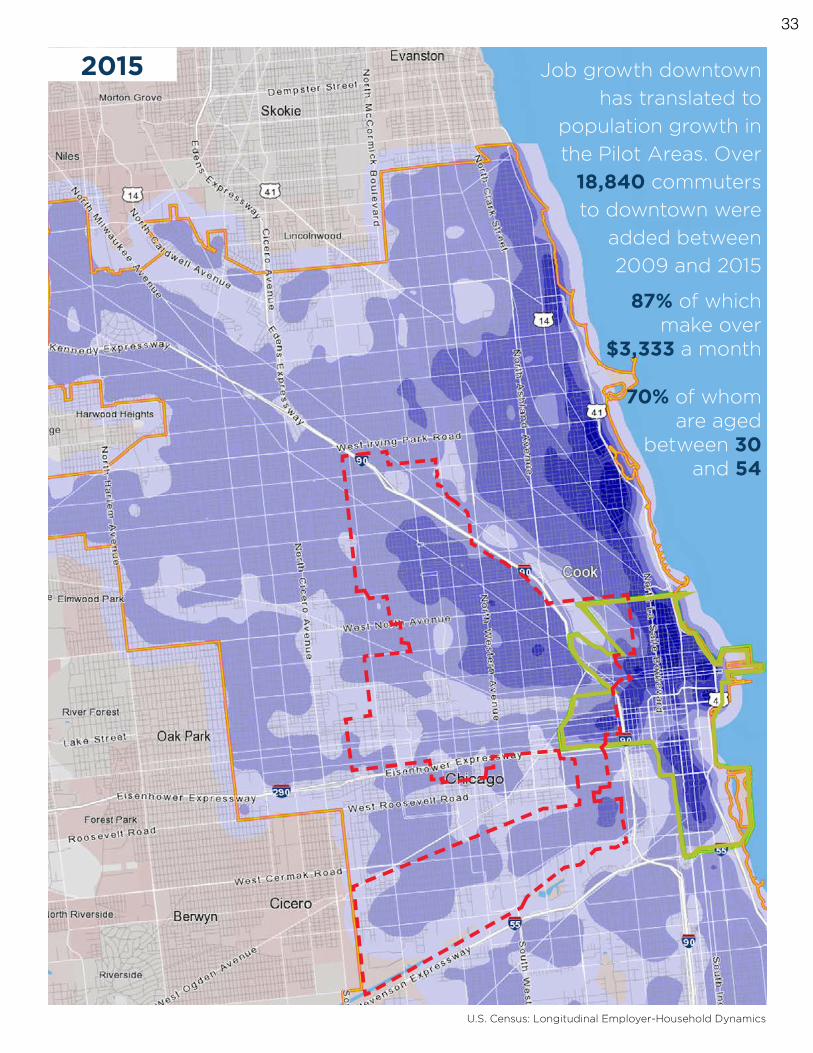
87% of which make over
$3,333 a month
70% of whom are aged
between 30 and 54
Job growth downtown has translated to
population growth in the Pilot Areas. Over
18,840 commuters to downtown were
added between 2009 and 2015
U.S. Census: Longitudinal Employer-Household Dynamics
2015
33
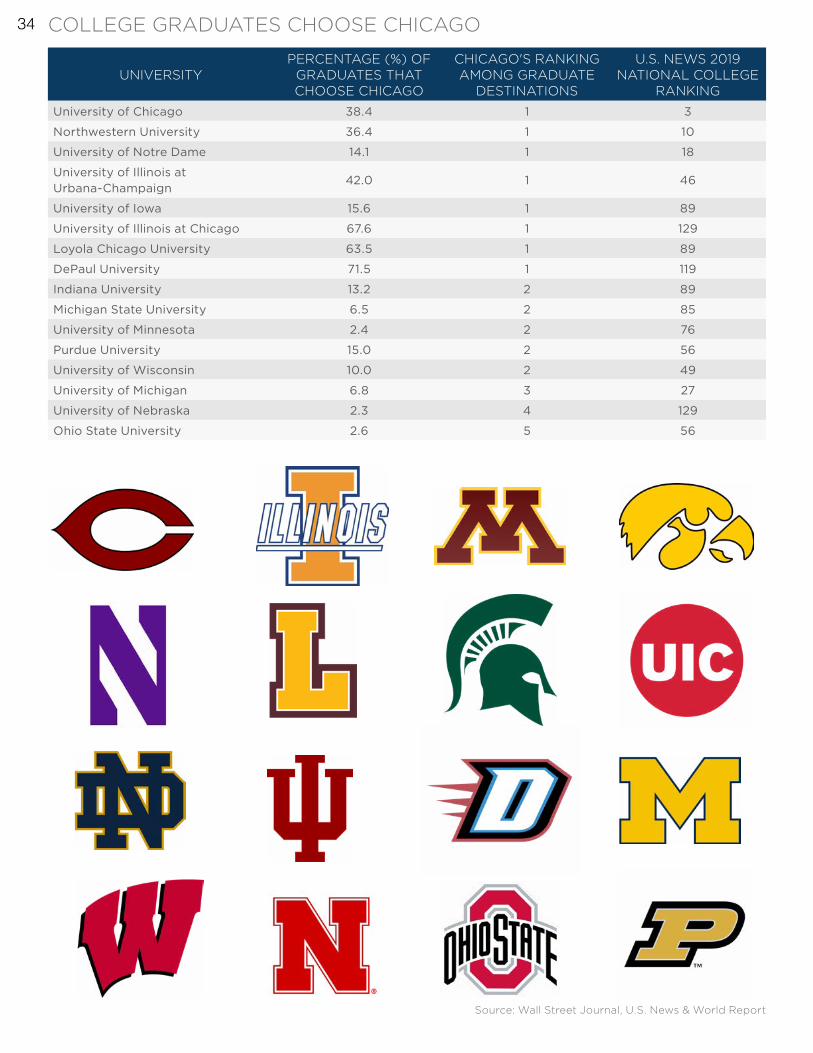
UNIVERSITYPERCENTAGE (%) OF
GRADUATES THAT CHOOSE CHICAGO
CHICAGO'S RANKING AMONG GRADUATE
DESTINATIONS
U.S. NEWS 2019 NATIONAL COLLEGE
RANKING
University of Chicago 38.4 1 3
Northwestern University 36.4 1 10
University of Notre Dame 14.1 1 18
University of Illinois at Urbana-Champaign
42.0 1 46
University of Iowa 15.6 1 89
University of Illinois at Chicago 67.6 1 129
Loyola Chicago University 63.5 1 89
DePaul University 71.5 1 119
Indiana University 13.2 2 89
Michigan State University 6.5 2 85
University of Minnesota 2.4 2 76
Purdue University 15.0 2 56
University of Wisconsin 10.0 2 49
University of Michigan 6.8 3 27
University of Nebraska 2.3 4 129
Ohio State University 2.6 5 56
Source: Wall Street Journal, U.S. News & World Report
210
200
190
180
170
160
150
140
130
120
110
100
90
80
COLLEGE GRADUATES CHOOSE CHICAGO 34
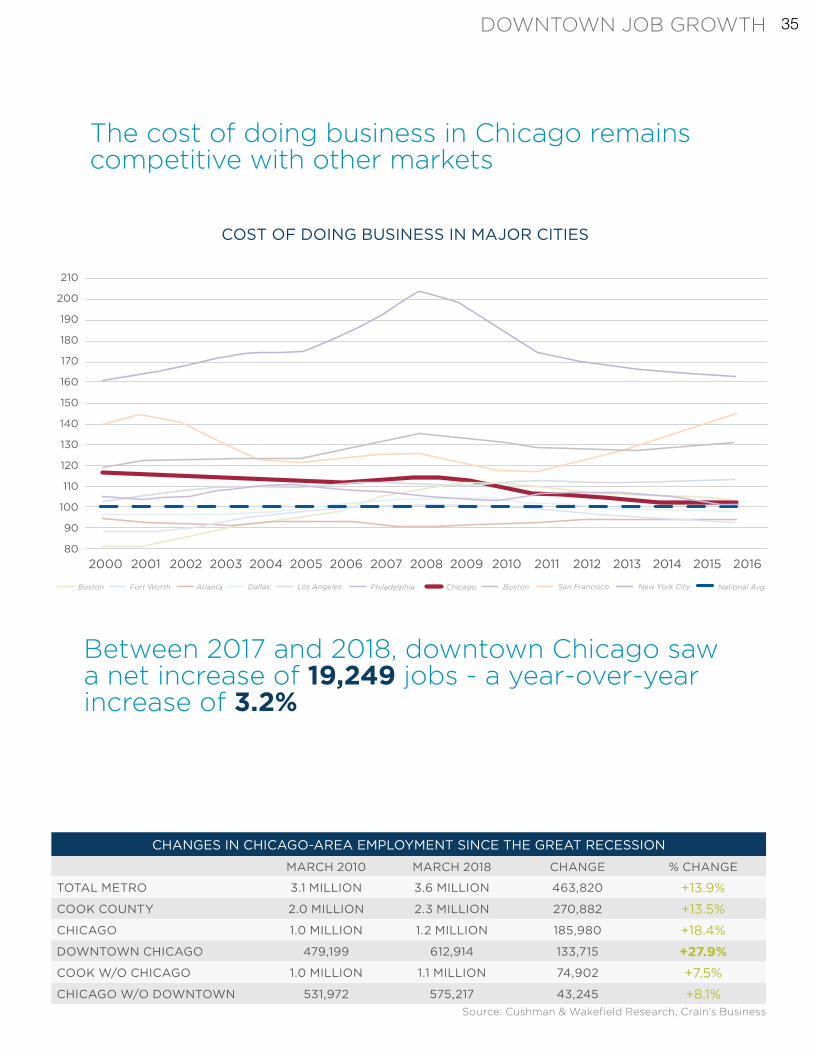
CHANGES IN CHICAGO-AREA EMPLOYMENT SINCE THE GREAT RECESSION
MARCH 2010 MARCH 2018 CHANGE % CHANGE
TOTAL METRO 3.1 MILLION 3.6 MILLION 463,820 +13.9%
COOK COUNTY 2.0 MILLION 2.3 MILLION 270,882 +13.5%
CHICAGO 1.0 MILLION 1.2 MILLION 185,980 +18.4%
DOWNTOWN CHICAGO 479,199 612,914 133,715 +27.9%COOK W/O CHICAGO 1.0 MILLION 1.1 MILLION 74,902 +7.5%
CHICAGO W/O DOWNTOWN 531,972 575,217 43,245 +8.1%
Between 2017 and 2018, downtown Chicago saw a net increase of 19,249 jobs - a year-over-year increase of 3.2%
COST OF DOING BUSINESS IN MAJOR CITIES
The cost of doing business in Chicago remains competitive with other markets
Source: Cushman & Wakefield Research, Crain’s Business
210
200
190
180
170
160
150
140
130
120
110
100
90
802000 2001 2002 2003 2004 2005 2006 2007 2008 2009 2010 2011 2012 2013 2014 2015 2016
National AvgNew York CitySan FranciscoBostonPhiladelphiaLos AngelesDallasAtlantaFort WorthBoston Chicago
DOWNTOWN JOB GROWTH 35
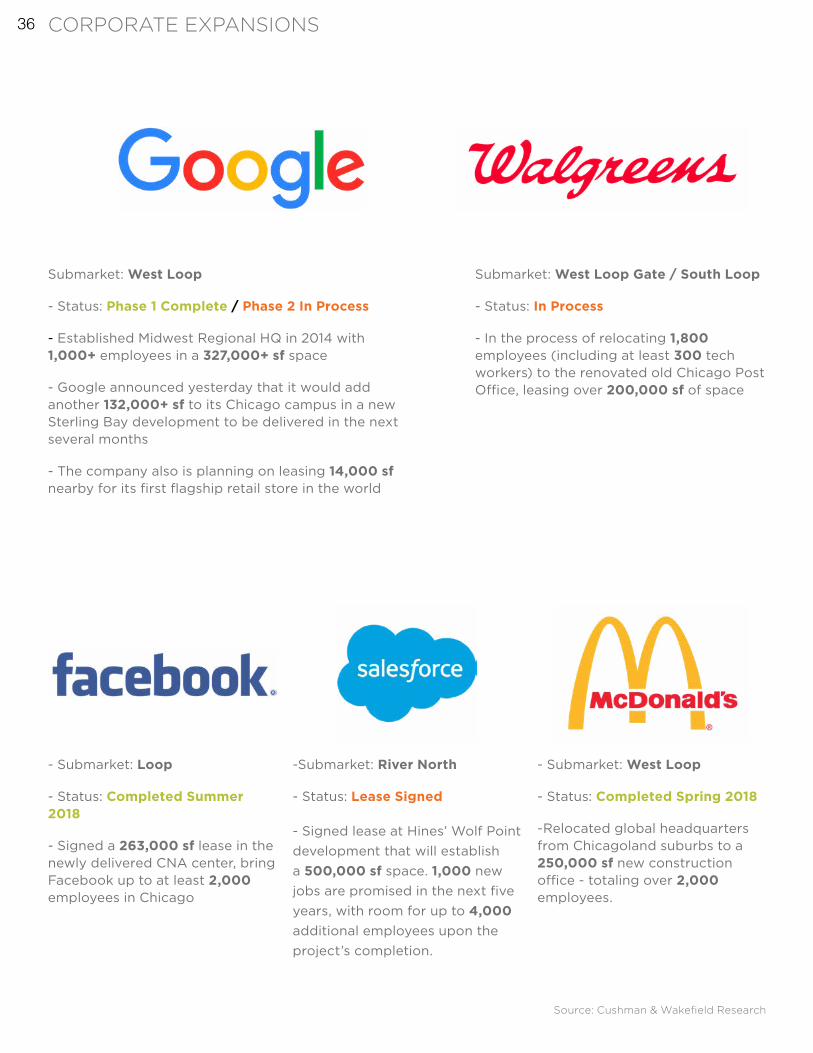
Submarket: West Loop
- Status: Phase 1 Complete / Phase 2 In Process
- Established Midwest Regional HQ in 2014 with 1,000+ employees in a 327,000+ sf space
- Google announced yesterday that it would add another 132,000+ sf to its Chicago campus in a new Sterling Bay development to be delivered in the next several months
- The company also is planning on leasing 14,000 sf nearby for its first flagship retail store in the world
Submarket: West Loop Gate / South Loop
- Status: In Process
- In the process of relocating 1,800 employees (including at least 300 tech workers) to the renovated old Chicago Post Office, leasing over 200,000 sf of space
-Submarket: River North
- Status: Lease Signed
- Signed lease at Hines’ Wolf Point development that will establish a 500,000 sf space. 1,000 new jobs are promised in the next five years, with room for up to 4,000 additional employees upon the project’s completion.
- Submarket: West Loop
- Status: Completed Spring 2018
-Relocated global headquarters from Chicagoland suburbs to a 250,000 sf new construction office - totaling over 2,000 employees.
- Submarket: Loop
- Status: Completed Summer 2018
- Signed a 263,000 sf lease in the newly delivered CNA center, bring Facebook up to at least 2,000 employees in Chicago
Source: Cushman & Wakefield Research
CORPORATE EXPANSIONS 36
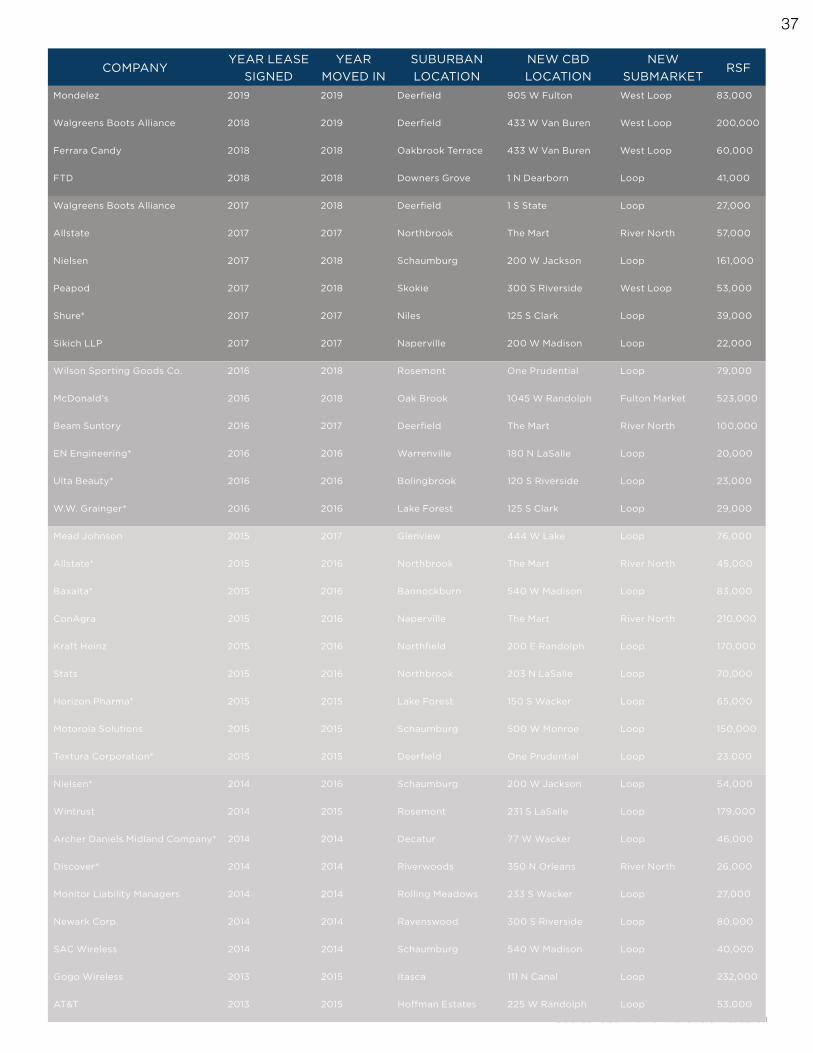
Source: Cushman & Wakefield Research
COMPANYYEAR LEASE
SIGNEDYEAR
MOVED INSUBURBAN LOCATION
NEW CBD LOCATION
NEW SUBMARKET
RSF
Mondelez 2019 2019 Deerfield 905 W Fulton West Loop 83,000
Walgreens Boots Alliance 2018 2019 Deerfield 433 W Van Buren West Loop 200,000
Ferrara Candy 2018 2018 Oakbrook Terrace 433 W Van Buren West Loop 60,000
FTD 2018 2018 Downers Grove 1 N Dearborn Loop 41,000
Walgreens Boots Alliance 2017 2018 Deerfield 1 S State Loop 27,000
Allstate 2017 2017 Northbrook The Mart River North 57,000
Nielsen 2017 2018 Schaumburg 200 W Jackson Loop 161,000
Peapod 2017 2018 Skokie 300 S Riverside West Loop 53,000
Shure* 2017 2017 Niles 125 S Clark Loop 39,000
Sikich LLP 2017 2017 Naperville 200 W Madison Loop 22,000
Wilson Sporting Goods Co. 2016 2018 Rosemont One Prudential Loop 79,000
McDonald’s 2016 2018 Oak Brook 1045 W Randolph Fulton Market 523,000
Beam Suntory 2016 2017 Deerfield The Mart River North 100,000
EN Engineering* 2016 2016 Warrenville 180 N LaSalle Loop 20,000
Ulta Beauty* 2016 2016 Bolingbrook 120 S Riverside Loop 23,000
W.W. Grainger* 2016 2016 Lake Forest 125 S Clark Loop 29,000
Mead Johnson 2015 2017 Glenview 444 W Lake Loop 76,000
Allstate* 2015 2016 Northbrook The Mart River North 45,000
Baxalta* 2015 2016 Bannockburn 540 W Madison Loop 83,000
ConAgra 2015 2016 Naperville The Mart River North 210,000
Kraft Heinz 2015 2016 Northfield 200 E Randolph Loop 170,000
Stats 2015 2016 Northbrook 203 N LaSalle Loop 70,000
Horizon Pharma* 2015 2015 Lake Forest 150 S Wacker Loop 65,000
Motorola Solutions 2015 2015 Schaumburg 500 W Monroe Loop 150,000
Textura Corporation* 2015 2015 Deerfield One Prudential Loop 23,000
Nielsen* 2014 2016 Schaumburg 200 W Jackson Loop 54,000
Wintrust 2014 2015 Rosemont 231 S LaSalle Loop 179,000
Archer Daniels Midland Company* 2014 2014 Decatur 77 W Wacker Loop 46,000
Discover* 2014 2014 Riverwoods 350 N Orleans River North 26,000
Monitor Liability Managers 2014 2014 Rolling Meadows 233 S Wacker Loop 27,000
Newark Corp. 2014 2014 Ravenswood 300 S Riverside Loop 80,000
SAC Wireless 2014 2014 Schaumburg 540 W Madison Loop 40,000
Gogo Wireless 2013 2015 Itasca 111 N Canal Loop 232,000
AT&T 2013 2015 Hoffman Estates 225 W Randolph Loop 53,000
37
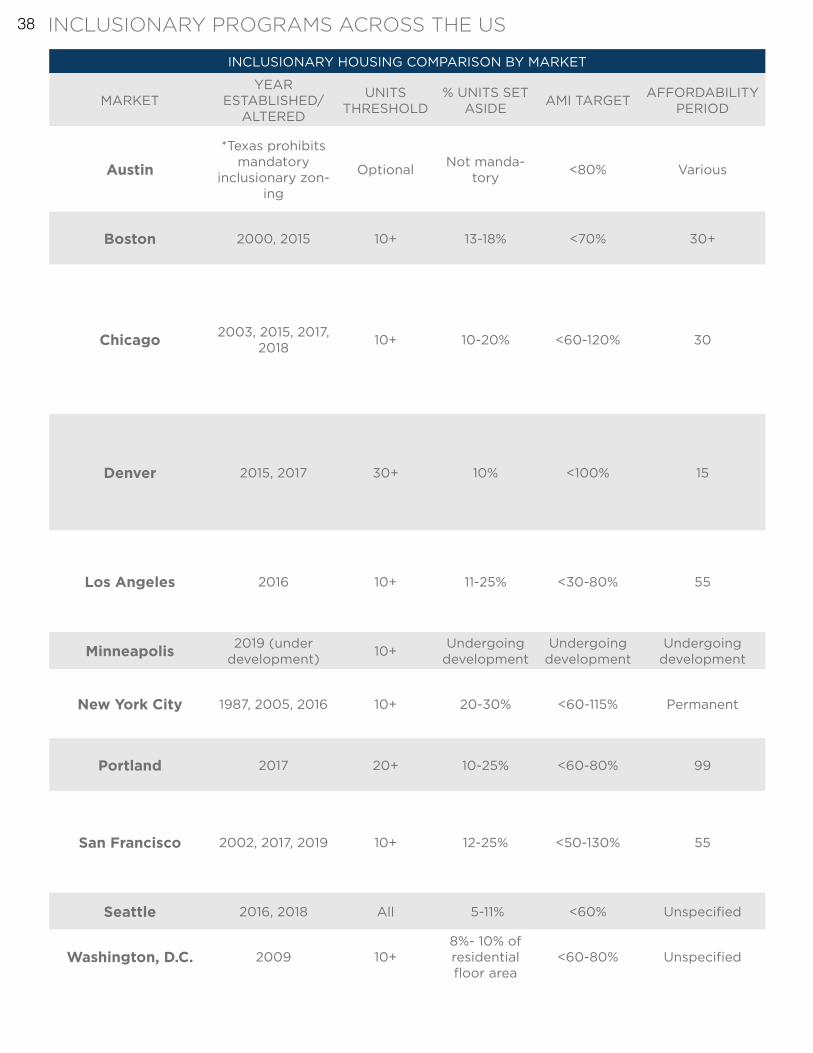
INCLUSIONARY HOUSING COMPARISON BY MARKET
MARKETYEAR
ESTABLISHED/ ALTERED
UNITS THRESHOLD
% UNITS SET ASIDE AMI TARGET AFFORDABILITY
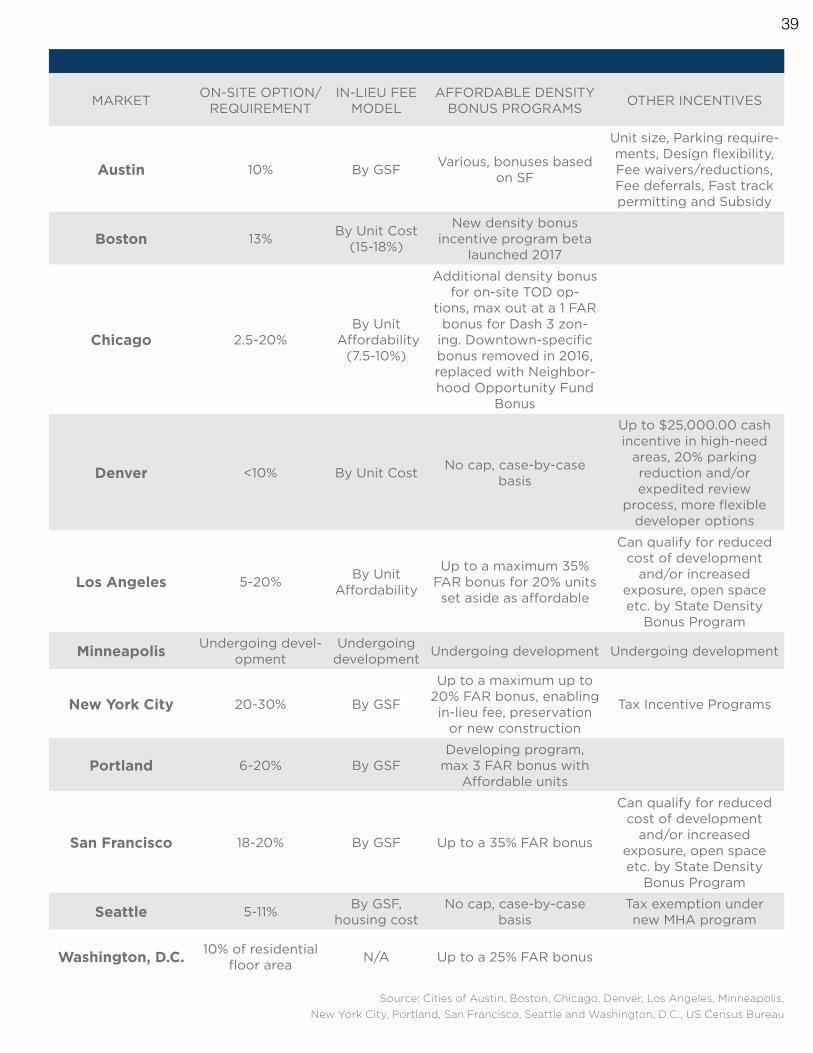
PERIOD MARKET ON-SITE OPTION/ REQUIREMENT
IN-LIEU FEE MODEL
AFFORDABLE DENSITY BONUS PROGRAMS OTHER INCENTIVES
Austin
*Texas prohibits mandatory
inclusionary zon-ing
Optional Not manda-tory <80% Various Austin 10% By GSF Various, bonuses based
on SF
Unit size, Parking require-ments, Design flexibility, Fee waivers/reductions, Fee deferrals, Fast track permitting and Subsidy
Boston 2000, 2015 10+ 13-18% <70% 30+ Boston 13% By Unit Cost (15-18%)
New density bonus incentive program beta
launched 2017
Chicago 2003, 2015, 2017, 2018 10+ 10-20% <60-120% 30 Chicago 2.5-20%
By Unit Affordability
(7.5-10%)
Additional density bonus for on-site TOD op-
tions, max out at a 1 FAR bonus for Dash 3 zon-
ing. Downtown-specific bonus removed in 2016, replaced with Neighbor-hood Opportunity Fund
Bonus
Denver 2015, 2017 30+ 10% <100% 15 Denver <10% By Unit Cost No cap, case-by-case basis
Up to $25,000.00 cash incentive in high-need
areas, 20% parking reduction and/or expedited review
process, more flexible developer options
Los Angeles 2016 10+ 11-25% <30-80% 55 Los Angeles 5-20% By Unit Affordability
Up to a maximum 35% FAR bonus for 20% units set aside as affordable
Can qualify for reduced cost of development
and/or increased exposure, open space etc. by State Density
Bonus Program
Minneapolis 2019 (under development) 10+ Undergoing
developmentUndergoing
developmentUndergoing
development Minneapolis Undergoing devel-opment
Undergoing development Undergoing development Undergoing development
New York City 1987, 2005, 2016 10+ 20-30% <60-115% Permanent New York City 20-30% By GSF
Up to a maximum up to 20% FAR bonus, enabling in-lieu fee, preservation
or new construction
Tax Incentive Programs
Portland 2017 20+ 10-25% <60-80% 99 Portland 6-20% By GSFDeveloping program,
max 3 FAR bonus with Affordable units
San Francisco 2002, 2017, 2019 10+ 12-25% <50-130% 55 San Francisco 18-20% By GSF Up to a 35% FAR bonus
Can qualify for reduced cost of development
and/or increased exposure, open space etc. by State Density
Bonus Program
Seattle 2016, 2018 All 5-11% <60% Unspecified Seattle 5-11% By GSF, housing cost
No cap, case-by-case basis
Tax exemption under new MHA program
Washington, D.C. 2009 10+8%- 10% of residential floor area
<60-80% Unspecified Washington, D.C. 10% of residential floor area N/A Up to a 25% FAR bonus
INCLUSIONARY PROGRAMS ACROSS THE US 38
INCLUSIONARY HOUSING COMPARISON BY MARKET
MARKETYEAR
ESTABLISHED/ ALTERED
UNITS THRESHOLD
% UNITS SET ASIDE AMI TARGET AFFORDABILITY
PERIOD MARKET ON-SITE OPTION/ REQUIREMENT
IN-LIEU FEE MODEL
AFFORDABLE DENSITY BONUS PROGRAMS OTHER INCENTIVES
Austin
*Texas prohibits mandatory
inclusionary zon-ing
Optional Not manda-tory <80% Various Austin 10% By GSF Various, bonuses based
on SF
Unit size, Parking require-ments, Design flexibility, Fee waivers/reductions, Fee deferrals, Fast track permitting and Subsidy
Boston 2000, 2015 10+ 13-18% <70% 30+ Boston 13% By Unit Cost (15-18%)
New density bonus incentive program beta
launched 2017
Chicago 2003, 2015, 2017, 2018 10+ 10-20% <60-120% 30 Chicago 2.5-20%
By Unit Affordability
(7.5-10%)
Additional density bonus for on-site TOD op-
tions, max out at a 1 FAR bonus for Dash 3 zon-
ing. Downtown-specific bonus removed in 2016, replaced with Neighbor-hood Opportunity Fund
Bonus
Denver 2015, 2017 30+ 10% <100% 15 Denver <10% By Unit Cost No cap, case-by-case basis
Up to $25,000.00 cash incentive in high-need
areas, 20% parking reduction and/or expedited review
process, more flexible developer options
Los Angeles 2016 10+ 11-25% <30-80% 55 Los Angeles 5-20% By Unit Affordability
Up to a maximum 35% FAR bonus for 20% units set aside as affordable
Can qualify for reduced cost of development
and/or increased exposure, open space etc. by State Density
Bonus Program
Minneapolis 2019 (under development) 10+ Undergoing
developmentUndergoing
developmentUndergoing
development Minneapolis Undergoing devel-opment
Undergoing development Undergoing development Undergoing development
New York City 1987, 2005, 2016 10+ 20-30% <60-115% Permanent New York City 20-30% By GSF
Up to a maximum up to 20% FAR bonus, enabling in-lieu fee, preservation
or new construction
Tax Incentive Programs
Portland 2017 20+ 10-25% <60-80% 99 Portland 6-20% By GSFDeveloping program,
max 3 FAR bonus with Affordable units
San Francisco 2002, 2017, 2019 10+ 12-25% <50-130% 55 San Francisco 18-20% By GSF Up to a 35% FAR bonus
Can qualify for reduced cost of development
and/or increased exposure, open space etc. by State Density
Bonus Program
Seattle 2016, 2018 All 5-11% <60% Unspecified Seattle 5-11% By GSF, housing cost
No cap, case-by-case basis
Tax exemption under new MHA program
Washington, D.C. 2009 10+8%- 10% of residential floor area
<60-80% Unspecified Washington, D.C. 10% of residential floor area N/A Up to a 25% FAR bonus
Source: Cities of Austin, Boston, Chicago, Denver, Los Angeles, Minneapolis, New York City, Portland, San Francisco, Seattle and Washington, D.C., US Census Bureau
39
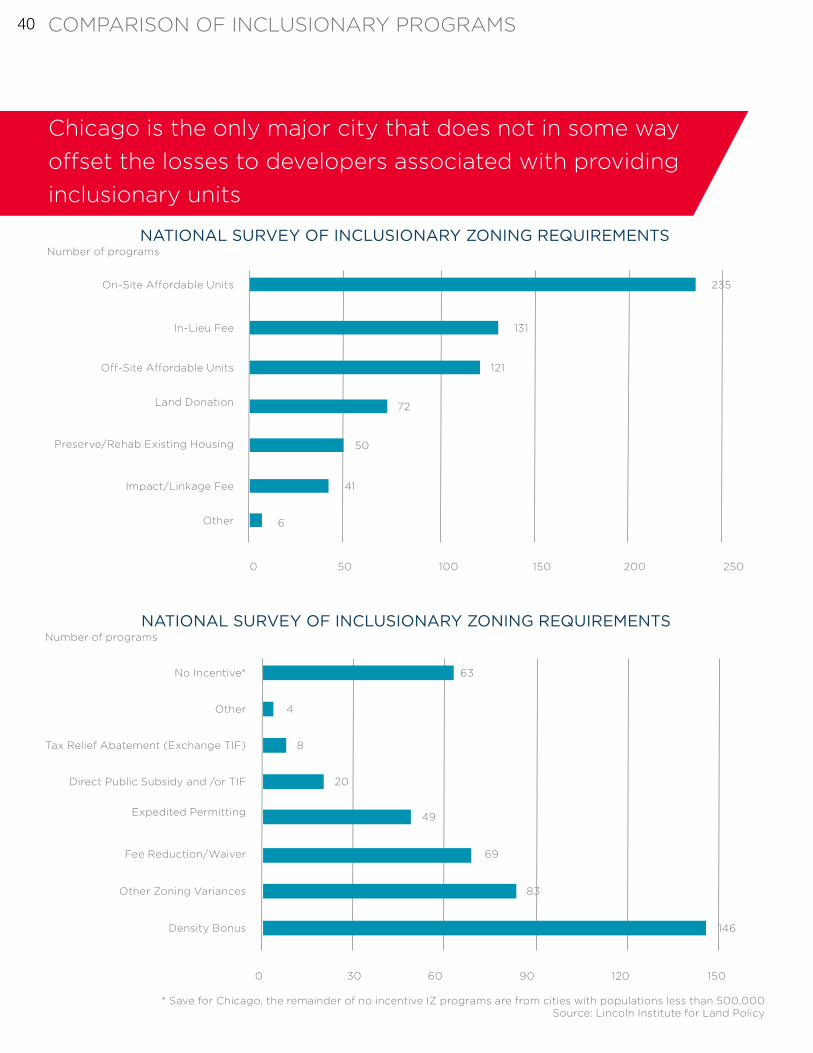
Chicago is the only major city that does not in some way offset the losses to developers associated with providing inclusionary units
Source: Cities of Austin, Boston, Chicago, Denver, Los Angeles, Minneapolis, New York City, Portland, San Francisco, Seattle and Washington, D.C., US Census Bureau
Source: Lincoln Institute for Land Policy* Save for Chicago, the remainder of no incentive IZ programs are from cities with populations less than 500,000
On-Site Affordable Units
No Incentive*
Other
In-Lieu Fee
Tax Relief Abatement (Exchange TIF)
Off-Site Affordable Units
Direct Public Subsidy and /or TIF
Land Donation
Expedited Permitting
Preserve/Rehab Existing Housing
Fee Reduction/Waiver
Impact/Linkage Fee
Other Zoning Variances
Other
Density Bonus
6
146
41
83
50
69
72
49
121
20
131
235
63
4
8
250
150
200
120
150
90
100
60
50
30
0
0
Number of programs
Number of programs
NATIONAL SURVEY OF INCLUSIONARY ZONING REQUIREMENTS
NATIONAL SURVEY OF INCLUSIONARY ZONING REQUIREMENTS
COMPARISON OF INCLUSIONARY PROGRAMS 40
Source: Cities of Austin, Boston, Chicago, Denver, Los Angeles, Minneapolis, New York City, Portland, San Francisco, Seattle and Washington, D.C., US Census Bureau
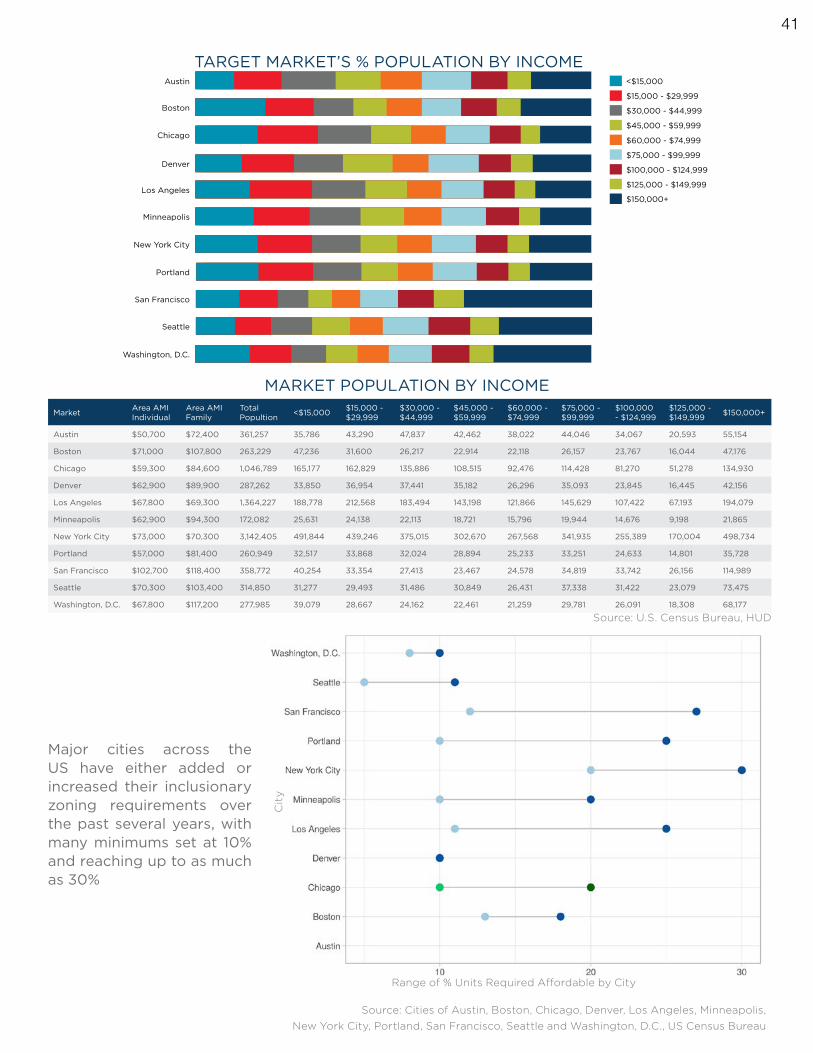
Major cities across the US have either added or increased their inclusionary zoning requirements over the past several years, with many minimums set at 10% and reaching up to as much as 30%
Market Area AMI Individual
Area AMI Family
Total Popultion <$15,000 $15,000 -
$29,999$30,000 - $44,999
$45,000 - $59,999
$60,000 - $74,999
$75,000 - $99,999
$100,000 - $124,999
$125,000 - $149,999 $150,000+
Austin $50,700 $72,400 361,257 35,786 43,290 47,837 42,462 38,022 44,046 34,067 20,593 55,154
Boston $71,000 $107,800 263,229 47,236 31,600 26,217 22,914 22,118 26,157 23,767 16,044 47,176
Chicago $59,300 $84,600 1,046,789 165,177 162,829 135,886 108,515 92,476 114,428 81,270 51,278 134,930
Denver $62,900 $89,900 287,262 33,850 36,954 37,441 35,182 26,296 35,093 23,845 16,445 42,156
Los Angeles $67,800 $69,300 1,364,227 188,778 212,568 183,494 143,198 121,866 145,629 107,422 67,193 194,079
Minneapolis $62,900 $94,300 172,082 25,631 24,138 22,113 18,721 15,796 19,944 14,676 9,198 21,865
New York City $73,000 $70,300 3,142,405 491,844 439,246 375,015 302,670 267,568 341,935 255,389 170,004 498,734
Portland $57,000 $81,400 260,949 32,517 33,868 32,024 28,894 25,233 33,251 24,633 14,801 35,728
San Francisco $102,700 $118,400 358,772 40,254 33,354 27,413 23,467 24,578 34,819 33,742 26,156 114,989
Seattle $70,300 $103,400 314,850 31,277 29,493 31,486 30,849 26,431 37,338 31,422 23,079 73,475
Washington, D.C. $67,800 $117,200 277,985 39,079 28,667 24,162 22,461 21,259 29,781 26,091 18,308 68,177
Austin
Boston
Chicago
Denver
Los Angeles
Minneapolis
New York City
Portland
San Francisco
Seattle
Washington, D.C.
<$15,000
$60,000 - $74,999
$30,000 - $44,999
$100,000 - $124,999
$15,000 - $29,999
$75,000 - $99,999
$45,000 - $59,999
$125,000 - $149,999
$150,000+
Source: U.S. Census Bureau, HUD
TARGET MARKET’S % POPULATION BY INCOME
MARKET POPULATION BY INCOME
Cit
y
Range of % Units Required Affordable by City
41
INCLUSIONARY ZONING PROGRAMS LIKE THE ARO REQUIRE STRONG DEVELOPMENT OF MARKET RATE HOUSING TO BE EFFECTIVE
Production of affordable units under inclusionary zoning has historically been limited, pushing urban policymakers to seek to expand production by increasing set-aside requirements and requiring more units constructed on-site. However, this tactic leads to diminishing returns - resulting in more and more infeasible units as the percentage set-aside is increased. However, production can be scaled along with market-rate developments - by spreading the affordable units over a larger number of new projects.
THE ARO PILOT HAS PUSHED MANY DEVELOPMENTS TO BE INFEASIBLE, THROTTLING FUTURE DEVELOPMENT WITHIN THEIR BOUNDARIES
Leading indicators of multifamily developments within neighborhood areas, land purchases and construction permits, both saw a sizable reduction in 2018. Both of these suggest that the latest requirements instituted have resulted in stagnation of future housing - market or affordable - within the 2017 Pilot neighborhoods.
IF THE GOAL OF THE ARO PILOT PROGRAM IS TO REDUCE COMMUNITY DISPLACEMENT, OTHER POLICIES MAY BE MORE EFFECTIVE
Displacement arises from a multitude of factors, that cannot alone be solved by the increases in affordable requirements and corresponding reduction in new housing delivered. More comprehensive policy frameworks that address teardowns of small-scale product and better enable locals to reap the benefits of increased capital investment in their neighborhoods should be evaluated.
CONCLUSIONS 42
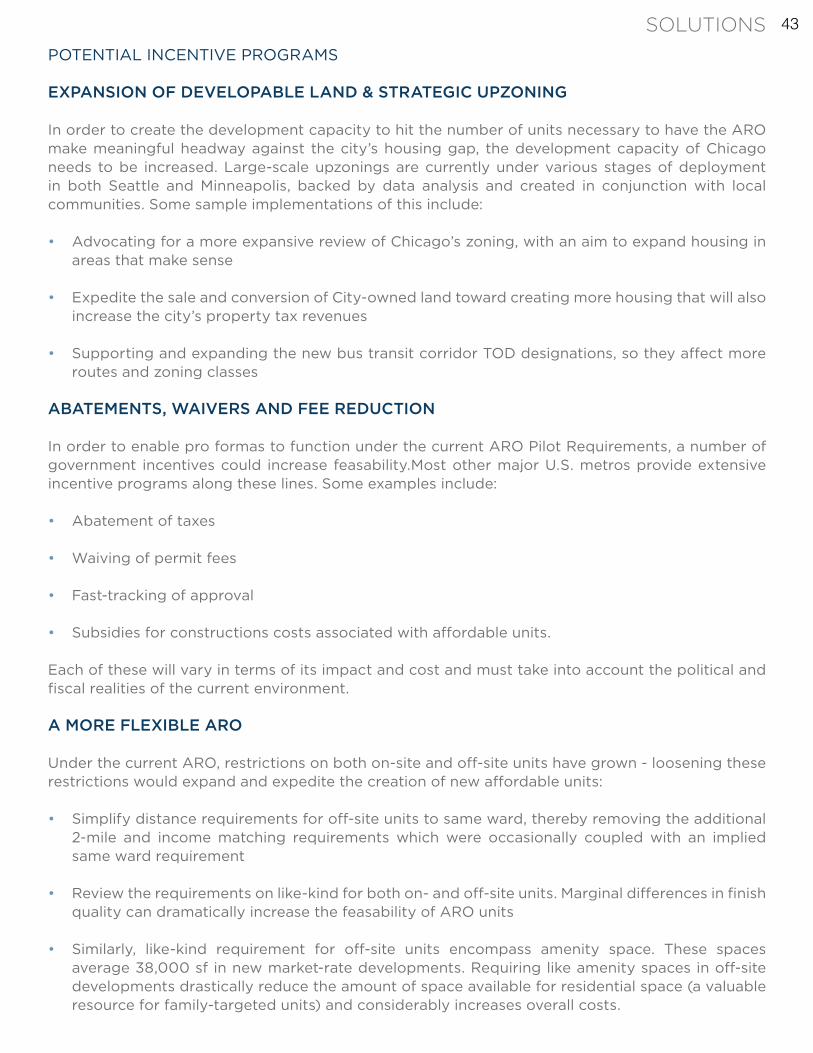
POTENTIAL INCENTIVE PROGRAMS
EXPANSION OF DEVELOPABLE LAND & STRATEGIC UPZONING
In order to create the development capacity to hit the number of units necessary to have the ARO make meaningful headway against the city’s housing gap, the development capacity of Chicago needs to be increased. Large-scale upzonings are currently under various stages of deployment in both Seattle and Minneapolis, backed by data analysis and created in conjunction with local communities. Some sample implementations of this include:
• Advocating for a more expansive review of Chicago’s zoning, with an aim to expand housing in areas that make sense
• Expedite the sale and conversion of City-owned land toward creating more housing that will also increase the city’s property tax revenues
• Supporting and expanding the new bus transit corridor TOD designations, so they affect more routes and zoning classes
ABATEMENTS, WAIVERS AND FEE REDUCTION
In order to enable pro formas to function under the current ARO Pilot Requirements, a number of government incentives could increase feasability.Most other major U.S. metros provide extensive incentive programs along these lines. Some examples include:
• Abatement of taxes
• Waiving of permit fees
• Fast-tracking of approval
• Subsidies for constructions costs associated with affordable units.
Each of these will vary in terms of its impact and cost and must take into account the political and fiscal realities of the current environment.
A MORE FLEXIBLE ARO
Under the current ARO, restrictions on both on-site and off-site units have grown - loosening these restrictions would expand and expedite the creation of new affordable units:
• Simplify distance requirements for off-site units to same ward, thereby removing the additional 2-mile and income matching requirements which were occasionally coupled with an implied same ward requirement
• Review the requirements on like-kind for both on- and off-site units. Marginal differences in finish quality can dramatically increase the feasability of ARO units
• Similarly, like-kind requirement for off-site units encompass amenity space. These spaces average 38,000 sf in new market-rate developments. Requiring like amenity spaces in off-site developments drastically reduce the amount of space available for residential space (a valuable resource for family-targeted units) and considerably increases overall costs.
SOLUTIONS 43
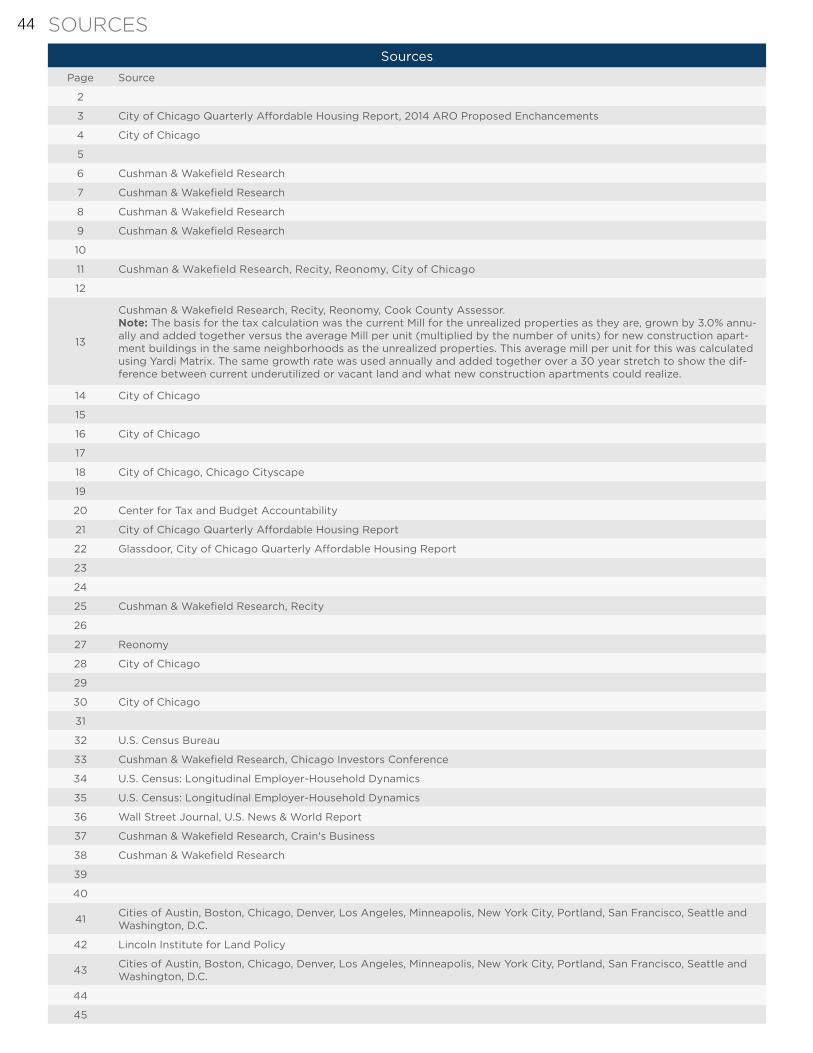
SourcesPage Source
2
3 City of Chicago Quarterly Affordable Housing Report, 2014 ARO Proposed Enchancements
4 City of Chicago
5
6 Cushman & Wakefield Research
7 Cushman & Wakefield Research
8 Cushman & Wakefield Research
9 Cushman & Wakefield Research
10
11 Cushman & Wakefield Research, Recity, Reonomy, City of Chicago
12
13
Cushman & Wakefield Research, Recity, Reonomy, Cook County Assessor.Note: The basis for the tax calculation was the current Mill for the unrealized properties as they are, grown by 3.0% annu-ally and added together versus the average Mill per unit (multiplied by the number of units) for new construction apart-ment buildings in the same neighborhoods as the unrealized properties. This average mill per unit for this was calculated using Yardi Matrix. The same growth rate was used annually and added together over a 30 year stretch to show the dif-ference between current underutilized or vacant land and what new construction apartments could realize.
14 City of Chicago
15
16 City of Chicago
17
18 City of Chicago, Chicago Cityscape
19
20 Center for Tax and Budget Accountability
21 City of Chicago Quarterly Affordable Housing Report
22 Glassdoor, City of Chicago Quarterly Affordable Housing Report
23
24
25 Cushman & Wakefield Research, Recity
26
27 Reonomy
28 City of Chicago
29
30 City of Chicago
31
32 U.S. Census Bureau
33 Cushman & Wakefield Research, Chicago Investors Conference
34 U.S. Census: Longitudinal Employer-Household Dynamics
35 U.S. Census: Longitudinal Employer-Household Dynamics
36 Wall Street Journal, U.S. News & World Report
37 Cushman & Wakefield Research, Crain's Business
38 Cushman & Wakefield Research
39
40
41 Cities of Austin, Boston, Chicago, Denver, Los Angeles, Minneapolis, New York City, Portland, San Francisco, Seattle and Washington, D.C.
42 Lincoln Institute for Land Policy
43 Cities of Austin, Boston, Chicago, Denver, Los Angeles, Minneapolis, New York City, Portland, San Francisco, Seattle and Washington, D.C.
44
45
SOURCES 44
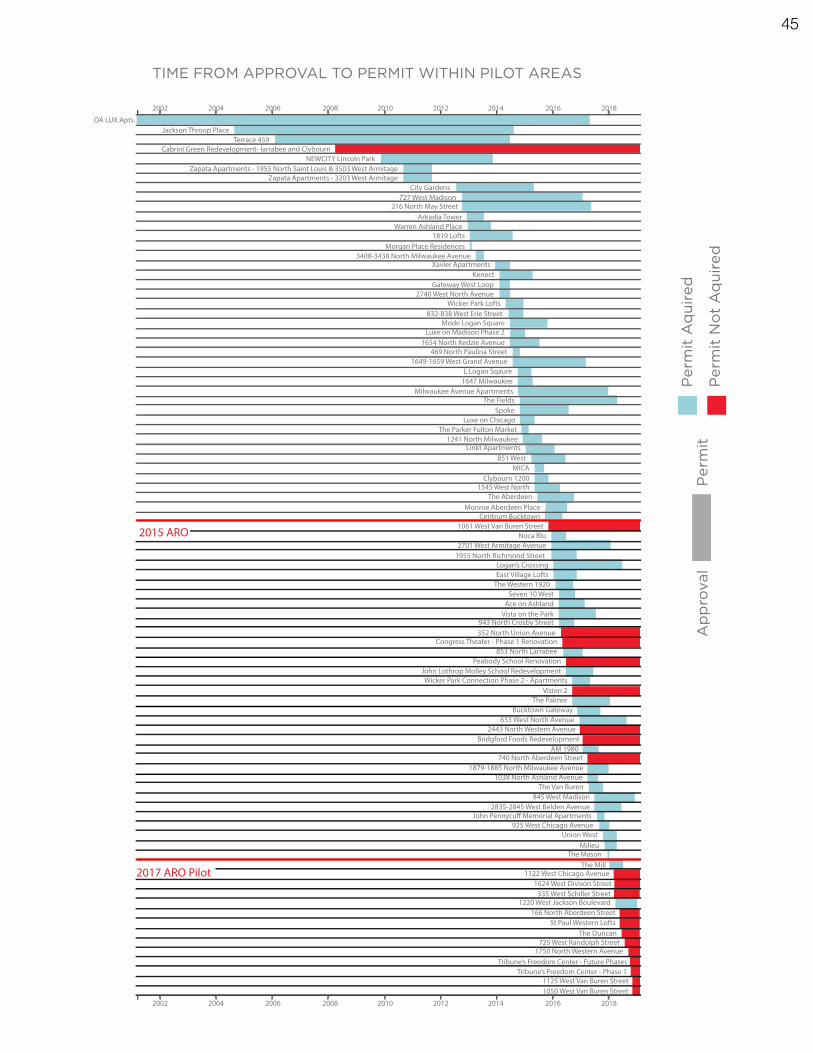
2017 ARO Pilot
2015 ARO
OA LUX Apts.Jackson Throop Place
Terrace 459 Cabrini Green Redevelopment- larrabee and Clybourn
NEWCITY Lincoln ParkZapata Apartments - 1955 North Saint Louis & 3503 West Armitage
Zapata Apartments - 3203 West ArmitageCity Gardens
727 West Madison216 North May Street
Kenect
Mode Logan Square
Spoke
Linkt Apartments
Centrum Bucktown
352 North Union Avenue
633 West North Avenue
Union West
1050 West Van Buren Street
201820162014201220102008200620042002
1125 West Van Buren StreetTribune’s Freedom Center - Phase 1
Tribune’s Freedom Center - Future Phases1750 North Western Avenue
725 West Randolph StreetThe Duncan
St Paul Western Lofts166 North Aberdeen Street
1220 West Jackson Boulevard335 West Schiller Street
1624 West Divison Street1122 West Chicago Avenue
The MillThe Mason
Milieu
925 West Chicago AvenueJohn Pennycu� Memorial Apartments
2835-2845 West Belden Avenue845 West Madison
The Van Buren1038 North Ashland Avenue
1879-1885 North Milwaukee Avenue740 North Aberdeen Street
AM 1980Bridgford Foods Redevelopment
2443 North Western Avenue
Bucktown GatewayThe Palmer
Vision 2Wicker Park Connection Phase 2 - Apartments
John Lothrop Molley School RedevelopmentPeabody School Renovation
853 North LarrabeeCongress Theater - Phase 1 Renovation
943 North Crosby StreetVista on the Park
Ace on AshlandSeven 10 West
The Western 1920East Village LoftsLogan’s Crossing
1955 North Richmond Street2701 West Armitage Avenue
Noca Blu1061 West Van Buren Street
The AberdeenMonroe Aberdeen Place
1545 West NorthClybourn 1200
MICA851 West
1241 North MilwaukeeThe Parker Fulton Market
Luxe on Chicago
The FieldsMilwaukee Avenue Apartments
1647 MilwaukeeL Logan Sqaure
1649-1659 West Grand Avenue469 North Paulina Street
1654 North Kedzie AvenueLuxe on Madison Phase 2
832-838 West Erie StreetWicker Park Lofts
2740 West North AvenueGateway West Loop
Xavier Apartments3408-3438 North Milwaukee Avenue
Morgan Place Residences1819 Lofts
Warren Ashland PlaceArkadia Tower
201820162014201220102008200620042002
Per
mit
Aq
uire
d
Per
mit
Per
mit
No
t A
qui
red
A
pp
rova
l
TIME FROM APPROVAL TO PERMIT WITHIN PILOT AREAS
45
© 2018 Cushman & Wakefield. All rights reserved. The information contained within this report is gathered from multiple sources believed to be reliable. The information may contain errors or omissions and is presented without any warranty or representations as to its accuracy.
ABOUT CUSHMAN & WAKEFIELDCushman & Wakefield (NYSE: CWK) is a leading global real estate services firm that delivers exceptional value for real estate occupiers and owners. Cushman & Wakefield is among the largest real estate services firms with approximately 51,000 employees in 400 offices and 70 countries. In 2018, the firm had revenue of $8.2 billion across core services of property, facilities and project management, leasing, capital markets, valuation and other services. To learn more, visit www.cushmanwakefield.com or follow @CushWake on Twitter.
Susan TjarksenManaging DirectorTel: +1 312 523 [email protected]
Laura BallouSenior Research Analyst, Capital Markets Tel: +1 630 244 [email protected]
Jacob AlbersResearch Analyst, Capital Markets Tel: +1 510 735 [email protected]
multifamily.cushwake.com