MAY 2017 VOLUME LXXI NUMBER 5
98
MAY 2017 VOLUME LXXI NUMBER 5
Transcript of MAY 2017 VOLUME LXXI NUMBER 5
MAY 2017
VOLUME LXXI NUMBER 5
EDITORIAL COMMITTEEJanak RajBrajamohan MisraGautam Chatterjee Amitava Sardar
EDITOR Sunil Kumar
The Reserve Bank of India Bulletin is issued monthly by the Department of Economic and Policy Research, Reserve Bank of India, under the direction of the Editorial Committee.The Central Board of the Bank is not responsible for interpretation and opinions expressed. In the case of signed articles, the responsibility is that of theauthor.
© Reserve Bank of India 2017
All rights reserved.Reproduction is permitted provided an acknowledgment of the source is made.
For subscription to Bulletin, please refer toSection ‘Recent Publications’
The Reserve Bank of India Bulletin can beaccessed at http://www.bulletin.rbi.org.in
Speech
A Bank Should Be Something One Can ‘Bank’ Upon Viral V. Acharya 1
Articles
Finances of Non-Government Non-Financial Public Limited Companies, 2015-16 9
Performance of Non-Government Non-Banking Financial and Investment Companies, 2015-16 19
Union Budget 2017-18: An Assessment 37
Current Statistics 47
Recent Publications 86
CONTENTS


Speech
A Bank Should Be Something One Can ‘Bank’ Upon Viral V. Acharya

SPEECH
RBI Bulletin May 2017 1
A Bank Should Be Something One Can “Bank” Upon
credibility, of confidence, of trust – something that
ideally a bank must earn over time by making prudent
choices.
To understand this, we need to first grasp three
simple concepts: what are bank deposits, what are
bank loans, and that bank deposits can be demanded
immediately by depositors but bank borrowers may
not repay their loans exactly at that time.
So let us work step by step.
What are bank deposits?
In its simplest form, my bank deposit is an
amount of saving I have deposited into an account
at a bank on my street corner. Once I have created
the deposit account and put my savings into it, I
can withdraw up to that amount at will. A deposit is
something that the bank owes me; in other words, it
is the bank’s liability.
Crucially, the deposit can be redeemed with
immediacy. I can show up at the bank ATM or at the
bank teller, demanding that my money be paid back
to me – Show me the money! Why might I need to
do this? A bank deposit is the place where I save for
the rainy day – my health expenses, my tuition fees,
my day to day expenses. Some of these needs are
predictable, some random; each time I withdraw at
the ATM or the teller, or write a cheque or do a wire
transfer, I am demanding my money from the bank.
Each instance I do not demand my money back, I am
rolling over the deposit to the next instance.
Bank deposits are thus savings that I have
kept with a bank. I trust them to be safe and to be
demandable at will. I am happy to earn a low interest
rate on them as they provide me valuable liquidity
services, allowing me to meet my day to day and the
occasional lumpy payment needs.
I am grateful to the Federation of Indian
Chambers of Commerce and Industry – FICCI Ladies
Organisation (FLO), Mumbai Chapter, for inviting
me to speak today. I salute FLO’s mission, and wish
the very best to the incoming office bearers on their
efforts to empower and educate women, unlocking a
potential workforce for the Indian economy that can
both balance gender distribution of jobs and identify
new sources of enterprise and entrepreneurship.
I hope that by explaining today the important role
that banks play in an economy, I can make a small
contribution, offering if not a flower at least a petal,
to help the financial planning undertaken by women
workers, educators and entrepreneurs.
I wish to try and simplify the mechanics of how
a bank works, why we put our savings into banks,
what does a bank do with our savings, when should
we question which bank are we banking with, and
why when such questions are asked en masse, is
there a banking crisis and economic growth comes to
a screeching halt. I will then draw implications for the
current condition of the Indian banking sector and
suggest some ways to restore it to healthier levels.
The gist of what I want to say can be summarised
in one line message – A Bank Should Be Something
One Can “Bank” Upon, inspired by the real meaning
behind banking upon something, a statement of
Speech delivered by Dr. Viral V. Acharya, Deputy Governor, Reserve Bank of India on April 28, 2017, FICCI Ladies Organisation, Mumbai Chapter.* I am grateful to my colleagues and teams at the Reserve Bank of India for many stimulating discussions and insights, to many banking sector stalwarts of today and the past, and to several practitioners and policy-makers in sectors and institutions related to the resolution of bank stressed assets. All errors remain my own.
A Bank Should Be Something One Can ‘Bank’ Upon*Viral V. Acharya

SPEECH
RBI Bulletin May 20172
A Bank Should Be Something One Can “Bank” Upon
What are bank loans?
There are many depositors like me parking their
savings in the bank. Viewed this way, the bank is a
safety vault or a storage technology. However, most of
the time, the deposits are not being withdrawn and
are simply being rolled over. Even when withdrawn,
the deposits are not being redeemed at the same time.
For instance, my health expenses are not coincident
with those of my neighbour. In other words, there is
much saving in the bank that is lying idle.
Let us now bring into picture others in the
economy who are potential borrowers. A bright
young woman down the street has been a successful
consultant, but wants to have a shot at building a new
enterprise. She needs financing beyond her savings to
put her bright ideas to test. There is a new construction
just completed and several young couples, first-time
home buyers, are looking to purchase houses there.
They have some capacity to make down-payments
for the properties but must avail of extra monies that
they can repay over the course of their lives. An old
family needs money for medical expenses to treat a
long-term illness. They cannot afford to spend out
of their savings, but they do own a property against
which they would like to borrow.
These potential borrowers can visit the bank
branch to meet such financing needs. The bank makes
loans to these individuals and families, assessing
their ability to repay the loans, signing appropriate
agreements to claim repayments in due course, and
attaching the property and other assets as collateral
that it can have access to in case the repayments fall
through for some reason.
Such loans are bank’s assets. They typically earn
a higher rate of interest than bank deposits and make
banking activity an attractive proposition.
Demand deposits are short-term; bank loans are
long-term
This way, a bank takes shape. It has liabilities,
the right-hand side of its balance-sheet, in the form
of deposits that must be repaid when depositors so
demand; it has assets, the left-hand side of its balance-
sheet, in the form of bank loans that have some
fixed points of time at which the bank can command
repayments.
By being so organised, the bank is performing
the economic function of maturity transformation.
A deposit, which is potentially demandable at any
instance, has effectively been lent out through
financial intermediation in the form of a longer-term
bank loan that is not making repayments at each
instance.
And yet… the beauty of the arrangement is that
most of the time, this works out. The day my health
expenses arise and I take out money from the bank,
my neighbour and others have likely received monthly
paycheques, a part of which remain deposited in the
bank, or that same day some loan repayments have
been made, extending the savings pool of the bank
and allowing it to meet my deposit withdrawals.
In background, financing has been made available
to new entrepreneurs, first-time home buyers and
aging parents. Their undertakings are creating a whole
second-round of economic activity, in the form of job
creation at new enterprises, construction and cement
industry, and medical services and hospitals. Those
involved in these activities have their own saving
and borrowing needs, and will in turn deal with their
banks.
Banking, in this manner is the life-blood of an
economy, channels savings in the form of demand
SPEECH
RBI Bulletin May 2017 3
A Bank Should Be Something One Can “Bank” Upon
deposits into borrowings in the form of bank loans or
bank credit, fuels and lubricates growth, and improves
everyone’s welfare.
All of our lives would be easy, including of
central bankers, if banking worked as serenely as I
have described so far. But, of course, that would be
too good to be true. There are risks, there are tools to
deal with these risks, and yet occasionally, there are
banking crises. So let me turn to these next.
What are the risks from maturity transformation
and how can a bank manage them?
What if by coincidence, the bank receives a series
of withdrawal requests at once. There could be an
epidemic in the area of its operations; may be the
bank serves a community that is buying a lot of gold
for Akshaya Tritiya; or there is a wealth shock to the
farming community it serves due to poor monsoon
and new deposits do not come in at the expected rate.
In such a scenario, when many depositors
need to withdraw their monies at once, the bank
faces risk from maturity transformation. Given the
coincident money demand, it is no longer sufficient
to simply manage deposit withdrawals with new
deposits and repayments on existing loans. What
options does the bank have to manage these risks to
ensure that it will show the money to its depositors
when they need it and thus retain their trust?
To this end, let me briefly introduce three
concepts: bank liquidity, bank capital, and inter-
bank markets.
Bank Liquidity
One simple idea is that a bank need not deploy
all of its deposits for extending bank loans. It can
save some purely as a reserve or a buffer to meet the
unexpected coincidence in deposit withdrawals. The
benefit of such bank liquidity is that it is an impeccable
defense as long as withdrawals are smaller than the
size of the reserve. The cost is that by not being able
to extend bank loans on part of its deposits, economic
activity is compromised.
Bank Capital
Another idea is that a bank need not fund its
extension of bank loans only with deposits in its
liability structure. It can also raise some other forms
of non-demandable liabilities. For example, the banker
can put his own capital, beyond the savings needs,
into the bank. A large bank can also raise public equity
by being listed on a stock exchange. This way, the
impact of the bank’s unexpected deposit withdrawals
can be made smaller relative to the overall size of the
bank and the loan repayments it receives.
Such bank capital would be supported through
profits that a bank makes, by charging loan rates
that exceed deposit rates and net of the costs of its
operations. Bank capital would then be the first line of
defense in case bank faces unexpected withdrawals:
bankers can take less bonus out of the bank; dividends
being paid out to bank equity could be temporarily
suspended; and in fact, bankers and equity owners
can inject new finance to meet the temporary needs
anticipating that future profits will nevertheless
render such capital injection profitable for them.
Inter-bank Markets
An even more involved idea is for the bank to try
and raise liquidity on the fly, from other banks (more
generally, other financial intermediaries). Not all
banks may be in regions hit by the epidemic or natural
disaster. As long as these banks trust that the bank in
need of liquidity only has a temporary need but has a
high quality of long-term assets otherwise, they can
SPEECH
RBI Bulletin May 20174
A Bank Should Be Something One Can “Bank” Upon
lend their liquidity surplus to the bank in need. This
would be an inter-bank deposit. At other times, the
surplus bank may be unprepared to deposit its money
but instead may simply buy some of the needy bank’s
assets, creating an inter-bank market for asset sales.
In extremis, the surplus bank can simply assume all
liabilities of the needy bank, and in return, take over
the entire bank itself, creating a market for inter-bank
mergers.
It should be clear then that a bank has many
tools to manage the risk of maturity transformation,
the risk that deposits are demanded with immediacy
while its assets are yet to make full repayments. The
worse the quality of its assets, the less a bank can
rely on cash flows from assets to meet unexpected
withdrawals, and the more it must pre-arrange in the
form of liquidity and capital. The tools – liquidity,
capital and inter-bank markets – are not mutually
exclusive though they clearly affect each other, and
are more attractive at some times than others.
With such tools to manage its risks, can we not
always bank upon our bank?
One possibility is that the bank has raised little
equity capital and also held little liquidity of its own.
Once depositors know this, they realise that the only
way they can be redeemed against their withdrawals
is if the bank can use inter-bank markets to raise
liquidity. As I explained, this would be possible only
if the bank’s assets are deemed good enough to repay
the inter-bank transaction in future. But then the
following question arises: what if the asset quality of
the bank is suspect as it has betted the bank’s money
on the upside leaving depositors at risk of losing their
savings if the bets don’t pay off? And, even if the asset
quality is not entirely suspect, what if the inter-bank
markets dry up themselves, which could happen if
there is in fact no healthy bank, or only a few healthy
banks around as most banks betted the economy’s
savings imprudently?
Systemic shock, bank runs, financial
disintermediation
In essence, if an economic tsunami – like a
massive house price crash or global economic collapse
or under performance in many industrial sectors –
comes and hits the banking system, and it had chosen
to remain heavily exposed to it by being on the
shores, so that a large portion of its assets is deemed
to be risky at once, then an unexpectedly large deposit
withdrawal could be rather hard to meet for any bank.
Worse, when this happens, if some depositors start
being repaid by the bank, other depositors fear that
bank liquidity is getting depleted and their savings
might be at risk given the underlying assets are either
not safe or not liquid enough in inter-bank markets.
Now, these depositors may start demanding their
deposits too. And a bank “run” starts. Fearing the
asset-quality signal revealed by such a run at one bank,
depositors could start running on other banks too,
especially ones with similar assets and a full-fledged
banking panic takes hold.
When this happens, the entire banking system is
at the risk of being disintermediated; payments and
settlements of financial transactions can come to a
standstill; banks have no capacity on balance-sheet to
make new loans to new entrepreneurs, first-time home
buyers and old families; the economic activity can
come to a grinding halt. There are banks around, but
no banking, the life-blood of the economy, to channel
savings to productive uses and for job creation.1
1 Interestingly, the word “bankruptcy” – a term used to describe the situation when a borrower defaults on repayments to be made – derives from the Italian term “banca rotta”, or a “broken bank”, describing the depositors of a bank breaking the bench or the counter of the teller in the Republic of Genoa when the banker was unable to meet their demands on deposit withdrawals.
SPEECH
RBI Bulletin May 2017 5
A Bank Should Be Something One Can “Bank” Upon
The present Indian context
Let me now turn to what all this means for the
present Indian context. To put things in perspective,
let me mention that the recently released Global
Financial Stability Report by the International
Monetary Fund (IMF) brings out the following salient
facts:
1. Indian industrial sector is now among the most
heavily indebted in the world in terms of the ability
of its cash flows to meet its bank loan repayments2;
and,
2. Indian banking sector comes out as worse-
off compared to other emerging economies in
terms of how little bank capital it has set aside
to provision for losses on its assets, i.e., on its
non-performing loans, made primarily to the
industrial sector.3
What does it mean to have little bank capital
as provision for losses? I like the following analogy.
A bank not keeping adequate capital buffer to absorb
losses on its loans that are more or less known to be
arriving soon is akin to not preparing to rescue with
emergency a person who has slipped off the terrace of
a skyscraper, and instead in the midst of his almost
surely fatal descent, hoping that the laws of gravity
would somehow freeze and work differently this
time. While such under-provisioning problem extends
to some of the private banks too, the scale of the
problem is three to four times magnified in case of
public sector banks.
By and large, this scenario meets the adverse
conditions of the narrative I provided about banking
and banking panics. But in our context, several
questions immediately come to mind: Why should I
worry about whether I can bank upon my bank when
my deposit is insured by the government? More so, if
my deposits are with a state-owned bank? Why should
I bother about my bank’s asset quality?
The double-edged sword of deposit insurance and
state ownership of banks
Answering these questions is crucial to
understanding how our banking sector problems are
likely to play out. A moment of reflection reveals
that as long as I trust the deposit insurance and the
guarantee of the state behind the public sector banks,
I have no good reason to run and pull my deposit
out of an insured deposit or a state-owned bank. The
catch is this. When banks are in poor health, it does
affect the potential borrowers. Once a bank’s asset
quality is adequately impaired, the bank does not
grow its lending book much with fresh loans. Bank
management of a thinly capitalised bank is interested
in primarily making two kinds of loans. First, ever-
greening of existing bad debt – throwing more money
after the bad, so as to help the borrower repay past
loan, not acknowledge its true quality, and simply
kick the can down the road. Second, risky loans that
give banks high returns so that it can make a last-ditch
effort to rebuild capital quickly – doubling up bets in
a casino when first round of gambling has all gone
sour. Faced with such borrowing prospects, healthy
borrowers who have access to alternate forms of
finance may be able to switch out of bank borrowing.
Financial intermediation, however, is likely to grow at
an anaemic pace, and many deserving borrowers such
as the ones I have alluded to, likely to remain starved
of credit.
Ironically, the presence of large safety net of
deposit insurance and state ownership, which ensure
2 Figure 1.15, Global Financial Stability Report, April 2017.
3 Table 1.2, Global Financial Stability Report, April 2017.
SPEECH
RBI Bulletin May 20176
A Bank Should Be Something One Can “Bank” Upon
that there are likely to be no bank runs, end up eroding
any disciplining force that gets the bank health
restored to a state where the economy can bank upon
its banks to perform the economic function of fuelling
and lubricating growth. Deposit insurance and state
ownership help the sick patient survive but on their
own do not guarantee good health; they may prevent
financial instability but do not restore credit growth to
levels that a vibrant economy needs.
And, indeed, recent global experience has shown
that governments need to be watchful as to how large
the safety net adds up to relative to its own capacity
to provide for it. Countries such as Ireland and Spain
engaged as a response to their banking sector woes
in 2008 with massive guaranteeing of bank deposits
and other liabilities. This, however, ended up being a
Pyrrhic victory as they emerged with troubled balance-
sheets themselves, raising their debt to Gross Domestic
Product (GDP) ratios from healthy to questionable
levels, and triggering sovereign debt crises.
Bank resolution options
It is with the objective of avoiding such a
contingency under any circumstance that I wish to
propose that we deal with the ailing public sector
banks in creative ways instead of just propping them
up with state aid.4
Let me elaborate. We keep hearing clarion
calls for more and more government funding for
recapitalisation of our public sector banks. Clearly,
more recapitalisation with government funds is
essential. However, as a majority shareholder of
public sector banks, the government runs the risk
of ending up paying for it all. The expectation of
government dole outs might have been set by the
past practice of throwing more money after the bad.
Take for instance our bank recapitalisation plan of
2008-09 after the global financial crisis: banks that
experienced the worst outcomes received the most
capital in a relative sense. Most of these banks need
capital again.
We must not allocate capital so poorly, recreate
“Heads I Win, Tails the Taxpayer Loses” incentives,
and sow the seeds of another lending excess. There
are better ways to do it. Let me offer five options:
1. Private capital raising: The healthier public
sector banks could have raised private capital
by issuing deep discount rights in 2013,
and some can still do so now. They must be
required to do this to share the government’s
burden of recapitalising banks. It might
be a good way to restore some discipline
and get the bank shareholders, boards and
management to more seriously care about
the quality of lending decisions.
2. Asset sales: Some banks will have assets or
loan portfolios that are in good enough shape
to be sold in the market. Modern banks no
longer just make bank loans but also hold non-
core assets such as insurance subsidiaries,
market-making divisions, foreign branches,
etc. Such non-core assets can be readily sold.
Other assets could be collected across banks
and organised into different risk profiles,
so as to build transparency and trust with
healthier banks and other intermediaries
with an interest in purchasing them. Such
4 The part of the speech that follows builds and expands upon the section on Bank Resolution in my speech “Some Ways to Decisively Resolve Bank Stressed Assets”, February 21, 2017, delivered at the Indian Banks’ Association Banking Technology Conference, Hotel Trident, Nariman Point, Mumbai.

SPEECH
RBI Bulletin May 2017 7
A Bank Should Be Something One Can “Bank” Upon
asset sales can generate some of the needed
recapitalisation.
3. Mergers: As many have pointed out, it is
not clear we need so many public sector
banks. The system will be better off if they
are consolidated into fewer but healthier
banks. After all, we do have cooperative
banks and micro-finance institutions to
provide community-level banking. So
some banks can be merged, as a quid pro
quo for timely government capital injection
into the combined entity. It would offer
the opportunity to rejig management
responsibility away from those who have
under-performed or dragged their feet the
most. Synergies in lending activity and branch
locations could be identified to economise
on intermediation costs, allowing sales of
real estate where branches are redundant.
Voluntary retirement schemes (VRS) can be
offered to manage head count and usher in
a younger, digitally-savvy talent pool into
these banks. Historically, bank stress of the
order we face has almost always involved
significant bank restructuring.
4. Tough prompt corrective
action: Undercapitalised banks could be
shown some tough love and be subjected to
corrective action, such as the revised Prompt
Corrective Action (PCA) guidelines recently
released by the Reserve Bank of India. Such
action should entail no further growth in
deposit base and lending for the worst-
capitalised banks. This will ensure a gradual
“run-off” of such banks, and encourage
deposit migration away from the weakest
public sector banks to healthier public sector
banks and private sector banks. It is not
rocket science to figure out where the growth
potential in our banking sector lies and
deposit growth should be allowed to reflect
that.
5. Divestments: Undertaking these measures
would improve overall banking sector
health, creating an opportune time for
the government to divest some of its
ownership of the restructured banks, as
it has over time in many other sectors of
the economy. Perhaps re-privatising some
of the nationalised banks is an idea whose
time has come? All this would reduce the
overall amount the government needs to
inject as bank capital and help preserve its
hard-earned fiscal discipline, which along
with stable inflation outlook and the diverse
nature of our growth engine, appears to have
made India the darling of foreign investors at
the present moment. We should grapple this
macroeconomic stability to our shores with
hoops of steel.
Let me conclude
I wish to encourage you to reflect on all this, read
about the current state of Indian banking sector in
newspapers and economic writing, try to make sense
of it from first principles, and ask the question if we
have a banking sector that our economy can bank
upon.
At any rate, I hope that I have provided enough
food for thought for the weekend so when you do
a financial transaction next week – with a bank, a
SPEECH
RBI Bulletin May 20178
A Bank Should Be Something One Can “Bank” Upon
mutual fund, a stock broker, or an insurance company
– you will be tempted to follow the river along which
the money flows in that transaction from its source to
its destination, invariably finding a few banks along
the way!
And if you find the rafting exciting enough,
do apply to the Reserve Bank of India where we
are looking to rebalance our gender distribution of
personnel that has gone a bit askew. We are ready to
have in our workforce dedicated women such as all
of you. Thank you.
Articles
Finances of Non-Government Non-Financial Public Limited Companies, 2015-16
Performance of Non-Government Non-Banking Financial and Investment Companies, 2015-16
Union Budget 2017-18: An Assessment


article
RBI Bulletin May 2017 9
Finances of Non-Government Non-Financial Public Limited Companies, 2015-16
The 19,602 companies covered in the latest data release
accounted for 39.9 per cent of the population’s paid-
up capital (PUC) of all NGNF public limited companies
as on March 31, 2016.
1. Corporate Profitability Improved Despite Slower
Sales Growth
1.1. Sales growth of the select companies continued
to decelerate during 2015-16, mainly due to subdued
rural demand. However, the companies benefitted
from lower cost of raw materials, power and fuel
resulting in contraction of operating expenses.
Accordingly, the growth of operating profits was
higher. Magnitude of recovery in corporate earnings
in terms of net profit growth was muted (Statement 1
and Chart 1).
1.2. The aggregate picture was marked by unevenness.
While the companies in all size classes experienced
lower sales growth, only the large companies (sales
more than `10 billion) recorded higher operating
profits growth, aided by sharper contraction in
The aggregate results of the select non-government non-financial public limited companies revealed that profitability of the companies shored up by soft raw material and power and fuel costs despite tepid sales growth. Smaller companies, however, could not benefit much. Debt to equity ratio at the aggregate level was contained. Some improvement in fixed capital investment was observed.
This article presents the financial performance of
select 19,602 non-government non-financial (NGNF)
public limited companies for the financial year 2015-
16 based on their audited annual accounts during
April 2015 to March 2016, along with comparable data
from the period from 2013-14 to 2014-15. The data
are available on the Reserve Bank’s website at https://dbie.rbi.org.in/DBIE/dbie.rbi?site=statistics#!2_44
* Prepared in the Company Finances Division (CFD) of the Department of Statistics and Information Management, Reserve Bank of India. Reference may be made to the May 2016 issue of the RBI Bulletin for the previous year study.
Finances of Non-Government Non-Financial Public Limited Companies, 2015-16*
article
RBI Bulletin May 201710
Finances of Non-Government Non-Financial Public Limited Companies, 2015-16
operating expenditure. Performance of the small
companies’ (sales less than `1 billion) in terms of
operating and net profit growth worsened in 2015-
16. Medium sized companies (with sales between
`1 billion to `10 billion) witnessed moderation in
operating profits growth (Statement 1).
1.3. For companies in the mining sector, sales
contracted for the second consecutive year, but its
magnitude was lower in 2015-16. However, operating
(and net) profits of these companies declined sharply.
Continued poor performance of companies in textile
and iron and steel industries pulled down the sales
growth of manufacturing sector as a whole. In contrast,
motor vehicles and other transport equipment
industry in the manufacturing sector recorded pickup
in sales. In respect of operating profits, the sector
did well barring iron and steel industry. Lacklustre
demand and stalled projects impacted the sales growth
of construction sector companies’ and their operating
profits growth plummeted in 2015-16. Services sector
companies suffered moderation in both sales growth
and operating profits growth.
1.4. One favourable development from the
perspective of the corporate sector was that it could
retain the pricing power (operating profit margin)
despite weak demand conditions. Large companies
had an edge over small companies in terms of better
pricing power. Manufacturing and services sectors
witnessed steadily improving pricing power along
with better return on equity.
2. Companies Faced Higher Wage Cost Pressure
2.1. Despite a contraction in total operating expenses,
staff cost of the select companies recorded 11.5 per
cent growth and was higher than the sales growth.
As a result, the share of staff cost in total sales rose
sharply by 80 basis points (bps) in 2015-16 on top of
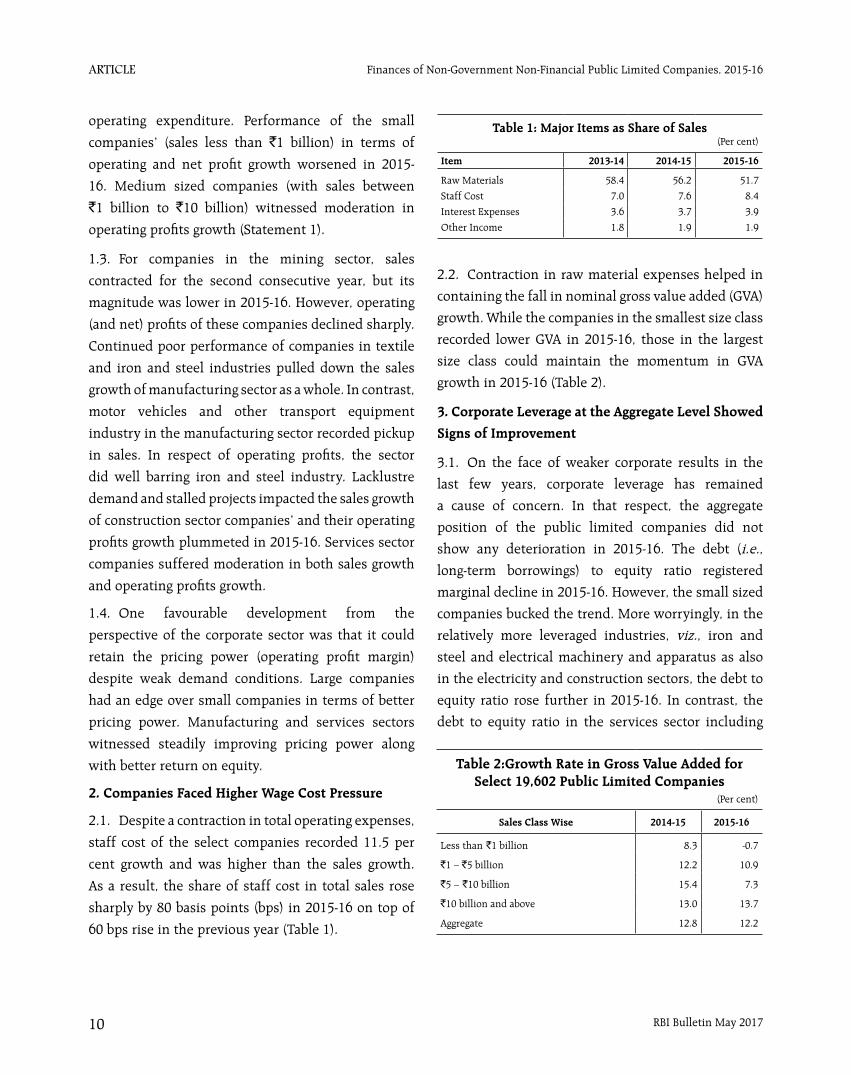
60 bps rise in the previous year (Table 1).
Table 1: Major Items as Share of Sales(Per cent)
Item 2013-14 2014-15 2015-16
Raw Materials 58.4 56.2 51.7
Staff Cost 7.0 7.6 8.4
Interest Expenses 3.6 3.7 3.9
Other Income 1.8 1.9 1.9
2.2. Contraction in raw material expenses helped in
containing the fall in nominal gross value added (GVA)
growth. While the companies in the smallest size class
recorded lower GVA in 2015-16, those in the largest
size class could maintain the momentum in GVA
growth in 2015-16 (Table 2).
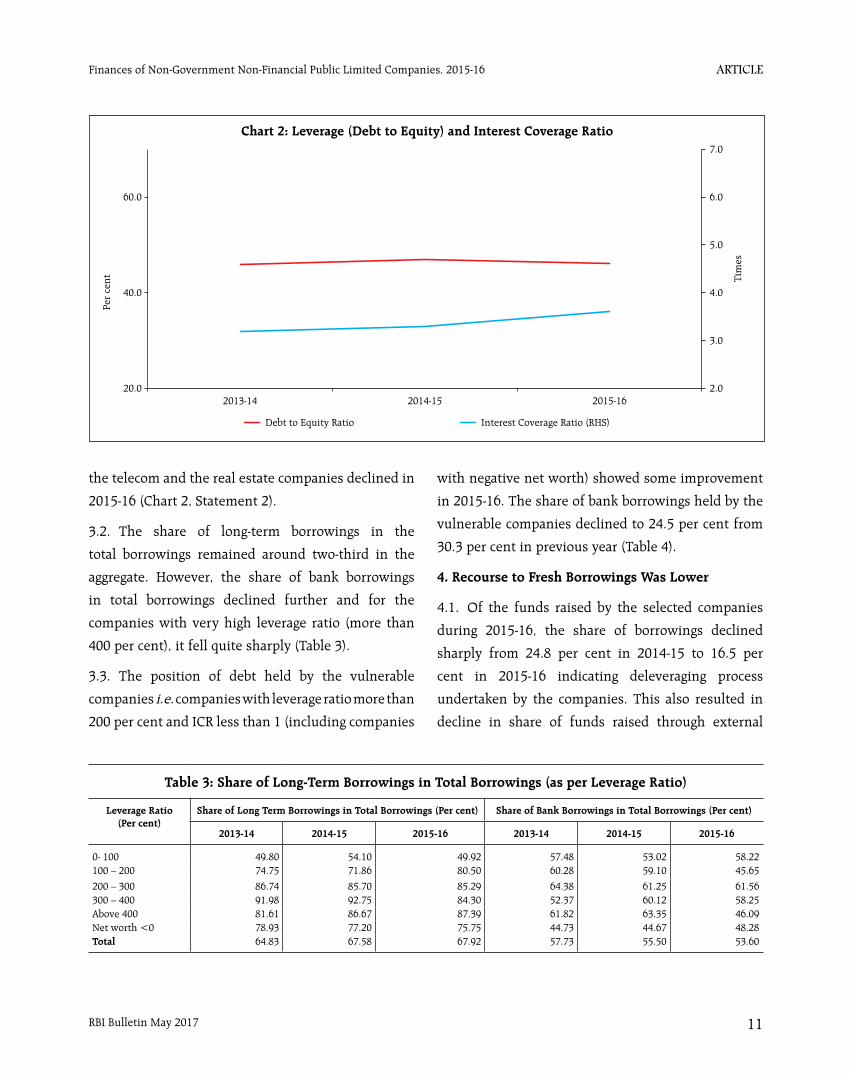
3. Corporate Leverage at the Aggregate Level Showed
Signs of Improvement
3.1. On the face of weaker corporate results in the
last few years, corporate leverage has remained
a cause of concern. In that respect, the aggregate
position of the public limited companies did not
show any deterioration in 2015-16. The debt (i.e., long-term borrowings) to equity ratio registered
marginal decline in 2015-16. However, the small sized
companies bucked the trend. More worryingly, in the
relatively more leveraged industries, viz., iron and
steel and electrical machinery and apparatus as also
in the electricity and construction sectors, the debt to
equity ratio rose further in 2015-16. In contrast, the
debt to equity ratio in the services sector including
Table 2:Growth Rate in Gross Value Added for Select 19,602 Public Limited Companies
(Per cent)
Sales Class Wise 2014-15 2015-16
Less than `1 billion 8.3 -0.7
`1 – `5 billion 12.2 10.9
`5 – `10 billion 15.4 7.3
`10 billion and above 13.0 13.7
Aggregate 12.8 12.2
article
RBI Bulletin May 2017 11
Finances of Non-Government Non-Financial Public Limited Companies, 2015-16
the telecom and the real estate companies declined in
2015-16 (Chart 2, Statement 2).
3.2. The share of long-term borrowings in the
total borrowings remained around two-third in the
aggregate. However, the share of bank borrowings
in total borrowings declined further and for the
companies with very high leverage ratio (more than
400 per cent), it fell quite sharply (Table 3).
3.3. The position of debt held by the vulnerable
companies i.e. companies with leverage ratio more than
200 per cent and ICR less than 1 (including companies
with negative net worth) showed some improvement
in 2015-16. The share of bank borrowings held by the
vulnerable companies declined to 24.5 per cent from
30.3 per cent in previous year (Table 4).
4. Recourse to Fresh Borrowings Was Lower
4.1. Of the funds raised by the selected companies
during 2015-16, the share of borrowings declined
sharply from 24.8 per cent in 2014-15 to 16.5 per
cent in 2015-16 indicating deleveraging process
undertaken by the companies. This also resulted in
decline in share of funds raised through external
Table 3: Share of Long-Term Borrowings in Total Borrowings (as per Leverage Ratio)
Leverage Ratio (Per cent)
Share of Long Term Borrowings in Total Borrowings (Per cent) Share of Bank Borrowings in Total Borrowings (Per cent)
2013-14 2014-15 2015-16 2013-14 2014-15 2015-16
0- 100 49.80 54.10 49.92 57.48 53.02 58.22100 – 200 74.75 71.86 80.50 60.28 59.10 45.65
200 – 300 86.74 85.70 85.29 64.38 61.25 61.56300 – 400 91.98 92.75 84.30 52.37 60.12 58.25Above 400 81.61 86.67 87.39 61.82 63.35 46.09Net worth <0 78.93 77.20 75.75 44.73 44.67 48.28Total 64.83 67.58 67.92 57.73 55.50 53.60

article
RBI Bulletin May 201712
Finances of Non-Government Non-Financial Public Limited Companies, 2015-16
sources. Accretion from internal sources, in the form of provisions (including depreciation provision) and reserves and surplus, was the major source of funds in 2015-16 (Statement 4A, Chart 3).
4.2. Reversing the trend observed during 2014-15, more than three-fourth of the fund garnered during 2015-16 was used in fixed assets formation by the selected companies. It can be seen as an early indicator of improved business sentiment (Statement 4B,
Chart 4).
Table 4: Share of Bank Borrowings Held by Vulnerable Companies
(per cent)
Year Number of Vulnerable
Companies*
Share of Debt of Vulnerable Companies in
19,602 Companies’ Debt
Share of Bank Borrowings of
Vulnerable Companies in 19,602 Companies’
Bank Borrowings
2013-14 1729 33.9 26.62014-15 1723 35.9 30.32015-16 1777 31.2 24.5
* includes companies with negative net worth
Chart 3: Pattern of Sources of Funds
22.323.8
3.9
26.9
-2.1
9.9
15.4
10.8
20.522.7
12.1
4.4 3.8
25.8
Share Capital R serves andeSurplus
Provisions Long TermBorrowings
Short TermBorrowings
Trade Payables Other Liabilities-10
0
10
20
30
Per
cent
2014-15 2015-16
Chart 4: Pattern of Uses of Funds
47.5
7.611.6 11.8
8.1
30.9
-17.7
78.7
1.8 1.9 2.5 0.3
11.3
3.4
-20
0
20
40
60
80
Gross Fixed Assets Non-currentInvestments
CurrentInvestments
Loans andAdvances
Inventories Cash and CashEquivalents
Others (includingtrade receivables)
2014-15 2015-16
Per
cent

article
RBI Bulletin May 2017 13
Finances of Non-Government Non-Financial Public Limited Companies, 2015-16
5. Conclusion
The aggregate results of the select NGNF public limited
companies in 2015-16 revealed that despite slower
sales growth, downturn in the commodity price cycle
helped the sector in maintaining the nominal GVA
growth at a comparable level of the previous year.
Higher profit margin signalled better pricing power of
the corporates. There has not been any deceleration
in the leverage position at the aggregate level and
increased fixed capital formation may indicate some
improvement in business conditions.
article
RBI Bulletin May 201714
Finances of Non-Government Non-Financial Public Limited Companies, 2015-16
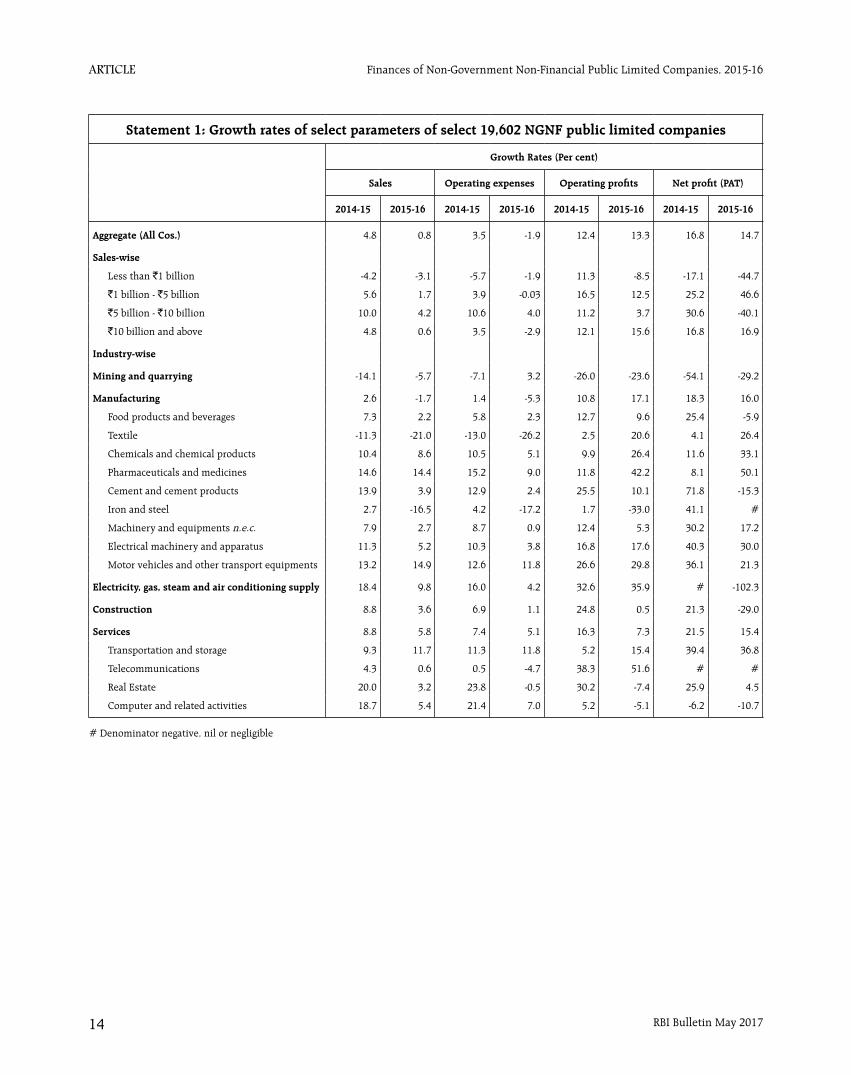
Statement 1: Growth rates of select parameters of select 19,602 NGNF public limited companies
Growth Rates (Per cent)
Sales Operating expenses Operating profits Net profit (PAT)
2014-15 2015-16 2014-15 2015-16 2014-15 2015-16 2014-15 2015-16
Aggregate (All Cos.) 4.8 0.8 3.5 -1.9 12.4 13.3 16.8 14.7
Sales-wise
Less than `1 billion -4.2 -3.1 -5.7 -1.9 11.3 -8.5 -17.1 -44.7
`1 billion - `5 billion 5.6 1.7 3.9 -0.03 16.5 12.5 25.2 46.6
`5 billion - `10 billion 10.0 4.2 10.6 4.0 11.2 3.7 30.6 -40.1
`10 billion and above 4.8 0.6 3.5 -2.9 12.1 15.6 16.8 16.9
Industry-wise
Mining and quarrying -14.1 -5.7 -7.1 3.2 -26.0 -23.6 -54.1 -29.2
Manufacturing 2.6 -1.7 1.4 -5.3 10.8 17.1 18.3 16.0
Food products and beverages 7.3 2.2 5.8 2.3 12.7 9.6 25.4 -5.9
Textile -11.3 -21.0 -13.0 -26.2 2.5 20.6 4.1 26.4
Chemicals and chemical products 10.4 8.6 10.5 5.1 9.9 26.4 11.6 33.1
Pharmaceuticals and medicines 14.6 14.4 15.2 9.0 11.8 42.2 8.1 50.1
Cement and cement products 13.9 3.9 12.9 2.4 25.5 10.1 71.8 -15.3
Iron and steel 2.7 -16.5 4.2 -17.2 1.7 -33.0 41.1 #
Machinery and equipments n.e.c. 7.9 2.7 8.7 0.9 12.4 5.3 30.2 17.2
Electrical machinery and apparatus 11.3 5.2 10.3 3.8 16.8 17.6 40.3 30.0
Motor vehicles and other transport equipments 13.2 14.9 12.6 11.8 26.6 29.8 36.1 21.3
Electricity, gas, steam and air conditioning supply 18.4 9.8 16.0 4.2 32.6 35.9 # -102.3
Construction 8.8 3.6 6.9 1.1 24.8 0.5 21.3 -29.0
Services 8.8 5.8 7.4 5.1 16.3 7.3 21.5 15.4
Transportation and storage 9.3 11.7 11.3 11.8 5.2 15.4 39.4 36.8
Telecommunications 4.3 0.6 0.5 -4.7 38.3 51.6 # #
Real Estate 20.0 3.2 23.8 -0.5 30.2 -7.4 25.9 4.5
Computer and related activities 18.7 5.4 21.4 7.0 5.2 -5.1 -6.2 -10.7
# Denominator negative, nil or negligible

article
RBI Bulletin May 2017 15
Finances of Non-Government Non-Financial Public Limited Companies, 2015-16
Statement 1: Growth rates of select parameters of select 19,602 NGNF public limited companies (Concld.)
Growth Rates (Per cent)
Net worth Total borrowings Total assets
2014-15 2015-16 2014-15 2015-16 2014-15 2015-16
Aggregate (All Cos.) 8.8 8.2 6.8 6.1 8.3 8.5
Sales-wise
Less than `1 billion 3.9 1.9 8.0 11.3 7.2 6.7
`1 billion - `5 billion 7.8 9.6 10.9 8.4 8.4 8.6
`5 billion - `10 billion 11.7 7.1 8.8 4.4 8.4 6.3
`10 billion and above 9.8 9.6 4.8 3.8 8.7 9.2
Industry-wise
Mining and quarrying -3.3 -0.1 -10.3 5.4 -4.0 0.7
Manufacturing 9.6 8.9 1.8 7.1 7.8 9.3
Food products and beverages 7.4 7.4 -1.1 5.7 5.1 4.1
Textile 8.4 10.3 4.4 3.5 7.0 12.3
Chemicals and chemical products 12.5 14.7 6.3 11.3 9.6 10.9
Pharmaceuticals and medicines 19.4 20.8 22.4 3.3 18.3 12.9
Cement and cement products 9.5 7.8 18.6 -3.5 13.1 5.7
Iron and steel 4.6 -10.1 -0.8 3.2 5.0 -2.9
Machinery and equipments n.e.c. 7.0 6.6 0.1 3.8 6.1 2.0
Electrical machinery and apparatus 3.8 6.5 3.8 15.5 4.6 9.2
Motor vehicles and other transport equipments 12.4 12.6 -33.9 -3.1 8.4 13.3
Electricity, gas, steam and air conditioning supply 13.5 4.1 20.2 11.5 15.9 9.2
Construction 10.6 5.1 15.2 15.0 13.5 9.3
Services 6.8 8.9 8.7 -1.7 7.6 7.0
Transportation and storage -1.0 7.2 3.4 -4.0 6.0 9.3
Telecommunications 4.8 5.8 -12.5 -1.9 4.9 14.7
Real Estate 6.6 5.9 8.2 1.5 5.6 2.2
Computer and related activities 0.8 10.3 3.8 1.6 7.1 5.8

article
RBI Bulletin May 201716
Finances of Non-Government Non-Financial Public Limited Companies, 2015-16
Statement 2: Ratios of select parameters of 19,602 NGNF public limited companies
Ratios (Per cent)
Operating profit to sales PAT to net worth Debt to equity
2013-14 2014-15 2015-16 2013-14 2014-15 2015-16 2013-14 2014-15 2015-16
Aggregate (All Cos.) 13.1 14.1 15.8 11.1 11.9 12.6 45.9 46.9 46.2
Sales-wise
Less than `1 billion 10.4 12.1 11.5 1.8 1.5 0.8 57.7 62.3 69.9
`1 billion - `5 billion 10.5 11.6 12.8 4.1 4.8 6.4 61.8 60.3 64.8
`5 billion - `10 billion 11.8 11.9 11.9 5.6 6.5 3.7 57.9 59.2 55.4
`10 billion and above 13.9 14.9 17.1 15.3 16.2 17.3 38.6 39.4 36.6
Industry-wise
Mining and quarrying 37.9 32.7 26.5 21.0 10.0 7.1 7.4 6.5 6.6
Manufacturing 12.5 13.4 16.0 13.6 14.6 15.6 39.6 40.0 39.1
Food products and beverages 8.1 8.5 9.1 18.0 21.0 18.4 49.8 56.2 47.2
Textile 8.7 10.1 15.4 10.0 9.6 11.0 43.3 46.4 43.2
Chemicals and chemical products 15.1 15.0 17.4 16.5 16.4 19.0 23.5 23.6 21.9
Pharmaceuticals and medicines 16.7 16.3 20.3 21.7 19.7 24.4 21.1 23.4 18.5
Cement and cement products 14.0 15.4 16.3 8.4 13.2 10.4 52.1 56.9 47.8
Iron and steel 11.0 10.9 8.7 2.6 3.5 -9.9 76.2 82.5 91.8
Machinery and equipments n.e.c. 12.9 13.5 13.8 11.9 14.5 15.9 19.9 19.5 22.7
Electrical machinery and apparatus 12.8 13.5 15.0 7.7 10.4 12.7 65.8 62.5 72.9
Motor vehicles and other transport equipments 10.9 12.2 13.7 12.6 15.3 16.5 7.6 5.5 4.4
Electricity, gas, steam and air conditioning supply 13.9 15.6 19.3 0.2 0.6 -0.01 117.9 126.3 144.0
Construction 15.7 17.9 17.4 5.0 5.4 3.7 109.0 115.4 124.0
Services 13.8 14.8 15.0 9.1 10.3 10.9 38.9 38.9 35.0
Transportation and storage 15.0 14.4 14.9 5.4 7.6 9.7 77.2 74.1 65.6
Telecommunications 6.1 8.1 12.3 -20.4 -10.2 -11.7 117.0 92.9 88.1
Real Estate 26.0 28.3 25.4 3.8 4.5 4.4 57.0 56.0 52.5
Computer and related activities 18.9 16.7 15.1 18.2 16.9 13.7 11.0 9.0 10.7
article
RBI Bulletin May 2017 17
Finances of Non-Government Non-Financial Public Limited Companies, 2015-16
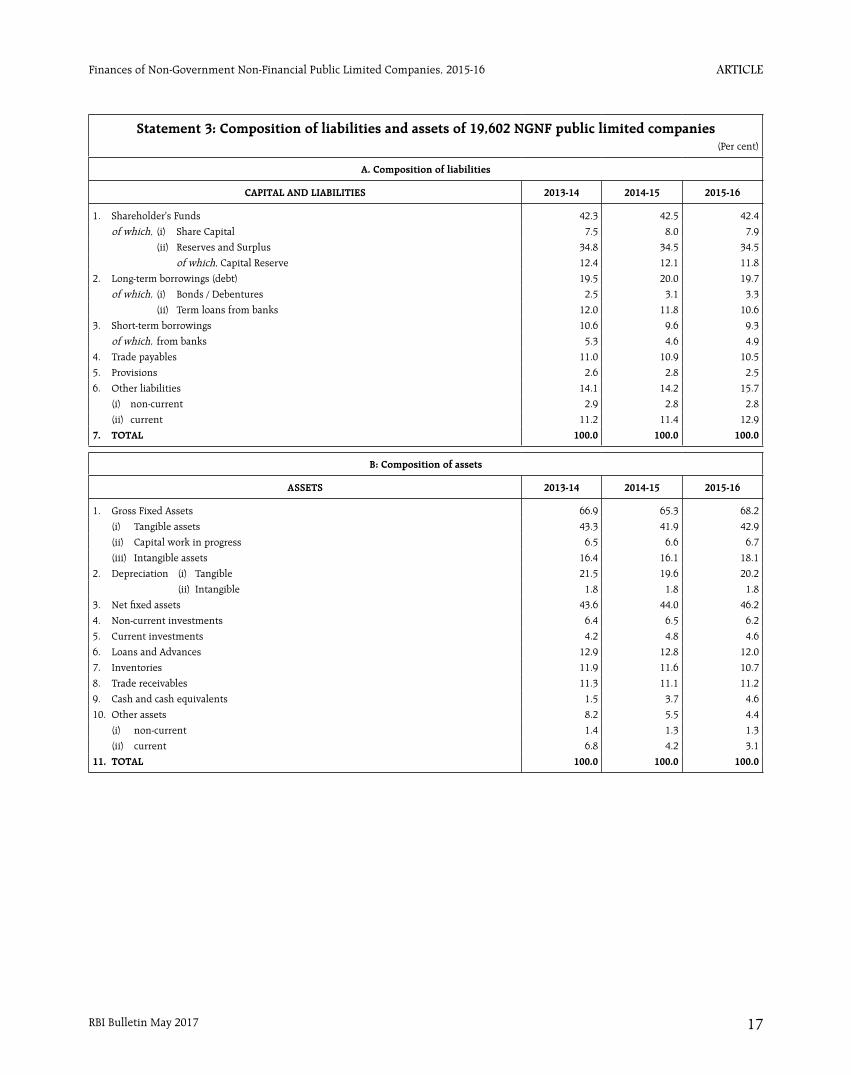
Statement 3: Composition of liabilities and assets of 19,602 NGNF public limited companies (Per cent)
A. Composition of liabilities
CAPITAL AND LIABILITIES 2013-14 2014-15 2015-16
1. Shareholder's Funds 42.3 42.5 42.4
of which, (i) Share Capital 7.5 8.0 7.9
(ii) Reserves and Surplus 34.8 34.5 34.5
of which, Capital Reserve 12.4 12.1 11.8
2. Long-term borrowings (debt) 19.5 20.0 19.7
of which, (i) Bonds / Debentures 2.5 3.1 3.3
(ii) Term loans from banks 12.0 11.8 10.6
3. Short-term borrowings 10.6 9.6 9.3
of which, from banks 5.3 4.6 4.9
4. Trade payables 11.0 10.9 10.5
5. Provisions 2.6 2.8 2.5
6. Other liabilities 14.1 14.2 15.7
(i) non-current 2.9 2.8 2.8
(ii) current 11.2 11.4 12.9
7. TOTAL 100.0 100.0 100.0
B: Composition of assets
ASSETS 2013-14 2014-15 2015-16
1. Gross Fixed Assets 66.9 65.3 68.2
(i) Tangible assets 43.3 41.9 42.9
(ii) Capital work in progress 6.5 6.6 6.7
(iii) Intangible assets 16.4 16.1 18.1
2. Depreciation (i) Tangible 21.5 19.6 20.2
(ii) Intangible 1.8 1.8 1.8
3. Net fixed assets 43.6 44.0 46.2
4. Non-current investments 6.4 6.5 6.2
5. Current investments 4.2 4.8 4.6
6. Loans and Advances 12.9 12.8 12.0
7. Inventories 11.9 11.6 10.7
8. Trade receivables 11.3 11.1 11.2
9. Cash and cash equivalents 1.5 3.7 4.6
10. Other assets 8.2 5.5 4.4
(i) non-current 1.4 1.3 1.3
(ii) current 6.8 4.2 3.1
11. TOTAL 100.0 100.0 100.0
article
RBI Bulletin May 201718
Finances of Non-Government Non-Financial Public Limited Companies, 2015-16
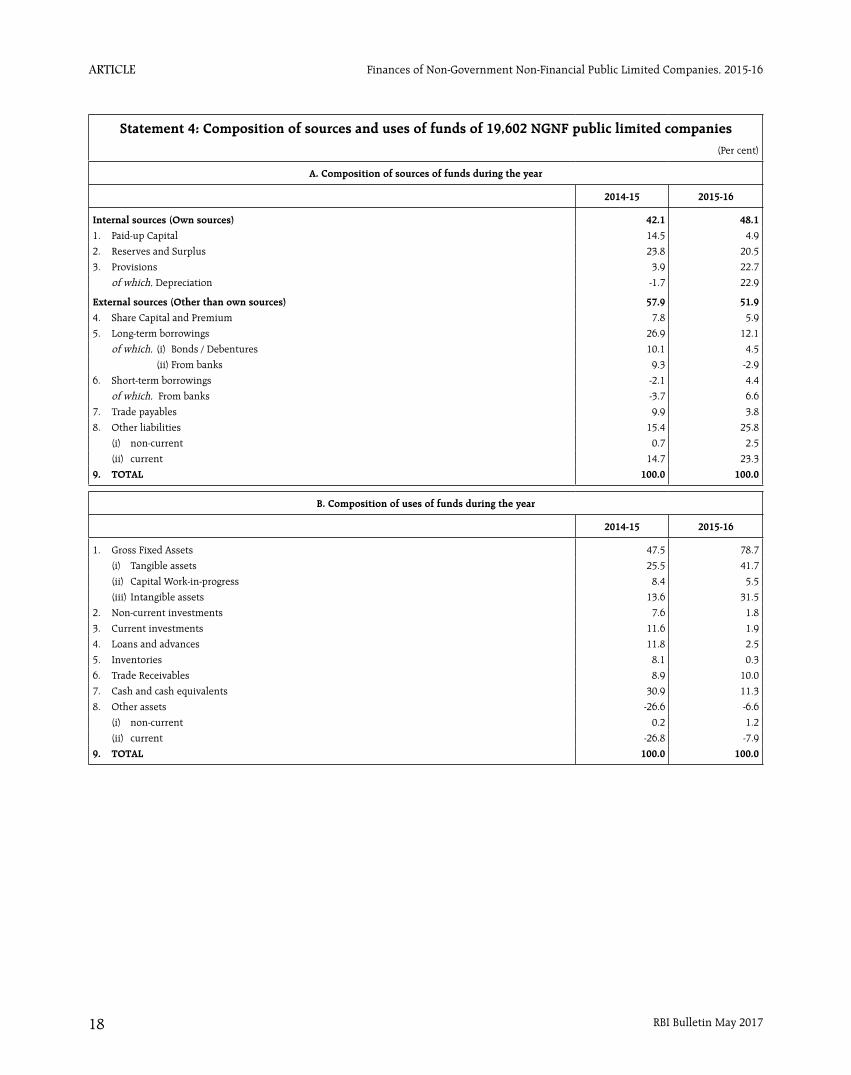
Statement 4: Composition of sources and uses of funds of 19,602 NGNF public limited companies (Per cent)
A. Composition of sources of funds during the year
2014-15 2015-16
Internal sources (Own sources) 42.1 48.1
1. Paid-up Capital 14.5 4.9
2. Reserves and Surplus 23.8 20.5
3. Provisions 3.9 22.7
of which, Depreciation -1.7 22.9
External sources (Other than own sources) 57.9 51.9
4. Share Capital and Premium 7.8 5.9
5. Long-term borrowings 26.9 12.1
of which, (i) Bonds / Debentures 10.1 4.5
(ii) From banks 9.3 -2.9
6. Short-term borrowings -2.1 4.4
of which, From banks -3.7 6.6
7. Trade payables 9.9 3.8
8. Other liabilities 15.4 25.8
(i) non-current 0.7 2.5
(ii) current 14.7 23.3
9. TOTAL 100.0 100.0
B. Composition of uses of funds during the year
2014-15 2015-16
1. Gross Fixed Assets 47.5 78.7
(i) Tangible assets 25.5 41.7
(ii) Capital Work-in-progress 8.4 5.5
(iii) Intangible assets 13.6 31.5
2. Non-current investments 7.6 1.8
3. Current investments 11.6 1.9
4. Loans and advances 11.8 2.5
5. Inventories 8.1 0.3
6. Trade Receivables 8.9 10.0
7. Cash and cash equivalents 30.9 11.3
8. Other assets -26.6 -6.6
(i) non-current 0.2 1.2
(ii) current -26.8 -7.9
9. TOTAL 100.0 100.0

article
RBI Bulletin May 2017 19
Performance of Non-Government Non-Banking Financial and Investment Companies, 2015-16
sources. A comparative picture on performance of these companies during the last three-year period i.e., from 2013-14 to 2015-16 has been assessed in this article. The detailed data for select 21,186 companies along with explanatory notes have been made available in the Data Release section of the Reserve Bank of India website in March 2017. As per provisional estimate of population paid-up capital (PUC) supplied by Ministry of Corporate Affairs (MCA), Government of India (GoI), the select 21,186 NGNBF&I companies accounted for 74.9 per cent of total PUC of all NGNBF&I as on March 31, 2016.
Identification of NGNBF&I companies were based on National Industrial Classification (NIC) 2004 code and they were further classified into five major activity groups, viz., (1) Share Trading and Investment Holding, (2) Loan Finance, (3) Asset Finance, (4) Diversified and (5) Miscellaneous(including Chit Fund and Mutual Fund companies). In terms of PUC and financial income, the composition of select 21,186 NGNBF&I companies showed that “Loan Finance” has the largest share followed by “Share Trading and Investment Holding” and “Asset Finance” companies (Table 1).
1. Growth Rates: Gross Value Added improved significantly
1.1 The gross value added (GVA) of NGNBF&I companies witnessed a higher growth of 19.8 per cent in 2015-16 as against 15.8 per cent registered in 2014-15. The improvement in GVA was mainly on account of higher growth in the financial income as compared to total expenditure during 2015-16. Among the activity groups, “Loan Finance”, “Asset Finance” and “Miscellaneous” companies, witnessed increase in GVA during 2015-16 as compared with the previous year (Chart 1 and Statement 1).
1.2 Financial income recorded a growth of 18.7 per cent in 2015-16 as against 17.1 per cent in 2014-15.This growth in financial income was mainly driven by higher dividend income during the year (Chart 1 and
Statement 1).
An analysis of the financial performance of select 21,186 non-government non-banking financial and investment companies (NGNBF&I) for the year 2015-16 showed that their overall performance improved, with growth at an accelerated pace and a distinct improvement in operating profit margin as well as in the return of equity. However, their liquidity position deteriorated and both leverage ratio and bad debts to expected receivables ratio rose from their levels a year ago.
This article presents an analysis of the performance of non-government non-banking financial and investment (NGNBF&I) companies (excluding insurance and banking companies) for the financial year 2015-16, based on the audited annual accounts of 21,186 companies which closed their accounts during the period April 2015 to March 2016. Of these, data pertaining to 20,655 companies are based on Ministry of Corporate Affairs (MCA)1 systems, data for 361 companies are as collated by Department of Statistics and Information Management (DSIM) from Department of Non-Banking Supervision (DNBS), Regional Offices of Reserve Bank of India, while the data for the remaining 170 companies are obtained from other
* Prepared in the Company Finances Division (CFD) of the Department of Statistics and Information Management, Reserve Bank of India. The previous article was published in May 2016 issue of the Reserve Bank of India Bulletin, which covered 23,293 non-government non-banking financial and investment companies during 2014-15.
1 The CFD has been receiving corporate data from MCA, which collects corporate sector statistics, i.e., annual balance sheet and profit and loss accounts data, through two mutually exclusive systems viz., Extensible Business Reporting language (XBRL) and Form AOC-4 (Non-XBRL) platform. Under XBRL based system, corporate with PUC ̀ 5 crore and above or having turnover `100 crore and above or listed companies submit their complete annual accounts, whereas through ‘Form AOC-4 system, data on select variables from annual accounts of remaining companies are submitted.
Performance of Non-Government Non-Banking Financial and Investment Companies, 2015-16*

article
RBI Bulletin May 201720
Performance of Non-Government Non-Banking Financial and Investment Companies, 2015-16
1.3 Total expenditure, on the other hand, grew at a lower rate as compared to total income, resulting in higher operating profits (EBDT) growth of 22.3 per cent in 2015-16 as against 13.3 per cent in 2014-15. Significant drop in the growth rate of employee’s remuneration was also seen in 2015-16 (Chart 1).
1.4 The growth in net profits had slowed down to 12.5 per cent in 2015-16 from 21.0 per cent in 2014-15 due to significant growth in the tax provision during 2015-16 (Statement 1).
1.5 The growth rate of total borrowings rose to 21.9 per cent in 2015-16 from 20.2 per cent in 2014-15.
However, the growth in borrowings from banks had decelerated to 19.6 per cent in 2015-16 from 26.5 per cent in the previous year. It was also observed that the growth in investments (short and long term investments together) had dropped to 3.7 per cent in 2015-16 from 7.5 per cent witnessed in the preceding year (Statement 1).
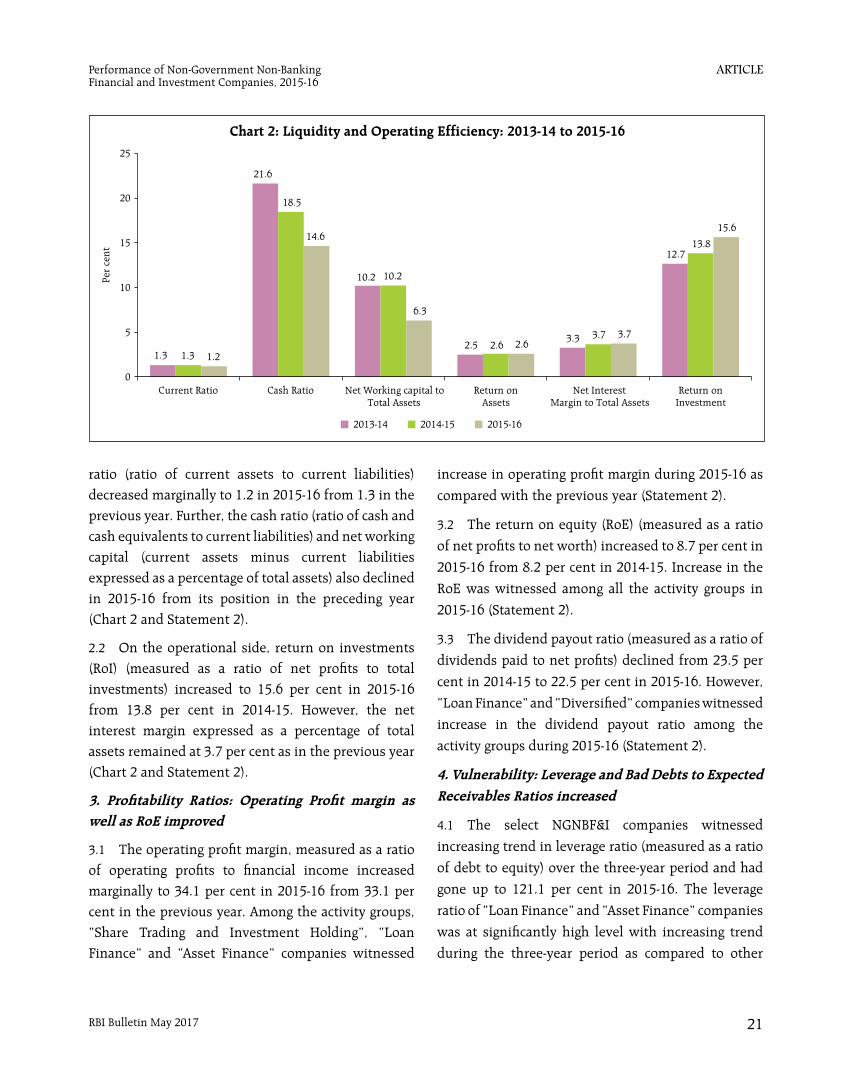
2. Liquidity Position and Operating Efficiency: Net Working Capital decline, while Return on Investments Improved
2.1 The liquidity position of the companies to meet its short-term obligations as measured by the current
Table 1: Composition of Select 21,186 Companies by Activity Group – 2015-16 (Per cent)
Activity No. of Companies Paid-up Capital Financial Income Total Net Assets
Share Trading and Investment Holding 43.8 28.0 11.4 12.1
Loan Finance 11.3 31.9 42.1 37.1
Asset Finance 19.1 27.0 31.7 37.5
Diversified 4.4 1.4 0.6 0.6
Miscellaneous 21.5 11.8 14.2 12.8
Of which: Chit Fund/Kuri and Mutual Fund including UTI 8.2 1.0 1.6 1.0
All Activities 100.0 (21,186)
100.0 (976,884)
100.0 (1,517,515)
100.0 (13,855,640)
Note: Figures in parentheses represents total under respective column. The amounts are in ` million.
article
RBI Bulletin May 2017 21
Performance of Non-Government Non-Banking Financial and Investment Companies, 2015-16
ratio (ratio of current assets to current liabilities) decreased marginally to 1.2 in 2015-16 from 1.3 in the previous year. Further, the cash ratio (ratio of cash and cash equivalents to current liabilities) and net working capital (current assets minus current liabilities expressed as a percentage of total assets) also declined in 2015-16 from its position in the preceding year (Chart 2 and Statement 2).
2.2 On the operational side, return on investments (RoI) (measured as a ratio of net profits to total investments) increased to 15.6 per cent in 2015-16 from 13.8 per cent in 2014-15. However, the net interest margin expressed as a percentage of total assets remained at 3.7 per cent as in the previous year (Chart 2 and Statement 2).
3. Profitability Ratios: Operating Profit margin as well as RoE improved
3.1 The operating profit margin, measured as a ratio of operating profits to financial income increased marginally to 34.1 per cent in 2015-16 from 33.1 per cent in the previous year. Among the activity groups, “Share Trading and Investment Holding”, “Loan Finance” and “Asset Finance” companies witnessed
increase in operating profit margin during 2015-16 as
compared with the previous year (Statement 2).
3.2 The return on equity (RoE) (measured as a ratio
of net profits to net worth) increased to 8.7 per cent in
2015-16 from 8.2 per cent in 2014-15. Increase in the
RoE was witnessed among all the activity groups in
2015-16 (Statement 2).
3.3 The dividend payout ratio (measured as a ratio of
dividends paid to net profits) declined from 23.5 per
cent in 2014-15 to 22.5 per cent in 2015-16. However,
“Loan Finance” and “Diversified” companies witnessed
increase in the dividend payout ratio among the
activity groups during 2015-16 (Statement 2).
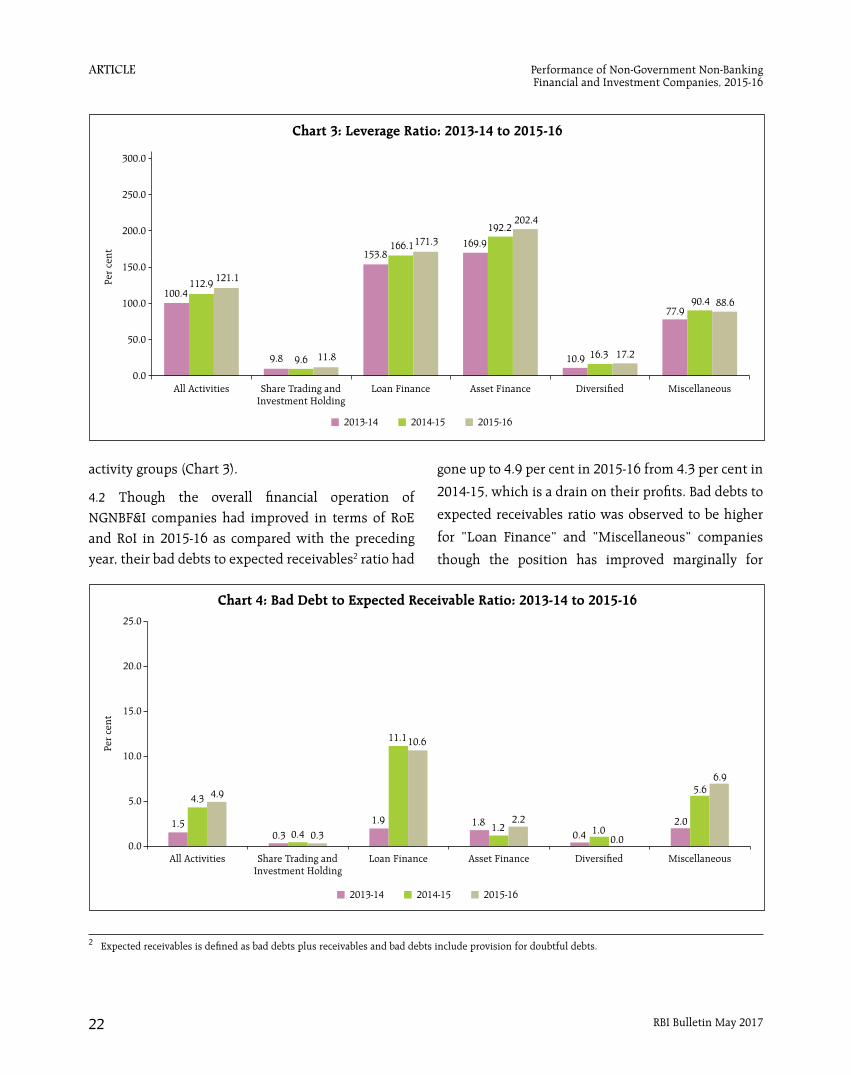
4. Vulnerability: Leverage and Bad Debts to Expected Receivables Ratios increased
4.1 The select NGNBF&I companies witnessed
increasing trend in leverage ratio (measured as a ratio
of debt to equity) over the three-year period and had
gone up to 121.1 per cent in 2015-16. The leverage
ratio of “Loan Finance” and “Asset Finance” companies
was at significantly high level with increasing trend
during the three-year period as compared to other
1.3
21.6
10.2
2.53.3
12.7
1.3
18.5
10.2
2.63.7
13.8
1.2
14.6
6.3
2.63.7
15.6
0
5
10
15
20
25
Current Ratio Cash Ratio Net Working capital toTotal Assets
Return onAssets
Net InterestMargin to Total Assets
Return onInvestment
Per
cent
2013-14 2014-15 2015-16
article
RBI Bulletin May 201722
Performance of Non-Government Non-Banking Financial and Investment Companies, 2015-16
activity groups (Chart 3).
4.2 Though the overall financial operation of NGNBF&I companies had improved in terms of RoE and RoI in 2015-16 as compared with the preceding year, their bad debts to expected receivables2 ratio had
gone up to 4.9 per cent in 2015-16 from 4.3 per cent in
2014-15, which is a drain on their profits. Bad debts to
expected receivables ratio was observed to be higher
for “Loan Finance” and “Miscellaneous” companies
though the position has improved marginally for
2 Expected receivables is defined as bad debts plus receivables and bad debts include provision for doubtful debts.
article
RBI Bulletin May 2017 23
Performance of Non-Government Non-Banking Financial and Investment Companies, 2015-16
“Loan Finance” companies (Chart 4 and Statement 2).
5. Income and Expenditure: Share of Interest Income in Total Income as well as share of Interest Expenses in Total Expenditure increased
5.1 The fund based income continued to play a
dominant role in generating income for NGNBF&I
companies as compared to the fee-based income. The
share of interest income, which is the main source of
fund-based income for NGNBF&I companies in the
total income increased to 66.5 per cent during 2015-16
from 65.5 per cent in the previous year. This increase
in share of interest income during 2015-16 was
observed for “Loan Finance”, “Diversified” and
“Miscellaneous” companies (Statement 3).
5.2 On the expenditure side, the share of interest
expenses in the total expenditure increased marginally
to 48.6 per cent in 2015-16 from 48.1 per cent in 2014-
15. However, the shares of employees benefit expenses
(Salaries, Wages and Bonus plus Provident Fund plus Employees Welfare Expenses) in the total expenditure
declined during 2015-16 mainly contributed by the
declined in the salaries, wages and bonus. The decline in the share of salaries, wages and bonus was witnessed for “Loan Finance”, “Diversified” and “Miscellaneous” companies (Statement 3).
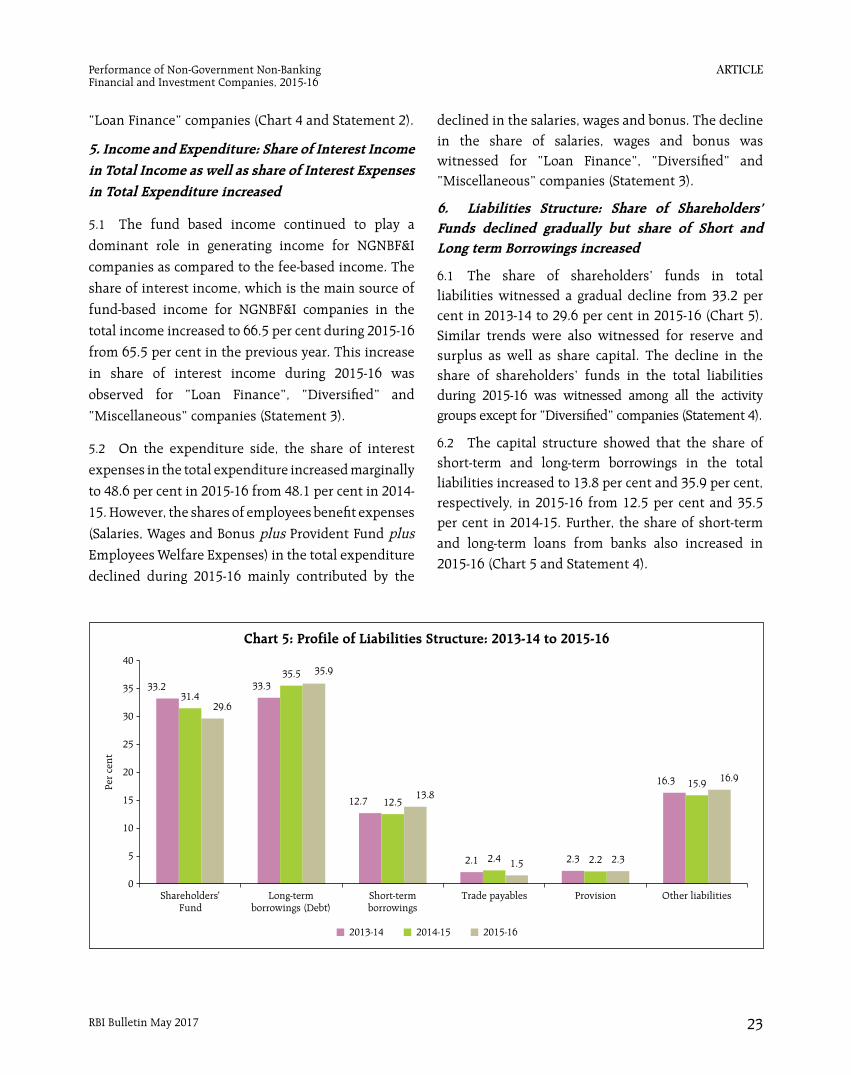
6. Liabilities Structure: Share of Shareholders’ Funds declined gradually but share of Short and Long term Borrowings increased
6.1 The share of shareholders’ funds in total liabilities witnessed a gradual decline from 33.2 per cent in 2013-14 to 29.6 per cent in 2015-16 (Chart 5). Similar trends were also witnessed for reserve and surplus as well as share capital. The decline in the share of shareholders’ funds in the total liabilities during 2015-16 was witnessed among all the activity groups except for “Diversified” companies (Statement 4).
6.2 The capital structure showed that the share of short-term and long-term borrowings in the total liabilities increased to 13.8 per cent and 35.9 per cent, respectively, in 2015-16 from 12.5 per cent and 35.5 per cent in 2014-15. Further, the share of short-term and long-term loans from banks also increased in 2015-16 (Chart 5 and Statement 4).

article
RBI Bulletin May 201724
Performance of Non-Government Non-Banking Financial and Investment Companies, 2015-16
6.3 An increase in the share of short-term and long-term borrowings in the total liabilities was seen among all activity groups, except for “Diversified” companies, which experienced decline in 2015-16. For “Share Trading and Investment Holding” and “Asset Finance” companies, the share of both short-term and long-term borrowings increased during 2015-16 (Statement 4).
7. Assets Pattern: Share of Long-term Loans and Advances increased while that of Investments in Total Assets declined
7.1 The composition of assets for the select NGNBF&I companies showed that total loans and advances (inclusive of both short and long-term loans and advances) constituted more than 60.0 per cent of the total assets. The share of total loans and advances in the total assets had gone up to 65.7 per cent during 2015-16 from 61.9 per cent in 2014-15. This increase in the share of total loans and advances extended by these companies was mainly on account of increased in long-term loans and advances. The share of long-term loans and advances in the total assets increased to 43.0 per cent in 2015-16 from 39.0 per cent in 2014-15, while that of short-term loans and advances
declined marginally. The increase in the share of long-term loans and advances in the total assets was seen among all the activity groups during 2015-16 (Chart 6 and Statement 5).
7.2 The share of both current and non-current investments in the total assets declined to 2.6 per cent and 13.9 per cent, respectively, in 2015-16 from 3.4 per cent and 15.4 per cent in 2014-15. This decline in the share of both current and non-current investments in the total assets was witnessed among all the activity groups, except for “Share Trading and Investment Holding” and “Diversified”, which experienced increased in current investments during 2015-16 as compared with the previous year (Chart 6 and Statement 5).
7.3 Further, the share of cash and cash equivalents in the total assets declined gradually from 6.7 per cent in 2013-14 to 4.7 per cent in 2015-16 (Chart 6).
8. Sources of Funds: Share of Funds raised through Debt Finance in Total Sources of Funds increased
8.1 With larger role of short-term and long-term borrowings in the liabilities structure of NGNBF&I companies (covering more than 50.0 per cent in total

article
RBI Bulletin May 2017 25
Performance of Non-Government Non-Banking Financial and Investment Companies, 2015-16
liabilities), the external sources continued to play a major role in expanding the business. The share of funds mobilised through external sources in the total sources of funds increased to 88.0 per cent in 2015-16 as against 86.8 per cent recorded in 2014-15. The increase in the share of external sources of funds in the total sources of funds was observed for “Share Trading and Investment Holding” and “Loan Finance” companies (Statement 6).
8.2 The funds raised through short-term borrowings increased to 21.2 per cent in 2015-16 from 11.2 per cent in the previous year. While the share of funds mobilised from long-term borrowings in the total sources of funds declined to 37.9 per cent in 2015-16 from 49.2 per cent witnessed in 2014-15. The share of fund raised through term loans from banks (short and long term loans together) in the total sources of funds declined to 21.7 per cent in 2015-16 from 30.9 per cent in the previous year, mainly on account of declined in the funds raised through long-term loans from banks (Statement 6).
8.3 The share of internal sources of funds in total sources of funds declined marginally to 12.0 per cent in 2015-16 from 13.2 per cent in the previous year, which was largely contributed by the decrease in the share of reserve and surplus and paid-up capital during 2015-16. The decrease in the share of internal sources of funds in total sources of funds was observed for “Share Trading and Investment Holding” and “Loan Finance” companies among the activity groups (Statement 6).
9. Uses of Funds: Loans financing and Non-Current Investment pick-up in business activity
9.1 The short-term and long-term loans and advances constituted more than 85.0 per cent in the total uses of funds. The share of short-term and long-term loans and advances extended by the NGNBF&I companies in the total uses of funds increased to 21.8 per cent and 65.4 per cent, respectively, in 2015-16 from 20.7 per cent and 52.8 per cent recorded in 2014-15. Further,
the share of non-current investments in total uses of funds improved to 5.4 per cent in 2015-16 from 4.9 per cent in 2014-15 (Statement 7).
9.2 An increase in the share of long-term loans and advances in the total uses of funds during 2015-16 was witnessed among all the activity groups, except for “Asset Finance” companies. While, the share of non-current investments in the total uses of funds improved for “Loan Finance” and “Asset Finance” companies during 2015-16 as compared with the previous year (Statement 7).
10. Performance of Chit Fund and Mutual Fund Companies: Operating Profit margin, RoA and RoE declined
10.1 In contrast to the overall financial performance observed for the select NGNBF&I companies at aggregate level, the financial income for select 1,730 Chit Fund and Mutual Fund companies grew at a marginal rate of 0.5 per cent during 2015-16 as against 10.3 per cent registered in the previous year (Table 2).
10.2 The total expenditure of the Chit Fund and Mutual Fund companies increased by 4.4 per cent in 2015-16 as compared to 7.0 per cent in 2014-15. As a result of lower growth in the total income as compared with total expenditure, the operating profits of select Chit Fund and Mutual Fund companies decelerated by 17.7 per cent in 2015-16 as compared to 28.4 per cent growth witnessed in the preceding year. Further, the net profits of select Chit Fund and Mutual Fund companies also decelerated by 12.7 per cent in 2015-16 (Table 2).
10.3 In contrast to the increasing trend at aggregate level of the NGNBF&I companies, the leverage ratio (debt to equity ratio) of Chit Fund and Mutual Fund companies declined to 43.1 per cent in 2015-16 from 44.6 per cent in the previous year. Further, the deceleration in the operating profits and net profits led to decline in the operating profit margin, RoA and RoE of the Chit Fund and Mutual Fund companies

article
RBI Bulletin May 201726
Performance of Non-Government Non-Banking Financial and Investment Companies, 2015-16
during 2015-16, after witnessing an improvement in
2014-15 (Table 2).
10.4 The share of borrowings in the total net assets
declined to 15.0 per cent in 2015-16 from 16.1 per cent
in 2014-15. Moreover, the share of borrowings from
banks in the total borrowings also had declined to
13.2 per cent in 2015-16 from 17.4 per cent in 2014-15
(Table 2).
11. Concluding Observations
11.1 The aggregate results shows that the overall
performance of the select 21,186 NGNBF&I companies
had improved in 2015-16. The gross value added (GVA)
Table 2: Select Growth Rates and Ratios of Chit and Mutual Fund Companies (1,730)
Per cent
Item 2013-14 2014-15 2015-16
Select Growth Rates1. Financial Income - 10.3 0.5
2. Total Income - 9.0 2.1
3. Total Expenditure - 7.0 4.4
4. Operating Profits (EBDT) - 28.4 -17.7
5. Net Profits - 24.3 -12.7
Select Ratios1. EBDT to Financial Income 16.4 19.1 15.6
2. Debt to Equity 43.2 44.6 43.1
3. Net profits to Total Net Assets 2.1 2.4 2.0
4. Net profits to Net Worth 11.2 12.9 10.6
5. Borrowings to Total Net Assets 17.8 16.1 15.0
6. Bank Borrowings to Total Borrowings 23.7 17.4 13.2
Note: Figures in parentheses represent total number of chit and mutual fund companies.
along with financial income had accelerated in 2015-16 as compared with the preceding year. Total expenditure grew at a lower rate as compared to the total income, leading to significant growth in the operating profits (EBDT) during 2015-16. However, the growth in interest expenses, which constituted major share in the total expenditure had increased marginally in 2015-16 as compared with the previous year.
11.2 Further, the return on investments (RoI) had improved in 2015-16. However, the liquidity position had deteriorated and leverage ratio and bad debts to expected receivables ratio had increased in 2015-16.
11.3 On liabilities side, the shares of both short-term and long-term borrowings in the total liabilities of NGNBF&I companies increased in 2015-16 as compared with the previous year, whereas the share of shareholders’ funds in the total liabilities declined gradually over the three-year period. The share of short-term and long-term loans and advances in the total assets, on the other hand increased in 2015-16.
11.4 The NGNBF&I companies continued to rely mainly on external sources for their business expansion and their share had increased in 2015-16. The share of funds raised through short-term borrowings increased in 2015-16 as compared with the previous year. These companies used their funds predominantly in expanding their non-current investments and both short-term and long-term loans and advances portfolios in 2015-16.

article
RBI Bulletin May 2017 27
Performance of Non-Government Non-Banking Financial and Investment Companies, 2015-16
Statement 1: Growth Rates of the Select Items of the Select 21,186 NGNBF&I Companies : 2014-15 and 2015-16(Per cent)
Item All Activities Share Trading and Investment Holding
Loan Finance
(21,186) (9,269) (2,396)
2014-15 2015-16 2014-15 2015-16 2014-15 2015-16
1. Financial Income 17.1 18.7 25.7 7.7 15.8 22.2
Of which; (a) Interest Received 23.1 19.1 40.2 7.8 17.3 22.2
(b) Dividend Received 5.6 17.1 4.7 55.3 41.7 -27.8
2. Total Income 18.6 17.3 25.9 9.2 17.3 19.9
3. Total Expenditure 19.2 16.6 19.0 6.2 19.9 18.4
4. Interest Payment 17.4 17.7 15.8 23.0 16.0 19.4
5. Employees' Remuneration 22.8 13.3 10.8 8.1 41.9 10.2
6. Depreciation Provision 25.7 5.4 31.5 -11.9 14.6 31.4
7. Operating Profits (EBDT) 13.3 22.3 32.6 7.9 3.9 37.1
8. Gross Value Addition( GVA)$ 15.8 19.8 26.6 7.9 14.8 27.6
9. Tax Provision 17.5 23.2 50.9 0.3 6.6 34.3
10. Net Profits 21.0 12.5 33.1 13.9 14.2 20.4
11. Dividend Paid 12.5 12.6 16.1 4.9 -1.2 53.2
12. Profits Retained 23.6 12.5 43.9 18.5 19.2 11.5
13. Investments 7.5 3.7 7.5 3.9 9.4 3.9
14. Loans and Advances 18.9 25.1 9.2 8.7 22.2 32.8
15. Total Net Assets 15.2 17.8 9.9 4.9 18.1 23.1
16. Borrowings 20.2 21.9 28.0 15.9 22.2 26.4
Of which; from Banks 26.5 19.6 22.8 17.9 14.8 6.4
17. Net Worth 9.1 11.0 6.2 4.2 13.0 17.2
Item Asset Finance Diversified Miscellaneous
(4,039) (922) (4,560)
1. Financial Income 16.3 18.6 22.4 28.8 15.5 18.2
Of which; (a) Interest Received 32.4 15.4 14.3 49.8 13.7 22.4
(b) Dividend Received -27.3 -35.2 -1.6 14.9 -12.5 -33.6
2. Total Income 19.0 16.4 16.7 36.5 15.9 18.1
3. Total Expenditure 20.4 14.8 20.9 37.7 15.5 19.9
4. Interest Payment 20.4 13.9 14.2 41.0 17.6 16.2
5. Employees' Remuneration 16.4 20.5 30.8 20.4 11.6 13.9
6. Depreciation Provision 28.4 0.5 44.9 -8.3 32.6 -3.9
7. Operating Profits (EBDT) 12.2 22.2 30.6 -0.7 14.1 13.1
8. Gross Value Addition( GVA)$ 13.0 21.9 30.7 6.3 13.0 13.4
9. Tax Provision 16.0 26.6 10.7 17.2 26.4 9.5
10. Net Profits 21.3 11.1 35.6 13.7 17.7 0.2
11. Dividend Paid 15.1 -12.7 -28.0 47.4 32.3 10.4
12. Profits Retained 22.7 16.0 36.4 13.4 14.7 -2.1
13. Investments 4.6 4.1 6.9 0.1 8.6 2.0
14. Loans and Advances 15.8 20.8 14.4 9.7 22.7 21.6
15. Total Net Assets 15.1 19.2 11.5 4.3 14.0 13.4
16. Borrowings 18.8 22.2 32.9 -1.6 16.3 8.7
Of which; from Banks 39.0 34.1 27.5 -64.5 26.0 3.3
17. Net Worth 9.2 14.4 4.2 10.2 8.8 7.1
Note: Figures in parentheses below the activity name represents the number of companies.
$ GVA is defined as (Financial Income + Non-Financial Income - Total Expenditure + Salaries, wages,& Bonus + Employee Welfare Expenses + Depreciation)

article
RBI Bulletin May 201728
Performance of Non-Government Non-Banking Financial and Investment Companies, 2015-16
Statement 2: Select Financial Ratios of the Select 21,186 NGNBF&I Companies : 2013-14 to 2015-16(Per cent)
Item All Activities Share Trading and Investment Holding
Loan Finance
(21,186) (9,269) (2,396)
2013-14 2014-15 2015-16 2013-14 2014-15 2015-16 2013-14 2014-15 2015-16
1. Dividends to Net Profits 24.5 23.5 22.5 40.5 35.8 32.3 25.0 22.2 28.3
2. Operating Profits to Financial Income 34.2 33.1 34.1 45.7 48.1 48.2 23.8 21.4 24.0
3. Net profits to Total Net Assets 2.5 2.6 2.6 3.2 3.9 4.3 2.1 2.0 1.9
4. Net profits to Net Worth 7.7 8.2 8.7 4.4 5.5 6.1 8.4 8.3 8.5
5. Debt to Equity 100.4 112.9 121.1 9.8 9.6 11.8 153.8 166.1 171.3
6. Borrowings to Total Net Assets 46.0 48.0 49.7 13.6 15.8 17.5 50.8 52.6 54.0
7. Bank Borrowings to Total Borrowings 39.0 41.0 40.2 24.6 23.6 24.0 46.2 43.4 36.5
8. Current Ratio$ 1.3 1.3 1.2 1.8 1.7 1.8 1.3 1.3 1.1
9. CashRatio@ 21.6 18.5 14.6 45.5 45.0 44.0 19.7 17.8 12.1
10. Net Working capital to Total Assets 10.2 10.2 6.3 15.6 14.5 16.2 10.3 10.1 3.0
11. Net Interest Margin to Total Assets 3.3 3.7 3.7 2.0 2.8 2.7 4.9 4.9 5.0
12. Return on Investments 12.7 13.8 15.6 5.8 7.0 7.9 13.5 13.7 15.9
13. Bad Debt to Expected Receivables 1.5 4.3 4.9 0.3 0.4 0.3 1.9 11.1 10.6
Item Asset Finance Diversified Miscellaneous
(4,039) (922) (4,560)
1. Dividends to Net Profits 18.9 18.6 14.0 1.4 0.9 1.0 19.4 22.7 21.6
2. Operating Profits to Financial Income 46.3 44.7 46.0 33.1 35.3 27.3 27.9 27.5 26.3
3. Net profits to Total Net Assets 2.7 2.7 2.7 2.1 2.0 2.6 2.6 2.6 2.6
4. Net profits to Net Worth 11.0 11.9 12.0 3.1 3.2 4.0 7.3 7.7 8.3
5. Debt to Equity 169.9 192.2 202.4 10.9 16.3 17.2 77.9 90.4 88.6
6. Borrowings to Total Net Assets 56.4 58.1 59.6 21.7 25.9 24.4 40.7 41.6 39.8
7. Bank Borrowings to Total Borrowings 37.5 43.8 48.1 18.7 18.0 6.5 27.3 29.6 28.1
8. Current Ratio$ 1.2 1.2 1.2 1.6 1.5 1.9 1.5 1.5 1.2
9. Cash Ratio@ 14.4 10.4 10.5 18.9 20.9 24.7 32.7 24.0 16.5
10. Net Working capital to Total Assets 5.5 7.2 5.8 14.2 14.5 20.1 17.0 14.4 7.5
11. Net Interest Margin to Total Assets 3.0 3.8 3.7 3.3 3.4 5.0 1.1 1.0 1.2
12. Return on Investments 24.0 26.9 29.9 5.7 5.7 7.9 14.9 15.6 17.6
13. Bad Debt to Expected Receivables 1.8 1.2 2.2 0.4 1.0 - 2.0 5.6 6.9
Note: Figures in brackets below the activity name represents the number of companies in the activity.$ Actual ratio (in times)@ Cash Ratio is defined as a ratio of cash and cash equivalents to current liabilities. - Nil or Negligible

article
RBI Bulletin May 2017 29
Performance of Non-Government Non-Banking Financial and Investment Companies, 2015-16
Statement 3: Composition of Income and Expenditure of Select 21,186 NGNBF&I Companies : 2013-14 to 2015-16
( Per cent)
Items All Activities Share Trading and Investment Holding
Loan Finance
(21,186) (9,269) (2,396)
2013-14 2014-15 2015-16 2013-14 2014-15 2015-16 2013-14 2014-15 2015-16
Income
1. Financial Income$ 99.1 97.9 99.0 96.5 96.3 95.0 97.3 96.0 97.8
A. Fund-based Income 93.0 93.9 94.6 90.1 94.0 91.7 93.7 91.4 92.5
Of which, (a) Interest 63.1 65.5 66.5 34.0 37.8 37.3 81.5 81.5 83.1
(b) Dividends 2.0 1.8 1.8 9.1 7.6 10.8 0.9 1.0 0.6
(c) Net Profit/Loss in Share Dealings 4.3 6.0 5.5 19.8 31.6 27.6 2.5 2.1 3.4
(d) Net Earnings From Hire Purchase Financing
0.9 1.0 0.9 2.5 2.5 1.7 0.2 0.2 0.2
(e) Other Fund-based Income 22.2 19.3 19.6 24.1 14.2 14.0 8.4 6.5 5.2
B. Fee-based Income 6.1 3.9 4.4 6.4 2.4 3.3 3.5 4.6 5.3
Of which, (a) Brokerage 0.1 0.1 0.1 0.4 0.3 0.2 0.2 0.1 0.1
(b) Other Fee-based Income 5.9 3.8 4.3 6.0 2.0 3.0 3.4 4.5 5.2
2. Non-Financial Income 0.6 0.7 0.6 1.5 0.8 0.6 0.5 0.8 0.9
3. Non-Operating Surplus(+)/Deficit(-) 0.2 1.5 0.4 2.0 2.9 4.4 2.2 3.2 1.3
Total Income 100.0 100.0 100.0 100.0 100.0 100.0 100.0 100.0 100.0
Expenditure
1. Interest 48.8 48.1 48.6 20.8 20.3 23.5 58.8 56.9 57.4
2. Salaries, Wages and Bonus 15.9 16.3 15.9 26.6 24.8 25.1 11.1 13.1 12.2
3. Provident Fund 1.0 1.1 1.0 1.5 1.5 1.7 0.6 0.8 0.7
4. Employees Welfare Expenses 0.9 0.9 1.0 1.4 1.1 1.2 0.6 0.6 0.7
5. Bad Debts # 0.6 1.9 2.1 0.3 0.3 0.2 0.5 2.7 2.7
6. Other Expenses 27.5 29.3 27.5 43.8 46.8 44.2 20.8 24.0 20.8
7. Other Provisions (Other than Tax and Depreciation) 3.3 0.3 2.1 1.1 0.2 0.1 6.3 0.6 4.2
8. Depreciation Provision 2.0 2.1 1.9 4.5 4.9 4.1 1.3 1.2 1.4
Total Expenditure 100.0 100.0 100.0 100.0 100.0 100.0 100.0 100.0 100.0
Note: Figures in brackets below the activity name represents the number of companies in the activity.- Nil or Negligible # include provision for doubtful debt$ Financial Income and its sub-components were arrived after recategorising the operating revenue as interest income, dividend income, etc., according to the nature of activities of each company and then adding the corresponding relevant item from other income.
article
RBI Bulletin May 201730
Performance of Non-Government Non-Banking Financial and Investment Companies, 2015-16
Statement 3: Composition of Income and Expenditure of Select 21,186 NGNBF&I Companies : 2013-14 to 2015-16 (Concld.)
( Per cent)
Items Asset Finance Diversified Miscellaneous
(4,039) (922) (4,560)
2013-14 2014-15 2015-16 2013-14 2014-15 2015-16 2013-14 2014-15 2015-16
Income
1. Financial Income$ 105.2 102.8 104.7 94.8 99.4 93.8 94.6 94.3 94.4
A. Fund-based Income 94.6 100.3 101.9 93.7 98.2 92.9 90.0 87.8 88.1
Of which, (a) Interest 63.9 71.1 70.5 62.2 60.9 66.9 33.4 32.8 34.0
(b) Dividends 0.7 0.4 0.2 2.4 2.0 1.7 1.9 1.4 0.8
(c) Net Profit/Loss in Share Dealings 1.8 2.8 2.1 2.6 5.7 3.9 2.2 1.6 0.8
(d) Net Earnings From Hire Purchase Financing
1.0 1.2 1.3 4.9 8.8 2.8 1.0 1.3 1.2
(e) Other Fund-based Income 25.8 23.7 26.6 19.9 19.4 17.3 51.5 50.6 51.2
B. Fee-based Income 10.6 2.5 2.8 1.1 1.2 0.9 4.5 6.5 6.3
Of which, (a) Brokerage - - - - - - 0.2 0.1 0.1
(b) Other Fee-based Income 10.4 2.3 2.6 1.1 1.0 0.9 4.3 6.3 6.2
2. Non-Financial Income 0.2 0.5 0.2 1.7 2.5 0.4 1.0 0.5 0.6
3. Non-Operating Surplus(+)/Deficit(-) -5.4 -3.3 -4.9 3.5 -1.9 5.8 4.4 5.3 5.0
Total Income 100.0 100.0 100.0 100.0 100.0 100.0 100.0 100.0 100.0
Expenditure
1. Interest 50.5 50.6 50.1 31.9 30.1 30.8 34.9 35.5 34.4
2. Salaries, Wages and Bonus 15.6 14.9 15.7 20.7 22.7 19.8 23.8 22.9 21.9
3. Provident Fund 1.1 1.2 1.1 1.6 1.7 1.6 1.5 1.4 1.2
4. Employees Welfare Expenses 1.4 1.3 1.5 0.9 0.7 0.6 1.0 1.1 1.0
5. Bad Debts # 0.7 0.8 1.5 0.3 0.5 - 0.9 2.2 2.4
6. Other Expenses 28.3 28.7 27.9 40.1 38.8 43.6 35.2 34.8 37.4
7. Other Provisions (Other than Tax and Depreciation) 0.1 - - - - - 0.9 - -
8. Depreciation Provision 2.3 2.4 2.1 4.5 5.4 3.6 1.8 2.1 1.7
Total Expenditure 100.0 100.0 100.0 100.0 100.0 100.0 100.0 100.0 100.0
Note: Figures in brackets below the activity name represents the number of companies in the activity.- Nil or Negligible # include provision for doubtful debt$ Financial Income and its sub-components were arrived after recategorising the operating revenue as interest income, dividend income, etc., according to the nature of activities of each company and then adding the corresponding relevant item from other income.
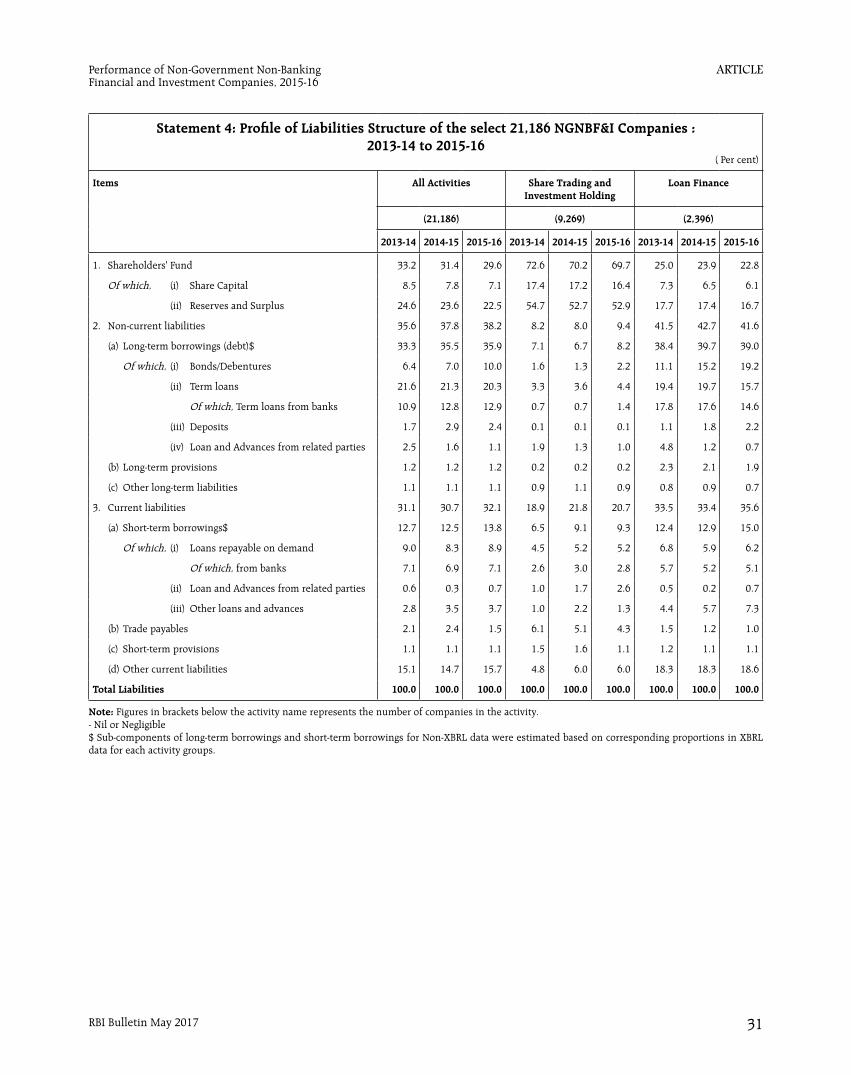
article
RBI Bulletin May 2017 31
Performance of Non-Government Non-Banking Financial and Investment Companies, 2015-16
Statement 4: Profile of Liabilities Structure of the select 21,186 NGNBF&I Companies : 2013-14 to 2015-16
( Per cent)
Items All Activities Share Trading and Investment Holding
Loan Finance
(21,186) (9,269) (2,396)
2013-14 2014-15 2015-16 2013-14 2014-15 2015-16 2013-14 2014-15 2015-16
1. Shareholders' Fund 33.2 31.4 29.6 72.6 70.2 69.7 25.0 23.9 22.8
Of which, (i) Share Capital 8.5 7.8 7.1 17.4 17.2 16.4 7.3 6.5 6.1
(ii) Reserves and Surplus 24.6 23.6 22.5 54.7 52.7 52.9 17.7 17.4 16.7
2. Non-current liabilities 35.6 37.8 38.2 8.2 8.0 9.4 41.5 42.7 41.6
(a) Long-term borrowings (debt)$ 33.3 35.5 35.9 7.1 6.7 8.2 38.4 39.7 39.0
Of which, (i) Bonds/Debentures 6.4 7.0 10.0 1.6 1.3 2.2 11.1 15.2 19.2
(ii) Term loans 21.6 21.3 20.3 3.3 3.6 4.4 19.4 19.7 15.7
Of which, Term loans from banks 10.9 12.8 12.9 0.7 0.7 1.4 17.8 17.6 14.6
(iii) Deposits 1.7 2.9 2.4 0.1 0.1 0.1 1.1 1.8 2.2
(iv) Loan and Advances from related parties 2.5 1.6 1.1 1.9 1.3 1.0 4.8 1.2 0.7
(b) Long-term provisions 1.2 1.2 1.2 0.2 0.2 0.2 2.3 2.1 1.9
(c) Other long-term liabilities 1.1 1.1 1.1 0.9 1.1 0.9 0.8 0.9 0.7
3. Current liabilities 31.1 30.7 32.1 18.9 21.8 20.7 33.5 33.4 35.6
(a) Short-term borrowings$ 12.7 12.5 13.8 6.5 9.1 9.3 12.4 12.9 15.0
Of which, (i) Loans repayable on demand 9.0 8.3 8.9 4.5 5.2 5.2 6.8 5.9 6.2
Of which, from banks 7.1 6.9 7.1 2.6 3.0 2.8 5.7 5.2 5.1
(ii) Loan and Advances from related parties 0.6 0.3 0.7 1.0 1.7 2.6 0.5 0.2 0.7
(iii) Other loans and advances 2.8 3.5 3.7 1.0 2.2 1.3 4.4 5.7 7.3
(b) Trade payables 2.1 2.4 1.5 6.1 5.1 4.3 1.5 1.2 1.0
(c) Short-term provisions 1.1 1.1 1.1 1.5 1.6 1.1 1.2 1.1 1.1
(d) Other current liabilities 15.1 14.7 15.7 4.8 6.0 6.0 18.3 18.3 18.6
Total Liabilities 100.0 100.0 100.0 100.0 100.0 100.0 100.0 100.0 100.0
Note: Figures in brackets below the activity name represents the number of companies in the activity.- Nil or Negligible$ Sub-components of long-term borrowings and short-term borrowings for Non-XBRL data were estimated based on corresponding proportions in XBRL data for each activity groups.

article
RBI Bulletin May 201732
Performance of Non-Government Non-Banking Financial and Investment Companies, 2015-16
Statement 4: Profile of Liabilities Structure of the select 21,186 NGNBF&I Companies : 2013-14 to 2015-16 (Concld.)
( Per cent)
Items Asset Finance Diversified Miscellaneous
(4,039) (922) (4,560)
2013-14 2014-15 2015-16 2013-14 2014-15 2015-16 2013-14 2014-15 2015-16
1. Shareholders' Fund 24.3 23.0 22.1 66.7 62.2 65.7 35.5 33.9 32.0
Of which, (i) Share Capital 6.3 5.6 5.1 15.5 14.5 14.8 7.9 7.2 6.5
(ii) Reserves and Surplus 18.0 17.4 17.0 49.0 47.7 50.9 27.5 26.7 25.5
2. Non-current liabilities 42.6 45.6 46.2 7.9 11.0 12.2 31.8 34.9 33.4
(a) Long-term borrowings (debt)$ 41.2 44.2 44.7 7.3 10.2 11.3 27.6 30.6 28.3
Of which, (i) Bonds/Debentures 3.9 3.1 5.9 - - - 6.5 2.1 2.7
(ii) Term loans 36.2 33.6 33.2 2.8 3.7 6.0 7.6 10.1 11.6
Of which, from banks 10.1 14.2 16.6 2.2 3.1 1.0 6.5 8.7 8.3
(iii) Deposits 0.3 0.2 0.3 0.2 2.5 2.0 9.0 16.3 11.3
(iv) Loan and Advances from related parties 0.7 2.3 1.4 2.3 0.8 - 2.4 1.2 1.1
(b) Long-term provisions 0.6 0.5 0.5 0.2 0.2 0.2 1.3 1.4 2.0
(c) Other long-term liabilities 0.7 0.8 1.0 0.5 0.6 0.6 2.9 2.8 3.0
3. Current liabilities 33.1 31.4 31.7 25.2 26.8 22.1 32.5 31.2 34.6
(a) Short-term borrowings$ 15.1 13.9 14.9 14.4 15.7 13.0 13.1 10.9 11.5
Of which, (i) Loans repayable on demand 12.6 12.2 13.3 10.1 10.0 0.6 9.6 6.7 7.6
Of which, from banks 11.0 11.3 12.1 1.9 1.5 0.6 4.6 3.6 2.9
(ii) Loan and Advances from related parties 0.4 - 0.2 1.9 - 3.7 0.7 0.1 0.4
(iii) Other loans and advances 2.2 1.6 1.2 2.5 4.3 5.8 2.3 3.8 3.0
(b) Trade payables 1.1 2.6 0.9 4.2 3.8 2.6 2.1 2.4 2.3
(c) Short-term provisions 1.0 0.9 0.9 0.7 0.6 0.6 1.0 1.2 1.8
(d) Other current liabilities 15.9 14.0 15.0 5.9 6.7 5.9 16.4 16.6 19.0
Total Liabilities 100.0 100.0 100.0 100.0 100.0 100.0 100.0 100.0 100.0
Note: Figures in brackets below the activity name represents the number of companies in the activity.- Nil or Negligible$ Sub-components of long-term borrowings and short-term borrowings for Non-XBRL data were estimated based on corresponding proportions in XBRL data for each activity groups.

article
RBI Bulletin May 2017 33
Performance of Non-Government Non-Banking Financial and Investment Companies, 2015-16
Statement 5: Profile of Assets Structure of the select 21,186 NGNBF&I Companies : 2013-14 to 2015-16
(Per cent)
Items All Activities Share Trading and Investment Holding
Loan Finance
(21,186) (9,269) (2,396)
2013-14 2014-15 2015-16 2013-14 2014-15 2015-16 2013-14 2014-15 2015-16
1. Current Assets 41.3 41.0 38.5 34.5 36.3 36.9 43.8 43.6 38.6
(a) Cash and Cash equivalents 6.7 5.7 4.7 8.6 9.8 9.1 6.6 6.0 4.3
(b) Current Investments 3.1 3.4 2.6 4.4 4.9 5.6 4.1 4.4 3.1
(c) Inventories 2.6 2.7 2.4 5.1 6.1 6.3 2.0 2.2 1.6
(d) Trade receivables 2.8 3.1 3.0 4.6 3.8 4.0 2.7 2.2 2.2
(e) Short term loans and advances 23.1 22.9 22.7 10.1 9.8 10.0 26.0 26.1 25.5
(f) Other current assets 2.9 3.2 3.0 1.7 1.8 2.0 2.5 2.6 1.9
2. Non-Current Assets 58.7 59.0 61.5 65.5 63.7 63.1 56.2 56.4 61.4
(a) Non-current Investments 17.0 15.4 13.9 51.6 49.8 48.7 11.5 10.0 9.1
Of which, Indian Securities 16.9 15.3 13.8 51.5 49.8 48.6 11.3 9.9 8.8
(b) Long-term loans and advances 36.8 39.0 43.0 9.2 9.4 9.9 41.2 43.3 49.4
(c) Net Fixed assets 1.5 1.4 1.3 3.7 3.4 3.5 1.0 0.9 1.0
(d) Other Non-Current Assets 3.1 3.1 3.1 0.9 0.9 0.8 2.0 1.8 1.4
Total Assets 100.0 100.0 100.0 100.0 100.0 100.0 100.0 100.0 100.0
Items Asset Finance Diversified Miscellaneous
(4,039) (922) (4,560)
1. Current Assets 38.6 38.6 37.5 39.4 41.3 42.2 49.5 45.5 42.0
(a) Cash and Cash equivalents 4.8 3.3 3.3 4.8 5.6 5.5 10.6 7.5 5.7
(b) Current Investments 1.5 1.8 1.2 3.5 4.1 4.8 3.7 3.4 2.4
(c) Inventories 2.4 2.3 2.2 5.2 4.8 5.1 1.9 1.7 1.5
(d) Trade receivables 1.9 3.8 3.5 3.5 3.1 2.4 3.9 3.2 2.9
(e) Short term loans and advances 24.1 22.8 22.4 20.7 21.9 22.7 27.1 27.6 27.5
(f) Other current assets 3.9 4.7 4.8 1.7 1.8 1.8 2.3 2.1 2.0
2. Non-Current Assets 61.4 61.4 62.5 60.6 58.7 57.8 50.5 54.5 58.0
(a) Non-current Investments 9.7 8.4 7.6 32.7 30.7 28.5 13.8 13.3 12.6
Of which, Indian Securities 9.7 8.4 7.6 32.7 30.7 28.5 13.8 13.3 12.6
(b) Long-term loans and advances 44.9 46.7 48.0 22.4 22.2 23.8 32.7 36.8 41.6
(c) Net Fixed assets 1.1 0.9 0.9 4.1 3.9 4.3 1.7 1.6 1.5
(d) Other Non-Current Assets 5.4 5.3 5.8 1.3 1.8 1.0 1.9 2.3 2.0
Total Assets 100.0 100.0 100.0 100.0 100.0 100.0 100.0 100.0 100.0
Note: Figures in brackets below the activity name represents the number of companies in the activity.$ Sub-components for investments for Non-XBRL data were estimated based on corresponding proportion in XBRL data for each activity groups.
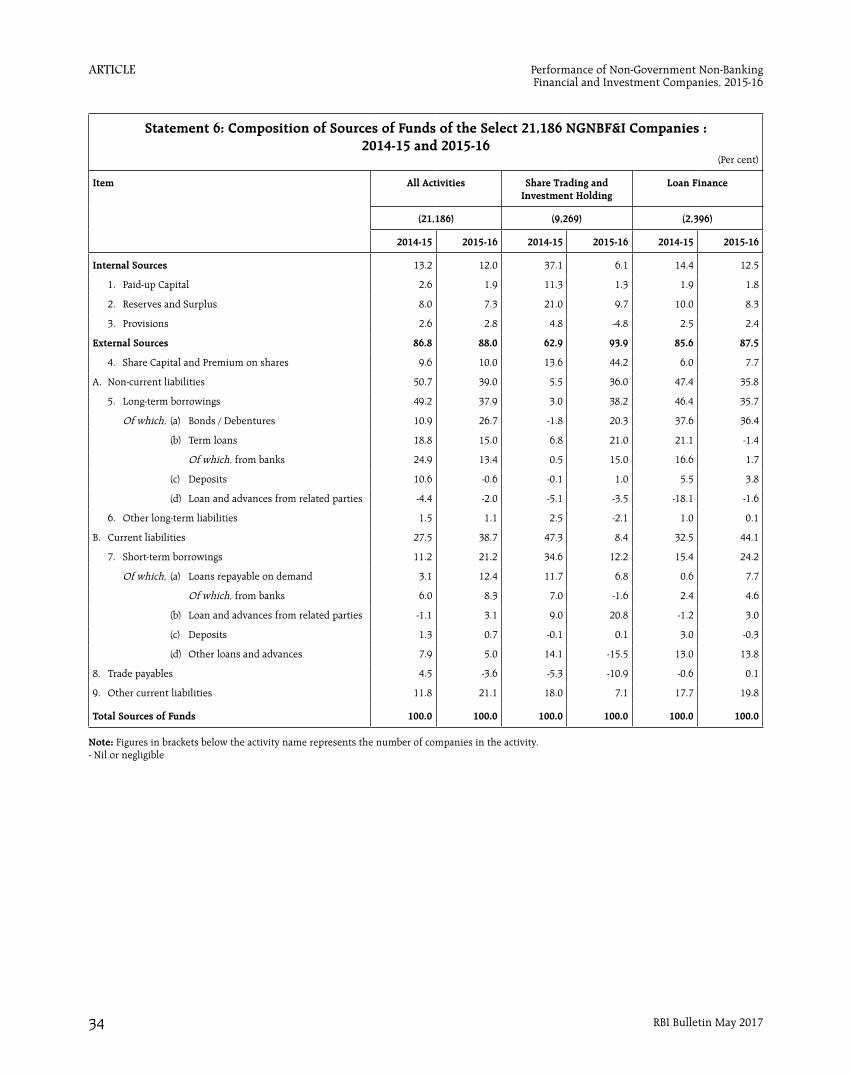
article
RBI Bulletin May 201734
Performance of Non-Government Non-Banking Financial and Investment Companies, 2015-16
Statement 6: Composition of Sources of Funds of the Select 21,186 NGNBF&I Companies : 2014-15 and 2015-16
(Per cent)
Item All Activities Share Trading and Investment Holding
Loan Finance
(21,186) (9,269) (2,396)
2014-15 2015-16 2014-15 2015-16 2014-15 2015-16
Internal Sources 13.2 12.0 37.1 6.1 14.4 12.5
1. Paid-up Capital 2.6 1.9 11.3 1.3 1.9 1.8
2. Reserves and Surplus 8.0 7.3 21.0 9.7 10.0 8.3
3. Provisions 2.6 2.8 4.8 -4.8 2.5 2.4
External Sources 86.8 88.0 62.9 93.9 85.6 87.5
4. Share Capital and Premium on shares 9.6 10.0 13.6 44.2 6.0 7.7
A. Non-current liabilities 50.7 39.0 5.5 36.0 47.4 35.8
5. Long-term borrowings 49.2 37.9 3.0 38.2 46.4 35.7
Of which, (a) Bonds / Debentures 10.9 26.7 -1.8 20.3 37.6 36.4
(b) Term loans 18.8 15.0 6.8 21.0 21.1 -1.4
Of which, from banks 24.9 13.4 0.5 15.0 16.6 1.7
(c) Deposits 10.6 -0.6 -0.1 1.0 5.5 3.8
(d) Loan and advances from related parties -4.4 -2.0 -5.1 -3.5 -18.1 -1.6
6. Other long-term liabilities 1.5 1.1 2.5 -2.1 1.0 0.1
B. Current liabilities 27.5 38.7 47.3 8.4 32.5 44.1
7. Short-term borrowings 11.2 21.2 34.6 12.2 15.4 24.2
Of which, (a) Loans repayable on demand 3.1 12.4 11.7 6.8 0.6 7.7
Of which, from banks 6.0 8.3 7.0 -1.6 2.4 4.6
(b) Loan and advances from related parties -1.1 3.1 9.0 20.8 -1.2 3.0
(c) Deposits 1.3 0.7 -0.1 0.1 3.0 -0.3
(d) Other loans and advances 7.9 5.0 14.1 -15.5 13.0 13.8
8. Trade payables 4.5 -3.6 -5.3 -10.9 -0.6 0.1
9. Other current liabilities 11.8 21.1 18.0 7.1 17.7 19.8
Total Sources of Funds 100.0 100.0 100.0 100.0 100.0 100.0
Note: Figures in brackets below the activity name represents the number of companies in the activity.- Nil or negligible
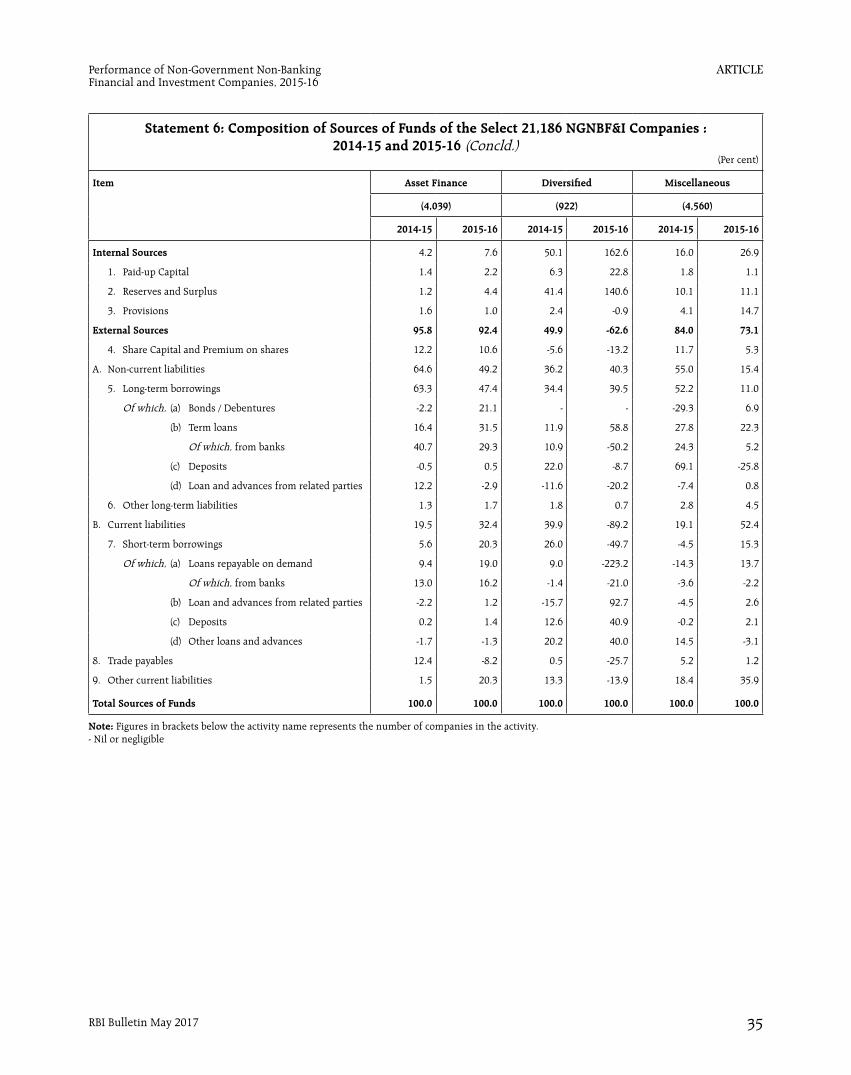
article
RBI Bulletin May 2017 35
Performance of Non-Government Non-Banking Financial and Investment Companies, 2015-16
Statement 6: Composition of Sources of Funds of the Select 21,186 NGNBF&I Companies : 2014-15 and 2015-16 (Concld.)
(Per cent)
Item Asset Finance Diversified Miscellaneous
(4,039) (922) (4,560)
2014-15 2015-16 2014-15 2015-16 2014-15 2015-16
Internal Sources 4.2 7.6 50.1 162.6 16.0 26.9
1. Paid-up Capital 1.4 2.2 6.3 22.8 1.8 1.1
2. Reserves and Surplus 1.2 4.4 41.4 140.6 10.1 11.1
3. Provisions 1.6 1.0 2.4 -0.9 4.1 14.7
External Sources 95.8 92.4 49.9 -62.6 84.0 73.1
4. Share Capital and Premium on shares 12.2 10.6 -5.6 -13.2 11.7 5.3
A. Non-current liabilities 64.6 49.2 36.2 40.3 55.0 15.4
5. Long-term borrowings 63.3 47.4 34.4 39.5 52.2 11.0
Of which, (a) Bonds / Debentures -2.2 21.1 - - -29.3 6.9
(b) Term loans 16.4 31.5 11.9 58.8 27.8 22.3
Of which, from banks 40.7 29.3 10.9 -50.2 24.3 5.2
(c) Deposits -0.5 0.5 22.0 -8.7 69.1 -25.8
(d) Loan and advances from related parties 12.2 -2.9 -11.6 -20.2 -7.4 0.8
6. Other long-term liabilities 1.3 1.7 1.8 0.7 2.8 4.5
B. Current liabilities 19.5 32.4 39.9 -89.2 19.1 52.4
7. Short-term borrowings 5.6 20.3 26.0 -49.7 -4.5 15.3
Of which, (a) Loans repayable on demand 9.4 19.0 9.0 -223.2 -14.3 13.7
Of which, from banks 13.0 16.2 -1.4 -21.0 -3.6 -2.2
(b) Loan and advances from related parties -2.2 1.2 -15.7 92.7 -4.5 2.6
(c) Deposits 0.2 1.4 12.6 40.9 -0.2 2.1
(d) Other loans and advances -1.7 -1.3 20.2 40.0 14.5 -3.1
8. Trade payables 12.4 -8.2 0.5 -25.7 5.2 1.2
9. Other current liabilities 1.5 20.3 13.3 -13.9 18.4 35.9
Total Sources of Funds 100.0 100.0 100.0 100.0 100.0 100.0
Note: Figures in brackets below the activity name represents the number of companies in the activity.- Nil or negligible

article
RBI Bulletin May 201736
Performance of Non-Government Non-Banking Financial and Investment Companies, 2015-16
Statement 7: Composition of Uses of Funds of the Select 21,186 NGNBF&I Companies : 2014-15 and 2015-16
(Per cent)
Items All Activities Share Trading and Investment Holding
Loan Finance
(21,186) (9,269) (2,396)
2014-15 2015-16 2014-15 2015-16 2014-15 2015-16
1. Current Assets 38.4 24.3 53.0 49.6 41.7 17.3
(a) Cash and cash equivalents -1.2 -0.7 21.5 -4.1 2.5 -2.9
(b) Current Investments 4.9 -1.5 9.7 19.1 6.1 -2.4
(c) Inventories 3.5 0.6 16.5 9.4 3.3 -1.1
(d) Trade receivables 4.9 2.4 -4.3 7.3 -0.5 2.4
(e) Short term loans and advances 20.7 21.8 6.7 12.9 26.7 22.8
(f) Other current assets 5.5 1.8 2.9 4.9 3.7 -1.5
2. Non-Current Assets 61.6 75.7 47.0 50.4 58.3 82.7
(a) Non-Current Investments 4.9 5.4 31.7 24.1 1.9 4.8
Of which, Indian Securities 4.9 5.2 31.5 23.9 2.0 4.4
(b) Long term Loans and Advances 52.8 65.4 10.8 20.7 54.9 75.3
(c) Deferred tax assets -0.5 0.3 0.8 0.1 -0.2 0.6
(d) Gross Fixed Assets 1.4 1.5 2.8 6.8 1.1 2.0
(e) Other non-current Assets 2.9 3.1 0.9 -1.4 0.5 -0.1
Total Uses of Funds 100.0 100.0 100.0 100.0 100.0 100.0
Items Asset Finance Diversified Miscellaneous
(4,039) (922) (4,560)
1. Current Assets 37.9 32.2 56.4 66.5 17.0 15.5
(a) Cash and cash equivalents -6.6 3.7 12.6 2.2 -15.3 -7.2
(b) Current Investments 3.5 -1.7 8.6 22.9 1.6 -5.1
(c) Inventories 1.6 1.8 1.1 12.9 0.4 -0.1
(d) Trade receivables 15.7 2.5 -0.4 -14.1 -1.9 0.7
(e) Short term loans and advances 13.8 20.2 31.9 41.1 31.4 26.1
(f) Other current assets 9.9 5.6 2.6 1.5 0.8 1.2
2. Non-Current Assets 62.1 67.8 43.6 33.5 83.0 84.5
(a) Non-Current Investments -0.1 3.9 12.4 -22.3 9.3 7.6
Of which, Indian Securities -0.1 3.9 12.4 -22.3 9.3 7.6
(b) Long term Loans and Advances 57.2 55.5 20.5 60.2 66.2 75.1
(c) Deferred tax assets -1.6 0.2 0.1 0.4 1.0 -0.2
(d) Gross Fixed Assets 1.6 -0.1 4.1 12.9 0.8 2.9
(e) Other non-current Assets 5.0 8.4 6.5 -17.7 5.7 -0.9
Total Uses of Funds 100.0 100.0 100.0 100.0 100.0 100.0
Note: Figures in parentheses below the activity name represents the number of companies.

article
RBI Bulletin May 2017 37
Union Budget 2017-18: An Assessment
· On the receipts side, gross tax revenue is expected to be driven by buoyant income tax collections while the growth in indirect taxes would moderate.
· Outlook on disinvestment receipts in 2017-18 is bullish notwithstanding the shortfall of about 20 per cent in 2016-17.
· Revenue expenditure is budgeted to decelerate sharply to accommodate a sustained pace of capital expenditure, even as the expenditure classification between Plan and Non-Plan has been eliminated.
· Overall, the Budget carries a pro-farmer pro-rural focus, with targeted policy for sectors most affected after demonetisation such as housing, Small and Medium Enterprises (SMEs) and the farm sector designed to stimulate consumption demand while higher infrastructure spending is encouraged to strengthen the pace of growth.
The major policy initiatives proposed in the Budget are highlighted in Box 1.
This article analyses the key features of the Union Budget 2017-18 against the backdrop of an uncertain economic and political environment globally but with major policy initiatives undertaken domestically. The aim to “Transform, Energise and Clean (TEC) India” will warrant stepped-up expenditure for the poor and the underprivileged within the overall framework of fiscal prudence and economic reforms to accelerate growth.
Union Budget 2017-18: Highlights
· With the Central Government’s targets for 2016-17 in terms of key deficit indicators being achieved through buoyant tax and non-tax revenues, the gross fiscal deficit (GFD) and the revenue deficit (RD) are budgeted to decline in 2017-18, reflecting continued commitment to fiscal consolidation even as the GFD-GDP (gross domestic product) target of 3.0 per cent has been deferred to 2018-19 from 2017-18.
* Prepared in the Fiscal Analysis Division of the Department of Economic and Policy Research, Reserve Bank of India. The previous article on Union Budget 2016-17 was published in the Reserve Bank of India Bulletin, May 2016.
Union Budget 2017-18: An Assessment*
Ten elements of a cohesive development strategy were
announced in the Budget. Taken together, they carry
important implications for the evolving trajectory of the Indian economy which can be distilled into three broad categories.
I. Fiscal Discipline
For the first time, a consolidated Outcome Budget, covering all Ministries and Departments, was presented along with the other Budget documents. The gross fiscal deficit for 2017-18 is targeted at 3.2 per cent of GDP and 3 per cent in the following year. The revenue deficit for 2017-18 is pegged at 1.9 per cent as against 2.0 per cent mandated by the FRBM Act. Extensive efforts are planned for the smooth implementation of the goods and services
tax (GST).
II. Financial Sector Reforms
Key financial sector reforms proposed in the Budget
include: (i) allocation of `100 billion for recapitalisation of
banks in line with the ‘Indradhanush’ roadmap; (ii) listing
the shares of Railway public sector enterprises (PSEs) like
Indian Railway Catering and Tourism Corporation Limited
(IRCTC), Indian Railway Finance Corporation (IRFC) and
Indian Railway Construction Company (IRCON) on stock
exchanges; (iii) revised mechanism and procedure to
ensure time bound listing of identified central public sector
enterprises (CPSEs) on stock exchanges; (iv) establishing
a Computer Emergency Response Team for Financial
Sector (CERT-Fin) to safeguard the integrity and stability
of the financial sector; (v) a Bill relating to resolution of
Box 1: Union Budget 2017-18 - Key Initiatives
(Contd...)

article
RBI Bulletin May 201738
Union Budget 2017-18: An Assessment
financial firms to be introduced to contribute to stability and resilience of the financial system; (vi) a Bill to curtail the menace of illicit deposit schemes to be introduced to protect the poor from unscrupulous entities; and (vii) no transaction above `3 lakh to be permitted in cash subject to certain exceptions.
III. Structural Reforms
Major structural reforms include: (i) framing a model law on contract farming for States for better price realisation and reduction of post-harvest losses; (ii) setting up a Dairy Processing and Infrastructure Development Fund in National Bank for Agriculture and Rural Development (NABARD) to ensure adequate milk processing infrastructure; (iii) increasing Mahatma Gandhi National Rural Employment Guarantee Act (MGNREGA) allocation and reorienting the scheme to support doubling farmers’ income; (iv) the National Housing Bank (NHB) to refinance individual housing loans of about `20,000 crore
in 2017-18 to facilitate higher investment in affordable housing; (v) amending the Drugs and Cosmetics Rules to ensure availability of drugs at reasonable prices; (vi) abolishing the Foreign Investment Promotion Board (FIPB) and further liberalization of the FDI policy; (vii) launching a new and restructured Central scheme, namely, Trade Infrastructure for Export Scheme (TIES); (viii) amending the Airport Authority of India Act to enable effective monetisation of land assets; (ix) creating a Payments Regulatory Board in the Reserve Bank of India by replacing the existing Board for Regulation and Supervision of Payment and Settlement Systems; and (x) rationalising the number of tribunals and merging of tribunals wherever appropriate. Other reforms include limiting the maximum amount of cash donation from one person to a political party to `2000 and amending the Reserve Bank of India Act to enable the issuance of electoral bonds in accordance with a scheme to be framed by the Government of India.
I. Fiscal Performance in 2016-17 (Revised Estimates)
Central finances were shored up as a continuation of the recent phase of fiscal consolidation that commenced from 2012-13. RD at 2.0 per cent of GDP was lower than the budgeted target of 2.3 per cent
while the GFD was contained at the budgeted 3.5 per cent in 2016-17 (Chart 1).
The fiscal strategy for 2016-17 was mainly revenue-driven, with buoyant tax and non-tax inflows comfortably funding additional expenditure
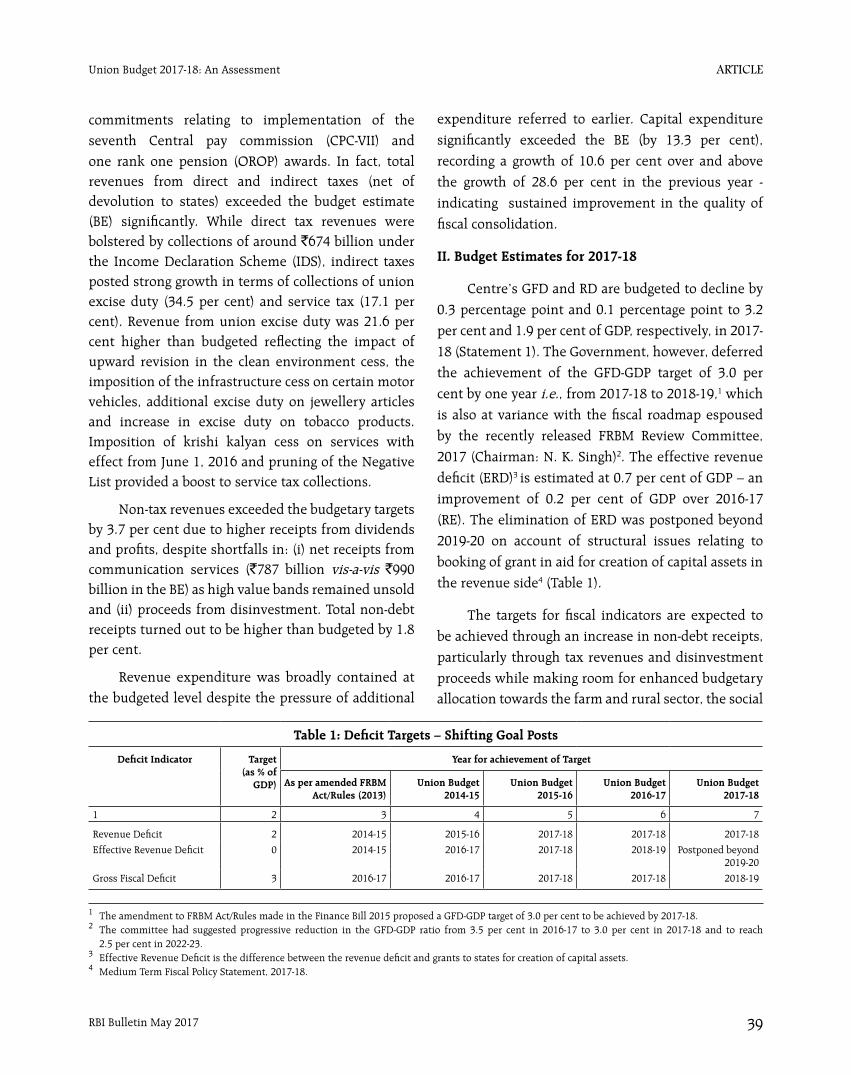
article
RBI Bulletin May 2017 39
Union Budget 2017-18: An Assessment
Table 1: Deficit Targets – Shifting Goal Posts
Deficit Indicator Target (as % of
GDP)
Year for achievement of Target
As per amended FRBM Act/Rules (2013)
Union Budget2014-15
Union Budget2015-16
Union Budget2016-17
Union Budget2017-18
1 2 3 4 5 6 7
Revenue Deficit 2 2014-15 2015-16 2017-18 2017-18 2017-18
Effective Revenue Deficit 0 2014-15 2016-17 2017-18 2018-19 Postponed beyond 2019-20
Gross Fiscal Deficit 3 2016-17 2016-17 2017-18 2017-18 2018-19
commitments relating to implementation of the seventh Central pay commission (CPC-VII) and one rank one pension (OROP) awards. In fact, total revenues from direct and indirect taxes (net of devolution to states) exceeded the budget estimate (BE) significantly. While direct tax revenues were bolstered by collections of around `674 billion under the Income Declaration Scheme (IDS), indirect taxes posted strong growth in terms of collections of union excise duty (34.5 per cent) and service tax (17.1 per cent). Revenue from union excise duty was 21.6 per cent higher than budgeted reflecting the impact of upward revision in the clean environment cess, the imposition of the infrastructure cess on certain motor vehicles, additional excise duty on jewellery articles and increase in excise duty on tobacco products. Imposition of krishi kalyan cess on services with effect from June 1, 2016 and pruning of the Negative List provided a boost to service tax collections.
Non-tax revenues exceeded the budgetary targets by 3.7 per cent due to higher receipts from dividends and profits, despite shortfalls in: (i) net receipts from communication services (`787 billion vis-a-vis `990 billion in the BE) as high value bands remained unsold and (ii) proceeds from disinvestment. Total non-debt receipts turned out to be higher than budgeted by 1.8 per cent.
Revenue expenditure was broadly contained at the budgeted level despite the pressure of additional
expenditure referred to earlier. Capital expenditure significantly exceeded the BE (by 13.3 per cent), recording a growth of 10.6 per cent over and above the growth of 28.6 per cent in the previous year - indicating sustained improvement in the quality of fiscal consolidation.
II. Budget Estimates for 2017-18
Centre’s GFD and RD are budgeted to decline by 0.3 percentage point and 0.1 percentage point to 3.2 per cent and 1.9 per cent of GDP, respectively, in 2017-18 (Statement 1). The Government, however, deferred the achievement of the GFD-GDP target of 3.0 per cent by one year i.e., from 2017-18 to 2018-19,1 which is also at variance with the fiscal roadmap espoused by the recently released FRBM Review Committee, 2017 (Chairman: N. K. Singh)2. The effective revenue deficit (ERD)3 is estimated at 0.7 per cent of GDP – an improvement of 0.2 per cent of GDP over 2016-17 (RE). The elimination of ERD was postponed beyond 2019-20 on account of structural issues relating to booking of grant in aid for creation of capital assets in the revenue side4 (Table 1).
The targets for fiscal indicators are expected to be achieved through an increase in non-debt receipts, particularly through tax revenues and disinvestment proceeds while making room for enhanced budgetary allocation towards the farm and rural sector, the social
1 The amendment to FRBM Act/Rules made in the Finance Bill 2015 proposed a GFD-GDP target of 3.0 per cent to be achieved by 2017-18.2 The committee had suggested progressive reduction in the GFD-GDP ratio from 3.5 per cent in 2016-17 to 3.0 per cent in 2017-18 and to reach 2.5 per cent in 2022-23. 3 Effective Revenue Deficit is the difference between the revenue deficit and grants to states for creation of capital assets. 4 Medium Term Fiscal Policy Statement, 2017-18.
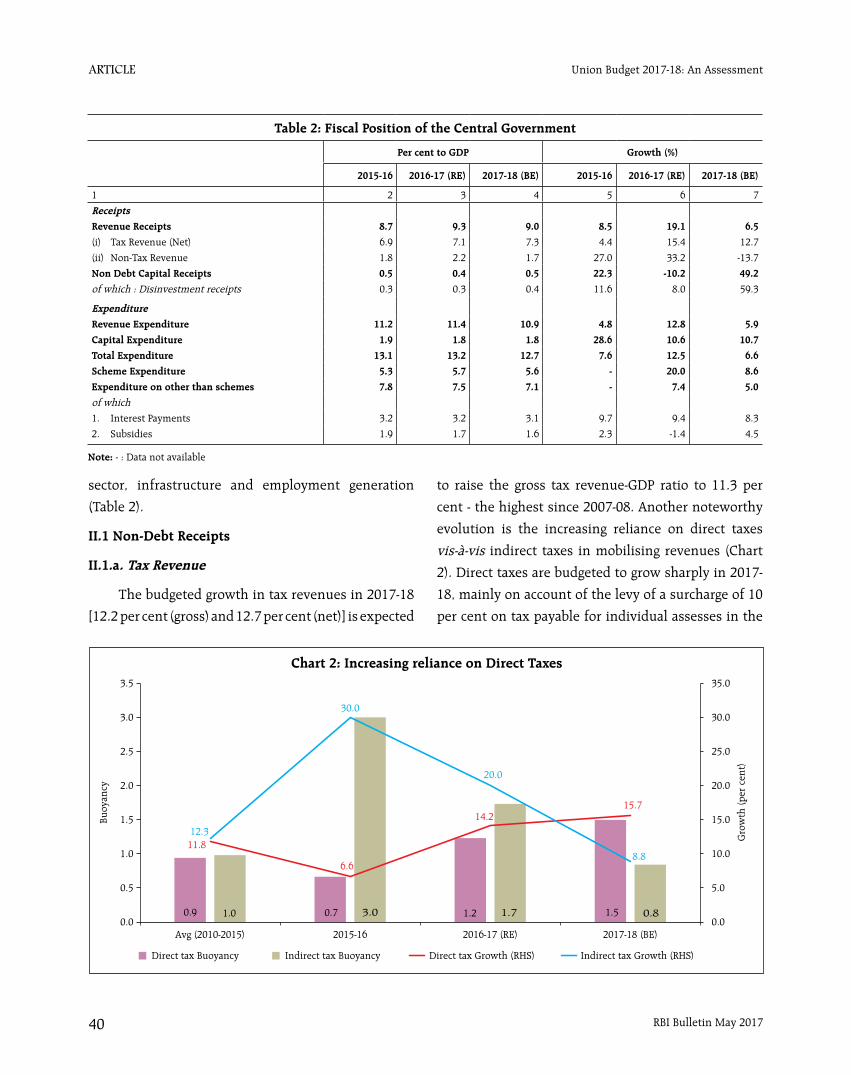
article
RBI Bulletin May 201740
Union Budget 2017-18: An Assessment
sector, infrastructure and employment generation
(Table 2).
II.1 Non-Debt Receipts
II.1.a. Tax Revenue
The budgeted growth in tax revenues in 2017-18
[12.2 per cent (gross) and 12.7 per cent (net)] is expected
to raise the gross tax revenue-GDP ratio to 11.3 per
cent - the highest since 2007-08. Another noteworthy
evolution is the increasing reliance on direct taxes
vis-à-vis indirect taxes in mobilising revenues (Chart
2). Direct taxes are budgeted to grow sharply in 2017-
18, mainly on account of the levy of a surcharge of 10
per cent on tax payable for individual assesses in the
Table 2: Fiscal Position of the Central Government
Per cent to GDP Growth (%)
2015-16 2016-17 (RE) 2017-18 (BE) 2015-16 2016-17 (RE) 2017-18 (BE)
1 2 3 4 5 6 7
ReceiptsRevenue Receipts 8.7 9.3 9.0 8.5 19.1 6.5
(i) Tax Revenue (Net) 6.9 7.1 7.3 4.4 15.4 12.7
(ii) Non-Tax Revenue 1.8 2.2 1.7 27.0 33.2 -13.7
Non Debt Capital Receipts 0.5 0.4 0.5 22.3 -10.2 49.2
of which : Disinvestment receipts 0.3 0.3 0.4 11.6 8.0 59.3
ExpenditureRevenue Expenditure 11.2 11.4 10.9 4.8 12.8 5.9
Capital Expenditure 1.9 1.8 1.8 28.6 10.6 10.7
Total Expenditure 13.1 13.2 12.7 7.6 12.5 6.6
Scheme Expenditure 5.3 5.7 5.6 - 20.0 8.6
Expenditure on other than schemes 7.8 7.5 7.1 - 7.4 5.0
of which1. Interest Payments 3.2 3.2 3.1 9.7 9.4 8.3
2. Subsidies 1.9 1.7 1.6 2.3 -1.4 4.5
Note: - : Data not available
Chart 2: Increasing reliance on Direct Taxes
0.9 0.7 1.2 1.51.0 3.0 1.7 0.8
15.7
12.3
30.0
20.0
11.8
6.68.8
14.2
0.0
5.0
10.0
15.0
20.0
25.0
30.0
35.0
0.0
0.5
1.0
1.5
2.0
2.5
3.0
3.5
Avg (2010-2015) 2015-16 2016-17 (RE) 2017-18 (BE)
Gro
wth
(per
cent
)
Buoy
ancy
Direct tax Buoyancy Indirect tax Buoyancy Direct tax Growth (RHS) Indirect tax Growth (RHS)
0.9 1.0 0.7 3.0 1.2 1.7 1.5 0.8

article
RBI Bulletin May 2017 41
Union Budget 2017-18: An Assessment
income bracket of `50 lakh - 1 crore that will facilitate income tax collections to grow by an estimated 24.9 per cent. Indirect taxes, on the other hand, are estimated to grow at a modest pace, reflecting: (i) the high base of 2016-17; and (ii) conservative accounting of potential revenue from the likely implementation of the GST. The government has not announced any additional revenue mobilisation (ARM) measure relating to indirect taxes in 2017-18. The greater emphasis on direct taxes in 2017-18 is also reflected at the disaggregated level in terms of higher buoyancy of corporation and personal income taxes (Table 3).
The Government has refrained from proposing changes in the current regime of excise and service taxes owing to the imminent implementation of the GST in 2017-18. Measures like reduction in the personal income tax in the lowest bracket and in the corporation tax for SMEs with turnover below `50
crores are likely to increase disposable income and enhance compliance at the lower level of the corporate pyramid.
II.1.b Non-Tax Revenue
Non-tax revenues comprising dividend payments from PSEs, public sector undertaking (PSU) banks, the Reserve Bank of India and proceeds from spectrum auctions are budgeted to decline by 13.7 per cent in 2017-18 due to estimated lower spectrum auction receipts compared to the previous year. Accordingly, telecom receipts are projected to decrease to `443 billion in 2017-18 (BE) from `787 billion in 2016-17 (RE).
II.1.c Non-debt Capital Receipts
The target for disinvestment has been projected to grow by 59.3 per cent in 2017-18 (BE) over 2016-17 (RE) (Box 2).
Table 3: Tax Buoyancy
Average Tax Buoyancy (2008-09 to 2016-17)
Post Crisis Tax Buoyancy (2010-11 to 2016-17)
2016-17 Revised Estimates
Budgeted Tax Buoyancy for 2017-18
1 2 3 4 5
Gross Tax Revenue 0.97 1.19 1.48 1.17
Corporation Tax 0.81 0.78 0.78 0.87
Income Tax 1.02 1.21 1.98 2.38
Customs Duty 0.66 1.05 0.27 1.23
Union Excise Duty 1.26 1.80 2.99 0.48
Service Tax 1.56 1.84 1.48 1.06
The Budget has pegged disinvestment at `725 billion - `465 billion stake sale in PSEs, ̀ 150 billion disinvestment in strategic and minority stake holdings and `110 billion through listing of insurance companies. In 2016-17 (RE), the target set for PSU stake sale was achieved but strategic disinvestment fell short of the target by `150 billion. Consequently, actual disinvestments turned out to be around 80 per cent of the budget estimate (Chart I).
In view of the record of non-realisation of disinvestment targets, it is prudent to evaluate the impact of these slippages on the gross fiscal deficit. Three scenarios are presented. In Scenario 1, the average of actual disinvestment during the six years (2010-11 to 2015-16)
Box 2: Disinvestment Shortfall - Downside Risk
(Contd...)
Chart :I Disinvestment - Actual vis-a-vis Budgeted
0
20
40
60
80
100
0100200300400500600700800
2010
- 11
2011
- 12
2012
- 13
2013
- 14
2014
- 15
2015
- 16
2016
- 17
(RE)
2017
- 18
(BE)
per
cent
�Bi
llion
Budgeted Actuals Act./Bud. (RHS)
57.1
45.2
86.3
52.659.5 60.6
80.5
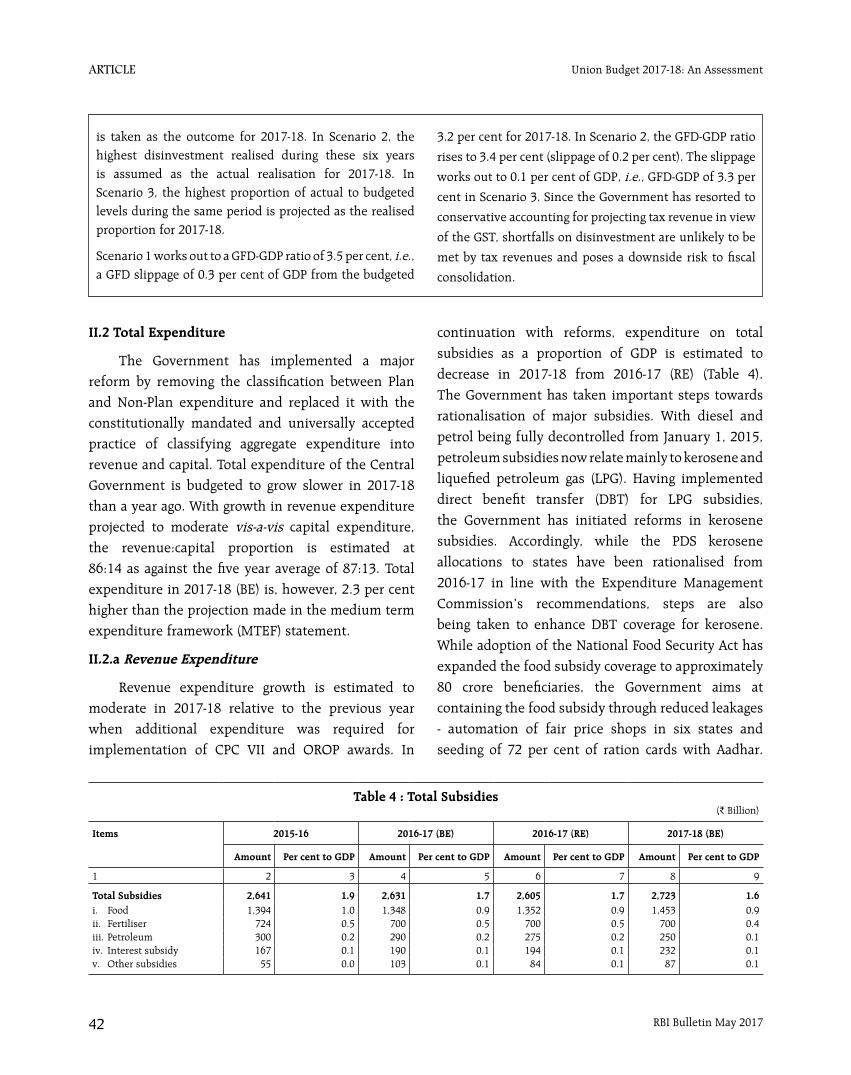
article
RBI Bulletin May 201742
Union Budget 2017-18: An Assessment
II.2 Total Expenditure
The Government has implemented a major reform by removing the classification between Plan and Non-Plan expenditure and replaced it with the constitutionally mandated and universally accepted practice of classifying aggregate expenditure into revenue and capital. Total expenditure of the Central Government is budgeted to grow slower in 2017-18 than a year ago. With growth in revenue expenditure projected to moderate vis-a-vis capital expenditure, the revenue:capital proportion is estimated at 86:14 as against the five year average of 87:13. Total expenditure in 2017-18 (BE) is, however, 2.3 per cent higher than the projection made in the medium term expenditure framework (MTEF) statement.
II.2.a Revenue Expenditure
Revenue expenditure growth is estimated to moderate in 2017-18 relative to the previous year when additional expenditure was required for implementation of CPC VII and OROP awards. In
continuation with reforms, expenditure on total subsidies as a proportion of GDP is estimated to decrease in 2017-18 from 2016-17 (RE) (Table 4). The Government has taken important steps towards rationalisation of major subsidies. With diesel and petrol being fully decontrolled from January 1, 2015, petroleum subsidies now relate mainly to kerosene and liquefied petroleum gas (LPG). Having implemented direct benefit transfer (DBT) for LPG subsidies, the Government has initiated reforms in kerosene subsidies. Accordingly, while the PDS kerosene allocations to states have been rationalised from 2016-17 in line with the Expenditure Management Commission’s recommendations, steps are also being taken to enhance DBT coverage for kerosene. While adoption of the National Food Security Act has expanded the food subsidy coverage to approximately 80 crore beneficiaries, the Government aims at containing the food subsidy through reduced leakages - automation of fair price shops in six states and seeding of 72 per cent of ration cards with Aadhar.
Table 4 : Total Subsidies(₹ Billion)
Items 2015-16 2016-17 (BE) 2016-17 (RE) 2017-18 (BE)
Amount Per cent to GDP Amount Per cent to GDP Amount Per cent to GDP Amount Per cent to GDP
1 2 3 4 5 6 7 8 9
Total Subsidies 2,641 1.9 2,631 1.7 2,605 1.7 2,723 1.6i. Food 1,394 1.0 1,348 0.9 1,352 0.9 1,453 0.9ii. Fertiliser 724 0.5 700 0.5 700 0.5 700 0.4iii. Petroleum 300 0.2 290 0.2 275 0.2 250 0.1iv. Interest subsidy 167 0.1 190 0.1 194 0.1 232 0.1v. Other subsidies 55 0.0 103 0.1 84 0.1 87 0.1
is taken as the outcome for 2017-18. In Scenario 2, the highest disinvestment realised during these six years is assumed as the actual realisation for 2017-18. In Scenario 3, the highest proportion of actual to budgeted levels during the same period is projected as the realised proportion for 2017-18.
Scenario 1 works out to a GFD-GDP ratio of 3.5 per cent, i.e., a GFD slippage of 0.3 per cent of GDP from the budgeted
3.2 per cent for 2017-18. In Scenario 2, the GFD-GDP ratio
rises to 3.4 per cent (slippage of 0.2 per cent). The slippage
works out to 0.1 per cent of GDP, i.e., GFD-GDP of 3.3 per
cent in Scenario 3. Since the Government has resorted to
conservative accounting for projecting tax revenue in view
of the GST, shortfalls on disinvestment are unlikely to be
met by tax revenues and poses a downside risk to fiscal
consolidation.

article
RBI Bulletin May 2017 43
Union Budget 2017-18: An Assessment
In order to improve allocative efficiency and better targeting of fertiliser subsidies, the Department of Fertiliser has chalked out a programme to implement DBT in revised form through pilot projects in 16 districts.
II.2.b Capital Expenditure
Capital expenditure is budgeted to grow by 10.7 per cent in 2017-18 over the previous year, reflecting the Government’s intent on improving the revenue-capital balance. Capital outlay excluding defence, which has strong multiplier effects, is budgeted to increase by a robust 12.7 per cent in 2017-18 (10.8 per cent in 2016-17 RE). While the overall non-defence capital outlay remained broadly stable at 1.1 per cent of GDP, capital outlay on major infrastructure sectors (viz., irrigation, energy, railways, roads and bridges, civil aviation, ports and light houses, and communication) has steadily increased over the last few years (Chart 3).
II.2.c Scheme/ Non-Scheme Expenditure
In the Union Budget 2017-18, the Central Government introduced a new method of classifying expenditure viz., Scheme and Non-Scheme. Scheme expenditure comprises Government’s expenditure
on Central Sector Schemes and Centrally Sponsored Schemes. Non-Scheme expenditure, on the other hand, includes inter alia expenditure on interest payments, pensions, salaries and allowances, expenditure on regulatory/statutory/autonomous bodies, Finance Commission transfers and transfers under Article 275(1) of the Constitution to state Governments. Scheme and non-scheme expenditures, which account for 44.0 per cent and 56.0 per cent of total expenditure, respectively, are estimated to grow by 8.6 per cent and 5.0 per cent, respectively, in 2017-18.
With a view to enhancing accountability and efficacy of budgetary outlays towards Central Sector and the Centrally Sponsored Schemes, the Government has put forth Outcome Budgets of various Ministries/Departments. This document links the budgeted outlays for different schemes of Ministries/Departments with physical and financial outputs/deliverables as well as the medium term outcomes.
III. Resource Transfer to States
States’ share in central taxes is budgeted to increase by 11 per cent in 2017-18 (BE), over and above a 20 per cent increase in 2016-17 (RE) pursuant
Chart 3: Emphasis on Infrastructure
Note: Cap Out (excl. Def): Capital Outlay (excluding Defence)Maj Infra: Major InfrastructureTE: Total Expenditure
0.8
1.1 1.1 1.1
0.4
0.5
0.60.7
0.0
0.2
0.4
0.6
0.8
1.0
1.2
0.0
1.0
2.0
3.0
4.0
5.0
6.0
7.0
8.0
9.0
Avg (2010-2015) 2015-16 2016-17 (RE) 2017-18 (BE)
Per
cent
Per
cent
Cap Out (excl. Def)/TE Maj Infra/TE Cap Out (excl. Def)/GDP (RHS) Maj Infra/GDP (RHS)
5.5 8.2 8.1 8.52.9 4.1 4.7 5.4

article
RBI Bulletin May 201744
Union Budget 2017-18: An Assessment
to the recommendations of the Fourteenth Finance Commission (FC-XIV) for higher devolution of taxes5 (Table 5). In 2017-18 (BE), gross transfers are budgeted to decline by 0.1 of GDP, while net transfers are retained at the previous year’s level.
IV. Market Borrowings and Liabilities
The Budget has estimated that out of the total borrowing requirements of `5,465 billion, net market borrowings (dated securities and 364-day treasury bills) would finance 63.7 per cent of GFD in 2017-18 as against 62.8 per cent in 2016-17 (RE) (Table 6). As a proportion to GDP, net market borrowing is placed at 2.1 per cent in 2017-18 as against 2.2 per cent in 2016-17 (RE).
Total liabilities-GDP ratio of the Central Government is budgeted to decline to 47.3 per cent in 2017-18 from 48.8 per cent in 2016-17 (RE). Notably, the FRBM Review Committee, 2017 has recommended a debt-GDP ratio of 40 per cent for the Central Government by 2022-23. Interest payment as proportion of revenue receipts, which is an indicator of debt servicing capacity, is budgeted to increase marginally from the previous year (Chart 4).
Table 5: Gross and Net Transfers from Centre to States(` billion)
Items 2015-16 2016-17 (BE) 2016-17 (RE) 2017-18 (BE)
1 2 3 4 5
1. States' share in Central Taxes 5,061.9 5,703.4 6,080.0 6,745.7
2. Finance Commission Grants 845.8 1,006.5 991.2 1,031.0
3. Other Central Transfers to States 2,385.7 2,543.7 2,776.5 3,034.1
a. Scheme Related Transfers 1,950.5 1,904.4 2,013.6 2,124.7
b. Other Transfers 431.4 354.6 448.6 484.5
c. Transfer to North Eastern States 3.8 284.7 314.2 425.0
4. Total Transfers to UTs with legislature 51.4 53.2 55.5 40.0
5. Gross Transfers to State & UTs (1 to 4) 8,344.8 9,306.7 9,903.1 10,850.7
6. Less Recovery of Loans and Advances 115.1 94.7 91.6 95.2
7. Net Resources transferred to State and UT (5-6) 8,229.7 9,212.0 9,811.5 10,755.6
Gross Transfers / GDP (per cent) 6.1 6.2 6.5 6.4
Net Transfers / GDP (per cent) 6.0 6.1 6.4 6.4
5 The Union Government accepted the recommendation of FC-XIV to increase the states’ share in the divisible pool of taxes from 32 per cent to 42 per cent.
Table 6: Financing Pattern of Gross Fiscal Deficit(` Billion)
Items 2015-16 2016-17 (RE)
2017-18 (BE)
1 2 3 4
Gross Fiscal Deficit 5327.9 5342.7 5465.3
(100.0) (100.0) (100.0)
Financed by
Net Market Borrowings* 4149.3 3357.1 3482.3
(77.9) (62.8) (63.7)Other treasury bills 398.1 301.4 20.0
(7.5) (5.6) (0.4)
Securities Issued against Small Savings (net)
524.7 903.8 1001.6
(9.8) (16.9) (18.3)
External Assistance 127.5 148.7 157.9
(2.4) (2.8) (2.9)
State Provident Fund 118.6 130.0 140.0
(2.2) (2.4) (2.6)
NSSF 149.1 -261.0 0.0
(2.8) (4.9) (0.0)
Reserve Fund -33.2 -82.4 -10.4
-(0.6) -(1.5) -(0.2)
Deposits and Advances 134.7 387.0 502.1
(2.5) (7.2) (9.2)
Draw Down of Cash Balances 131.7 402.3 128.4
(2.5) (7.5) (2.4)
Others -372.5 56.0 43.4
-(7.0) (1.0) (0.8)
*Includes Dated Securities and 364-day Treasury Bills, taking into account the net impact of switching off securities & buybacks.Note: Figures in parenthesis represent percentages to GFD.
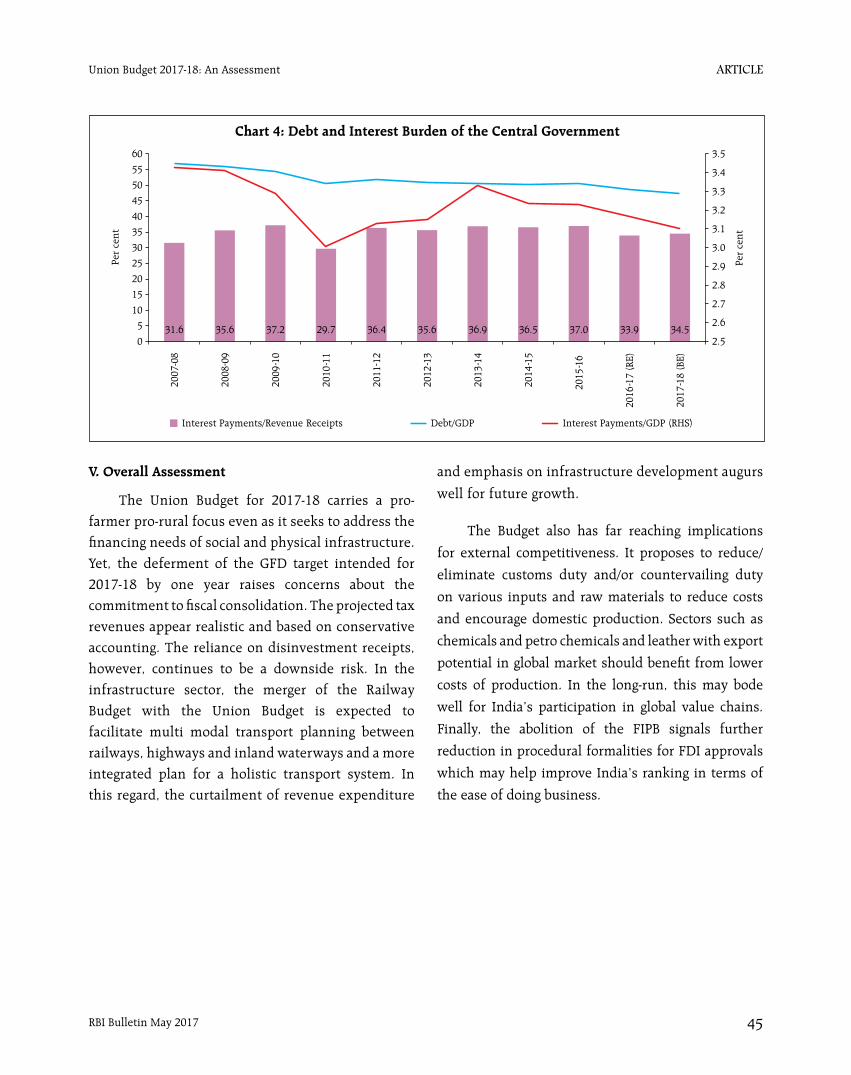
article
RBI Bulletin May 2017 45
Union Budget 2017-18: An Assessment
V. Overall Assessment
The Union Budget for 2017-18 carries a pro-farmer pro-rural focus even as it seeks to address the financing needs of social and physical infrastructure. Yet, the deferment of the GFD target intended for 2017-18 by one year raises concerns about the commitment to fiscal consolidation. The projected tax revenues appear realistic and based on conservative accounting. The reliance on disinvestment receipts, however, continues to be a downside risk. In the infrastructure sector, the merger of the Railway Budget with the Union Budget is expected to facilitate multi modal transport planning between railways, highways and inland waterways and a more integrated plan for a holistic transport system. In this regard, the curtailment of revenue expenditure
and emphasis on infrastructure development augurs
well for future growth.
The Budget also has far reaching implications
for external competitiveness. It proposes to reduce/
eliminate customs duty and/or countervailing duty
on various inputs and raw materials to reduce costs
and encourage domestic production. Sectors such as
chemicals and petro chemicals and leather with export
potential in global market should benefit from lower
costs of production. In the long-run, this may bode
well for India’s participation in global value chains.
Finally, the abolition of the FIPB signals further
reduction in procedural formalities for FDI approvals
which may help improve India’s ranking in terms of
the ease of doing business.
Chart 4: Debt and Interest Burden of the Central Government
31.6 35.6 37.2 29.7 36.4 35.6 36.9 36.5 37.0 33.9 34.52.5
2.6
2.7
2.8
2.9
3.0
3.1
3.2
3.3
3.4
3.5
0
5
10
15
20
25
30
35
40
45
50
55
60
2007
-08
2008
- 09
2009
- 10
2010
- 11
2011
- 12
2012
- 13
2013
- 14
2014
- 15
2015
- 16
2016
- 17
(RE)
2017
- 18
(BE)
Interest Payments/Revenue Receipts Debt/GDP Interest Payments/GDP (RHS)
Per
cent
Per
cent
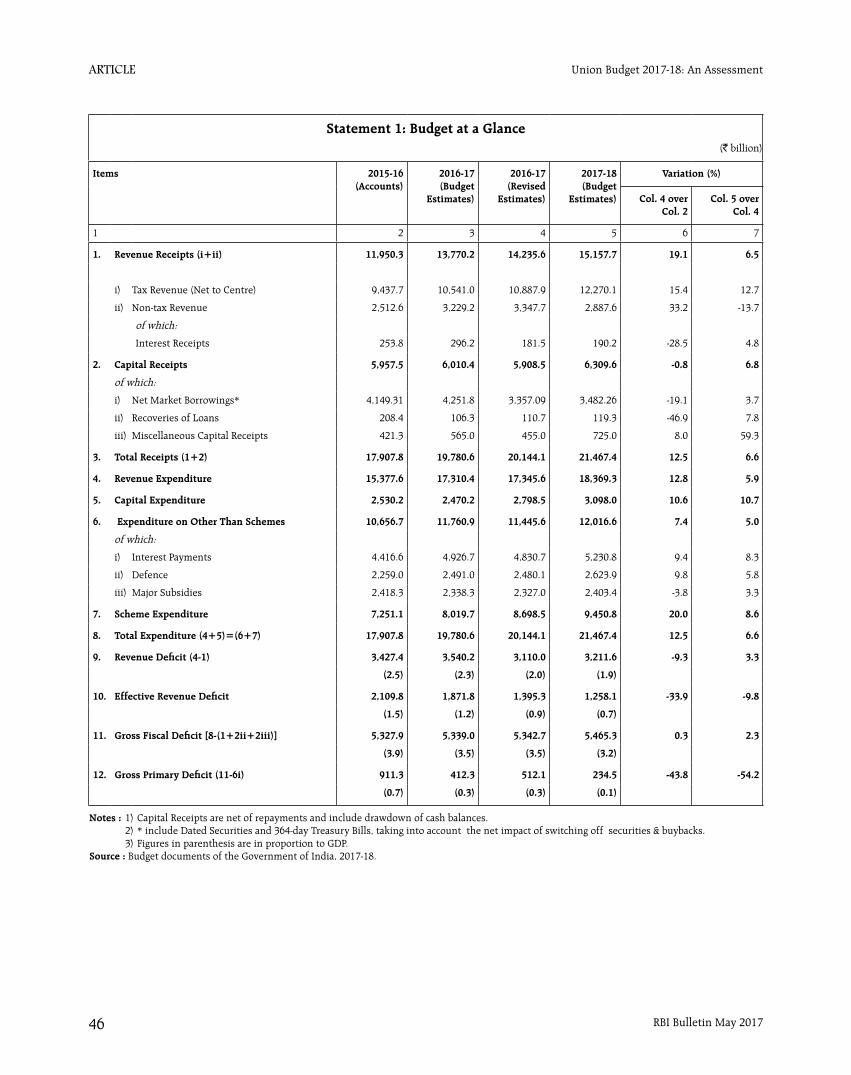
article
RBI Bulletin May 201746
Union Budget 2017-18: An Assessment
Statement 1: Budget at a Glance(` billion)
Items 2015-16 (Accounts)
2016-17 (Budget
Estimates)
2016-17 (Revised
Estimates)
2017-18 (Budget
Estimates)
Variation (%)
Col. 4 over Col. 2
Col. 5 over Col. 4
1 2 3 4 5 6 7
1. Revenue Receipts (i+ii) 11,950.3 13,770.2 14,235.6 15,157.7 19.1 6.5
i) Tax Revenue (Net to Centre) 9,437.7 10,541.0 10,887.9 12,270.1 15.4 12.7
ii) Non-tax Revenue 2,512.6 3,229.2 3,347.7 2,887.6 33.2 -13.7
of which:
Interest Receipts 253.8 296.2 181.5 190.2 -28.5 4.8
2. Capital Receipts 5,957.5 6,010.4 5,908.5 6,309.6 -0.8 6.8
of which:
i) Net Market Borrowings* 4,149.31 4,251.8 3,357.09 3,482.26 -19.1 3.7
ii) Recoveries of Loans 208.4 106.3 110.7 119.3 -46.9 7.8
iii) Miscellaneous Capital Receipts 421.3 565.0 455.0 725.0 8.0 59.3
3. Total Receipts (1+2) 17,907.8 19,780.6 20,144.1 21,467.4 12.5 6.6
4. Revenue Expenditure 15,377.6 17,310.4 17,345.6 18,369.3 12.8 5.9
5. Capital Expenditure 2,530.2 2,470.2 2,798.5 3,098.0 10.6 10.7
6. Expenditure on Other Than Schemes 10,656.7 11,760.9 11,445.6 12,016.6 7.4 5.0
of which:
i) Interest Payments 4,416.6 4,926.7 4,830.7 5,230.8 9.4 8.3
ii) Defence 2,259.0 2,491.0 2,480.1 2,623.9 9.8 5.8
iii) Major Subsidies 2,418.3 2,338.3 2,327.0 2,403.4 -3.8 3.3
7. Scheme Expenditure 7,251.1 8,019.7 8,698.5 9,450.8 20.0 8.6
8. Total Expenditure (4+5)=(6+7) 17,907.8 19,780.6 20,144.1 21,467.4 12.5 6.6
9. Revenue Deficit (4-1) 3,427.4 3,540.2 3,110.0 3,211.6 -9.3 3.3
(2.5) (2.3) (2.0) (1.9)
10. Effective Revenue Deficit 2,109.8 1,871.8 1,395.3 1,258.1 -33.9 -9.8
(1.5) (1.2) (0.9) (0.7)
11. Gross Fiscal Deficit [8-(1+2ii+2iii)] 5,327.9 5,339.0 5,342.7 5,465.3 0.3 2.3
(3.9) (3.5) (3.5) (3.2)
12. Gross Primary Deficit (11-6i) 911.3 412.3 512.1 234.5 -43.8 -54.2
(0.7) (0.3) (0.3) (0.1)
Notes : 1) Capital Receipts are net of repayments and include drawdown of cash balances. 2) * include Dated Securities and 364-day Treasury Bills, taking into account the net impact of switching off securities & buybacks. 3) Figures in parenthesis are in proportion to GDP.Source : Budget documents of the Government of India, 2017-18.
CURRENT STATISTICS
Select Economic Indicators
Reserve Bank of India
Money and Banking
Prices and Production
Government Accounts and Treasury Bills
Financial Markets
External Sector
Payment and Settlement Systems
Occasional Series


CURRENT STATISTICS
RBI Bulletin May 2017 47
No. Title Page
1 Select Economic Indicators 49
Reserve Bank of India
2 RBI – Liabilities and Assets 50
3 Liquidity Operations by RBI 51
4 Sale/ Purchase of U.S. Dollar by the RBI 52
4A Maturity Breakdown (by Residual Maturity) of Outstanding Forwards of RBI (US$ Million) 53
5 RBI's Standing Facilities 53
Money and Banking
6 Money Stock Measures 54
7 Sources of Money Stock (M3) 55
8 Monetary Survey 56
9 Liquidity Aggregates 56
10 Reserve Bank of India Survey 57
11 Reserve Money – Components and Sources 57
12 Commercial Bank Survey 58
13 Scheduled Commercial Banks' Investments 58
14 Business in India – All Scheduled Banks and All Scheduled Commercial Banks 59
15 Deployment of Gross Bank Credit by Major Sectors 60
16 Industry-wise Deployment of Gross Bank Credit 61
17 State Co-operative Banks Maintaining Accounts with the Reserve Bank of India 62
Prices and Production
18 Consumer Price Index (Base: 2012=100) 63
19 Other Consumer Price Indices 63
20 Monthly Average Price of Gold and Silver in Mumbai 63
21 Wholesale Price Index 64
22 Index of Industrial Production (Base: 2004-05=100) 66
Government Accounts and Treasury Bills
23 Union Government Accounts at a Glance 66
24 Treasury Bills – Ownership Pattern 67
25 Auctions of Treasury Bills 67
Financial Markets
26 Daily Call Money Rates 68
27 Certificates of Deposit 69
28 Commercial Paper 69
29 Average Daily Turnover in Select Financial Markets 69
30 New Capital Issues by Non-Government Public Limited Companies 70
Contents
CURRENT STATISTICS
RBI Bulletin May 201748
No. Title Page
External Sector
31 Foreign Trade 71
32 Foreign Exchange Reserves 71
33 NRI Deposits 71
34 Foreign Investment Inflows 72
35 Outward Remittances under the Liberalised Remittance Scheme (LRS) for Resident Individuals 72
36 Indices of Real Effective Exchange Rate (REER) and Nominal Effective Exchange Rate (NEER) of the Indian Rupee
73
37 External Commercial Borrowings (ECBs) 73
38 India’s Overall Balance of Payments (US $ Million) 74
39 India's Overall Balance of Payments (` Billion) 75
40 Standard Presentation of BoP in India as per BPM6 (US $ Million) 76
41 Standard Presentation of BoP in India as per BPM6 (` Billion) 77
42 International Investment Position 78
Payment and Settlement Systems
43 Payment System Indicators 79
Occasional Series
44 Small Savings 80
45 Ownership Pattern of Central and State Governments Securities 81
46 Combined Receipts and Disbursements of the Central and State Governments 82
Notes: .. = Not available. – = Nil/Negligible. P = Preliminary/Provisional. PR = Partially Revised.

CURRENT STATISTICS
RBI Bulletin May 2017 49
Item2016-17
11 Real Sector (% Change) 1.1 GVA at Basic Prices 6.7 1.1.1 Agriculture 4.4 1.1.2 Industry 6.7 1.1.3 Services 7.2 1.1a Final Consumption Expenditure 8.7 1.1b Gross Fixed Capital Formation 0.6
2016-17
1 1.2 Index of Industrial Production -2 Money and Banking (% Change) 2.1 Scheduled Commercial Banks 2.1.1 Deposits 15.9 2.1.2 Credit 8.7 2.1.2.1 Non-food Credit 9.6 2.1.3 Investment in Govt. Securities 15.9 2.2 Money Stock Measures 2.2.1 Reserve Money (M0) -12.9 2.2.2 Broad Money (M3) 10.63 Ratios (%) 3.1 Cash Reserve Ratio 4.00 3.2 Statutory Liquidity Ratio 20.50 3.3 Cash-Deposit Ratio 5.3 3.4 Credit-Deposit Ratio 72.9 3.5 Incremental Credit-Deposit Ratio 42.6 3.6 Investment-Deposit Ratio 28.1 3.7 Incremental Investment-Deposit Ratio 28.24 Interest Rates (%) 4.1 Policy Repo Rate 6.25 4.2 Reverse Repo Rate 5.75 4.3 Marginal Standing Facility (MSF) Rate 6.75 4.4 Bank Rate 6.75 4.5 Base Rate 9.25/9.60 4.6 MCLR 7.75/8.20 4.7 Term Deposit Rate >1 Year 6.50/7.00 4.8 Savings Deposit Rate 4.00 4.9 Call Money Rate (Weighted Average) 5.97 4.10 91-Day Treasury Bill (Primary) Yield 5.82 4.11 182-Day Treasury Bill (Primary) Yield 6.05 4.12 364-Day Treasury Bill (Primary) Yield 6.14 4.13 10-Year Government Securities Yield 7.085 RBI Reference Rate and Forward Premia 5.1 INR-US$ Spot Rate (` Per Foreign Currency) 64.84 5.2 INR-Euro Spot Rate (` Per Foreign Currency) 69.25 5.3 Forward Premia of US$ 1-month (%) 5.09 3-month (%) 4.97 6-month (%) 4.906 Inflation (%) 6.1 All India Consumer Price Index 3.8 6.2 Consumer Price Index for Industrial Workers 4.1 6.3 Wholesale Price Index 3.7 6.3.1 Primary Articles 4.7 6.3.2 Fuel and Power 5.6 6.3.3 Manufactured Products 2.67 Foreign Trade (% Change) 7.1 Imports -0.2 7.2 Exports 4.7
No. 1: Select Economic Indicators
2015-16 2016-17
Q2 Q3 Q2 Q3
2 3 4 5
8.4 7.0 6.7 6.62.3 -2.2 3.8 6.0
10.3 12.0 5.6 8.09.0 8.5 7.6 6.36.2 6.3 6.9 11.4
12.4 3.2 -5.3 3.52016 2017
Feb. Mar. Feb. Mar.2 3 4 5
1.9 0.3 -1.2 -
9.7 9.3 12.0 11.811.0 10.9 3.6 5.111.1 10.9 4.3 5.86.3 5.4 22.5 17.9
14.2 13.1 -22.2 -12.911.1 10.1 6.5 10.6
4.00 4.00 4.00 4.00
21.50 21.50 20.50 20.504.8 4.8 4.7 5.3
77.0 77.7 71.2 72.980.9 89.8 16.7 42.628.8 28.1 31.6 28.125.2 16.9 60.4 28.2
6.75 6.75 6.25 6.255.75 5.75 5.75 5.757.75 7.75 6.75 6.757.75 7.75 6.75 6.75
9.30/9.70 9.30/9.70 9.25/9.65 9.25/9.60- - 7.8/8.2 7.8/8.2
7.0/7.9 7.0/7.9 6.5/7.0 6.5/7.04.00 4.00 4.00 4.006.73 6.91 5.95 5.97
- 7.27 6.15 5.82- 7.17 6.27 6.05
7.28 7.11 6.30 6.147.61 7.34 7.19 7.08
68.78 66.86 66.84 64.8476.04 74.91 70.54 69.25
8.29 9.69 4.85 5.097.36 7.69 5.15 4.976.86 7.13 5.00 4.90
5.3 4.8 3.7 3.85.5 5.5 2.6 2.6
-0.9 -0.5 6.5 5.72.0 3.0 5.0 4.6
-7.1 -8.3 21.0 18.2-0.5 0.1 3.7 3.0
-4.5 -22.9 20.8 45.3-5.3 -4.7 17.5 27.6

CURRENT STATISTICS
RBI Bulletin May 201750
No. 2: RBI - Liabilities and Assets *
(` Billion)
L 2016 2017
Apr. Mar. 31 Apr. 7 Apr. 14 Apr. 21 Apr. 28
2 3 4 5 6 7
1
1
1. 16,979.79 13,101.81 13,365.71 13,646.19 13,923.94 14,069.52
1. 0.13 0.12 0.13 0.15 0.13 0.16
1. 16,979.92 13,101.93 13,365.84 13,646.33 13,924.07 14,069.68
2
1. 699.20 675.08 675.08 675.08 675.08 675.08
1. 16,267.43 12,422.35 12,686.37 12,967.08 13,241.04 13,386.86
1. 2.83 4.50 4.38 4.17 7.95 7.74
1. 10.46 – – – – –
2
1
2. 4,897.15 10,389.43 9,982.00 9,646.51 9,638.63 9,426.27
2. 1.01 50.00 1.00 1.01 1.01 1.00
2. – – – – 236.49 473.06
2. 0.42 0.42 0.42 0.42 0.42 0.42
2. 3,982.72 5,087.73 4,166.26 4,304.10 4,433.21 4,482.13
2. 35.87 55.13 36.49 38.35 38.60 40.82
2. 13.37 18.92 17.93 19.07 18.19 17.18
2. 212.88 279.49 252.27 254.80 255.16 253.46
2. 650.87 4,897.74 5,507.62 5,028.74 4,652.61 4,158.20
2. 9,869.16 8,411.18 8,178.01 8,212.31 8,365.50 8,326.55
2. 14,766.32 18,800.61 18,160.01 17,858.82 18,001.18 17,752.83
2
2. 0.13 0.12 0.13 0.15 0.13 0.16
2. 6,488.08 10,263.49 9,783.00 9,532.70 9,427.15 9,259.47
2.
2. – – – – 259.13 157.41
2. 18.39 12.62 9.12 5.51 10.09 8.25
2. 886.50 218.10 65.50 18.40 2.70 18.25
2. – – – – – –
2. – – – – – –
2. – – – – – –
2. – – – – – –
2. 59.69 39.91 26.65 21.25 19.64 20.73
2.
2. – – – – – –
2. – – – – – –
2. 6,483.76 7,528.11 7,528.76 7,529.40 7,530.05 7,530.60
2. 829.75 738.26 746.85 751.41 752.29 757.97
2. 635.10 613.19 613.19 613.19 613.19 613.19
Item
2016-17
1
1 Issue Department
1.1 Liabilities
1.1.1 Notes in Circulation 13,101.81
1.1.2 Notes held in Banking Department 0.12
1.1/1.2 Total Liabilities (Total Notes Issued) or Assets 13,101.93
1.2 Assets
1.2.1 Gold Coin and Bullion 675.08
1.2.2 Foreign Securities 12,422.35
1.2.3 Rupee Coin 4.50
1.2.4 Government of India Rupee Securities –
2 Banking Department
2.1 Liabilities
2.1.1 Deposits 10,389.43
2.1.1.1 Central Government 50.00
2.1.1.2 Market Stabilisation Scheme –
2.1.1.3 State Governments 0.42
2.1.1.4 Scheduled Commercial Banks 5,087.73
2.1.1.5 Scheduled State Co-operative Banks 55.13
2.1.1.6 Non-Scheduled State Co-operative Banks 18.92
2.1.1.7 Other Banks 279.49
2.1.1.8 Others 4,897.74
2.1.2 Other Liabilities 8,411.18
2.1/2.2 Total Liabilities or Assets 18,800.61
2.2 Assets
2.2.1 Notes and Coins 0.12
2.2.2 Balances held Abroad 10,263.49
2.2.3 Loans and Advances
2.2.3.1 Central Government –
2.2.3.2 State Governments 12.62
2.2.3.3 Scheduled Commercial Banks 218.10
2.2.3.4 Scheduled State Co-op.Banks –
2.2.3.5 Industrial Dev. Bank of India –
2.2.3.6 NABARD –
2.2.3.7 EXIM Bank –
2.2.3.8 Others 39.91
2.2.4 Bills Purchased and Discounted
2.2.4.1 Internal –
2.2.4.2 Government Treasury Bills –
2.2.5 Investments 7,528.11
2.2.6 Other Assets 738.26
2.2.6.1 Gold 613.19
As on the Last Friday/ Friday
* Data are provisional
Reserve Bank of India
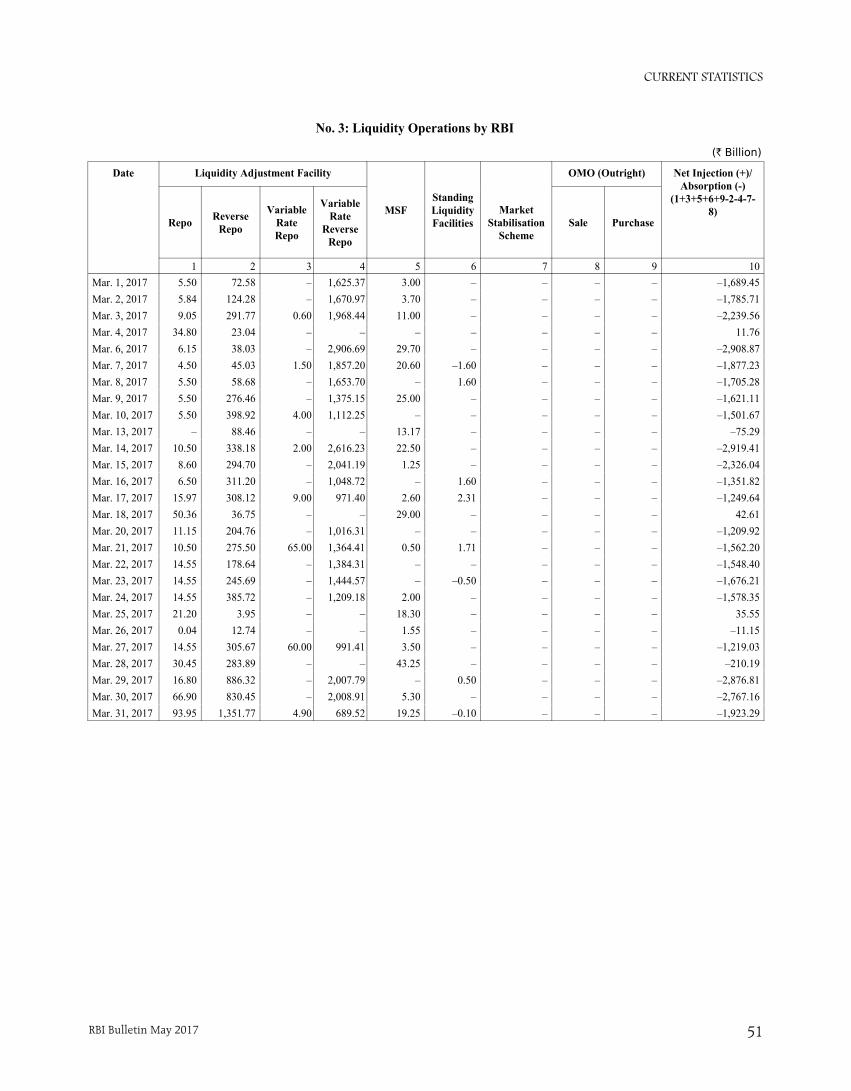
CURRENT STATISTICS
RBI Bulletin May 2017 51
No. 3: Liquidity Operations by RBI
(` Billion)
Date Liquidity Adjustment Facility
MSFStandingLiquidityFacilities
OMO (Outright) Net Injection (+)/Absorption (-)
(1+3+5+6+9-2-4-7-8)
Repo ReverseRepo
VariableRateRepo
VariableRate
ReverseRepo
MarketStabilisation
SchemeSale Purchase
1 2 3 4 5 6 7 8 9 10Mar. 1, 2017 5.50 72.58 – 1,625.37 3.00 – – – – –1,689.45Mar. 2, 2017 5.84 124.28 – 1,670.97 3.70 – – – – –1,785.71Mar. 3, 2017 9.05 291.77 0.60 1,968.44 11.00 – – – – –2,239.56Mar. 4, 2017 34.80 23.04 – – – – – – – 11.76Mar. 6, 2017 6.15 38.03 – 2,906.69 29.70 – – – – –2,908.87Mar. 7, 2017 4.50 45.03 1.50 1,857.20 20.60 –1.60 – – – –1,877.23Mar. 8, 2017 5.50 58.68 – 1,653.70 – 1.60 – – – –1,705.28Mar. 9, 2017 5.50 276.46 – 1,375.15 25.00 – – – – –1,621.11Mar. 10, 2017 5.50 398.92 4.00 1,112.25 – – – – – –1,501.67Mar. 13, 2017 – 88.46 – – 13.17 – – – – –75.29Mar. 14, 2017 10.50 338.18 2.00 2,616.23 22.50 – – – – –2,919.41Mar. 15, 2017 8.60 294.70 – 2,041.19 1.25 – – – – –2,326.04Mar. 16, 2017 6.50 311.20 – 1,048.72 – 1.60 – – – –1,351.82Mar. 17, 2017 15.97 308.12 9.00 971.40 2.60 2.31 – – – –1,249.64Mar. 18, 2017 50.36 36.75 – – 29.00 – – – – 42.61Mar. 20, 2017 11.15 204.76 – 1,016.31 – – – – – –1,209.92Mar. 21, 2017 10.50 275.50 65.00 1,364.41 0.50 1.71 – – – –1,562.20Mar. 22, 2017 14.55 178.64 – 1,384.31 – – – – – –1,548.40Mar. 23, 2017 14.55 245.69 – 1,444.57 – –0.50 – – – –1,676.21Mar. 24, 2017 14.55 385.72 – 1,209.18 2.00 – – – – –1,578.35Mar. 25, 2017 21.20 3.95 – – 18.30 – – – – 35.55Mar. 26, 2017 0.04 12.74 – – 1.55 – – – – –11.15Mar. 27, 2017 14.55 305.67 60.00 991.41 3.50 – – – – –1,219.03Mar. 28, 2017 30.45 283.89 – – 43.25 – – – – –210.19Mar. 29, 2017 16.80 886.32 – 2,007.79 – 0.50 – – – –2,876.81Mar. 30, 2017 66.90 830.45 – 2,008.91 5.30 – – – – –2,767.16Mar. 31, 2017 93.95 1,351.77 4.90 689.52 19.25 –0.10 – – – –1,923.29

CURRENT STATISTICS
RBI Bulletin May 201752
2016 2017
Mar. Feb. Mar.
2 3 4
4,686.00 1,190.00 3,538.00
8,034.00 2,201.00 5,024.00
3,348.00 1,011.00 1,486.00
309.51 80.74 233.84
10,209.00 8,813.00 12,351.00
630.89 588.33 822.17
–4,253.00 2,842.00 10,835.00
No. 4: Sale/ Purchase of U.S. Dollar by the RBI
Item2015-16
1
1 Net Purchase/ Sale of Foreign Currency (US $ Million) (1.1–1.2) 10,209.00
1.1 Purchase (+) 63,299.00
1.2 Sale (–) 53,090.00
2 equivalent at contract rate 630.89
3 Cumulative (over end-March) (US $ Million) 10,209.00
(` Billion) 630.89
4 Outstanding Net Forward Sales (–)/ Purchase (+) at the end of month (US $ Million)
–4,253.00
Item2015-16
1
1 Net Purchase/ Sale of Foreign Currency (US $ Million) (1.1–1.2) 0.00
1.1 Purchase (+) 9462.00
1.2 Sale (–) 9462.00
2 Outstanding Net Currency Futures Sales (–)/ Purchase (+) at the end of month (US $ Million)
0.00
2016 2017
Mar. Feb. Mar.
2 3 4
970.00 0.00 0.00
970.00 0.00 0.00
0.00 0.00 0.00
0.00 0.00 0.00
i) Operations in OTC segment
ii) Operations in currency futures segment
` (` Billion)

CURRENT STATISTICS
RBI Bulletin May 2017 53
Item As on March 31, 2017
Long (+) Short (-) Net (1-2)
1 2 3
1. Upto 1 month 1,185 1,185 0
2. More than 1 month and upto 3 months 5,303 3,597 1,706
3. More than 3 months and upto 1 year 14,616 3,354 11,262
4. More than 1 year 0 2,133 -2,133
Total (1+2+3+4) 21,104 10,269 10,835
No. 4 A : Maturity Breakdown (by Residual Maturity) of OutstandingForwards of RBI (US $ Million)
No. 5: RBI's Standing Facilities
Item
2016-17
1
1 MSF 19.3
2 Export Credit Refinance for Scheduled Banks
2.1 Limit –
2.2 Outstanding –
3 Liquidity Facility for PDs
3.1 Limit 28.0
3.2 Outstanding 14.8
4 Others
4.1 Limit –
4.2 Outstanding –
5 Total Outstanding (1+2.2+3.2+4.2) 34.1
(` Billion)
2016 2017
Apr. 29 Nov. 25 Dec. 23 Jan. 20 Feb. 17 Mar. 31 Apr. 28
2 3 4 5 6 7 8
12.5 4.8 4.2 – – 19.3 2.9
– – – – – – –
– – – – – – –
28.0 28.0 28.0 28.0 28.0 28.0 28.0
27.6 11.7 12.3 12.3 10.6 14.8 11.6
– – – – – – –
– – – – – – –
40.1 16.4 16.4 12.3 10.6 34.1 14.5
As on the Last Reporting Friday
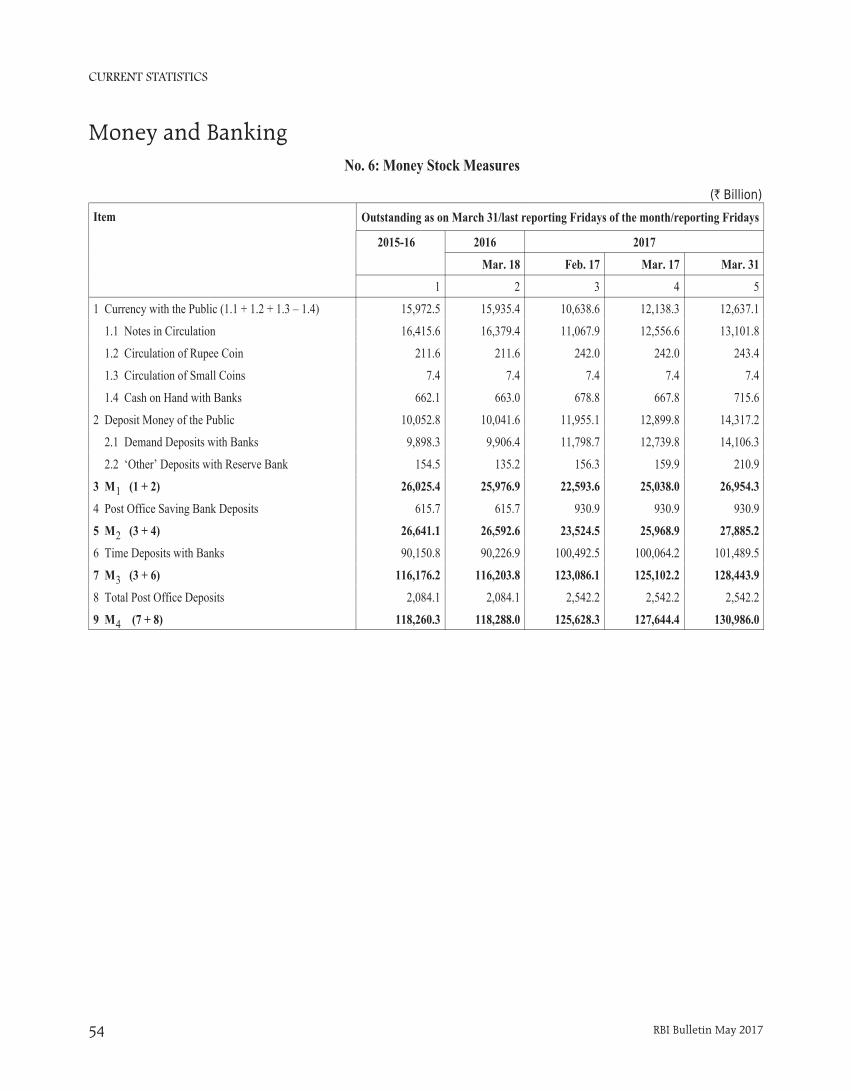
CURRENT STATISTICS
RBI Bulletin May 201754
Money and Banking
Item
2015-16 2016 2017
Mar. 18 Feb. 17 Mar. 17 Mar. 31
1 2 3 4 5
1 Currency with the Public (1.1 + 1.2 + 1.3 – 1.4) 15,972.5 15,935.4 10,638.6 12,138.3 12,637.1
1.1 Notes in Circulation 16,415.6 16,379.4 11,067.9 12,556.6 13,101.8
1.2 Circulation of Rupee Coin 211.6 211.6 242.0 242.0 243.4
1.3 Circulation of Small Coins 7.4 7.4 7.4 7.4 7.4
1.4 Cash on Hand with Banks 662.1 663.0 678.8 667.8 715.6
2 Deposit Money of the Public 10,052.8 10,041.6 11,955.1 12,899.8 14,317.2
2.1 Demand Deposits with Banks 9,898.3 9,906.4 11,798.7 12,739.8 14,106.3
2.2 ‘Other’ Deposits with Reserve Bank 154.5 135.2 156.3 159.9 210.9
3 M (1 + 2) 26,025.4 25,976.9 22,593.6 25,038.0 26,954.3
4 Post Office Saving Bank Deposits 615.7 615.7 930.9 930.9 930.9
5 M (3 + 4) 26,641.1 26,592.6 23,524.5 25,968.9 27,885.2
6 Time Deposits with Banks 90,150.8 90,226.9 100,492.5 100,064.2 101,489.5
7 M (3 + 6) 116,176.2 116,203.8 123,086.1 125,102.2 128,443.9
8 Total Post Office Deposits 2,084.1 2,084.1 2,542.2 2,542.2 2,542.2
9 M (7 + 8) 118,260.3 118,288.0 125,628.3 127,644.4 130,986.0
No. 6: Money Stock Measures
(` Billion)
Outstanding as on March 31/last reporting Fridays of the month/reporting Fridays
1
2
3
4
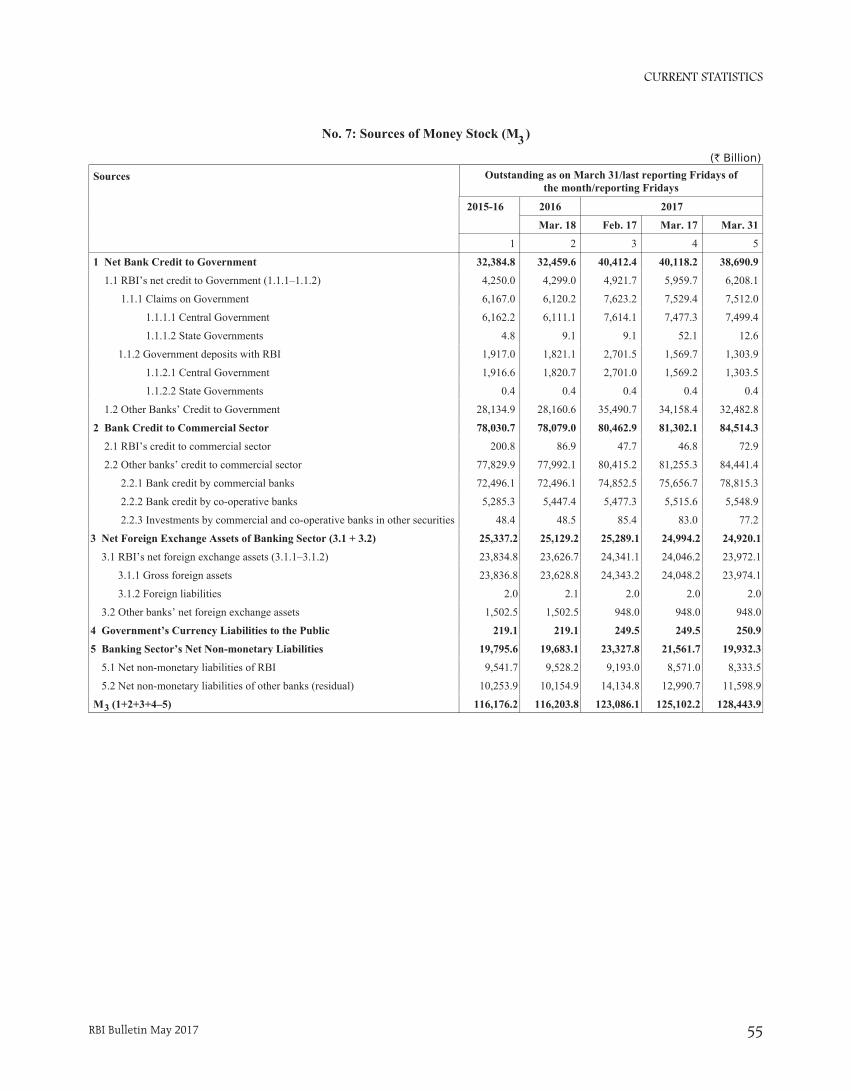
CURRENT STATISTICS
RBI Bulletin May 2017 55
No. 7: Sources of Money Stock (M )
Sources
2015-16 2016 2017
Mar. 18 Feb. 17 Mar. 17 Mar. 31
1 2 3 4 5
1 Net Bank Credit to Government 32,384.8 32,459.6 40,412.4 40,118.2 38,690.9
1.1 RBI’s net credit to Government (1.1.1–1.1.2) 4,250.0 4,299.0 4,921.7 5,959.7 6,208.1
1.1.1 Claims on Government 6,167.0 6,120.2 7,623.2 7,529.4 7,512.0
1.1.1.1 Central Government 6,162.2 6,111.1 7,614.1 7,477.3 7,499.4
1.1.1.2 State Governments 4.8 9.1 9.1 52.1 12.6
1.1.2 Government deposits with RBI 1,917.0 1,821.1 2,701.5 1,569.7 1,303.9
1.1.2.1 Central Government 1,916.6 1,820.7 2,701.0 1,569.2 1,303.5
1.1.2.2 State Governments 0.4 0.4 0.4 0.4 0.4
1.2 Other Banks’ Credit to Government 28,134.9 28,160.6 35,490.7 34,158.4 32,482.8
2 Bank Credit to Commercial Sector 78,030.7 78,079.0 80,462.9 81,302.1 84,514.3
2.1 RBI’s credit to commercial sector 200.8 86.9 47.7 46.8 72.9
2.2 Other banks’ credit to commercial sector 77,829.9 77,992.1 80,415.2 81,255.3 84,441.4
2.2.1 Bank credit by commercial banks 72,496.1 72,496.1 74,852.5 75,656.7 78,815.3
2.2.2 Bank credit by co-operative banks 5,285.3 5,447.4 5,477.3 5,515.6 5,548.9
2.2.3 Investments by commercial and co-operative banks in other securities 48.4 48.5 85.4 83.0 77.2
3 Net Foreign Exchange Assets of Banking Sector (3.1 + 3.2) 25,337.2 25,129.2 25,289.1 24,994.2 24,920.1
3.1 RBI’s net foreign exchange assets (3.1.1–3.1.2) 23,834.8 23,626.7 24,341.1 24,046.2 23,972.1
3.1.1 Gross foreign assets 23,836.8 23,628.8 24,343.2 24,048.2 23,974.1
3.1.2 Foreign liabilities 2.0 2.1 2.0 2.0 2.0
3.2 Other banks’ net foreign exchange assets 1,502.5 1,502.5 948.0 948.0 948.0
4 Government’s Currency Liabilities to the Public 219.1 219.1 249.5 249.5 250.9
5 Banking Sector’s Net Non-monetary Liabilities 19,795.6 19,683.1 23,327.8 21,561.7 19,932.3
5.1 Net non-monetary liabilities of RBI 9,541.7 9,528.2 9,193.0 8,571.0 8,333.5
5.2 Net non-monetary liabilities of other banks (residual) 10,253.9 10,154.9 14,134.8 12,990.7 11,598.9
M (1+2+3+4–5) 116,176.2 116,203.8 123,086.1 125,102.2 128,443.9
(` Billion)
Outstanding as on March 31/last reporting Fridays ofthe month/reporting Fridays
3
3
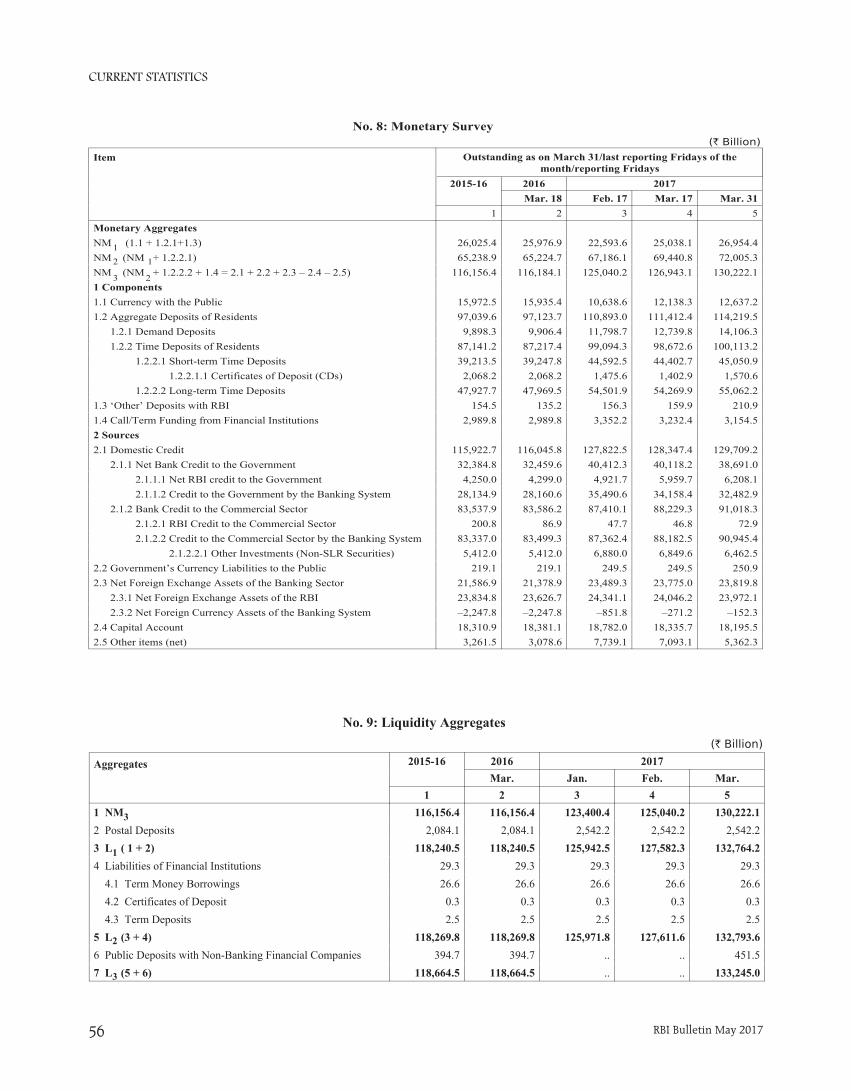
CURRENT STATISTICS
RBI Bulletin May 201756
No. 8: Monetary Survey
Item
2015-16 2016 2017Mar. 18 Feb. 17 Mar. 17 Mar. 31
1 2 3 4 5Monetary AggregatesNM1 (1.1 + 1.2.1+1.3) 26,025.4 25,976.9 22,593.6 25,038.1 26,954.4NM (NM + 1.2.2.1) 65,238.9 65,224.7 67,186.1 69,440.8 72,005.3NM (NM + 1.2.2.2 + 1.4 = 2.1 + 2.2 + 2.3 – 2.4 – 2.5) 116,156.4 116,184.1 125,040.2 126,943.1 130,222.11 Components1.1 Currency with the Public 15,972.5 15,935.4 10,638.6 12,138.3 12,637.21.2 Aggregate Deposits of Residents 97,039.6 97,123.7 110,893.0 111,412.4 114,219.5 1.2.1 Demand Deposits 9,898.3 9,906.4 11,798.7 12,739.8 14,106.3 1.2.2 Time Deposits of Residents 87,141.2 87,217.4 99,094.3 98,672.6 100,113.2 1.2.2.1 Short-term Time Deposits 39,213.5 39,247.8 44,592.5 44,402.7 45,050.9 1.2.2.1.1 Certificates of Deposit (CDs) 2,068.2 2,068.2 1,475.6 1,402.9 1,570.6 1.2.2.2 Long-term Time Deposits 47,927.7 47,969.5 54,501.9 54,269.9 55,062.21.3 ‘Other’ Deposits with RBI 154.5 135.2 156.3 159.9 210.91.4 Call/Term Funding from Financial Institutions 2,989.8 2,989.8 3,352.2 3,232.4 3,154.52 Sources2.1 Domestic Credit 115,922.7 116,045.8 127,822.5 128,347.4 129,709.2 2.1.1 Net Bank Credit to the Government 32,384.8 32,459.6 40,412.3 40,118.2 38,691.0 2.1.1.1 Net RBI credit to the Government 4,250.0 4,299.0 4,921.7 5,959.7 6,208.1 2.1.1.2 Credit to the Government by the Banking System 28,134.9 28,160.6 35,490.6 34,158.4 32,482.9 2.1.2 Bank Credit to the Commercial Sector 83,537.9 83,586.2 87,410.1 88,229.3 91,018.3 2.1.2.1 RBI Credit to the Commercial Sector 200.8 86.9 47.7 46.8 72.9 2.1.2.2 Credit to the Commercial Sector by the Banking System 83,337.0 83,499.3 87,362.4 88,182.5 90,945.4 2.1.2.2.1 Other Investments (Non-SLR Securities) 5,412.0 5,412.0 6,880.0 6,849.6 6,462.52.2 Government’s Currency Liabilities to the Public 219.1 219.1 249.5 249.5 250.92.3 Net Foreign Exchange Assets of the Banking Sector 21,586.9 21,378.9 23,489.3 23,775.0 23,819.8 2.3.1 Net Foreign Exchange Assets of the RBI 23,834.8 23,626.7 24,341.1 24,046.2 23,972.1 2.3.2 Net Foreign Currency Assets of the Banking System –2,247.8 –2,247.8 –851.8 –271.2 –152.32.4 Capital Account 18,310.9 18,381.1 18,782.0 18,335.7 18,195.52.5 Other items (net) 3,261.5 3,078.6 7,739.1 7,093.1 5,362.3
(` Billion)
Outstanding as on March 31/last reporting Fridays of themonth/reporting Fridays
12
3
1
2
No. 9: Liquidity Aggregates(` Billion)
Aggregates 2015-16 2016 2017Mar. Jan. Feb. Mar.
1 2 3 4 51 NM 116,156.4 116,156.4 123,400.4 125,040.2 130,222.1
2 Postal Deposits 2,084.1 2,084.1 2,542.2 2,542.2 2,542.23 L ( 1 + 2) 118,240.5 118,240.5 125,942.5 127,582.3 132,764.2
4 Liabilities of Financial Institutions 29.3 29.3 29.3 29.3 29.3 4.1 Term Money Borrowings 26.6 26.6 26.6 26.6 26.6 4.2 Certificates of Deposit 0.3 0.3 0.3 0.3 0.3 4.3 Term Deposits 2.5 2.5 2.5 2.5 2.55 L (3 + 4) 118,269.8 118,269.8 125,971.8 127,611.6 132,793.6
6 Public Deposits with Non-Banking Financial Companies 394.7 394.7 .. .. 451.57 L (5 + 6) 118,664.5 118,664.5 .. .. 133,245.0
1
2
3
3

CURRENT STATISTICS
RBI Bulletin May 2017 57
No. 10: Reserve Bank of India Survey
Item
2015-16 2016 2017Mar. 18 Feb. 17 Mar. 17 Mar. 31
1 2 3 4 51 Components1.1 Currency in Circulation 16,634.6 16,598.4 11,317.4 12,806.0 13,352.71.2 Bankers’ Deposits with the RBI 5,018.3 4,128.6 4,589.8 4,563.7 5,441.3 1.2.1 Scheduled Commercial Banks 4,738.7 3,874.4 4,282.4 4,256.9 5,087.71.3 ‘Other’ Deposits with the RBI 154.5 135.2 156.3 159.9 210.9Reserve Money (1.1 + 1.2 + 1.3 = 2.1 + 2.2 + 2.3 – 2.4 – 2.5) 21,807.4 20,862.2 16,063.5 17,529.7 19,004.82 Sources2.1 RBI’s Domestic Credit 7,295.3 6,544.6 665.9 1,805.0 3,115.3 2.1.1 Net RBI credit to the Government 4,250.0 4,299.0 4,921.7 5,959.7 6,208.1 2.1.1.1 Net RBI credit to the Central Government (2.1.1.1.1 + 2.1.1.1.2 + 2.1.1.1.3 + 2.1.1.1.4 – 2.1.1.1.5) 4,245.6 4,290.4 4,913.0 5,908.1 6,195.9
2.1.1.1.1 Loans and Advances to the Central Government – – – – – 2.1.1.1.2 Investments in Treasury Bills – – – – – 2.1.1.1.3 Investments in dated Government Securities 6,159.5 6,109.5 7,609.8 7,472.3 7,494.9 2.1.1.1.3.1 Central Government Securities 6,149.0 6,099.0 7,609.8 7,472.3 7,494.9 2.1.1.1.4 Rupee Coins 2.8 1.6 4.3 5.0 4.5 2.1.1.1.5 Deposits of the Central Government 1,916.6 1,820.7 2,701.0 1,569.2 1,303.5 2.1.1.2 Net RBI credit to State Governments 4.3 8.7 8.7 51.7 12.2 2.1.2 RBI’s Claims on Banks 2,844.5 2,158.7 -4,303.5 -4,201.5 -3,165.7 2.1.2.1 Loans and Advances to Scheduled Commercial Banks 2,844.5 2,158.7 -4,303.5 -4,201.5 -3,165.7 2.1.3 RBI’s Credit to Commercial Sector 200.8 86.9 47.7 46.8 72.9 2.1.3.1 Loans and Advances to Primary Dealers 27.0 27.7 10.6 13.2 14.8 2.1.3.2 Loans and Advances to NABARD – – – – –2.2 Government’s Currency Liabilities to the Public 219.1 219.1 249.5 249.5 250.92.3 Net Foreign Exchange Assets of the RBI 23,834.8 23,626.7 24,341.1 24,046.2 23,972.1 2.3.1 Gold 1,334.3 1,326.0 1,305.3 1,329.0 1,288.3 2.3.2 Foreign Currency Assets 22,500.6 22,300.9 23,036.0 22,717.4 22,684.02.4 Capital Account 8,728.0 8,798.3 8,279.5 7,801.0 7,512.82.5 Other Items (net) 813.7 729.9 913.5 770.0 820.6
(` Billion)
Outstanding as on March 31/last reporting Fridays of themonth/reporting Fridays
No. 11: Reserve Money - Components and Sources
Item
2015-16 2016 2017Apr. 1 Feb. 24 Mar. 10 Mar. 17 Mar. 24 Mar. 31
1 2 3 4 5 6 7
Reserve Money(1.1 + 1.2 + 1.3 = 2.1 + 2.2 + 2.3 + 2.4 + 2.5 – 2.6) 21,807.4 21,811.1 16,464.0 17,463.5 17,529.7 17,848.5 19,004.8
1 Components1.1 Currency in Circulation 16,634.6 16,634.6 11,644.8 12,461.5 12,806.0 13,130.7 13,352.71.2 Bankers' Deposits with RBI 5,018.3 5,025.6 4,661.4 4,841.4 4,563.7 4,545.4 5,441.31.3 ‘Other’ Deposits with RBI 154.5 150.8 157.7 160.6 159.9 172.4 210.92 Sources2.1 Net Reserve Bank Credit to Government 4,250.0 4,253.3 5,456.9 6,520.9 5,959.7 6,284.8 6,208.12.2 Reserve Bank Credit to Banks 2,844.5 2,844.5 -4,453.5 -4,759.9 -4,201.5 -4,251.6 -3,165.72.3 Reserve Bank Credit to Commercial Sector 200.8 200.8 46.1 37.9 46.8 52.1 72.92.4 Net Foreign Exchange Assets of RBI 23,834.8 23,807.1 24,273.1 24,289.2 24,046.2 24,092.2 23,972.12.5 Government's Currency Liabilities to the Public 219.1 219.1 249.5 249.5 249.5 249.5 250.92.6 Net Non- Monetary Liabilities of RBI 9,541.7 9,513.8 9,108.1 8,874.1 8,571.0 8,578.5 8,333.5
(` Billion)
Outstanding as on March 31/ last Fridays of the month/ Fridays

CURRENT STATISTICS
RBI Bulletin May 201758
No. 13: Scheduled Commercial Banks' Investments
(` Billion)
Item As onMarch 31,
2017
2016 2017
Mar. 18 Feb. 17 Mar. 17 Mar. 31
1 2 3 4 51 SLR Securities 30,433.3 26,255.1 33,277.0 32,076.6 30,433.32 Commercial Paper 1,157.7 817.9 1,315.1 1,338.7 1,157.73 Shares issued by 3.1 PSUs 92.0 77.1 90.7 88.4 92.0 3.2 Private Corporate Sector 568.0 435.5 522.6 539.0 568.0 3.3 Others 51.8 55.9 44.7 50.1 51.84 Bonds/Debentures issued by 4.1 PSUs 1,068.0 930.7 1,148.1 1,038.6 1,068.0 4.2 Private Corporate Sector 1,681.5 1,324.4 1,479.8 1,535.5 1,681.5 4.3 Others 806.2 511.2 690.5 725.9 806.25 Instruments issued by 5.1 Mutual funds 122.2 641.7 916.9 696.3 122.2 5.2 Financial institutions 825.6 629.0 680.5 747.4 825.6
No. 12: Commercial Bank Survey
Item
2015-16 2016 2017Mar. 18 Feb. 17 Mar. 17 Mar. 31
1 2 3 4 51 Components1.1 Aggregate Deposits of Residents 90,263.3 90,263.3 103,469.1 104,028.9 106,728.9 1.1.1 Demand Deposits 8,890.0 8,890.0 10,666.2 11,612.3 12,953.3 1.1.2 Time Deposits of Residents 81,373.4 81,373.4 92,802.9 92,416.6 93,775.6 1.1.2.1 Short-term Time Deposits 36,618.0 36,618.0 41,761.3 41,587.5 42,199.0 1.1.2.1.1 Certificates of Deposits (CDs) 2,068.2 2,068.2 1,475.6 1,402.9 1,570.61.1.2.2 Long-term Time Deposits 44,755.4 44,755.4 51,041.6 50,829.1 51,576.61.2 Call/Term Funding from Financial Institutions 2,989.8 2,989.8 3,352.2 3,232.4 3,154.52 Sources2.1 Domestic Credit 104,171.4 104,171.4 115,105.0 114,573.4 115,665.6 2.1.1 Credit to the Government 26,239.3 26,239.3 33,373.8 32,061.2 30,422.4 2.1.2 Credit to the Commercial Sector 77,932.1 77,932.1 81,731.1 82,512.1 85,243.2 2.1.2.1 Bank Credit 72,496.1 72,496.1 74,852.5 75,656.7 78,815.3 2.1.2.1.1 Non-food Credit 71,443.6 71,443.6 73,797.1 75,098.1 78,279.6 2.1.2.2 Net Credit to Primary Dealers 97.8 97.8 69.9 80.2 44.2 2.1.2.3 Investments in Other Approved Securities 15.8 15.8 18.4 15.3 10.9 2.1.2.4 Other Investments (in non-SLR Securities) 5,322.4 5,322.4 6,790.4 6,759.9 6,372.92.2 Net Foreign Currency Assets of Commercial Banks (2.2.1–2.2.2–2.2.3) –2,247.8 –2,247.8 –851.8 –271.2 –152.3 2.2.1 Foreign Currency Assets 1,847.4 1,847.4 1,385.2 1,898.9 1,983.5 2.2.2 Non-resident Foreign Currency Repatriable Fixed Deposits 3,009.6 3,009.6 1,398.1 1,391.5 1,376.3 2.2.3 Overseas Foreign Currency Borrowings 1,085.6 1,085.6 839.0 778.6 759.52.3 Net Bank Reserves (2.3.1+2.3.2–2.3.3) 2,290.1 2,290.1 9,163.6 9,024.7 8,871.2 2.3.1 Balances with the RBI 3,874.4 3,874.4 4,282.4 4,256.9 5,087.7 2.3.2 Cash in Hand 574.4 574.4 577.8 566.3 617.7 2.3.3 Loans and Advances from the RBI 2,158.7 2,158.7 –4,303.5 –4,201.5 –3,165.72.4 Capital Account 9,341.1 9,341.1 10,260.8 10,293.0 10,441.02.5 Other items (net) (2.1+2.2+2.3–2.4–1.1–1.2) 1,619.5 1,619.5 6,334.6 5,772.6 4,060.1 2.5.1 Other Demand and Time Liabilities (net of 2.2.3) 3,954.8 3,954.8 4,031.6 4,443.0 3,995.0 2.5.2 Net Inter-Bank Liabilities (other than to PDs) –256.0 –256.0 –366.7 –267.7 –108.8
(` Billion)
Outstanding as on last reporting Fridays of the month/reporting Fridays of the month
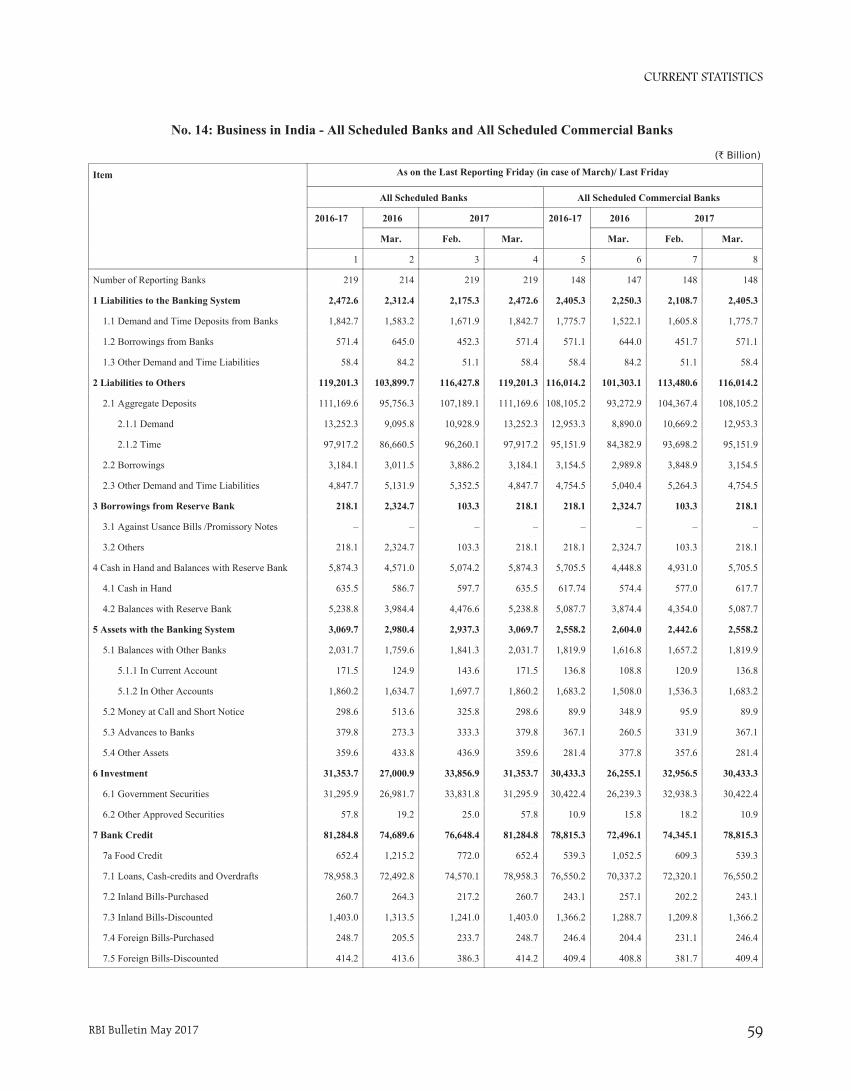
CURRENT STATISTICS
RBI Bulletin May 2017 59
No. 14: Business in India - All Scheduled Banks and All Scheduled Commercial Banks
(` Billion)
All Scheduled Commercial Banks
2016-17 2016 2017
Mar. Feb. Mar.
5 6 7 8
148 147 148 148
2,405.3 2,250.3 2,108.7 2,405.3
1,775.7 1,522.1 1,605.8 1,775.7
571.1 644.0 451.7 571.1
58.4 84.2 51.1 58.4
116,014.2 101,303.1 113,480.6 116,014.2
108,105.2 93,272.9 104,367.4 108,105.2
12,953.3 8,890.0 10,669.2 12,953.3
95,151.9 84,382.9 93,698.2 95,151.9
3,154.5 2,989.8 3,848.9 3,154.5
4,754.5 5,040.4 5,264.3 4,754.5
218.1 2,324.7 103.3 218.1
– – – –
218.1 2,324.7 103.3 218.1
5,705.5 4,448.8 4,931.0 5,705.5
617.74 574.4 577.0 617.7
5,087.7 3,874.4 4,354.0 5,087.7
2,558.2 2,604.0 2,442.6 2,558.2
1,819.9 1,616.8 1,657.2 1,819.9
136.8 108.8 120.9 136.8
1,683.2 1,508.0 1,536.3 1,683.2
89.9 348.9 95.9 89.9
367.1 260.5 331.9 367.1
281.4 377.8 357.6 281.4
30,433.3 26,255.1 32,956.5 30,433.3
30,422.4 26,239.3 32,938.3 30,422.4
10.9 15.8 18.2 10.9
78,815.3 72,496.1 74,345.1 78,815.3
539.3 1,052.5 609.3 539.3
76,550.2 70,337.2 72,320.1 76,550.2
243.1 257.1 202.2 243.1
1,366.2 1,288.7 1,209.8 1,366.2
246.4 204.4 231.1 246.4
409.4 408.8 381.7 409.4
Item
All Scheduled Banks
2016-17 2016 2017
Mar. Feb. Mar.
1 2 3 4
Number of Reporting Banks 219 214 219 219
1 Liabilities to the Banking System 2,472.6 2,312.4 2,175.3 2,472.6
1.1 Demand and Time Deposits from Banks 1,842.7 1,583.2 1,671.9 1,842.7
1.2 Borrowings from Banks 571.4 645.0 452.3 571.4
1.3 Other Demand and Time Liabilities 58.4 84.2 51.1 58.4
2 Liabilities to Others 119,201.3 103,899.7 116,427.8 119,201.3
2.1 Aggregate Deposits 111,169.6 95,756.3 107,189.1 111,169.6
2.1.1 Demand 13,252.3 9,095.8 10,928.9 13,252.3
2.1.2 Time 97,917.2 86,660.5 96,260.1 97,917.2
2.2 Borrowings 3,184.1 3,011.5 3,886.2 3,184.1
2.3 Other Demand and Time Liabilities 4,847.7 5,131.9 5,352.5 4,847.7
3 Borrowings from Reserve Bank 218.1 2,324.7 103.3 218.1
3.1 Against Usance Bills /Promissory Notes – – – –
3.2 Others 218.1 2,324.7 103.3 218.1
4 Cash in Hand and Balances with Reserve Bank 5,874.3 4,571.0 5,074.2 5,874.3
4.1 Cash in Hand 635.5 586.7 597.7 635.5
4.2 Balances with Reserve Bank 5,238.8 3,984.4 4,476.6 5,238.8
5 Assets with the Banking System 3,069.7 2,980.4 2,937.3 3,069.7
5.1 Balances with Other Banks 2,031.7 1,759.6 1,841.3 2,031.7
5.1.1 In Current Account 171.5 124.9 143.6 171.5
5.1.2 In Other Accounts 1,860.2 1,634.7 1,697.7 1,860.2
5.2 Money at Call and Short Notice 298.6 513.6 325.8 298.6
5.3 Advances to Banks 379.8 273.3 333.3 379.8
5.4 Other Assets 359.6 433.8 436.9 359.6
6 Investment 31,353.7 27,000.9 33,856.9 31,353.7
6.1 Government Securities 31,295.9 26,981.7 33,831.8 31,295.9
6.2 Other Approved Securities 57.8 19.2 25.0 57.8
7 Bank Credit 81,284.8 74,689.6 76,648.4 81,284.8
7a Food Credit 652.4 1,215.2 772.0 652.4
7.1 Loans, Cash-credits and Overdrafts 78,958.3 72,492.8 74,570.1 78,958.3
7.2 Inland Bills-Purchased 260.7 264.3 217.2 260.7
7.3 Inland Bills-Discounted 1,403.0 1,313.5 1,241.0 1,403.0
7.4 Foreign Bills-Purchased 248.7 205.5 233.7 248.7
7.5 Foreign Bills-Discounted 414.2 413.6 386.3 414.2
As on the Last Reporting Friday (in case of March)/ Last Friday

CURRENT STATISTICS
RBI Bulletin May 201760
No. 15: Deployment of Gross Bank Credit by Major Sectors
(` Billion)
Item Outstanding as on Growth (%)
Mar. 18,2016
2016 2017 Financialyear so far
Y-o-Y
Mar. 18 Feb. 17 Mar. 31 2016-17 2017
1 2 3 4 5 61 Gross Bank Credit 66,500 66,500 67,754 71,398 7.4 7.4
1.1 Food Credit 1,031 1,031 886 36 –96.5 -96.5
1.2 Non-food Credit 65,469 65,469 66,867 71,361 9.0 9.0
1.2.1 Agriculture & Allied Activities 8,829 8,829 9,330 9,925 12.4 12.4
1.2.2 Industry 27,307 27,307 26,014 26,779 –1.9 -1.9
1.2.2.1 Micro & Small 3,715 3,715 3,562 3,699 –0.4 -0.4
1.2.2.2 Medium 1,148 1,148 1,005 1,049 –8.7 -8.7
1.2.2.3 Large 22,444 22,444 21,448 22,031 –1.8 -1.8
1.2.3 Services 15,411 15,411 16,120 18,416 19.5 19.5
1.2.3.1 Transport Operators 997 997 1,039 1,104 10.7 10.7
1.2.3.2 Computer Software 191 191 174 179 –6.3 -6.3
1.2.3.3 Tourism, Hotels & Restaurants 371 371 380 375 1.2 1.2
1.2.3.4 Shipping 104 104 118 116 11.7 11.7
1.2.3.5 Professional Services 1,046 1,046 1,243 1,380 32.0 32.0
1.2.3.6 Trade 3,811 3,811 3,943 4,280 12.3 12.3
1.2.3.6.1 Wholesale Trade 1,686 1,686 1,800 1,933 14.6 14.6
1.2.3.6.2 Retail Trade 2,125 2,125 2,143 2,347 10.5 10.5
1.2.3.7 Commercial Real Estate 1,776 1,776 1,781 1,856 4.5 4.5
1.2.3.8 Non-Banking Financial Companies (NBFCs) 3,527 3,527 3,195 3,910 10.9 10.9
1.2.3.9 Other Services 3,587 3,587 4,247 5,214 45.4 45.4
1.2.4 Personal Loans 13,922 13,922 15,403 16,242 16.7 16.7
1.2.4.1 Consumer Durables 178 178 202 208 17.2 17.2
1.2.4.2 Housing 7,468 7,468 8,202 8,601 15.2 15.2
1.2.4.3 Advances against Fixed Deposits 667 667 588 661 –0.9 -0.9
1.2.4.4 Advances to Individuals against share & bonds 64 64 49 54 –16.4 -16.4
1.2.4.5 Credit Card Outstanding 377 377 493 521 38.4 38.4
1.2.4.6 Education 682 682 720 701 2.7 2.7
1.2.4.7 Vehicle Loans 1,529 1,529 1,692 1,721 12.5 12.5
1.2.4.8 Other Personal Loans 2,958 2,958 3,456 3,775 27.6 27.6
1.2A Priority Sector 22,259 22,259 22,889 24,364 9.5 9.5
1.2A.1 Agriculture & Allied Activities 8,826 8,826 9,302 9,910 12.3 12.3
1.2A.2 Micro & Small Enterprises 8,476 8,476 8,437 9,026 6.5 6.5
1.2A.2.1 Manufacturing 3,715 3,715 3,562 3,713 –0.1 -0.1
1.2A.2.2 Services 4,761 4,761 4,875 5,314 11.6 11.6
1.2A.3 Housing 3,423 3,423 3,572 3,684 7.6 7.6
1.2A.4 Micro-Credit 188 188 185 189 0.5 0.5
1.2A.5 Education Loans 601 601 611 604 0.5 0.5
1.2A.6 State-Sponsored Orgs. for SC/ST 5 5 6 6 24.1 24.1
1.2A.7 Weaker Sections 4,774 4,774 5,208 5,542 16.1 16.1
1.2A.8 Export Credit 424 424 435 425 0.3 0.3
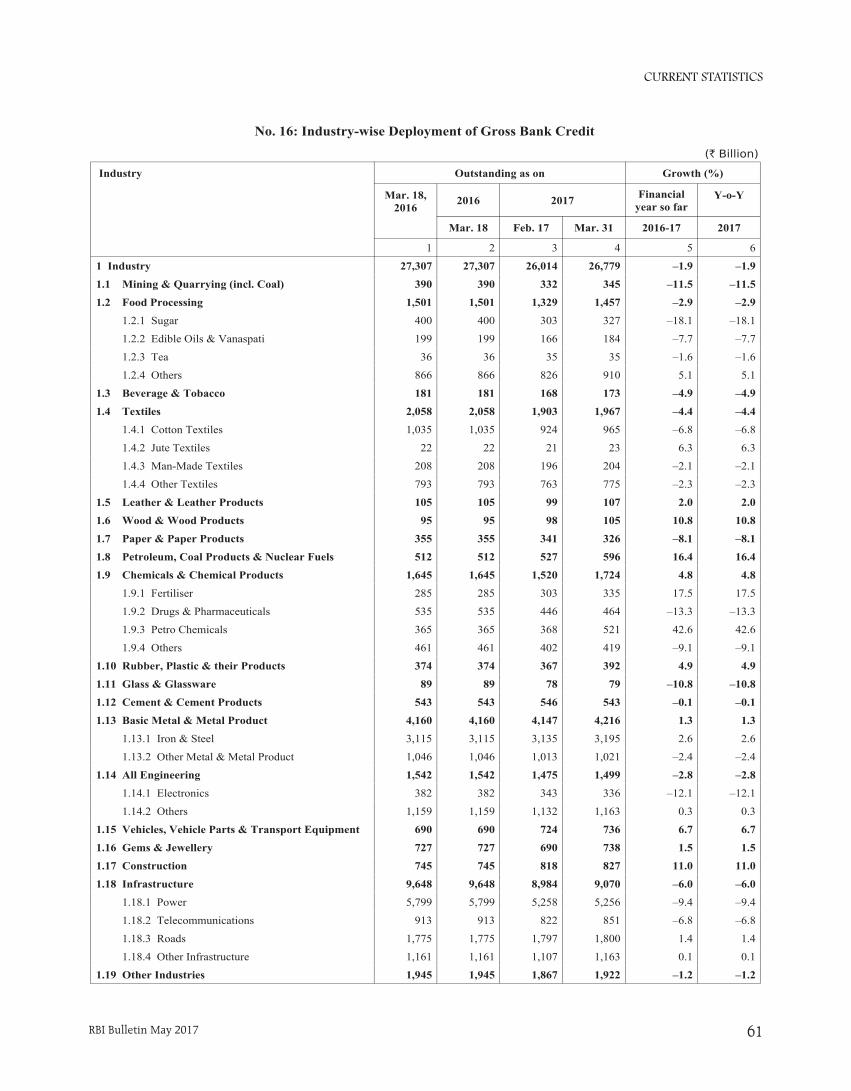
CURRENT STATISTICS
RBI Bulletin May 2017 61
No. 16: Industry-wise Deployment of Gross Bank Credit
(` Billion)
Industry Outstanding as on Growth (%)
Mar. 18,2016
2016 2017 Financialyear so far
Y-o-Y
Mar. 18 Feb. 17 Mar. 31 2016-17 2017
1 2 3 4 5 6
1 Industry 27,307 27,307 26,014 26,779 –1.9 –1.9
1.1 Mining & Quarrying (incl. Coal) 390 390 332 345 –11.5 –11.5
1.2 Food Processing 1,501 1,501 1,329 1,457 –2.9 –2.9
1.2.1 Sugar 400 400 303 327 –18.1 –18.1
1.2.2 Edible Oils & Vanaspati 199 199 166 184 –7.7 –7.7
1.2.3 Tea 36 36 35 35 –1.6 –1.6
1.2.4 Others 866 866 826 910 5.1 5.1
1.3 Beverage & Tobacco 181 181 168 173 –4.9 –4.9
1.4 Textiles 2,058 2,058 1,903 1,967 –4.4 –4.4
1.4.1 Cotton Textiles 1,035 1,035 924 965 –6.8 –6.8
1.4.2 Jute Textiles 22 22 21 23 6.3 6.3
1.4.3 Man-Made Textiles 208 208 196 204 –2.1 –2.1
1.4.4 Other Textiles 793 793 763 775 –2.3 –2.3
1.5 Leather & Leather Products 105 105 99 107 2.0 2.0
1.6 Wood & Wood Products 95 95 98 105 10.8 10.8
1.7 Paper & Paper Products 355 355 341 326 –8.1 –8.1
1.8 Petroleum, Coal Products & Nuclear Fuels 512 512 527 596 16.4 16.4
1.9 Chemicals & Chemical Products 1,645 1,645 1,520 1,724 4.8 4.8
1.9.1 Fertiliser 285 285 303 335 17.5 17.5
1.9.2 Drugs & Pharmaceuticals 535 535 446 464 –13.3 –13.3
1.9.3 Petro Chemicals 365 365 368 521 42.6 42.6
1.9.4 Others 461 461 402 419 –9.1 –9.1
1.10 Rubber, Plastic & their Products 374 374 367 392 4.9 4.9
1.11 Glass & Glassware 89 89 78 79 –10.8 –10.8
1.12 Cement & Cement Products 543 543 546 543 –0.1 –0.1
1.13 Basic Metal & Metal Product 4,160 4,160 4,147 4,216 1.3 1.3
1.13.1 Iron & Steel 3,115 3,115 3,135 3,195 2.6 2.6
1.13.2 Other Metal & Metal Product 1,046 1,046 1,013 1,021 –2.4 –2.4
1.14 All Engineering 1,542 1,542 1,475 1,499 –2.8 –2.8
1.14.1 Electronics 382 382 343 336 –12.1 –12.1
1.14.2 Others 1,159 1,159 1,132 1,163 0.3 0.3
1.15 Vehicles, Vehicle Parts & Transport Equipment 690 690 724 736 6.7 6.7
1.16 Gems & Jewellery 727 727 690 738 1.5 1.5
1.17 Construction 745 745 818 827 11.0 11.0
1.18 Infrastructure 9,648 9,648 8,984 9,070 –6.0 –6.0
1.18.1 Power 5,799 5,799 5,258 5,256 –9.4 –9.4
1.18.2 Telecommunications 913 913 822 851 –6.8 –6.8
1.18.3 Roads 1,775 1,775 1,797 1,800 1.4 1.4
1.18.4 Other Infrastructure 1,161 1,161 1,107 1,163 0.1 0.1
1.19 Other Industries 1,945 1,945 1,867 1,922 –1.2 –1.2
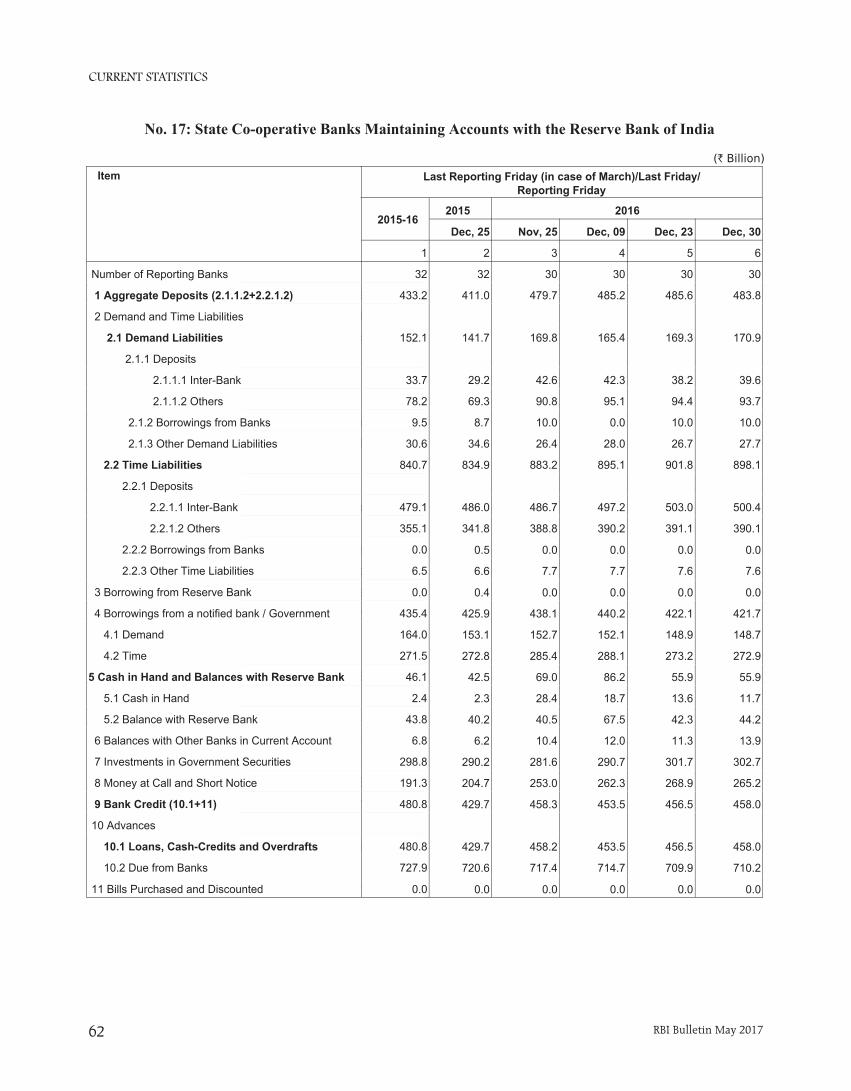
CURRENT STATISTICS
RBI Bulletin May 201762
2015 2016
Dec, 25 Nov, 25 Dec, 09 Dec, 23 Dec, 30
2 3 4 5 6
Number of Reporting Banks 32 30 30 30 30
1 Aggregate Deposits (2.1.1.2+2 411.0 479.7 485.2 485.6 483.8
2 Demand and Time Liabilities
2.1 Demand Liabilities 141.7 169.8 165.4 169.3 170.9
2.1.1 Deposits
2.1.1.1 Inter-Bank 29.2 42.6 42.3 38.2 39.6
2.1.1.2 Others 69.3 90.8 95.1 94.4 93.7
2.1.2 Borrowings from Banks 8.7 10.0 0.0 10.0 10.0
2.1.3 Other Demand Liabilities 34.6 26.4 28.0 26.7 27.7
2.2 Time Liabilities 834.9 883.2 895.1 901.8 898.1
2.2.1 Deposits
2.2.1.1 Inter-Bank-Bank 486.0 486.7 497.2 503.0 500.4
2.2.1.2 Others 341.8 388.8 390.2 391.1 390.1
2.2.2 Borrowings from Banks 0.5 0.0 0.0 0.0 0.0
2.2.3 Other Time Liabilities 6.6 7.7 7.7 7.6 7.6
3 Borrowing from Reserve Bank 0.4 0.0 0.0 0.0 0.0
4 Borrowings from a notified ban 425.9 438.1 440.2 422.1 421.7
4.1 Demand 153.1 152.7 152.1 148.9 148.7
4.2 Time 272.8 285.4 288.1 273.2 272.9
5 Cash in Hand and Balances wi 42.5 69.0 86.2 55.9 55.9
5.1 Cash in Hand 2.3 28.4 18.7 13.6 11.7
5.2 Balance with Reserve Bank 40.2 40.5 67.5 42.3 44.2
6 Balances with Other Banks in 6.2 10.4 12.0 11.3 13.9
7 Investments in Government Se 290.2 281.6 290.7 301.7 302.7
8 Money at Call and Short Notic 204.7 253.0 262.3 268.9 265.2
9 Bank Credit (10.1+11) 429.7 458.3 453.5 456.5 458.0
10 Advances.
10.1 Loans, Cash-Credits and O 429.7 458.2 453.5 456.5 458.0
10.2 Due from Banks 720.6 717.4 714.7 709.9 710.2
11 Bills Purchased and Discount 0.0 0.0 0.0 0.0 0.0
Item
2015-16
1
Number of Reporting Banks 32
1 Aggregate Deposits (2.1.1.2+2.2.1.2) 433.2
2 Demand and Time Liabilities
2.1 Demand Liabilities 152.1
2.1.1 Deposits
2.1.1.1 Inter-Bank 33.7
2.1.1.2 Others 78.2
2.1.2 Borrowings from Banks 9.5
2.1.3 Other Demand Liabilities 30.6
2.2 Time Liabilities 840.7
2.2.1 Deposits
2.2.1.1 Inter-Bank 479.1
2.2.1.2 Others 355.1
2.2.2 Borrowings from Banks 0.0
2.2.3 Other Time Liabilities 6.5
3 Borrowing from Reserve Bank 0.0
4 Borrowings from a notified bank / Government 435.4
4.1 Demand 164.0
4.2 Time 271.5
5 Cash in Hand and Balances with Reserve Bank 46.1
5.1 Cash in Hand 2.4
5.2 Balance with Reserve Bank 43.8
6 Balances with Other Banks in Current Account 6.8
7 Investments in Government Securities 298.8
8 Money at Call and Short Notice 191.3
9 Bank Credit (10.1+11) 480.8
10 Advances
10.1 Loans, Cash-Credits and Overdrafts 480.8
10.2 Due from Banks 727.9
11 Bills Purchased and Discounted 0.0
Last Reporting Friday (in case of March)/Last Friday/Reporting Friday
(` Billion)
No. 17: State Co-operative Banks Maintaining Accounts with the Reserve Bank of India
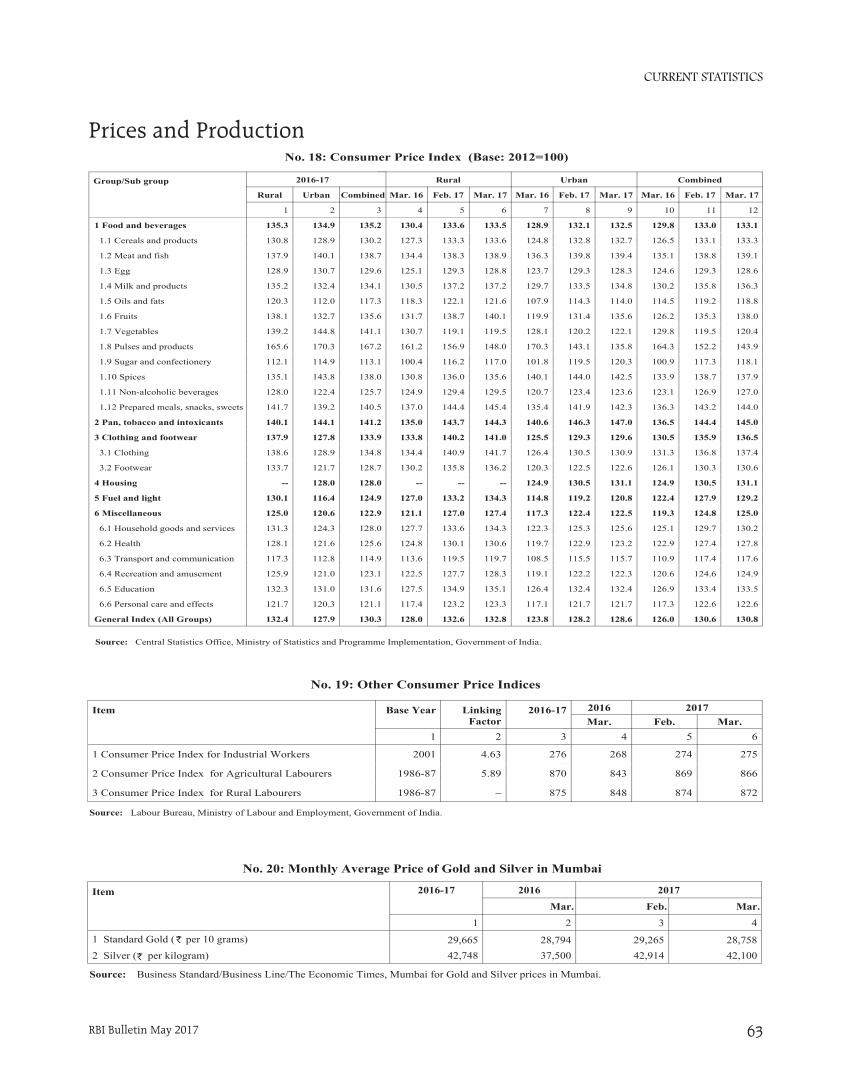
CURRENT STATISTICS
RBI Bulletin May 2017 63
No. 18: Consumer Price Index (Base: 2012=100)
Rural Urban Combined
Mar. 16 Feb. 17 Mar. 17 Mar. 16 Feb. 17 Mar. 17 Mar. 16 Feb. 17 Mar. 17
4 5 6 7 8 9 10 11 12
130.4 133.6 133.5 128.9 132.1 132.5 129.8 133.0 133.1
127.3 133.3 133.6 124.8 132.8 132.7 126.5 133.1 133.3
134.4 138.3 138.9 136.3 139.8 139.4 135.1 138.8 139.1
125.1 129.3 128.8 123.7 129.3 128.3 124.6 129.3 128.6
130.5 137.2 137.2 129.7 133.5 134.8 130.2 135.8 136.3
118.3 122.1 121.6 107.9 114.3 114.0 114.5 119.2 118.8
131.7 138.7 140.1 119.9 131.4 135.6 126.2 135.3 138.0
130.7 119.1 119.5 128.1 120.2 122.1 129.8 119.5 120.4
161.2 156.9 148.0 170.3 143.1 135.8 164.3 152.2 143.9
100.4 116.2 117.0 101.8 119.5 120.3 100.9 117.3 118.1
130.8 136.0 135.6 140.1 144.0 142.5 133.9 138.7 137.9
124.9 129.4 129.5 120.7 123.4 123.6 123.1 126.9 127.0
137.0 144.4 145.4 135.4 141.9 142.3 136.3 143.2 144.0
135.0 143.7 144.3 140.6 146.3 147.0 136.5 144.4 145.0
133.8 140.2 141.0 125.5 129.3 129.6 130.5 135.9 136.5
134.4 140.9 141.7 126.4 130.5 130.9 131.3 136.8 137.4
130.2 135.8 136.2 120.3 122.5 122.6 126.1 130.3 130.6
-- -- -- 124.9 130.5 131.1 124.9 130.5 131.1
127.0 133.2 134.3 114.8 119.2 120.8 122.4 127.9 129.2
121.1 127.0 127.4 117.3 122.4 122.5 119.3 124.8 125.0
127.7 133.6 134.3 122.3 125.3 125.6 125.1 129.7 130.2
124.8 130.1 130.6 119.7 122.9 123.2 122.9 127.4 127.8
113.6 119.5 119.7 108.5 115.5 115.7 110.9 117.4 117.6
122.5 127.7 128.3 119.1 122.2 122.3 120.6 124.6 124.9
127.5 134.9 135.1 126.4 132.4 132.4 126.9 133.4 133.5
117.4 123.2 123.3 117.1 121.7 121.7 117.3 122.6 122.6
128.0 132.6 132.8 123.8 128.2 128.6 126.0 130.6 130.8
Group/Sub group 2016-17
Rural Urban Combined
1 2 3
1 Food and beverages 135.3 134.9 135.2
1.1 Cereals and products 130.8 128.9 130.2
1.2 Meat and fish 137.9 140.1 138.7
1.3 Egg 128.9 130.7 129.6
1.4 Milk and products 135.2 132.4 134.1
1.5 Oils and fats 120.3 112.0 117.3
1.6 Fruits 138.1 132.7 135.6
1.7 Vegetables 139.2 144.8 141.1
1.8 Pulses and products 165.6 170.3 167.2
1.9 Sugar and confectionery 112.1 114.9 113.1
1.10 Spices 135.1 143.8 138.0
1.11 Non-alcoholic beverages 128.0 122.4 125.7
1.12 Prepared meals, snacks, sweets 141.7 139.2 140.5
2 Pan, tobacco and intoxicants 140.1 144.1 141.2
3 Clothing and footwear 137.9 127.8 133.9
3.1 Clothing 138.6 128.9 134.8
3.2 Footwear 133.7 121.7 128.7
4 Housing -- 128.0 128.0
5 Fuel and light 130.1 116.4 124.9
6 Miscellaneous 125.0 120.6 122.9
6.1 Household goods and services 131.3 124.3 128.0
6.2 Health 128.1 121.6 125.6
6.3 Transport and communication 117.3 112.8 114.9
6.4 Recreation and amusement 125.9 121.0 123.1
6.5 Education 132.3 131.0 131.6
6.6 Personal care and effects 121.7 120.3 121.1
General Index (All Groups) 132.4 127.9 130.3
Source: Central Statistics Office, Ministry of Statistics and Programme Implementation, Government of India.
No. 19: Other Consumer Price Indices
2016 2017Mar. Feb. Mar.
4 5 6
268 274 275
843 869 866
848 874 872
Item Base Year LinkingFactor
2016-17
1 2 3
1 Consumer Price Index for Industrial Workers 2001 4.63 276
2 Consumer Price Index for Agricultural Labourers 1986-87 5.89 870
3 Consumer Price Index for Rural Labourers 1986-87 – 875
Source: Labour Bureau, Ministry of Labour and Employment, Government of India.
No. 20: Monthly Average Price of Gold and Silver in Mumbai
Source: Business Standard/Business Line/The Economic Times, Mumbai for Gold and Silver prices in Mumbai.
Item 2016-17 2016 2017
Mar. Feb. Mar.
1 2 3 4
1 Standard Gold ( per 10 grams) 29,665 28,794 29,265 28,7582 Silver ( per kilogram) 42,748 37,500 42,914 42,100
`
`
Prices and Production
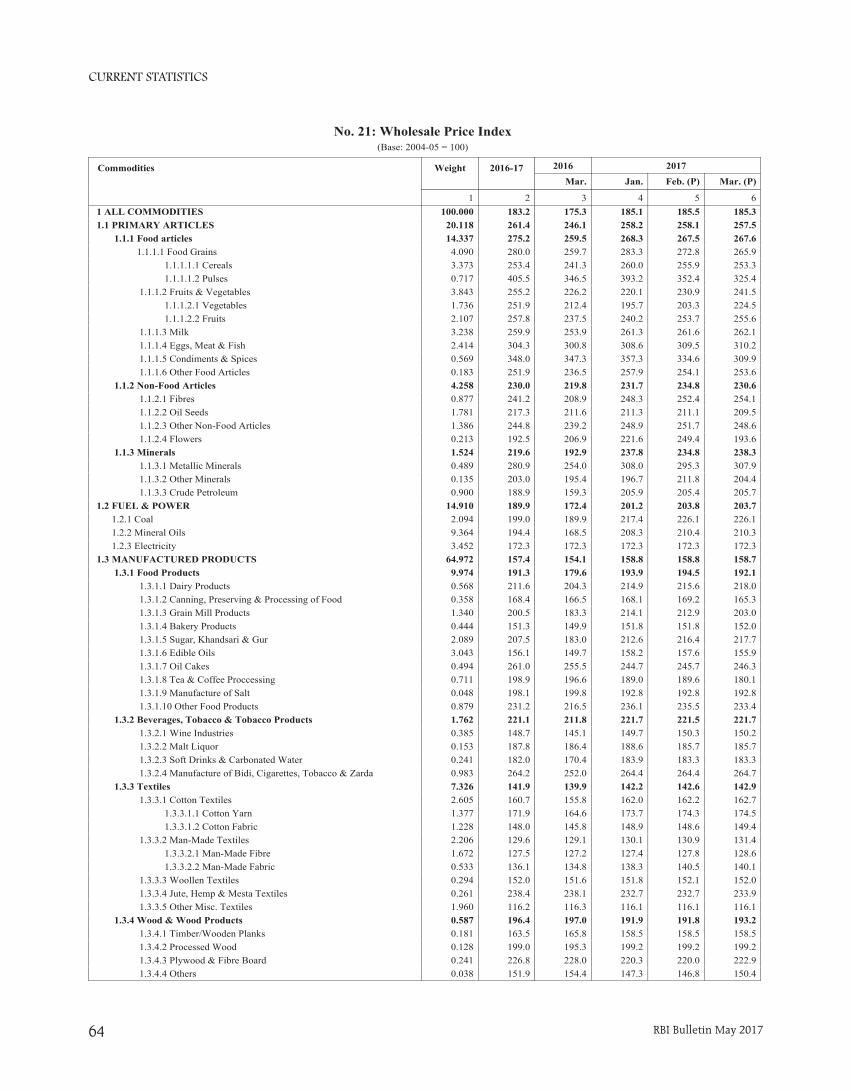
CURRENT STATISTICS
RBI Bulletin May 201764
No. 21: Wholesale Price Index(Base: 2004-05 = 100)
2016 2017
Mar. Jan. Feb. (P) Mar. (P)
3 4 5 6175.3 185.1 185.5 185.3246.1 258.2 258.1 257.5259.5 268.3 267.5 267.6259.7 283.3 272.8 265.9241.3 260.0 255.9 253.3346.5 393.2 352.4 325.4226.2 220.1 230.9 241.5212.4 195.7 203.3 224.5237.5 240.2 253.7 255.6253.9 261.3 261.6 262.1300.8 308.6 309.5 310.2347.3 357.3 334.6 309.9236.5 257.9 254.1 253.6219.8 231.7 234.8 230.6208.9 248.3 252.4 254.1211.6 211.3 211.1 209.5239.2 248.9 251.7 248.6206.9 221.6 249.4 193.6192.9 237.8 234.8 238.3254.0 308.0 295.3 307.9195.4 196.7 211.8 204.4159.3 205.9 205.4 205.7172.4 201.2 203.8 203.7189.9 217.4 226.1 226.1168.5 208.3 210.4 210.3172.3 172.3 172.3 172.3154.1 158.8 158.8 158.7179.6 193.9 194.5 192.1204.3 214.9 215.6 218.0166.5 168.1 169.2 165.3183.3 214.1 212.9 203.0149.9 151.8 151.8 152.0183.0 212.6 216.4 217.7149.7 158.2 157.6 155.9255.5 244.7 245.7 246.3196.6 189.0 189.6 180.1199.8 192.8 192.8 192.8216.5 236.1 235.5 233.4211.8 221.7 221.5 221.7145.1 149.7 150.3 150.2186.4 188.6 185.7 185.7170.4 183.9 183.3 183.3252.0 264.4 264.4 264.7139.9 142.2 142.6 142.9155.8 162.0 162.2 162.7164.6 173.7 174.3 174.5145.8 148.9 148.6 149.4129.1 130.1 130.9 131.4127.2 127.4 127.8 128.6134.8 138.3 140.5 140.1151.6 151.8 152.1 152.0238.1 232.7 232.7 233.9116.3 116.1 116.1 116.1197.0 191.9 191.8 193.2165.8 158.5 158.5 158.5195.3 199.2 199.2 199.2228.0 220.3 220.0 222.9154.4 147.3 146.8 150.4
Commodities Weight 2016-17
1 21 ALL COMMODITIES 100.000 183.21.1 PRIMARY ARTICLES 20.118 261.4 1.1.1 Food articles 14.337 275.2 1.1.1.1 Food Grains 4.090 280.0 1.1.1.1.1 Cereals 3.373 253.4 1.1.1.1.2 Pulses 0.717 405.5 1.1.1.2 Fruits & Vegetables 3.843 255.2 1.1.1.2.1 Vegetables 1.736 251.9 1.1.1.2.2 Fruits 2.107 257.8 1.1.1.3 Milk 3.238 259.9 1.1.1.4 Eggs, Meat & Fish 2.414 304.3 1.1.1.5 Condiments & Spices 0.569 348.0 1.1.1.6 Other Food Articles 0.183 251.9 1.1.2 Non-Food Articles 4.258 230.0 1.1.2.1 Fibres 0.877 241.2 1.1.2.2 Oil Seeds 1.781 217.3 1.1.2.3 Other Non-Food Articles 1.386 244.8 1.1.2.4 Flowers 0.213 192.5 1.1.3 Minerals 1.524 219.6 1.1.3.1 Metallic Minerals 0.489 280.9 1.1.3.2 Other Minerals 0.135 203.0 1.1.3.3 Crude Petroleum 0.900 188.91.2 FUEL & POWER 14.910 189.9 1.2.1 Coal 2.094 199.0 1.2.2 Mineral Oils 9.364 194.4 1.2.3 Electricity 3.452 172.31.3 MANUFACTURED PRODUCTS 64.972 157.4 1.3.1 Food Products 9.974 191.3 1.3.1.1 Dairy Products 0.568 211.6 1.3.1.2 Canning, Preserving & Processing of Food 0.358 168.4 1.3.1.3 Grain Mill Products 1.340 200.5 1.3.1.4 Bakery Products 0.444 151.3 1.3.1.5 Sugar, Khandsari & Gur 2.089 207.5 1.3.1.6 Edible Oils 3.043 156.1 1.3.1.7 Oil Cakes 0.494 261.0 1.3.1.8 Tea & Coffee Proccessing 0.711 198.9 1.3.1.9 Manufacture of Salt 0.048 198.1 1.3.1.10 Other Food Products 0.879 231.2 1.3.2 Beverages, Tobacco & Tobacco Products 1.762 221.1 1.3.2.1 Wine Industries 0.385 148.7 1.3.2.2 Malt Liquor 0.153 187.8 1.3.2.3 Soft Drinks & Carbonated Water 0.241 182.0 1.3.2.4 Manufacture of Bidi, Cigarettes, Tobacco & Zarda 0.983 264.2 1.3.3 Textiles 7.326 141.9 1.3.3.1 Cotton Textiles 2.605 160.7 1.3.3.1.1 Cotton Yarn 1.377 171.9 1.3.3.1.2 Cotton Fabric 1.228 148.0 1.3.3.2 Man-Made Textiles 2.206 129.6 1.3.3.2.1 Man-Made Fibre 1.672 127.5 1.3.3.2.2 Man-Made Fabric 0.533 136.1 1.3.3.3 Woollen Textiles 0.294 152.0 1.3.3.4 Jute, Hemp & Mesta Textiles 0.261 238.4 1.3.3.5 Other Misc. Textiles 1.960 116.2 1.3.4 Wood & Wood Products 0.587 196.4 1.3.4.1 Timber/Wooden Planks 0.181 163.5 1.3.4.2 Processed Wood 0.128 199.0 1.3.4.3 Plywood & Fibre Board 0.241 226.8 1.3.4.4 Others 0.038 151.9

CURRENT STATISTICS
RBI Bulletin May 2017 65
No. 21: Wholesale Price Index (Concld.)(Base: 2004-05 = 100)
2016 2017
Mar. Jan. Feb. (P) Mar. (P)
3 4 5 6155.8 158.3 157.7 158.8151.1 153.4 152.5 154.5136.5 134.3 133.7 134.0189.3 197.6 197.5 197.7145.8 145.1 145.1 145.3115.7 112.6 113.4 113.3161.5 164.7 164.4 164.5147.4 141.1 141.1 141.7145.3 148.6 148.9 150.4176.1 179.0 178.8 180.3176.4 179.1 178.8 180.5173.3 178.4 178.4 178.4133.5 135.6 136.0 137.4154.3 161.8 162.1 164.4149.6 151.2 151.5 152.3154.5 155.5 155.6 156.1137.8 147.3 149.2 151.4155.9 153.4 152.9 152.6158.9 155.4 155.0 154.8139.0 142.2 141.3 140.6152.0 152.5 152.4 152.5142.0 143.7 143.7 143.7128.6 128.5 128.4 128.5163.2 164.3 164.6 165.0153.7 155.8 155.8 156.3144.4 145.0 145.2 146.1144.0 145.8 146.3 151.1152.6 154.9 155.3 154.5178.4 178.2 178.8 177.7198.5 200.8 201.0 201.7142.7 144.2 144.0 144.2175.7 174.2 175.2 172.8177.0 176.1 176.1 176.3153.4 161.2 160.4 160.5139.3 148.6 147.3 147.4136.3 143.3 140.7 142.7146.9 150.0 148.5 150.1130.8 146.1 144.9 143.5123.8 129.4 129.7 127.2157.6 165.8 164.8 166.8140.2 143.9 143.8 142.0148.2 200.1 200.1 191.3163.1 165.6 165.8 166.3135.1 139.7 140.1 140.7189.7 190.2 190.3 190.6215.8 219.1 220.2 220.3135.1 135.4 135.4 135.3149.3 154.0 154.0 154.0153.5 153.9 153.9 153.5141.5 141.6 141.6 141.6175.8 170.9 170.0 170.0121.2 121.3 121.3 121.3128.0 128.5 128.5 128.6138.0 138.9 138.9 139.0152.9 154.0 154.1 153.7122.0 124.0 124.0 124.0
89.5 88.9 88.9 89.091.7 92.0 92.0 92.099.6 99.3 99.3 99.3
139.0 140.4 140.5 140.8138.3 139.9 139.9 140.4140.1 140.7 141.1 140.7150.4 150.7 150.7 150.6
Commodities Weight 2016-17
1 2 1.3.5 Paper & Paper Products 2.034 156.9 1.3.5.1 Paper & Pulp 1.019 151.7 1.3.5.2 Manufacture of boards 0.550 135.0 1.3.5.3 Printing & Publishing 0.465 194.3 1.3.6 Leather & Leather Products 0.835 145.9 1.3.6.1 Leathers 0.223 114.6 1.3.6.2 Leather Footwear 0.409 163.6 1.3.6.3 Other Leather Products 0.203 144.7 1.3.7 Rubber & Plastic Products 2.987 147.9 1.3.7.1 Tyres & Tubes 0.541 177.7 1.3.7.1.1 Tyres 0.488 177.8 1.3.7.1.2 Tubes 0.053 176.5 1.3.7.2 Plastic Products 1.861 135.4 1.3.7.3 Rubber Products 0.584 160.2 1.3.8 Chemicals & Chemical Products 12.018 151.0 1.3.8.1 Basic Inorganic Chemicals 1.187 155.6 1.3.8.2 Basic Organic Chemicals 1.952 143.3 1.3.8.3 Fertilisers & Pesticides 3.145 155.0 1.3.8.3.1 Fertilisers 2.661 157.5 1.3.8.3.2 Pesticides 0.483 141.3 1.3.8.4 Paints, Varnishes & Lacquers 0.529 152.5 1.3.8.5 Dyestuffs & Indigo 0.563 143.4 1.3.8.6 Drugs & Medicines 0.456 128.8 1.3.8.7 Perfumes, Cosmetics, Toiletries etc. 1.130 164.8 1.3.8.8 Turpentine, Plastic Chemicals 0.586 155.2 1.3.8.9 Polymers including Synthetic Rubber 0.970 145.6 1.3.8.10 Petrochemical Intermediates 0.869 145.6 1.3.8.11 Matches, Explosives & other Chemicals 0.629 154.0 1.3.9 Non-Metallic Mineral Products 2.556 178.9 1.3.9.1 Structural Clay Products 0.658 200.8 1.3.9.2 Glass, Earthenware, Chinaware & their Products 0.256 143.9 1.3.9.3 Cement & Lime 1.386 175.5 1.3.9.4 Cement, Slate & Graphite Products 0.256 176.0 1.3.10 Basic Metals, Alloys & Metal Products 10.748 156.2 1.3.10.1 Ferrous Metals 8.064 142.0 1.3.10.1.1 Iron & Semis 1.563 137.0 1.3.10.1.2 Steel: Long 1.630 145.6 1.3.10.1.3 Steel: Flat 2.611 136.4 1.3.10.1.4 Steel: Pipes & Tubes 0.314 127.0 1.3.10.1.5 Stainless Steel & alloys 0.938 161.4 1.3.10.1.6 Castings & Forgings 0.871 141.4 1.3.10.1.7 Ferro alloys 0.137 168.2 1.3.10.2 Non-Ferrous Metals 1.004 164.8 1.3.10.2.1 Aluminium 0.489 138.2 1.3.10.2.2 Other Non-Ferrous Metals 0.515 190.0 1.3.10.3 Metal Products 1.680 219.6 1.3.11 Machinery & Machine Tools 8.931 135.4 1.3.11.1 Agricultural Machinery & Implements 0.139 152.5 1.3.11.2 Industrial Machinery 1.838 154.0 1.3.11.3 Construction Machinery 0.045 141.6 1.3.11.4 Machine Tools 0.367 174.0 1.3.11.5 Air Conditioner & Refrigerators 0.429 121.3 1.3.11.6 Non-Electrical Machinery 1.026 128.4 1.3.11.7 Electrical Machinery, Equipment & Batteries 2.343 138.9 1.3.11.8 Electrical Accessories, Wires, Cables etc. 1.063 152.8 1.3.11.9 Electrical Apparatus & Appliances 0.337 123.7 1.3.11.10 Electronics Items 0.961 89.1 1.3.11.11 IT Hardware 0.267 91.8 1.3.11.12 Communication Equipments 0.118 98.8 1.3.12 Transport, Equipment & Parts 5.213 139.9 1.3.12.1 Automotives 4.231 139.4 1.3.12.2 Auto Parts 0.804 140.5 1.3.12.3 Other Transport Equipments 0.178 150.7
Source: Office of the Economic Adviser, Ministry of Commerce and Industry, Government of India.

CURRENT STATISTICS
RBI Bulletin May 201766
February
2016 20176 7
Ge
Gen Ge 184.5 182.3
Se
Sect 1. Mi 136.1 140.62. Ma 193.9 190.13. El 181.9 182.5
Us
Use- 1. Ba 173.5 177.72. Ca 231.1 223.23. Int 159.2 158.94. Co 200.8 189.54( Co 277.2 274.74( Co 170.5 155.8
April-February
2015-16 2016-174 5
Ge
Gen GeGe 179.5 180.3
Se
SectMi Mi 127.5 129.5MaMa 188.1 187.6El El 187.9 196.6
Us
Use-BaBa 172.4 179.7CaCa 247.7 212.9Int Int 156.3 159.6CoCo 182.5 182.6CoCo 254.4 266.3CoCo 154.0 149.5
No. 22: Index of Industrial Production (Base:2004-05=100)
Industry Weight 2014-15 2015-16
1 2 3General IndexGeneral Index 100.00 176.9 181.1
1 Sectoral Classification 1.1 Mining and Quarrying 14.16 126.5 129.3 1.2 Manufacturing 75.53 186.1 189.8 1.3 Electricity 10.32 178.6 188.7
2 Use-Based Classification 2.1 Basic Goods 45.68 167.8 173.8 2.2 Capital Goods 8.83 258.0 250.5 2.3 Intermediate Goods 15.69 153.8 157.6 2.4 Consumer Goods 29.81 178.9 184.3 2.4.1 Consumer Durables 8.46 231.0 257.2 2.4.2 Consumer Non-Durables 21.35 158.3 155.4
Source : Central Statistics Office, Ministry of Statistics and Programme Implementation, Government of India.
Government Accounts and Treasury BillsNo. 23: Union Government Accounts at a Glance
Source: Controller General of Accounts, Ministry of Finance, Government of India.
B April–February
2016-17(Actuals)
2015-16(Actuals)
Percentage to Revised Estimates
2016-17 2015-16
2 3 4 5
10,941.8 9,470.5 76.9 78.58,852.7 7,357.8 81.3 77.72,089.1 2,112.7 62.4 81.76,588.4 6,088.2 111.5 105.1
141.8 174.3 128.1 92.2390.4 185.2 85.8 73.2
6,056.1 5,728.7 113.4 107.117,530.2 15,558.7 87.0 87.112,714.8 11,586.6 88.9 88.611,853.8 10,615.8 89.0 87.5
4,039.8 3,794.9 83.6 85.7861.1 970.8 87.3 101.6
4,815.4 3,972.2 82.5 83.23,528.5 2,762.8 87.7 82.51,286.9 1,209.4 71.0 85.1
17,530.2 15,558.7 87.0 87.115,382.2 13,378.6 88.7 86.4
2,148.0 2,180.1 76.8 91.74,440.4 3,908.1 142.8 114.46,056.1 5,728.7 113.4 107.12,016.3 1,933.9 393.8 209.1
Item Financial Year
2016-17(Revised
Estimates)1
1 Revenue Receipts 14,235.6 1.1 Tax Revenue (Net) 10,887.9 1.2 Non-Tax Revenue 3,347.72 Capital Receipts 5,908.5 2.1 Recovery of Loans 110.7 2.2 Other Receipts 455.0 2.3 Borrowings and Other Liabilities 5,342.73 Total Receipts (1+2) 20,144.14 Non-Plan Expenditure 14,306.0 4.1 On Revenue Account 13,320.2 4.1.1 Interest Payments 4,830.7 4.2 On Capital Account 985.85 Plan Expenditure 5,838.1 5.1 On Revenue Account 4,025.4 5.2 On Capital Account 1,812.76 Total Expenditure (4+5) 20,144.17 Revenue Expenditure (4.1+5.1) 17,345.68 Capital Expenditure (4.2+5.2) 2,798.59 Revenue Deficit (7-1) 3,110.010 Fiscal Deficit {6-(1+2.1+2.2)} 5,342.711 Gross Primary Deficit [10-4.1.1] 512.1
(Amount in ` Billion)

CURRENT STATISTICS
RBI Bulletin May 2017 67
(` Billion)
2016 2017Apr. 1 Feb. 24 Mar. 3 Mar. 10 Mar. 17 Mar. 24 Mar. 31
2 3 4 5 6 7 8
422.9 228.4 216.6 230.8 229.6 272.9 323.7271.4 150.8 153.8 180.8 194.8 202.0 243.5308.0 438.1 398.0 352.5 297.5 247.5 146.2324.7 633.1 615.4 554.6 521.9 453.3 343.4
135.9 219.0 213.0 233.5 230.0 267.0 216.2450.1 354.2 297.5 286.4 306.0 271.2 316.5
55.7 194.4 194.4 194.9 194.9 193.6 193.6135.9 113.3 172.5 142.7 126.5 115.4 120.9
341.9 581.4 545.2 570.8 526.6 637.3 512.3703.2 506.5 425.4 503.8 491.6 478.7 551.8
19.6 26.9 26.9 26.9 26.9 26.9 26.3474.7 367.6 459.3 355.3 391.7 293.9 326.4
– – – – – – –– – – – – – –
1,576.5 1,326.3 1,754.1 1,520.9 1,678.2 1,793.2 1,560.65.5 5.8 7.2 3.2 7.2 7.1 5.1
3,644.0 3,813.6 3,718.1 3,633.1 3,538.1 3,459.8 3,320.8
No. 24: Treasury Bills – Ownership Pattern
Item 2016-17
11 91-day
1.1 Banks 323.71.2 Primary Dealers 243.51.3 State Governments 146.21.4 Others 343.4
2 182-day2.1 Banks 216.22.2 Primary Dealers 316.52.3 State Governments 193.62.4 Others 120.9
3 364-day3.1 Banks 512.33.2 Primary Dealers 551.83.3 State Governments 26.33.4 Others 326.4
4 14-day Intermediate4.1 Banks –4.2 Primary Dealers –4.3 State Governments 1,560.64.4 Others 5.1
Total Treasury Bills (Excluding 14 day Intermediate T Bills) #
3,320.8
# 14D intermediate T-Bills are non-marketable unlike 91D, 182D and 364D T-Bills. These bills are ‘intermediate’ by nature as these are liquidated to replenish shortfall in the daily minimum cash balances of State Governments
No. 25: Auctions of Treasury Bills(Amount in ` Billion)
Date ofAuction
NotifiedAmount
Bids Received Bids Accepted TotalIssue(6+7)
Cut-offPrice
Implicit Yieldat Cut-offPrice (per
cent)
Number Total Face Value Number Total Face ValueCompetitive Non-
CompetitiveCompetitive Non-
Competitive
1 2 3 4 5 6 7 8 9 1091-day Treasury Bills
2016-17 Mar. 1 60 81 736.92 30.53 26 60.00 30.53 90.53 98.51 6.0668Mar. 8 60 98 574.92 10.63 41 59.98 10.63 70.61 98.54 5.9428Mar. 15 60 68 392.27 22.72 41 60.00 22.72 82.72 98.54 5.9428Mar. 22 60 81 460.25 6.84 37 59.99 6.84 66.83 98.56 5.8602Mar. 29 60 61 277.72 12.00 26 60.00 12.00 72.00 98.57 5.8189
182-day Treasury Bills2016-17 Feb. 22 40 62 240.60 20.00 25 40.00 20.00 60.00 96.97 6.2665Mar. 8 40 88 248.14 40.02 32 39.98 40.02 80.00 97.03 6.1386Mar. 22 40 63 163.86 15.47 20 40.00 15.47 55.47 97.07 6.0535
364-day Treasury Bills2016-17 Feb. 15 40 73 180.27 – 38 40.00 – 40.00 94.09 6.2985Mar. 1 40 75 161.17 – 34 40.00 – 40.00 94.12 6.2645Mar. 15 40 63 138.73 – 31 40.00 – 40.00 94.19 6.1853Mar. 29 40 48 86.67 0.02 30 40.00 0.02 40.02 94.23 6.1401
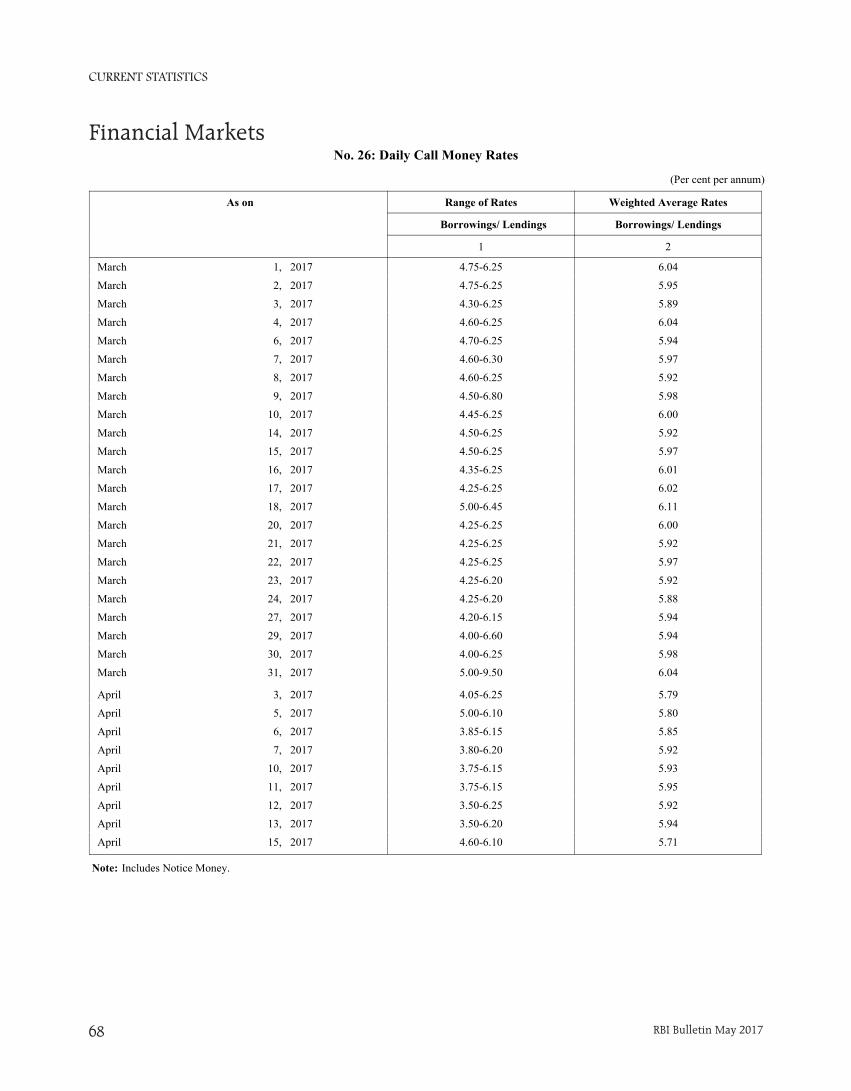
CURRENT STATISTICS
RBI Bulletin May 201768
No. 26: Daily Call Money Rates
As on Range of Rates Weighted Average Rates
1 Borrowings/ Lendings Borrowings/ Lendings
1 2
March 1, 2017 4.75-6.25 6.04
March 2, 2017 4.75-6.25 5.95
March 3, 2017 4.30-6.25 5.89
March 4, 2017 4.60-6.25 6.04
March 6, 2017 4.70-6.25 5.94
March 7, 2017 4.60-6.30 5.97
March 8, 2017 4.60-6.25 5.92
March 9, 2017 4.50-6.80 5.98
March 10, 2017 4.45-6.25 6.00
March 14, 2017 4.50-6.25 5.92
March 15, 2017 4.50-6.25 5.97
March 16, 2017 4.35-6.25 6.01
March 17, 2017 4.25-6.25 6.02
March 18, 2017 5.00-6.45 6.11
March 20, 2017 4.25-6.25 6.00
March 21, 2017 4.25-6.25 5.92
March 22, 2017 4.25-6.25 5.97
March 23, 2017 4.25-6.20 5.92
March 24, 2017 4.25-6.20 5.88
March 27, 2017 4.20-6.15 5.94
March 29, 2017 4.00-6.60 5.94
March 30, 2017 4.00-6.25 5.98
March 31, 2017 5.00-9.50 6.04
April 3, 2017 4.05-6.25 5.79
April 5, 2017 5.00-6.10 5.80
April 6, 2017 3.85-6.15 5.85
April 7, 2017 3.80-6.20 5.92
April 10, 2017 3.75-6.15 5.93
April 11, 2017 3.75-6.15 5.95
April 12, 2017 3.50-6.25 5.92
April 13, 2017 3.50-6.20 5.94
April 15, 2017 4.60-6.10 5.71
(Per cent per annum)
Note: Includes Notice Money.
Financial Markets
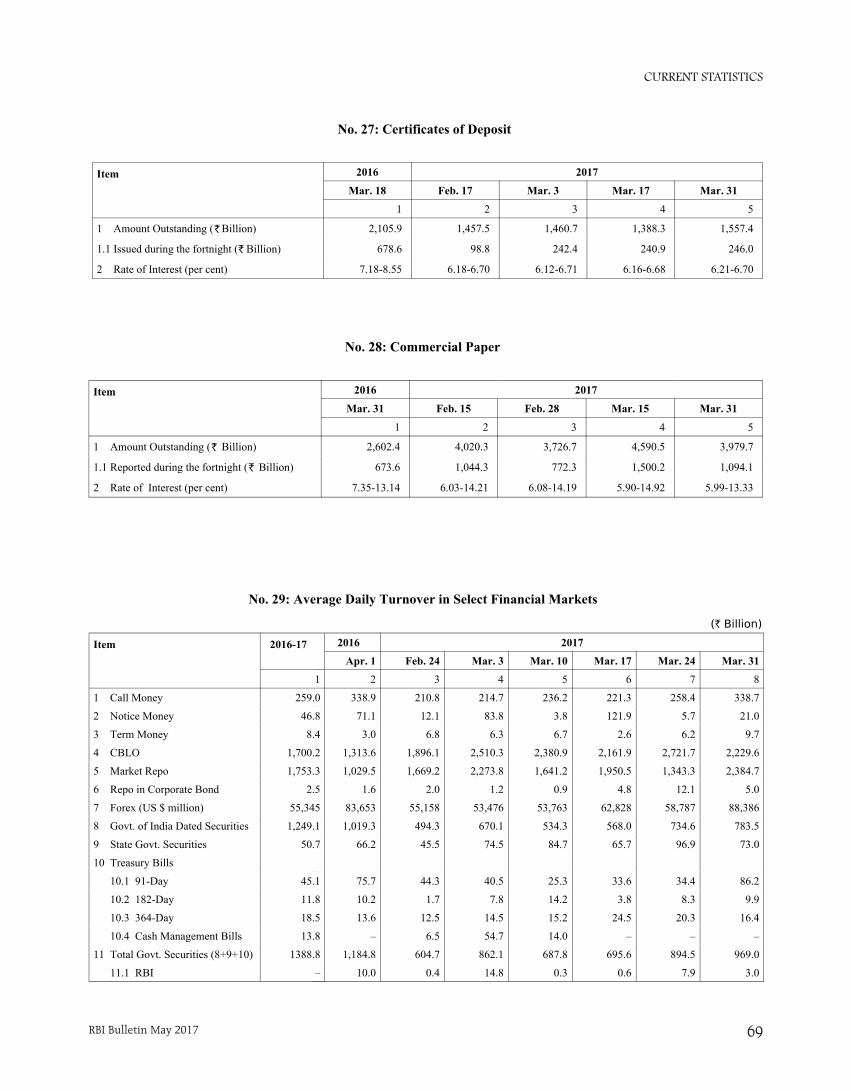
CURRENT STATISTICS
RBI Bulletin May 2017 69
(` Billion)
2016 2017
Apr. 1 Feb. 24 Mar. 3 Mar. 10 Mar. 17 Mar. 24 Mar. 31
2 3 4 5 6 7 8
338.9 210.8 214.7 236.2 221.3 258.4 338.7
71.1 12.1 83.8 3.8 121.9 5.7 21.0
3.0 6.8 6.3 6.7 2.6 6.2 9.7
1,313.6 1,896.1 2,510.3 2,380.9 2,161.9 2,721.7 2,229.6
1,029.5 1,669.2 2,273.8 1,641.2 1,950.5 1,343.3 2,384.7
1.6 2.0 1.2 0.9 4.8 12.1 5.0
83,653 55,158 53,476 53,763 62,828 58,787 88,386
1,019.3 494.3 670.1 534.3 568.0 734.6 783.5
66.2 45.5 74.5 84.7 65.7 96.9 73.0
75.7 44.3 40.5 25.3 33.6 34.4 86.2
10.2 1.7 7.8 14.2 3.8 8.3 9.9
13.6 12.5 14.5 15.2 24.5 20.3 16.4
– 6.5 54.7 14.0 – – –
1,184.8 604.7 862.1 687.8 695.6 894.5 969.0
10.0 0.4 14.8 0.3 0.6 7.9 3.0
No. 29: Average Daily Turnover in Select Financial Markets
Item 2016-17
1
1 Call Money 259.0
2 Notice Money 46.8
3 Term Money 8.4
4 CBLO 1,700.2
5 Market Repo 1,753.3
6 Repo in Corporate Bond 2.5
7 Forex (US $ million) 55,345
8 Govt. of India Dated Securities 1,249.1
9 State Govt. Securities 50.7
10 Treasury Bills
10.1 91-Day 45.1
10.2 182-Day 11.8
10.3 364-Day 18.5
10.4 Cash Management Bills 13.8
11 Total Govt. Securities (8+9+10) 1388.8
11.1 RBI –
No. 27: Certificates of Deposit
Item 2016 2017
Mar. 18 Feb. 17 Mar. 3 Mar. 17 Mar. 31
1 2 3 4 5
1 Amount Outstanding ( Billion) 2,105.9 1,457.5 1,460.7 1,388.3 1,557.4
1.1 Issued during the fortnight ( Billion) 678.6 98.8 242.4 240.9 246.0
2 Rate of Interest (per cent) 7.18-8.55 6.18-6.70 6.12-6.71 6.16-6.68 6.21-6.70
`
`
No. 28: Commercial Paper
Item 2016 2017
Mar. 31 Feb. 15 Feb. 28 Mar. 15 Mar. 31
1 2 3 4 5
1 Amount Outstanding ( Billion) 2,602.4 4,020.3 3,726.7 4,590.5 3,979.7
1.1 Reported during the fortnight ( Billion) 673.6 1,044.3 772.3 1,500.2 1,094.1
2 Rate of Interest (per cent) 7.35-13.14 6.03-14.21 6.08-14.19 5.90-14.92 5.99-13.33
`
`

CURRENT STATISTICS
RBI Bulletin May 201770
Mar. 2016 Mar. 2017
No. ofIssues
Amount No. ofIssues
Amount
7 8 9 10
1 17 16.9 29 34.9
1 14 15.9 29 33.2
1 15 12.4 26 32.2
1 12 11.6 26 30.8
1 2 4.5 3 2.6
1 2 4.3 3 2.4
2 – – – –
2 – – – –
2 – – – –
3 – – – –
3 – – – –
3 – – – –
3 – – – –
3 – – – –
3 – – – –
3 – – – –
4 – – – –
4 – – – –
4 – – – –
5 17 16.9 29 34.9
5 15 12.4 26 32.2
5 2 4.5 3 2.6
2015-16 (Apr.-Mar.) 2016-17 (Apr.-Mar.)
No. ofIssues
Amount No. ofIssues
Amount
3 4 5 6
1 87 240.0 116 303.6
1 78 225.7 113 291.3
1 73 142.5 105 280.7
1 65 134.2 102 270.4
1 14 97.5 11 22.9
1 13 91.4 11 20.9
2 – – – –
2 – – – –
2 – – – –
3 9 27.1 15 293.3
3 – – – –
3 – – – –
3 – – – –
3 9 27.1 15 293.3
3 9 27.1 15 293.3
3 – – – –
4 – – – –
4 – – – –
4 – – – –
5 96 267.2 131 596.9
5 82 169.7 120 573.9
5 14 97.5 11 22.9
No. 30: New Capital Issues By Non-Government Public Limited Companies
Security & Type of Issue 2016-17
No. ofIssues
Amount
1 2
1 Equity Shares 116 303.6
1A Premium 113 291.3
1.1 Public 105 280.7
1.1.1 Premium 102 270.4
1.2 Rights 11 22.9
1.2.1 Premium 11 20.9
2 Preference Shares – –
2.1 Public – –
2.2 Rights – –
3 Debentures 15 293.3
3.1 Convertible – –
3.1.1 Public – –
3.1.2 Rights – –
3.2 Non-Convertible 15 293.3
3.2.1 Public 15 293.3
3.2.2 Rights – –
4 Bonds – –
4.1 Public – –
4.2 Rights – –
5 Total (1+2+3+4) 131 596.9
5.1 Public 120 573.9
5.2 Rights 11 22.9
(Amount in ` Billion)
Source : Securities and Exchange Board of India
* *
* : Data is Provisional
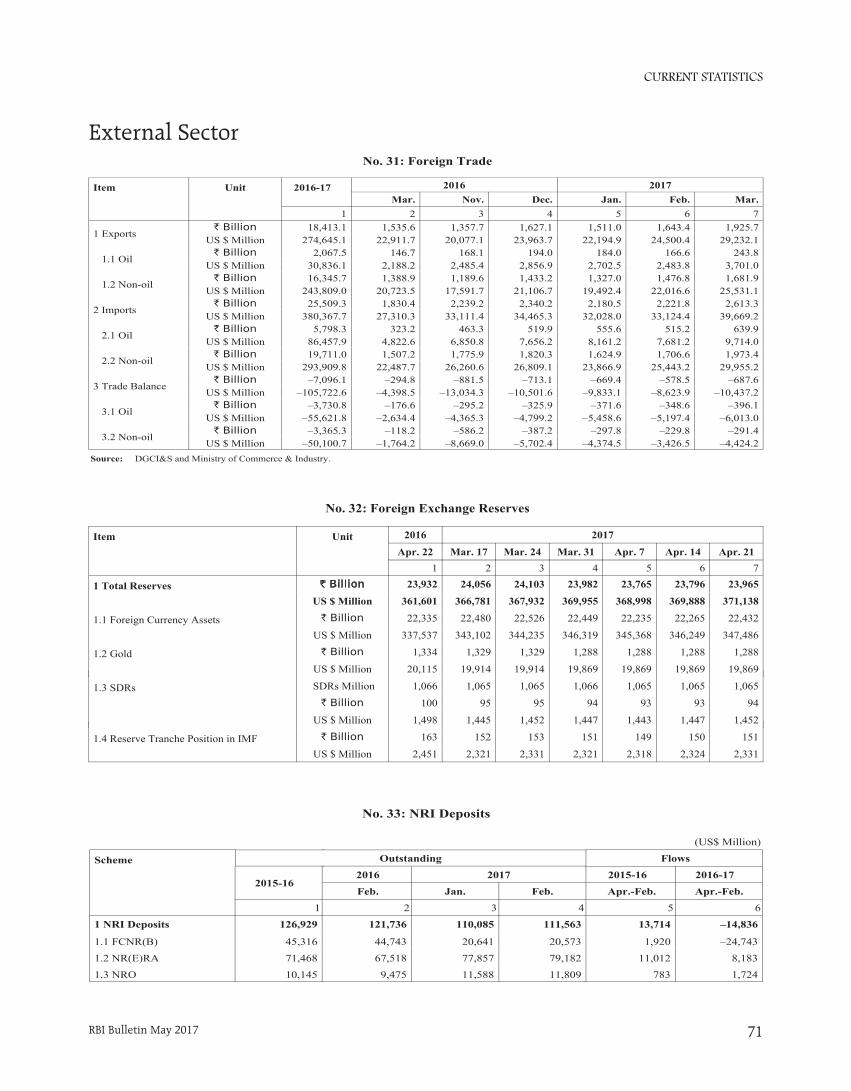
CURRENT STATISTICS
RBI Bulletin May 2017 71
No. 31: Foreign Trade
Item Unit 2016-17 2016 2017Mar. Nov. Dec. Jan. Feb. Mar.
1 2 3 4 5 6 7
1 Exports` Billion 18,413.1 1,535.6 1,357.7 1,627.1 1,511.0 1,643.4 1,925.7
US $ Million 274,645.1 22,911.7 20,077.1 23,963.7 22,194.9 24,500.4 29,232.1
1.1 Oil` Billion 2,067.5 146.7 168.1 194.0 184.0 166.6 243.8
US $ Million 30,836.1 2,188.2 2,485.4 2,856.9 2,702.5 2,483.8 3,701.0
1.2 Non-oil` Billion 16,345.7 1,388.9 1,189.6 1,433.2 1,327.0 1,476.8 1,681.9
US $ Million 243,809.0 20,723.5 17,591.7 21,106.7 19,492.4 22,016.6 25,531.1
2 Imports` Billion 25,509.3 1,830.4 2,239.2 2,340.2 2,180.5 2,221.8 2,613.3
US $ Million 380,367.7 27,310.3 33,111.4 34,465.3 32,028.0 33,124.4 39,669.2
2.1 Oil` Billion 5,798.3 323.2 463.3 519.9 555.6 515.2 639.9
US $ Million 86,457.9 4,822.6 6,850.8 7,656.2 8,161.2 7,681.2 9,714.0
2.2 Non-oil` Billion 19,711.0 1,507.2 1,775.9 1,820.3 1,624.9 1,706.6 1,973.4
US $ Million 293,909.8 22,487.7 26,260.6 26,809.1 23,866.9 25,443.2 29,955.2
3 Trade Balance` Billion –7,096.1 –294.8 –881.5 –713.1 –669.4 –578.5 –687.6
US $ Million –105,722.6 –4,398.5 –13,034.3 –10,501.6 –9,833.1 –8,623.9 –10,437.2
3.1 Oil` Billion –3,730.8 –176.6 –295.2 –325.9 –371.6 –348.6 –396.1
US $ Million –55,621.8 –2,634.4 –4,365.3 –4,799.2 –5,458.6 –5,197.4 –6,013.0
3.2 Non-oil` Billion –3,365.3 –118.2 –586.2 –387.2 –297.8 –229.8 –291.4
US $ Million –50,100.7 –1,764.2 –8,669.0 –5,702.4 –4,374.5 –3,426.5 –4,424.2Source: DGCI&S and Ministry of Commerce & Industry.
1.4 Reserve Tranche Position in IMF ` Billion 163 152 153 151 149 150 151
US $ Million 2,451 2,321 2,331 2,321 2,318 2,324 2,331
1.3 SDRs SDRs Million 1,066 1,065 1,065 1,066 1,065 1,065 1,065
` Billion 100 95 95 94 93 93 94
US $ Million 1,498 1,445 1,452 1,447 1,443 1,447 1,452
No. 32: Foreign Exchange Reserves
Item Unit 2016 2017
Apr. 22 Mar. 17 Mar. 24 Mar. 31 Apr. 7 Apr. 14 Apr. 21
1 2 3 4 5 6 7
1 Total Reserves ` Billion 23,932 24,056 24,103 23,982 23,765 23,796 23,965
US $ Million 361,601 366,781 367,932 369,955 368,998 369,888 371,138
1.1 Foreign Currency Assets ` Billion 22,335 22,480 22,526 22,449 22,235 22,265 22,432
US $ Million 337,537 343,102 344,235 346,319 345,368 346,249 347,486
1.2 Gold ` Billion 1,334 1,329 1,329 1,288 1,288 1,288 1,288
US $ Million 20,115 19,914 19,914 19,869 19,869 19,869 19,869
No. 33: NRI Deposits
(US$ Million)
Flows
2015-16 2016-17
Apr.-Feb. Apr.-Feb.
5 6
13,714 –14,836
1,920 –24,743
11,012 8,183
783 1,724
2016 2017
Feb. Jan. Feb.
2 3 4
121,736 110,085 111,563
44,743 20,641 20,573
67,518 77,857 79,182
9,475 11,588 11,809
Scheme
2015-16
1
1 NRI Deposits 126,929
1.1 FCNR(B) 45,316
1.2 NR(E)RA 71,468
1.3 NRO 10,145
Outstanding
External Sector
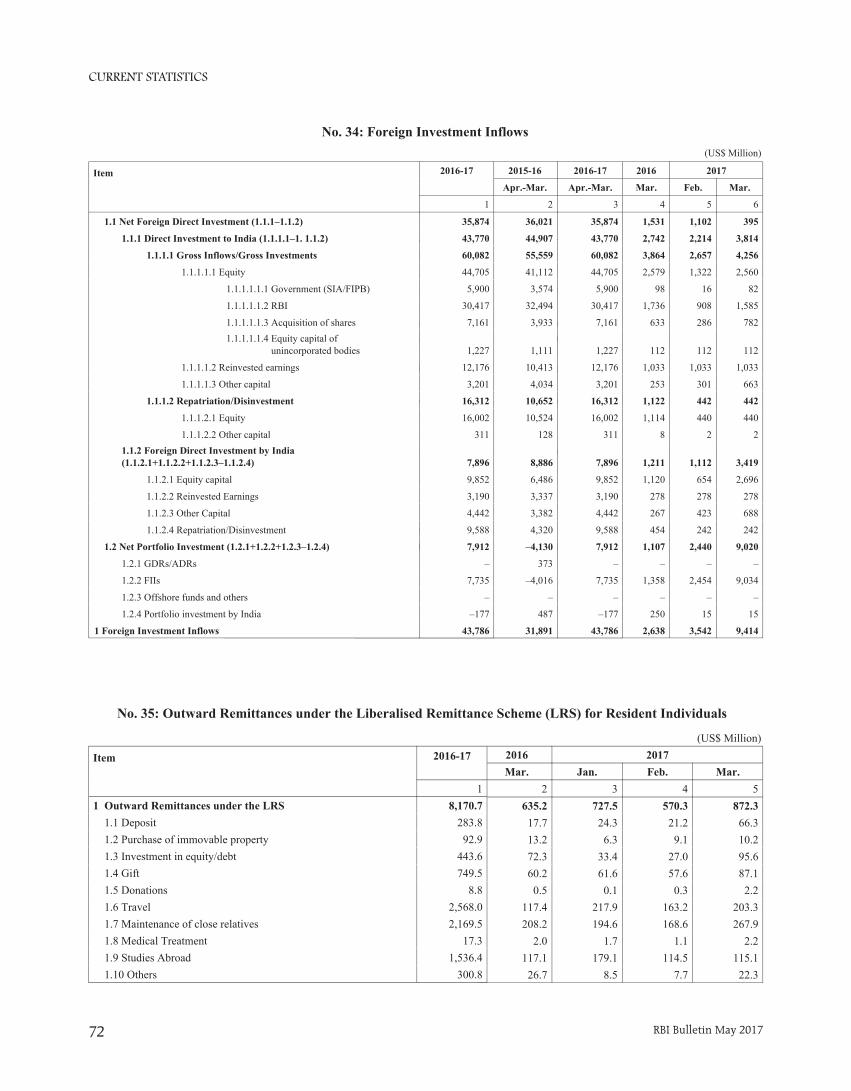
CURRENT STATISTICS
RBI Bulletin May 201772
No. 34: Foreign Investment Inflows(US$ Million)
2016 2017
Mar. Feb. Mar.
4 5 6
1.1 Net Foreign Direct Investment (1.1.1–1.1.2) 1,531 1,102 395
1.1.1 Direct Investment to India (1.1.1.1–1. 1.1.2) 2,742 2,214 3,814
1.1.1.1 Gross Inflows/Gross Investments 3,864 2,657 4,256
1.1.1.1.1 Equity 2,579 1,322 2,560
1.1.1.1.1.1 Government (SIA/FI 98 16 82
1.1.1.1.1.2 RBI 1,736 908 1,585
1.1.1.1.1.3 Acquisition of shares 633 286 782 1.1.1.1.1.4 Equity capital of unincorporated bodie 112 112 112
1.1.1.1.2 Reinvested earnings 1,033 1,033 1,033
1.1.1.1.3 Other capital 253 301 663
1.1.1.2 Repatriation/Disinvestment 1,122 442 442
1.1.1.2.1 Equity 1,114 440 440
1.1.1.2.2 Other capital 8 2 2 1.1.2 Foreign Direct Investment by India (1.1.2.1+1.1.2.2+1.1.2.3–1.1.2.4) 1,211 1,112 3,419
1.1.2.1 Equity capital 1,120 654 2,696
1.1.2.2 Reinvested Earnings 278 278 278
1.1.2.3 Other Capital 267 423 688
1.1.2.4 Repatriation/Disinvestment 454 242 242
1.2 Net Portfolio Investment (1.2.1+1.2.2+1.2.3–1.2.4) 1,107 2,440 9,020
1.2.1 GDRs/ADRs – – –
1.2.2 FIIs 1,358 2,454 9,034
1.2.3 Offshore funds and others – – –
1.2.4 Portfolio investment by India 250 15 15
1 Foreign Investment Inflows 2,638 3,542 9,414
2015-16 2016-17
Apr.-Mar. Apr.-Mar.
2 3
1.1 Net Foreign Direct Investment (1.1.1–1.1.2) 36,021 35,874
1.1.1 Direct Investment to India (1.1.1.1–1. 1.1.2) 44,907 43,770
1.1.1.1 Gross Inflows/Gross Investments 55,559 60,082
1.1.1.1.1 Equity 41,112 44,705
1.1.1.1.1.1 Government (SIA/FI 3,574 5,900
1.1.1.1.1.2 RBI 32,494 30,417
1.1.1.1.1.3 Acquisition of shares 3,933 7,161 1.1.1.1.1.4 Equity capital of unincorporated bodie 1,111 1,227
1.1.1.1.2 Reinvested earnings 10,413 12,176
1.1.1.1.3 Other capital 4,034 3,201
1.1.1.2 Repatriation/Disinvestment 10,652 16,312
1.1.1.2.1 Equity 10,524 16,002
1.1.1.2.2 Other capital 128 311 1.1.2 Foreign Direct Investment by India (1.1.2.1+1.1.2.2+1.1.2.3–1.1.2.4) 8,886 7,896
1.1.2.1 Equity capital 6,486 9,852
1.1.2.2 Reinvested Earnings 3,337 3,190
1.1.2.3 Other Capital 3,382 4,442
1.1.2.4 Repatriation/Disinvestment 4,320 9,588
1.2 Net Portfolio Investment (1.2.1+1.2.2+1.2.3–1.2.4) –4,130 7,912
1.2.1 GDRs/ADRs 373 –
1.2.2 FIIs –4,016 7,735
1.2.3 Offshore funds and others – –
1.2.4 Portfolio investment by India 487 –177
1 Foreign Investment Inflows 31,891 43,786
Item 2016-17
1
1.1 Net Foreign Direct Investment (1.1.1–1.1.2) 35,874
1.1.1 Direct Investment to India (1.1.1.1–1. 1.1.2) 43,770
1.1.1.1 Gross Inflows/Gross Investments 60,082
1.1.1.1.1 Equity 44,705
1.1.1.1.1.1 Government (SIA/FIPB) 5,900
1.1.1.1.1.2 RBI 30,417
1.1.1.1.1.3 Acquisition of shares 7,161 1.1.1.1.1.4 Equity capital of unincorporated bodies 1,227
1.1.1.1.2 Reinvested earnings 12,176
1.1.1.1.3 Other capital 3,201
1.1.1.2 Repatriation/Disinvestment 16,312
1.1.1.2.1 Equity 16,002
1.1.1.2.2 Other capital 311 1.1.2 Foreign Direct Investment by India (1.1.2.1+1.1.2.2+1.1.2.3–1.1.2.4) 7,896
1.1.2.1 Equity capital 9,852
1.1.2.2 Reinvested Earnings 3,190
1.1.2.3 Other Capital 4,442
1.1.2.4 Repatriation/Disinvestment 9,588
1.2 Net Portfolio Investment (1.2.1+1.2.2+1.2.3–1.2.4) 7,912
1.2.1 GDRs/ADRs –
1.2.2 FIIs 7,735
1.2.3 Offshore funds and others –
1.2.4 Portfolio investment by India –177
1 Foreign Investment Inflows 43,786
No. 35: Outward Remittances under the Liberalised Remittance Scheme (LRS) for Resident Individuals
(US$ Million)2016 2017Mar. Jan. Feb. Mar.
2 3 4 5635.2 727.5 570.3 872.3
17.7 24.3 21.2 66.313.2 6.3 9.1 10.272.3 33.4 27.0 95.660.2 61.6 57.6 87.10.5 0.1 0.3 2.2
117.4 217.9 163.2 203.3208.2 194.6 168.6 267.9
2.0 1.7 1.1 2.2117.1 179.1 114.5 115.1
26.7 8.5 7.7 22.3
Item 2016-17
11 Outward Remittances under the LRS 8,170.7 1.1 Deposit 283.8 1.2 Purchase of immovable property 92.9 1.3 Investment in equity/debt 443.6 1.4 Gift 749.5 1.5 Donations 8.8 1.6 Travel 2,568.0 1.7 Maintenance of close relatives 2,169.5 1.8 Medical Treatment 17.3 1.9 Studies Abroad 1,536.4 1.10 Others 300.8
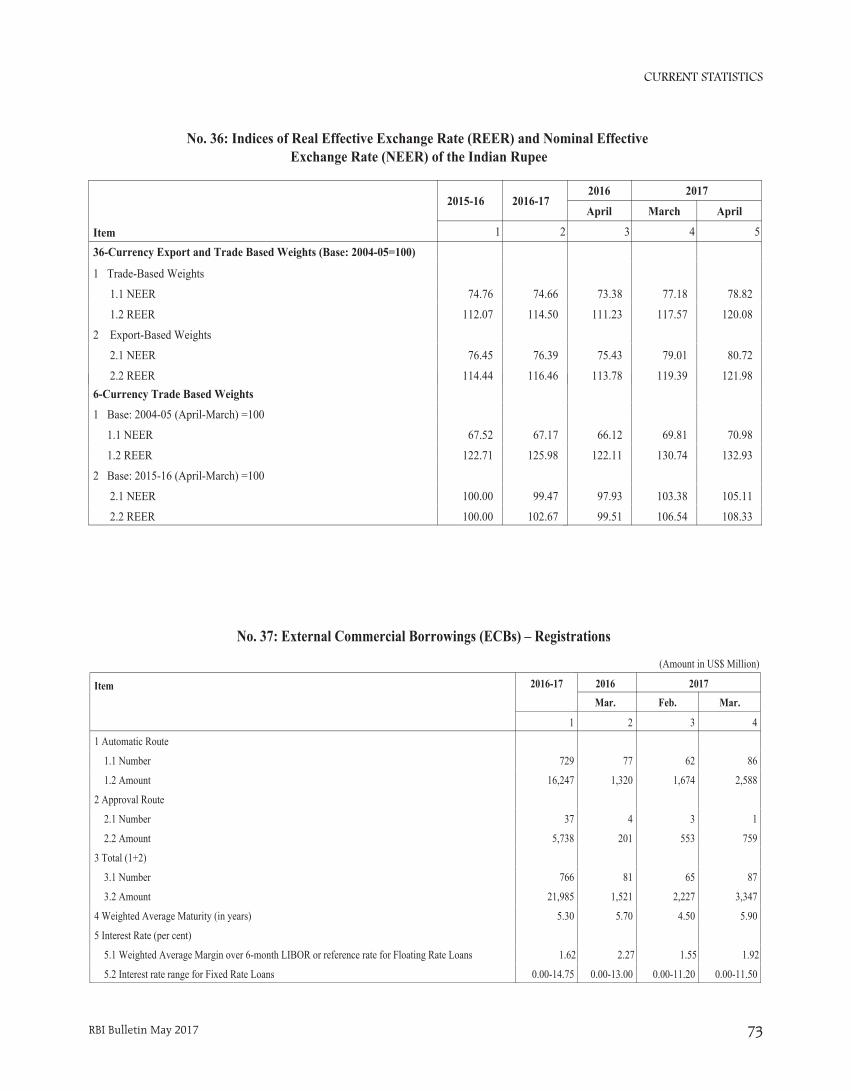
CURRENT STATISTICS
RBI Bulletin May 2017 73
No. 36: Indices of Real Effective Exchange Rate (REER) and Nominal Effective Exchange Rate (NEER) of the Indian Rupee
66.12 69.81 70.98
122.11 130.74 132.93
97.93 103.38 105.11
99.51 106.54 108.33
2016 2017
April March April
3 4 5
73.38 77.18 78.82
111.23 117.57 120.08
75.43 79.01 80.72
113.78 119.39 121.982015-16 2016-17 6-Currency Trade Based Weights
1 Base: 2004-05 (April-March) =100
1.1 NEER 67.52 67.17
1.2 REER 122.71 125.98
2 Base: 2015-16 (April-March) =100
2.1 NEER 100.00 99.47
2.2 REER 100.00 102.67
Item
2015-16 2016-17
1 2
36-Currency Export and Trade Based Weights (Base: 2004-05=100)
1 Trade-Based Weights
1.1 NEER 74.76 74.66
1.2 REER 112.07 114.50
2 Export-Based Weights
2.1 NEER 76.45 76.39
2.2 REER 114.44 116.46
(Amount in US$ Million)
2016 2017
Mar. Feb. Mar.
2 3 4
77 62 86
1,320 1,674 2,588
4 3 1
201 553 759
81 65 87
1,521 2,227 3,347
5.70 4.50 5.90
2.27 1.55 1.92
0.00-13.00 0.00-11.20 0.00-11.50
No. 37: External Commercial Borrowings (ECBs) – Registrations
Item 2016-17
1
1 Automatic Route
1.1 Number 729
1.2 Amount 16,247
2 Approval Route
2.1 Number 37
2.2 Amount 5,738
3 Total (1+2)
3.1 Number 766
3.2 Amount 21,985
4 Weighted Average Maturity (in years) 5.30
5 Interest Rate (per cent)
5.1 Weighted Average Margin over 6-month LIBOR or reference rate for Floating Rate Loans 1.62
5.2 Interest rate range for Fixed Rate Loans 0.00-14.75

CURRENT STATISTICS
RBI Bulletin May 201774
No. 38: India's Overall Balance of Payments
(US $ Million)
Item
Oct-Dec 2015 (PR) Oct-Dec 2016 (P)
Credit Debit Net Credit Debit Net
1 2 3 4 5 6
Overall Balance of Payments(1+2+3) 237,940 233,883 4,056 268,138 269,380 –1,2421 CURRENT ACCOUNT (1.1+ 1.2) 122,575 129,697 –7,121 130,151 138,069 –7,9191.1 MERCHANDISE 64,937 98,913 –33,975 68,755 102,032 –33,2771.2 INVISIBLES (1.2.1+1.2.2+1.2.3) 57,638 30,784 26,854 61,395 36,037 25,358 1.2.1 Services 37,904 19,891 18,013 42,148 24,508 17,639 1.2.1.1 Travel 5,761 3,357 2,404 6,187 3,710 2,476 1.2.1.2 Transportation 3,310 3,450 –140 3,797 3,268 529 1.2.1.3 Insurance 449 334 115 522 413 109 1.2.1.4 G.n.i.e. 147 123 25 176 135 40 1.2.1.5 Miscellaneous 28,237 12,627 15,610 31,467 16,981 14,486 1.2.1.5.1 Software Services 19,195 639 18,556 18,967 945 18,021 1.2.1.5.2 Business Services 6,667 7,646 –979 8,319 8,067 253 1.2.1.5.3 Financial Services 958 887 72 1,210 1,624 –414 1.2.1.5.4 Communication Services 483 223 260 559 231 327 1.2.2 Transfers 15,936 687 15,250 15,276 1,382 13,894 1.2.2.1 Official 163 218 –55 110 212 –102 1.2.2.2 Private 15,773 469 15,305 15,166 1,170 13,996 1.2.3 Income 3,798 10,206 –6,408 3,972 10,147 –6,176 1.2.3.1 Investment Income 2,918 9,640 –6,722 2,965 9,516 –6,552 1.2.3.2 Compensation of Employees 880 566 314 1,007 631 3762 CAPITAL ACCOUNT (2.1+2.2+2.3+2.4+2.5) 115,102 104,187 10,915 137,465 131,310 6,1552.1 Foreign Investment (2.1.1+2.1.2) 63,614 52,358 11,256 66,972 68,498 –1,527 2.1.1 Foreign Direct Investment 16,982 6,280 10,702 18,567 8,753 9,814 2.1.1.1 In India 16,315 2,399 13,916 18,086 4,871 13,216 2.1.1.1.1 Equity 13,127 2,363 10,763 14,532 4,812 9,720 2.1.1.1.2 Reinvested Earnings 2,631 0 2,631 3,046 0 3,046 2.1.1.1.3 Other Capital 558 36 522 508 59 449 2.1.1.2 Abroad 667 3,881 –3,214 480 3,882 –3,401 2.1.1.2.1 Equity 667 1,934 –1,267 480 2,241 –1,760 2.1.1.2.2 Reinvested Earnings 0 834 –834 0 688 –688 2.1.1.2.3 Other Capital 0 1,113 –1,113 0 953 –953 2.1.2 Portfolio Investment 46,632 46,078 554 48,405 59,746 –11,341 2.1.2.1 In India 46,521 45,957 563 48,250 59,564 –11,314 2.1.2.1.1 FIIs 46,521 45,957 563 48,250 59,564 –11,314 2.1.2.1.1.1 Equity 36,520 37,148 –629 37,637 42,371 –4,733 2.1.2.1.1.2 Debt 10,001 8,809 1,192 10,613 17,194 –6,581 2.1.2.1.2 ADR/GDRs 0 0 0 0 0 0 2.1.2.2 Abroad 111 121 –9 154 181 –272.2 Loans (2.2.1+2.2.2+2.2.3) 28,768 31,095 –2,328 31,179 29,495 1,685 2.2.1 External Assistance 1,513 1,175 338 1,601 1,058 543 2.2.1.1 By India 15 129 –113 14 57 –43 2.2.1.2 To India 1,498 1,047 451 1,587 1,001 586 2.2.2 Commercial Borrowings 6,525 7,405 –880 6,121 7,943 –1,822 2.2.2.1 By India 432 200 232 963 280 683 2.2.2.2 To India 6,093 7,205 –1,112 5,158 7,663 –2,505 2.2.3 Short Term to India 20,729 22,515 –1,786 23,457 20,493 2,964 2.2.3.1 Suppliers' Credit > 180 days & Buyers' Credit 20,062 22,515 –2,453 22,700 20,493 2,207 2.2.3.2 Suppliers' Credit up to 180 days 667 0 667 757 0 7572.3 Banking Capital (2.3.1+2.3.2) 17,348 16,033 1,315 30,610 27,430 3,180 2.3.1 Commercial Banks 17,347 16,033 1,314 30,610 27,427 3,182 2.3.1.1 Assets 3,731 3,941 –211 19,123 107 19,016 2.3.1.2 Liabilities 13,616 12,092 1,524 11,487 27,321 –15,834 2.3.1.2.1 Non-Resident Deposits 11,829 10,279 1,550 7,450 25,980 –18,530 2.3.2 Others 2 0 2 0 2 –22.4 Rupee Debt Service 0 0 0 0 0 02.5 Other Capital 5,372 4,701 672 8,705 5,888 2,8173 Errors & Omissions 262 0 262 522 0 5224 Monetary Movements (4.1+ 4.2) 0 4,056 –4,056 1,242 0 1,242 4.1 I.M.F. 0 0 0 0 0 0 4.2 Foreign Exchange Reserves (Increase - / Decrease +) 0 4,056 –4,056 1,242 0 1,242
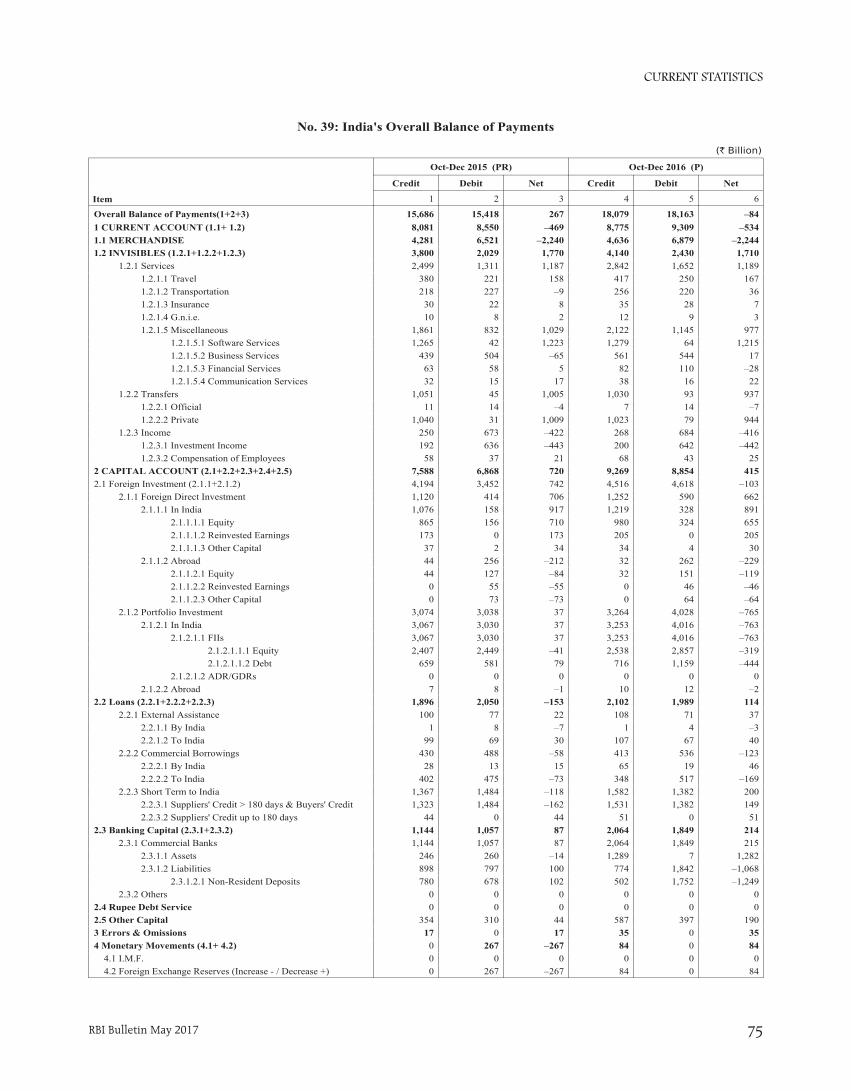
CURRENT STATISTICS
RBI Bulletin May 2017 75
No. 39: India's Overall Balance of Payments
(` Billion)
Item
Oct-Dec 2015 (PR) Oct-Dec 2016 (P)
Credit Debit Net Credit Debit Net
1 2 3 4 5 6
Overall Balance of Payments(1+2+3) 15,686 15,418 267 18,079 18,163 –841 CURRENT ACCOUNT (1.1+ 1.2) 8,081 8,550 –469 8,775 9,309 –5341.1 MERCHANDISE 4,281 6,521 –2,240 4,636 6,879 –2,2441.2 INVISIBLES (1.2.1+1.2.2+1.2.3) 3,800 2,029 1,770 4,140 2,430 1,710 1.2.1 Services 2,499 1,311 1,187 2,842 1,652 1,189 1.2.1.1 Travel 380 221 158 417 250 167 1.2.1.2 Transportation 218 227 –9 256 220 36 1.2.1.3 Insurance 30 22 8 35 28 7 1.2.1.4 G.n.i.e. 10 8 2 12 9 3 1.2.1.5 Miscellaneous 1,861 832 1,029 2,122 1,145 977 1.2.1.5.1 Software Services 1,265 42 1,223 1,279 64 1,215 1.2.1.5.2 Business Services 439 504 –65 561 544 17 1.2.1.5.3 Financial Services 63 58 5 82 110 –28 1.2.1.5.4 Communication Services 32 15 17 38 16 22 1.2.2 Transfers 1,051 45 1,005 1,030 93 937 1.2.2.1 Official 11 14 –4 7 14 –7 1.2.2.2 Private 1,040 31 1,009 1,023 79 944 1.2.3 Income 250 673 –422 268 684 –416 1.2.3.1 Investment Income 192 636 –443 200 642 –442 1.2.3.2 Compensation of Employees 58 37 21 68 43 252 CAPITAL ACCOUNT (2.1+2.2+2.3+2.4+2.5) 7,588 6,868 720 9,269 8,854 4152.1 Foreign Investment (2.1.1+2.1.2) 4,194 3,452 742 4,516 4,618 –103 2.1.1 Foreign Direct Investment 1,120 414 706 1,252 590 662 2.1.1.1 In India 1,076 158 917 1,219 328 891 2.1.1.1.1 Equity 865 156 710 980 324 655 2.1.1.1.2 Reinvested Earnings 173 0 173 205 0 205 2.1.1.1.3 Other Capital 37 2 34 34 4 30 2.1.1.2 Abroad 44 256 –212 32 262 –229 2.1.1.2.1 Equity 44 127 –84 32 151 –119 2.1.1.2.2 Reinvested Earnings 0 55 –55 0 46 –46 2.1.1.2.3 Other Capital 0 73 –73 0 64 –64 2.1.2 Portfolio Investment 3,074 3,038 37 3,264 4,028 –765 2.1.2.1 In India 3,067 3,030 37 3,253 4,016 –763 2.1.2.1.1 FIIs 3,067 3,030 37 3,253 4,016 –763 2.1.2.1.1.1 Equity 2,407 2,449 –41 2,538 2,857 –319 2.1.2.1.1.2 Debt 659 581 79 716 1,159 –444 2.1.2.1.2 ADR/GDRs 0 0 0 0 0 0 2.1.2.2 Abroad 7 8 –1 10 12 –22.2 Loans (2.2.1+2.2.2+2.2.3) 1,896 2,050 –153 2,102 1,989 114 2.2.1 External Assistance 100 77 22 108 71 37 2.2.1.1 By India 1 8 –7 1 4 –3 2.2.1.2 To India 99 69 30 107 67 40 2.2.2 Commercial Borrowings 430 488 –58 413 536 –123 2.2.2.1 By India 28 13 15 65 19 46 2.2.2.2 To India 402 475 –73 348 517 –169 2.2.3 Short Term to India 1,367 1,484 –118 1,582 1,382 200 2.2.3.1 Suppliers' Credit > 180 days & Buyers' Credit 1,323 1,484 –162 1,531 1,382 149 2.2.3.2 Suppliers' Credit up to 180 days 44 0 44 51 0 512.3 Banking Capital (2.3.1+2.3.2) 1,144 1,057 87 2,064 1,849 214 2.3.1 Commercial Banks 1,144 1,057 87 2,064 1,849 215 2.3.1.1 Assets 246 260 –14 1,289 7 1,282 2.3.1.2 Liabilities 898 797 100 774 1,842 –1,068 2.3.1.2.1 Non-Resident Deposits 780 678 102 502 1,752 –1,249 2.3.2 Others 0 0 0 0 0 02.4 Rupee Debt Service 0 0 0 0 0 02.5 Other Capital 354 310 44 587 397 1903 Errors & Omissions 17 0 17 35 0 354 Monetary Movements (4.1+ 4.2) 0 267 –267 84 0 84 4.1 I.M.F. 0 0 0 0 0 0 4.2 Foreign Exchange Reserves (Increase - / Decrease +) 0 267 –267 84 0 84
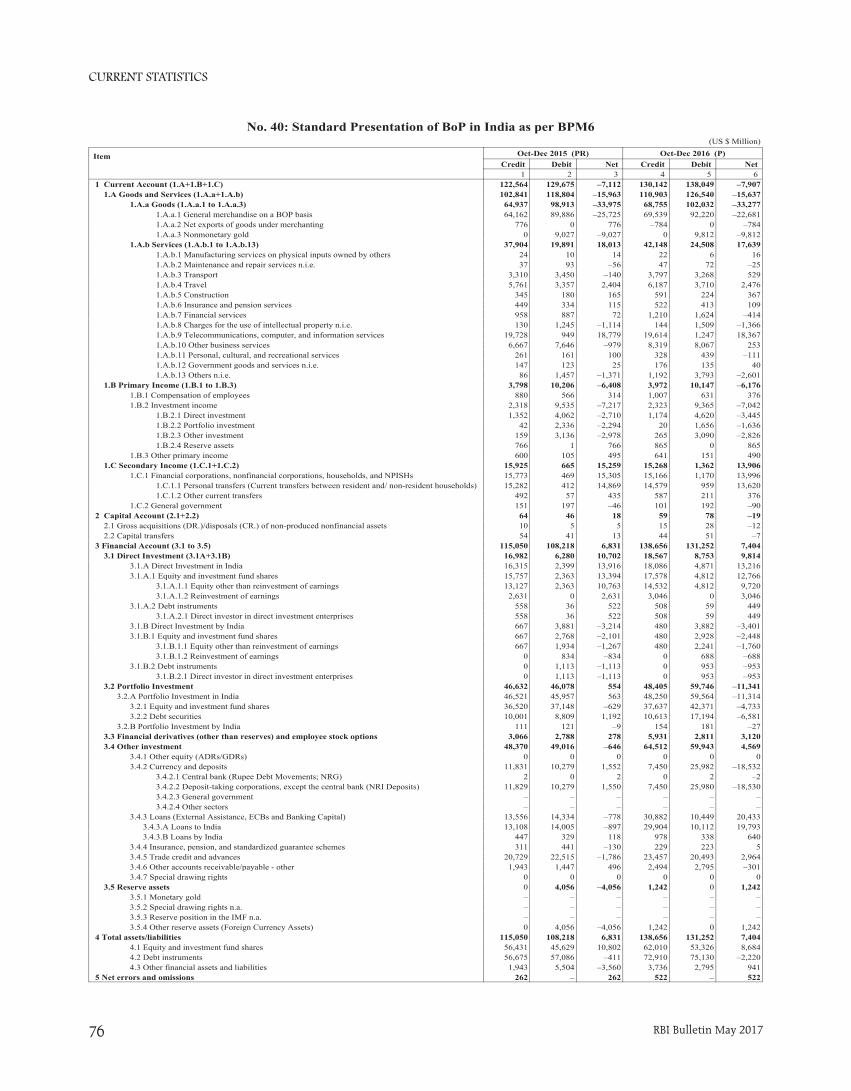
CURRENT STATISTICS
RBI Bulletin May 201776
(US $ Million)
Item Oct-Dec 2015 (PR) Oct-Dec 2016 (P)Credit Debit Net Credit Debit Net
1 2 3 4 5 61 Current Account (1.A+1.B+1.C) 122,564 129,675 –7,112 130,142 138,049 –7,907 1.A Goods and Services (1.A.a+1.A.b) 102,841 118,804 –15,963 110,903 126,540 –15,637 1.A.a Goods (1.A.a.1 to 1.A.a.3) 64,937 98,913 –33,975 68,755 102,032 –33,277 1.A.a.1 General merchandise on a BOP basis 64,162 89,886 –25,725 69,539 92,220 –22,681 1.A.a.2 Net exports of goods under merchanting 776 0 776 –784 0 –784 1.A.a.3 Nonmonetary gold 0 9,027 –9,027 0 9,812 –9,812 1.A.b Services (1.A.b.1 to 1.A.b.13) 37,904 19,891 18,013 42,148 24,508 17,639 1.A.b.1 Manufacturing services on physical inputs owned by others 24 10 14 22 6 16 1.A.b.2 Maintenance and repair services n.i.e. 37 93 –56 47 72 –25 1.A.b.3 Transport 3,310 3,450 –140 3,797 3,268 529 1.A.b.4 Travel 5,761 3,357 2,404 6,187 3,710 2,476 1.A.b.5 Construction 345 180 165 591 224 367 1.A.b.6 Insurance and pension services 449 334 115 522 413 109 1.A.b.7 Financial services 958 887 72 1,210 1,624 –414 1.A.b.8 Charges for the use of intellectual property n.i.e. 130 1,245 –1,114 144 1,509 –1,366 1.A.b.9 Telecommunications, computer, and information services 19,728 949 18,779 19,614 1,247 18,367 1.A.b.10 Other business services 6,667 7,646 –979 8,319 8,067 253 1.A.b.11 Personal, cultural, and recreational services 261 161 100 328 439 –111 1.A.b.12 Government goods and services n.i.e. 147 123 25 176 135 40 1.A.b.13 Others n.i.e. 86 1,457 –1,371 1,192 3,793 –2,601 1.B Primary Income (1.B.1 to 1.B.3) 3,798 10,206 –6,408 3,972 10,147 –6,176 1.B.1 Compensation of employees 880 566 314 1,007 631 376 1.B.2 Investment income 2,318 9,535 –7,217 2,323 9,365 –7,042 1.B.2.1 Direct investment 1,352 4,062 –2,710 1,174 4,620 –3,445 1.B.2.2 Portfolio investment 42 2,336 –2,294 20 1,656 –1,636 1.B.2.3 Other investment 159 3,136 –2,978 265 3,090 –2,826 1.B.2.4 Reserve assets 766 1 766 865 0 865 1.B.3 Other primary income 600 105 495 641 151 490 1.C Secondary Income (1.C.1+1.C.2) 15,925 665 15,259 15,268 1,362 13,906 1.C.1 Financial corporations, nonfinancial corporations, households, and NPISHs 15,773 469 15,305 15,166 1,170 13,996 1.C.1.1 Personal transfers (Current transfers between resident and/ non-resident households) 15,282 412 14,869 14,579 959 13,620 1.C.1.2 Other current transfers 492 57 435 587 211 376 1.C.2 General government 151 197 –46 101 192 –902 Capital Account (2.1+2.2) 64 46 18 59 78 –19 2.1 Gross acquisitions (DR.)/disposals (CR.) of non-produced nonfinancial assets 10 5 5 15 28 –12 2.2 Capital transfers 54 41 13 44 51 –73 Financial Account (3.1 to 3.5) 115,050 108,218 6,831 138,656 131,252 7,404 3.1 Direct Investment (3.1A+3.1B) 16,982 6,280 10,702 18,567 8,753 9,814 3.1.A Direct Investment in India 16,315 2,399 13,916 18,086 4,871 13,216 3.1.A.1 Equity and investment fund shares 15,757 2,363 13,394 17,578 4,812 12,766 3.1.A.1.1 Equity other than reinvestment of earnings 13,127 2,363 10,763 14,532 4,812 9,720 3.1.A.1.2 Reinvestment of earnings 2,631 0 2,631 3,046 0 3,046 3.1.A.2 Debt instruments 558 36 522 508 59 449 3.1.A.2.1 Direct investor in direct investment enterprises 558 36 522 508 59 449 3.1.B Direct Investment by India 667 3,881 –3,214 480 3,882 –3,401 3.1.B.1 Equity and investment fund shares 667 2,768 –2,101 480 2,928 –2,448 3.1.B.1.1 Equity other than reinvestment of earnings 667 1,934 –1,267 480 2,241 –1,760 3.1.B.1.2 Reinvestment of earnings 0 834 –834 0 688 –688 3.1.B.2 Debt instruments 0 1,113 –1,113 0 953 –953 3.1.B.2.1 Direct investor in direct investment enterprises 0 1,113 –1,113 0 953 –953 3.2 Portfolio Investment 46,632 46,078 554 48,405 59,746 –11,341 3.2.A Portfolio Investment in India 46,521 45,957 563 48,250 59,564 –11,314 3.2.1 Equity and investment fund shares 36,520 37,148 –629 37,637 42,371 –4,733 3.2.2 Debt securities 10,001 8,809 1,192 10,613 17,194 –6,581 3.2.B Portfolio Investment by India 111 121 –9 154 181 –27 3.3 Financial derivatives (other than reserves) and employee stock options 3,066 2,788 278 5,931 2,811 3,120 3.4 Other investment 48,370 49,016 –646 64,512 59,943 4,569 3.4.1 Other equity (ADRs/GDRs) 0 0 0 0 0 0 3.4.2 Currency and deposits 11,831 10,279 1,552 7,450 25,982 –18,532 3.4.2.1 Central bank (Rupee Debt Movements; NRG) 2 0 2 0 2 –2 3.4.2.2 Deposit-taking corporations, except the central bank (NRI Deposits) 11,829 10,279 1,550 7,450 25,980 –18,530 3.4.2.3 General government – – – – – – 3.4.2.4 Other sectors – – – – – – 3.4.3 Loans (External Assistance, ECBs and Banking Capital) 13,556 14,334 –778 30,882 10,449 20,433 3.4.3.A Loans to India 13,108 14,005 –897 29,904 10,112 19,793 3.4.3.B Loans by India 447 329 118 978 338 640 3.4.4 Insurance, pension, and standardized guarantee schemes 311 441 –130 229 223 5 3.4.5 Trade credit and advances 20,729 22,515 –1,786 23,457 20,493 2,964 3.4.6 Other accounts receivable/payable - other 1,943 1,447 496 2,494 2,795 –301 3.4.7 Special drawing rights 0 0 0 0 0 0 3.5 Reserve assets 0 4,056 –4,056 1,242 0 1,242 3.5.1 Monetary gold – – – – – – 3.5.2 Special drawing rights n.a. – – – – – – 3.5.3 Reserve position in the IMF n.a. – – – – – – 3.5.4 Other reserve assets (Foreign Currency Assets) 0 4,056 –4,056 1,242 0 1,2424 Total assets/liabilities 115,050 108,218 6,831 138,656 131,252 7,404 4.1 Equity and investment fund shares 56,431 45,629 10,802 62,010 53,326 8,684 4.2 Debt instruments 56,675 57,086 –411 72,910 75,130 –2,220 4.3 Other financial assets and liabilities 1,943 5,504 –3,560 3,736 2,795 9415 Net errors and omissions 262 – 262 522 – 522
No. 40: Standard Presentation of BoP in India as per BPM6
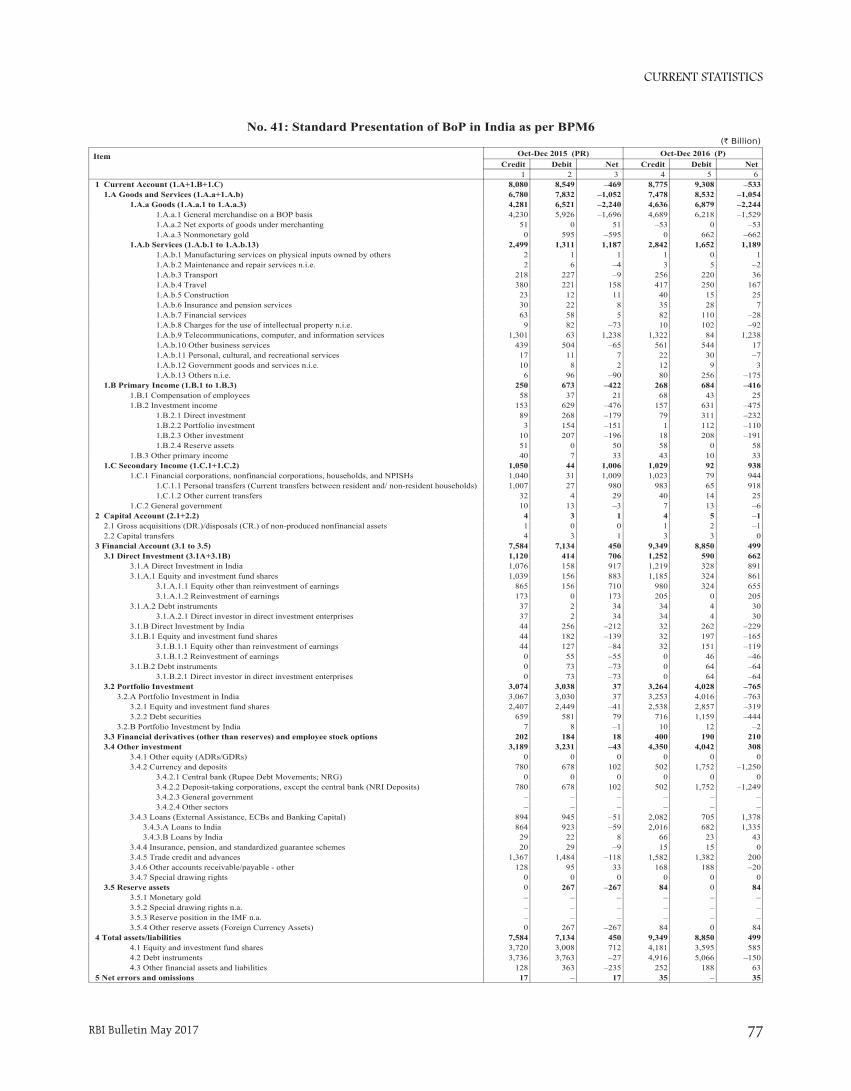
CURRENT STATISTICS
RBI Bulletin May 2017 77
(` Billion)
Item Oct-Dec 2015 (PR) Oct-Dec 2016 (P)Credit Debit Net Credit Debit Net
1 2 3 4 5 61 Current Account (1.A+1.B+1.C) 8,080 8,549 –469 8,775 9,308 –533 1.A Goods and Services (1.A.a+1.A.b) 6,780 7,832 –1,052 7,478 8,532 –1,054 1.A.a Goods (1.A.a.1 to 1.A.a.3) 4,281 6,521 –2,240 4,636 6,879 –2,244 1.A.a.1 General merchandise on a BOP basis 4,230 5,926 –1,696 4,689 6,218 –1,529 1.A.a.2 Net exports of goods under merchanting 51 0 51 –53 0 –53 1.A.a.3 Nonmonetary gold 0 595 –595 0 662 –662 1.A.b Services (1.A.b.1 to 1.A.b.13) 2,499 1,311 1,187 2,842 1,652 1,189 1.A.b.1 Manufacturing services on physical inputs owned by others 2 1 1 1 0 1 1.A.b.2 Maintenance and repair services n.i.e. 2 6 –4 3 5 –2 1.A.b.3 Transport 218 227 –9 256 220 36 1.A.b.4 Travel 380 221 158 417 250 167 1.A.b.5 Construction 23 12 11 40 15 25 1.A.b.6 Insurance and pension services 30 22 8 35 28 7 1.A.b.7 Financial services 63 58 5 82 110 –28 1.A.b.8 Charges for the use of intellectual property n.i.e. 9 82 –73 10 102 –92 1.A.b.9 Telecommunications, computer, and information services 1,301 63 1,238 1,322 84 1,238 1.A.b.10 Other business services 439 504 –65 561 544 17 1.A.b.11 Personal, cultural, and recreational services 17 11 7 22 30 –7 1.A.b.12 Government goods and services n.i.e. 10 8 2 12 9 3 1.A.b.13 Others n.i.e. 6 96 –90 80 256 –175 1.B Primary Income (1.B.1 to 1.B.3) 250 673 –422 268 684 –416 1.B.1 Compensation of employees 58 37 21 68 43 25 1.B.2 Investment income 153 629 –476 157 631 –475 1.B.2.1 Direct investment 89 268 –179 79 311 –232 1.B.2.2 Portfolio investment 3 154 –151 1 112 –110 1.B.2.3 Other investment 10 207 –196 18 208 –191 1.B.2.4 Reserve assets 51 0 50 58 0 58 1.B.3 Other primary income 40 7 33 43 10 33 1.C Secondary Income (1.C.1+1.C.2) 1,050 44 1,006 1,029 92 938 1.C.1 Financial corporations, nonfinancial corporations, households, and NPISHs 1,040 31 1,009 1,023 79 944 1.C.1.1 Personal transfers (Current transfers between resident and/ non-resident households) 1,007 27 980 983 65 918 1.C.1.2 Other current transfers 32 4 29 40 14 25 1.C.2 General government 10 13 –3 7 13 –62 Capital Account (2.1+2.2) 4 3 1 4 5 –1 2.1 Gross acquisitions (DR.)/disposals (CR.) of non-produced nonfinancial assets 1 0 0 1 2 –1 2.2 Capital transfers 4 3 1 3 3 03 Financial Account (3.1 to 3.5) 7,584 7,134 450 9,349 8,850 499 3.1 Direct Investment (3.1A+3.1B) 1,120 414 706 1,252 590 662 3.1.A Direct Investment in India 1,076 158 917 1,219 328 891 3.1.A.1 Equity and investment fund shares 1,039 156 883 1,185 324 861 3.1.A.1.1 Equity other than reinvestment of earnings 865 156 710 980 324 655 3.1.A.1.2 Reinvestment of earnings 173 0 173 205 0 205 3.1.A.2 Debt instruments 37 2 34 34 4 30 3.1.A.2.1 Direct investor in direct investment enterprises 37 2 34 34 4 30 3.1.B Direct Investment by India 44 256 –212 32 262 –229 3.1.B.1 Equity and investment fund shares 44 182 –139 32 197 –165 3.1.B.1.1 Equity other than reinvestment of earnings 44 127 –84 32 151 –119 3.1.B.1.2 Reinvestment of earnings 0 55 –55 0 46 –46 3.1.B.2 Debt instruments 0 73 –73 0 64 –64 3.1.B.2.1 Direct investor in direct investment enterprises 0 73 –73 0 64 –64 3.2 Portfolio Investment 3,074 3,038 37 3,264 4,028 –765 3.2.A Portfolio Investment in India 3,067 3,030 37 3,253 4,016 –763 3.2.1 Equity and investment fund shares 2,407 2,449 –41 2,538 2,857 –319 3.2.2 Debt securities 659 581 79 716 1,159 –444 3.2.B Portfolio Investment by India 7 8 –1 10 12 –2 3.3 Financial derivatives (other than reserves) and employee stock options 202 184 18 400 190 210 3.4 Other investment 3,189 3,231 –43 4,350 4,042 308 3.4.1 Other equity (ADRs/GDRs) 0 0 0 0 0 0 3.4.2 Currency and deposits 780 678 102 502 1,752 –1,250 3.4.2.1 Central bank (Rupee Debt Movements; NRG) 0 0 0 0 0 0 3.4.2.2 Deposit-taking corporations, except the central bank (NRI Deposits) 780 678 102 502 1,752 –1,249 3.4.2.3 General government – – – – – – 3.4.2.4 Other sectors – – – – – – 3.4.3 Loans (External Assistance, ECBs and Banking Capital) 894 945 –51 2,082 705 1,378 3.4.3.A Loans to India 864 923 –59 2,016 682 1,335 3.4.3.B Loans by India 29 22 8 66 23 43 3.4.4 Insurance, pension, and standardized guarantee schemes 20 29 –9 15 15 0 3.4.5 Trade credit and advances 1,367 1,484 –118 1,582 1,382 200 3.4.6 Other accounts receivable/payable - other 128 95 33 168 188 –20 3.4.7 Special drawing rights 0 0 0 0 0 0 3.5 Reserve assets 0 267 –267 84 0 84 3.5.1 Monetary gold – – – – – – 3.5.2 Special drawing rights n.a. – – – – – – 3.5.3 Reserve position in the IMF n.a. – – – – – – 3.5.4 Other reserve assets (Foreign Currency Assets) 0 267 –267 84 0 844 Total assets/liabilities 7,584 7,134 450 9,349 8,850 499 4.1 Equity and investment fund shares 3,720 3,008 712 4,181 3,595 585 4.2 Debt instruments 3,736 3,763 –27 4,916 5,066 –150 4.3 Other financial assets and liabilities 128 363 –235 252 188 635 Net errors and omissions 17 – 17 35 – 35
No. 41: Standard Presentation of BoP in India as per BPM6

CURRENT STATISTICS
RBI Bulletin May 201778
(US$ Million)
2015 2016
Dec. Sep. Dec.
Assets Assets Assets
3 4 5
–361,640 –368,450 –364,664
Item 2015-16
Assets
1
6 IIP (Assets - Liabilities) –361,094
(US$ Million)
2015 2016
Dec. Sep. Dec.
Assets Liabilities Assets Liabilities Assets Liabilities
3 4 5 6 7 8
139,038 282,609 140,733 311,691 144,134 318,502
95,122 269,456 94,176 297,517 96,623 304,514
43,916 13,153 46,557 14,174 47,511 13,988
1,710 225,292 2,256 232,086 2,283 221,183
1,568 141,693 1,943 148,085 2,280 140,567
143 83,599 313 84,001 4 80,616
41,656 386,525 50,396 390,049 36,124 366,419
4,548 79,551 2,236 81,964 1,949 84,778
3,683 170,749 6,258 166,897 4,245 160,295
17,322 122,800 26,535 130,220 14,594 110,019
16,103 13,425 15,368 10,968 15,335 11,327
350,381 – 371,990 – 358,898 –
532,786 894,426 565,376 933,826 541,439 906,104
No. 42: International Investment Position
Item2015-16
Assets Liabilities
1 2
1 Direct Investment Abroad/in India 141,626 293,854
1.1 Equity Capital and Reinvested Earnings 96,961 280,267
1.2 Other Capital 44,665 13,587
2 Portfolio Investment 2,461 224,783
2.1 Equity 1,541 141,864
2.2 Debt 919 82,919
3 Other Investment 45,850 392,571
3.1 Trade Credit 2,913 82,284
3.2 Loan 6,713 170,472
3.3 Currency and Deposits 20,861 127,109
3.4 Other Assets/Liabilities 15,363 12,706
4 Reserves 360,177 –
5 Total Assets/ Liabilities 550,114 911,208
As on Financial Year /Quarter End

CURRENT STATISTICS
RBI Bulletin May 2017 79
No. 43: Payment System Indicators
Value (` Billion)
2017
Jan. Feb. Mar.
6 7 8
100,602.54 95,266.75 154,094.85
68,863.65 66,382.31 111,825.01
8,622.42 7,836.50 11,550.82
23,116.47 21,047.93 30,719.02
88,068.84 75,377.92 94,415.57
21,189.97 20,269.84 27,536.97
34,408.21 27,361.26 29,315.32
13,427.04 8,366.97 8,522.45
20,981.17 18,994.29 20,792.87
32,470.67 27,746.83 37,563.28
7,281.23 6,406.73 8,654.94
6,618.44 5,993.95 8,062.77
– – –
– – –
– – –
662.79 412.78 592.17
12,399.63 11,961.49 17,699.79
1.43 1.31 1.55
10.51 8.04 9.69
11,355.08 10,877.91 16,294.50
491.25 482.21 564.68
541.36 592.03 829.37
2,335.10 2,575.77 2,947.56
328.62 288.95 331.11
1.54 1.91 2.24
327.08 287.04 328.87
2,006.48 2,286.82 2,616.45
1,516.44 1,928.38 2,259.46
490.04 358.43 356.99
110.01 96.28 106.77
83.53 69.11 73.12
24.22 25.19 30.88
2.26 1.98 2.77
1,383.05 1,279.93 1,730.39
– – –
– – –
– – –
– – –
– – –
187,680.87 170,637.00 247,200.47
2016-17
5
1,253,652.08
849,950.51
131,953.25
271,748.31
1,056,173.36
229,528.33
404,389.08
168,741.46
235,647.62
422,255.95
80,958.15
74,035.22
–
–
–
6,922.93
131,917.39
39.14
144.08
120,039.68
4,111.06
7,583.43
30,208.92
3,307.12
28.34
3,278.78
26,901.79
23,602.73
3,299.07
838.01
532.42
277.52
25.36
13,104.26
–
–
–
–
–
2,281,999.58
Volume(Million )
2017
Jan. Feb. Mar.
2 3 4
9.33 9.11 12.54
8.98 8.80 12.14
0.35 0.31 0.39
0.002 0.002 0.002
0.32 0.25 0.29
0.02 0.02 0.02
0.12 0.08 0.09
0.11 0.07 0.07
0.014 0.012 0.015
0.19 0.16 0.19
131.17 107.94 127.98
118.45 100.44 119.21
- - -
- - -
- - -
12.71 7.50 8.78
386.31 359.28 437.39
0.20 0.19 0.23
0.76 0.68 0.92
164.19 148.21 186.70
62.42 59.75 67.41
158.74 150.45 182.12
1,154.21 1,039.67 1,087.98
113.24 95.35 106.70
0.44 0.42 0.48
112.80 94.93 106.22
1,040.97 944.32 981.28
712.35 692.57 710.11
328.62 251.75 271.17
295.80 280.02 342.09
261.67 246.95 307.45
34.08 33.03 34.58
0.05 0.04 0.06
106.13 95.41 113.63
846.83 869.06 884.72
28.85 29.08 29.84
817.98 839.98 854.87
220402 221302 222475
2015847 2224977 2528758
1,977.14 1,796.26 2,008.27
System
2016-17
1
1 RTGS 107.86
1.1 Customer Transactions 103.66
1.2 Interbank Transactions 4.17
1.3 Interbank Clearing 0.018
2 CCIL Operated Systems 3.65
2.1 CBLO 0.22
2.2 Govt. Securities Clearing 1.51
2.2.1 Outright 1.34
2.2.2 Repo 0.168
2.3 Forex Clearing 1.93
3 Paper Clearing 1,206.69
3.1 Cheque Truncation System (CTS) 1,111.86
3.2 MICR Clearing –
3.2.1 RBI Centres –
3.2.2 Other Centres –
3.3 Non-MICR Clearing 94.83
4 Retail Electronic Clearing 4,161.78
4.1 ECS DR 8.76
4.2 ECS CR (includes NECS) 10.10
4.3 EFT/NEFT 1,622.10
4.4 Immediate Payment Service (IMPS) 506.73
4.5 National Automated Clearing House (NACH) 2,014.10
5 Cards 12,054.47
5.1 Credit Cards 1,092.11
5.1.1 Usage at ATMs 6.36
5.1.2 Usage at POS 1,085.75
5.2 Debit Cards 10,962.36
5.2.1 Usage at ATMs 8,563.06
5.2.2 Usage at POS 2,399.30
6 Prepaid Payment Instruments (PPIs) 1,963.66
6.1 m-Wallet 1,629.98
6.2 PPI Cards 333.11
6.3 Paper Vouchers 0.51
7 Mobile Banking 976.83
8 Cards Outstanding 884.72
8.1 Credit Card 29.84
8.2 Debit Card 854.87
9 Number of ATMs (in actuals) 222475
10 Number of POS (in actuals) 2528758
11 Grand Total (1.1+1.2+2+3+4+5+6) 19,498.09
Note : Data for latest 12 month period is provisional.
Payment and Settlement Systems

CURRENT STATISTICS
RBI Bulletin May 201780
No. 44: Small Savings
(` Billion)
2015 2016
Aug. Jun. Jul. Aug.
2 3 4 5
280.12 343.61 333.82 334.03
6,411.77 6,841.19 6,859.78 6,877.30
244.01 314.49 311.09 308.08
4,040.92 4,338.97 4,354.83 4,374.73
129.36 192.62 192.81 189.60
517.28 678.35 692.39 707.61
0.00 0.00 0.00 0.00
0.00 0.00 0.00 0.00
0.01 –0.01 0.00 0.30
35.86 33.98 33.76 33.85
0.00 0.00 0.00 0.00
2.01 1.04 0.44 –0.21
28.91 28.91 29.69 31.02
1,979.07 1,882.73 1,868.83 1,855.13
8.44 7.66 7.73 7.70
172.45 239.61 242.74 248.52
40.74 40.85 41.46 40.83
579.74 725.14 732.53 738.96
412.22 503.55 505.54 506.55
22.24 31.13 31.70 32.28
42.43 48.63 48.90 49.17
102.85 141.83 146.39 150.96
36.55 44.46 39.30 38.63
754.16 777.82 783.74 790.47
0.08 0.08 0.18 0.18
0.00 0.00 0.00 0.00
0.27 0.22 0.22 0.22
31.63 23.06 17.70 21.41
1,845.99 1,928.97 1,930.16 1,936.09
8.83 6.54 5.57 6.90
870.22 867.65 866.00 866.04
0.00 0.00 0.00 0.00
8.87 8.87 8.87 8.92
–0.61 – 0.10 0.03
754.94 613.57 604.34 595.60
23.41 16.52 12.03 14.48
106.63 326.5 338.52 353
– – – –
–0.86 –0.98 –1.00 –1.00
–0.55 –0.60 –0.60 –0.57
106.74 113.96 114.03 114.10
4.48 6.06 5.03 4.54
524.86 573.25 574.79 566.48
Scheme 2015-16
1
1 Small Savings Receipts 3,224.88
Outstanding 6,805.58
1.1 Total Deposits Receipts 2,820.87
Outstanding 4,287.13
1.1.1 Post Office Saving Bank Deposits Receipts 1,574.15
Outstanding 615.67 1.1.2 MGNREG Receipts 0.00
Outstanding 0.00 1.1.3 National Saving Scheme, 1987 Receipts 0.51
Outstanding 34.97 1.1.4 National Saving Scheme, 1992 Receipts 0.06
Outstanding 1.21 1.1.5 Monthly Income Scheme Receipts 315.26
Outstanding 1,938.08 1.1.6 Senior Citizen Scheme Receipts 103.21
Outstanding 228.76 1.1.7 Post Office Time Deposits Receipts 424.53
Outstanding 706.35 1.1.7.1 1 year Time Deposits Outstanding 498.16 1.1.7.2 2 year Time Deposits Outstanding 29.96 1.1.7.3 3 year Time Deposits Outstanding 47.82 1.1.7.4 5 year Time Deposits Outstanding 130.41 1.1.8 Post Office Recurring Deposits Receipts 403.15
Outstanding 761.79 1.1.9 Post Office Cumulative Time Deposits Outstanding 0.08 1.1.10 Other Deposits Receipts 0.05
Outstanding 0.22 1.2 Saving Certificates Receipts 326.10
Outstanding 1,942.42
1.2.1 National Savings Certificate VIII issue Receipts 98.26
Outstanding 881.39 1.2.2 Indira Vikas Patras Receipts 0.00
Outstanding 8.91 1.2.3 Kisan Vikas Patras Receipts 14.66
Outstanding 648.58 1.2.4 Kisan Vikas Patras - 2014 Receipts 213.18
Outstanding 291.18 1.2.5 National Saving Certificate VI issue Receipts 0.04
Outstanding –0.89 1.2.6 National Saving Certificate VII issue Outstanding –0.57 1.2.7 Other Certificates Outstanding 113.82 1.3 Public Provident Fund Receipts 77.91
Outstanding 576.03
Source: Accountant General, Post and Telegraphs.
Occasional SeriesOccasional SeriesOccasional Series

CURRENT STATISTICS
RBI Bulletin May 2017 81
TABLE 45 : OWNERSHIP PATTERN OF CENTRAL AND STATE GOVERNMENTS SECURITIES
Central Government Dated Securities
Central Government Dated Securities
Category2015 2016Dec. Mar. Jun. Sep. Dec.
1 2 3 4 5(A) Total 44870.80 45324.73 46422.34 47967.49 49246.981 Commercial Banks 43.59 41.81 39.90 40.00 40.922 Non-Bank PDs 0.35 0.33 0.45 0.14 0.283 Insurance Companies 21.90 22.18 22.63 22.68 22.554 Mutual Funds 2.52 2.09 2.09 2.13 1.965 Co-operative Banks 2.71 2.75 2.68 2.47 2.636 Financial Institutions 0.68 0.72 0.71 0.84 0.867 Corporates 0.86 1.28 1.31 1.09 1.058 Foreign Portfolio Investors 3.68 3.65 3.63 3.82 3.139 Provident Funds 7.11 6.01 5.89 6.25 6.2410 RBI 12.07 13.47 14.88 14.80 14.6111. Others 4.51 5.72 5.83 5.79 5.77 11.1 State Governments 1.73 1.84 1.84 1.84 1.83
(Per cent)
(in `. Billion)
State Development Loans
State Governments Securities
Category2015 2016Dec. Mar. Jun. Sep. Dec.
1 2 3 4 5(B) Total 14471.93 16313.95 17277.70 18114.95 19343.911 Commercial Banks 40.17 42.11 41.20 40.22 41.252 Non-Bank PDs 0.21 0.27 0.38 0.35 0.303 Insurance Companies 34.06 32.50 32.53 32.67 31.874 Mutual Funds 0.68 1.05 1.36 1.62 1.365 Co-operative Banks 3.72 3.92 4.01 4.21 4.476 Financial Institutions 0.22 0.25 0.25 0.27 0.297 Corporates 0.17 0.13 0.13 0.14 0.138 Foreign Portfolio Investors 0.25 0.27 0.22 0.08 0.069 Provident Funds 16.69 15.95 16.39 16.84 16.8110 RBI 0.02 0.04 0.02 0.01 0.0311. Others 3.81 3.51 3.52 3.59 3.43 11.1 State Governments - - - - -
(in `. Billion)
Treasury Bills
Treasury Bills
Category2015 2016Dec. Mar. Jun. Sep. Dec.
1 2 3 4 5(C) Total 4256.00 3644.02 4310.09 4202.40 4366.471 Commercial Banks 58.91 71.79 54.41 52.58 50.472 Non-Bank PDs 2.14 1.93 1.85 1.38 1.803 Insurance Companies 2.19 1.50 1.83 1.91 2.024 Mutual Funds 5.86 1.66 11.77 16.06 12.915 Co-operative Banks 1.90 2.75 2.23 3.52 3.286 Financial Institutions 3.80 3.61 3.09 2.75 2.767 Corporates 2.30 1.79 2.22 1.21 1.818 Foreign Portfolio Investors - - - - -9 Provident Funds 0.06 0.25 0.03 0.45 0.4310 RBI 0.23 0.31 0.25 0.16 0.0911. Others 22.62 14.42 22.30 19.96 24.44 11.1 State Governments 19.26 10.52 18.26 15.98 20.51
(in `. Billion)
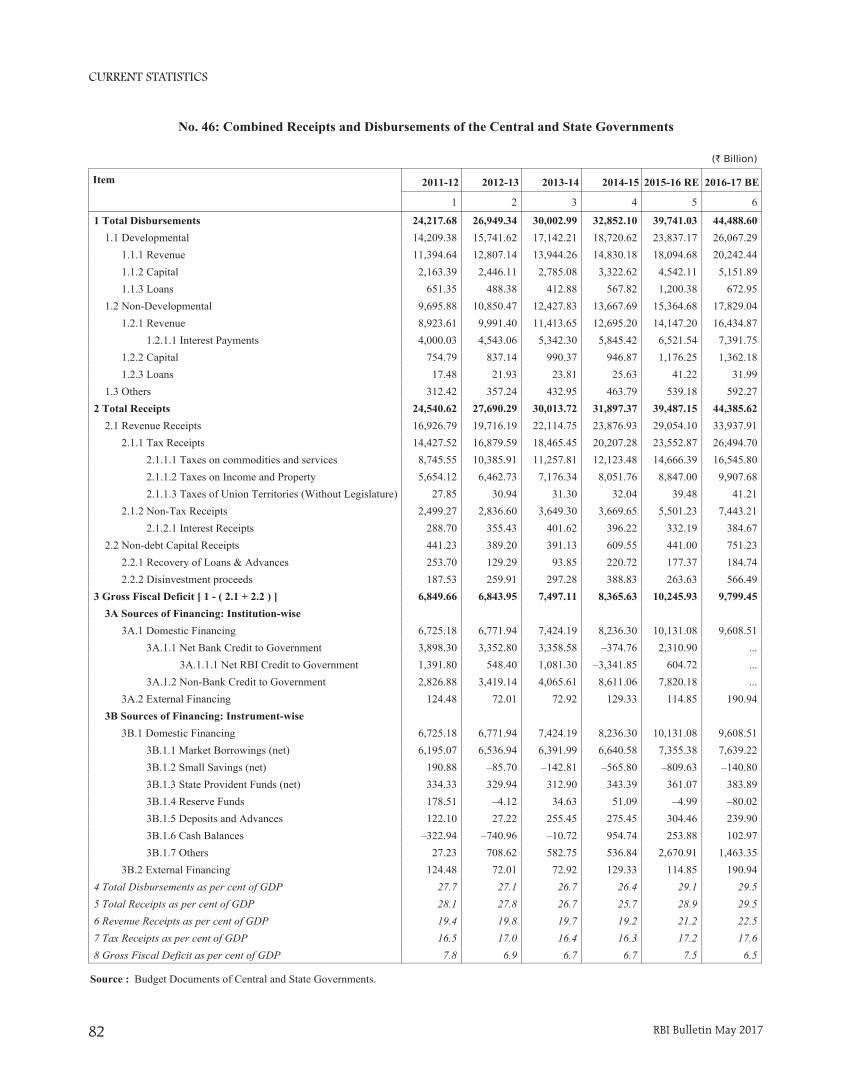
CURRENT STATISTICS
RBI Bulletin May 201782
No. 46: Combined Receipts and Disbursements of the Central and State Governments
(` Billion)
Item 2011-12 2012-13 2013-14 2014-15 2015-16 RE 2016-17 BE
1 2 3 4 5 6
1 Total Disbursements 24,217.68 26,949.34 30,002.99 32,852.10 39,741.03 44,488.60
1.1 Developmental 14,209.38 15,741.62 17,142.21 18,720.62 23,837.17 26,067.29 1.1.1 Revenue 11,394.64 12,807.14 13,944.26 14,830.18 18,094.68 20,242.44 1.1.2 Capital 2,163.39 2,446.11 2,785.08 3,322.62 4,542.11 5,151.89 1.1.3 Loans 651.35 488.38 412.88 567.82 1,200.38 672.95 1.2 Non-Developmental 9,695.88 10,850.47 12,427.83 13,667.69 15,364.68 17,829.04 1.2.1 Revenue 8,923.61 9,991.40 11,413.65 12,695.20 14,147.20 16,434.87 1.2.1.1 Interest Payments 4,000.03 4,543.06 5,342.30 5,845.42 6,521.54 7,391.75 1.2.2 Capital 754.79 837.14 990.37 946.87 1,176.25 1,362.18 1.2.3 Loans 17.48 21.93 23.81 25.63 41.22 31.99 1.3 Others 312.42 357.24 432.95 463.79 539.18 592.272 Total Receipts 24,540.62 27,690.29 30,013.72 31,897.37 39,487.15 44,385.62
2.1 Revenue Receipts 16,926.79 19,716.19 22,114.75 23,876.93 29,054.10 33,937.91 2.1.1 Tax Receipts 14,427.52 16,879.59 18,465.45 20,207.28 23,552.87 26,494.70 2.1.1.1 Taxes on commodities and services 8,745.55 10,385.91 11,257.81 12,123.48 14,666.39 16,545.80 2.1.1.2 Taxes on Income and Property 5,654.12 6,462.73 7,176.34 8,051.76 8,847.00 9,907.68 2.1.1.3 Taxes of Union Territories (Without Legislature) 27.85 30.94 31.30 32.04 39.48 41.21 2.1.2 Non-Tax Receipts 2,499.27 2,836.60 3,649.30 3,669.65 5,501.23 7,443.21 2.1.2.1 Interest Receipts 288.70 355.43 401.62 396.22 332.19 384.67 2.2 Non-debt Capital Receipts 441.23 389.20 391.13 609.55 441.00 751.23 2.2.1 Recovery of Loans & Advances 253.70 129.29 93.85 220.72 177.37 184.74 2.2.2 Disinvestment proceeds 187.53 259.91 297.28 388.83 263.63 566.493 Gross Fiscal Deficit [ 1 - ( 2.1 + 2.2 ) ] 6,849.66 6,843.95 7,497.11 8,365.63 10,245.93 9,799.45
3A Sources of Financing: Institution-wise 0.00 0.00 0.00 0.00 0.00 0.00
3A.1 Domestic Financing 6,725.18 6,771.94 7,424.19 8,236.30 10,131.08 9,608.51 3A.1.1 Net Bank Credit to Government 3,898.30 3,352.80 3,358.58 –374.76 2,310.90 ... 3A.1.1.1 Net RBI Credit to Government 1,391.80 548.40 1,081.30 –3,341.85 604.72 ... 3A.1.2 Non-Bank Credit to Government 2,826.88 3,419.14 4,065.61 8,611.06 7,820.18 ... 3A.2 External Financing 124.48 72.01 72.92 129.33 114.85 190.94 3B Sources of Financing: Instrument-wise 0.00 0.00 0.00 0.00 0.00 0.00
3B.1 Domestic Financing 6,725.18 6,771.94 7,424.19 8,236.30 10,131.08 9,608.51 3B.1.1 Market Borrowings (net) 6,195.07 6,536.94 6,391.99 6,640.58 7,355.38 7,639.22 3B.1.2 Small Savings (net) 190.88 –85.70 –142.81 –565.80 –809.63 –140.80 3B.1.3 State Provident Funds (net) 334.33 329.94 312.90 343.39 361.07 383.89 3B.1.4 Reserve Funds 178.51 –4.12 34.63 51.09 –4.99 –80.02 3B.1.5 Deposits and Advances 122.10 27.22 255.45 275.45 304.46 239.90 3B.1.6 Cash Balances –322.94 –740.96 –10.72 954.74 253.88 102.97 3B.1.7 Others 27.23 708.62 582.75 536.84 2,670.91 1,463.35 3B.2 External Financing 124.48 72.01 72.92 129.33 114.85 190.944 Total Disbursements as per cent of GDP 27.7 27.1 26.7 26.4 29.1 29.55 Total Receipts as per cent of GDP 28.1 27.8 26.7 25.7 28.9 29.56 Revenue Receipts as per cent of GDP 19.4 19.8 19.7 19.2 21.2 22.57 Tax Receipts as per cent of GDP 16.5 17.0 16.4 16.3 17.2 17.68 Gross Fiscal Deficit as per cent of GDP 7.8 6.9 6.7 6.7 7.5 6.5
Source : Budget Documents of Central and State Governments.
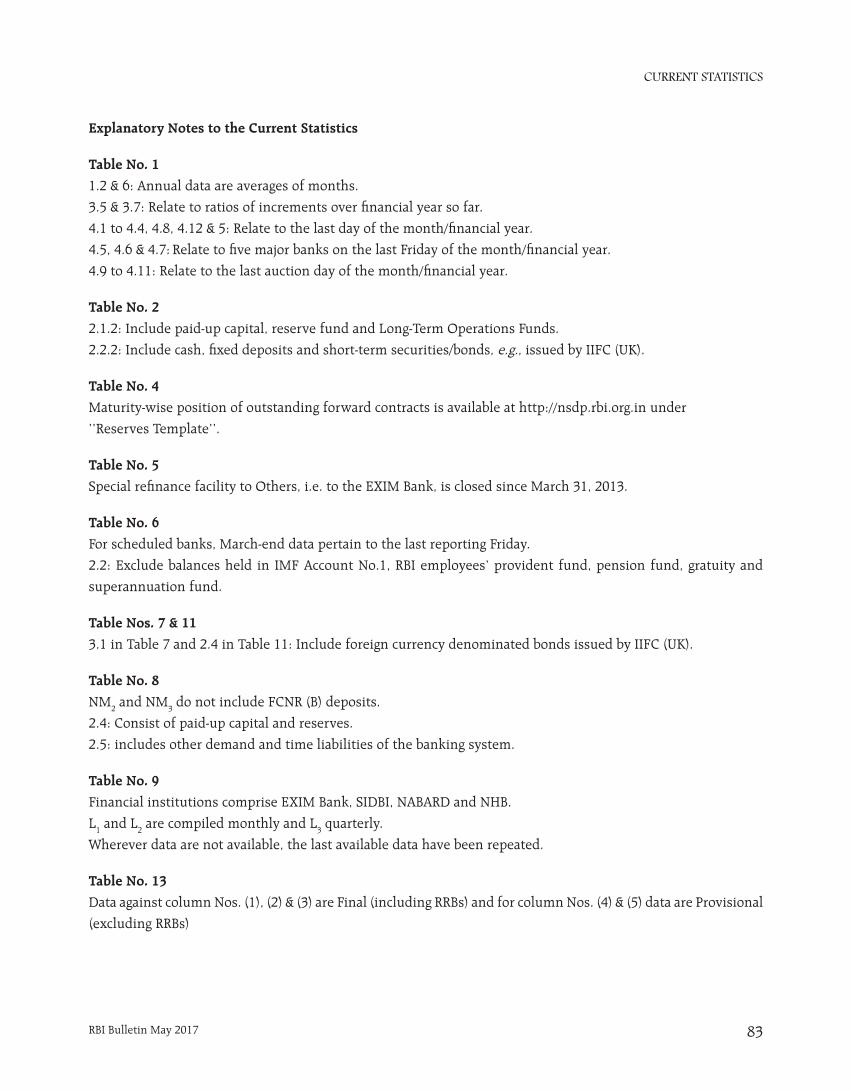
CURRENT STATISTICS
RBI Bulletin May 2017 83
Explanatory Notes to the Current Statistics
Table No. 11.2 & 6: Annual data are averages of months.
3.5 & 3.7: Relate to ratios of increments over financial year so far.
4.1 to 4.4, 4.8, 4.12 & 5: Relate to the last day of the month/financial year.
4.5, 4.6 & 4.7: Relate to five major banks on the last Friday of the month/financial year.
4.9 to 4.11: Relate to the last auction day of the month/financial year.
Table No. 22.1.2: Include paid-up capital, reserve fund and Long-Term Operations Funds.
2.2.2: Include cash, fixed deposits and short-term securities/bonds, e.g., issued by IIFC (UK).
Table No. 4 Maturity-wise position of outstanding forward contracts is available at http://nsdp.rbi.org.in under
‘‘Reserves Template’’.
Table No. 5 Special refinance facility to Others, i.e. to the EXIM Bank, is closed since March 31, 2013.
Table No. 6 For scheduled banks, March-end data pertain to the last reporting Friday.
2.2: Exclude balances held in IMF Account No.1, RBI employees’ provident fund, pension fund, gratuity and
superannuation fund.
Table Nos. 7 & 113.1 in Table 7 and 2.4 in Table 11: Include foreign currency denominated bonds issued by IIFC (UK).
Table No. 8NM2 and NM3 do not include FCNR (B) deposits.
2.4: Consist of paid-up capital and reserves.
2.5: includes other demand and time liabilities of the banking system.
Table No. 9Financial institutions comprise EXIM Bank, SIDBI, NABARD and NHB.
L1 and L2 are compiled monthly and L3 quarterly.
Wherever data are not available, the last available data have been repeated.
Table No. 13Data against column Nos. (1), (2) & (3) are Final (including RRBs) and for column Nos. (4) & (5) data are Provisional
(excluding RRBs)
CURRENT STATISTICS
RBI Bulletin May 201784
Table No. 15 & 16Data are provisional and relate to select banks which cover 95 per cent of total non-food credit extended by all scheduled commercial banks (excludes ING Vysya which has been merged with Kotak Mahindra since April 2015). Export credit under priority sector relates to foreign banks only. Micro & small under item 2.1 includes credit to micro & small industries in manufacturing sector. Micro & small enterprises under item 5.2 includes credit to micro & small enterprises in manufacturing as well as services sector.Priority Sector is as per old definition and does not conform to FIDD Circular FIDD.CO.Plan.BC.54/04.09.01/2014-15 dated April 23, 2015.
Table No. 172.1.1: Exclude reserve fund maintained by co-operative societies with State Co-operative Banks2.1.2: Exclude borrowings from RBI, SBI, IDBI, NABARD, notified banks and State Governments.4: Include borrowings from IDBI and NABARD.
Table No. 24Primary Dealers (PDs) include banks undertaking PD business.
Table No. 30 Exclude private placement and offer for sale. 1: Exclude bonus shares.2: Include cumulative convertible preference shares and equi-preference shares.
Table No. 32Exclude investment in foreign currency denominated bonds issued by IIFC (UK), SDRs transferred by Government of India to RBI and foreign currency received under SAARC SWAP arrangement. Foreign currency assets in US dollar take into account appreciation/depreciation of non-US currencies (such as Euro, Sterling, Yen and Australian Dollar) held in reserves. Foreign exchange holdings are converted into rupees at rupee-US dollar RBI holding rates.
Table No. 341.1.1.1.2 & 1.1.1.1.1.4: Estimates.1.1.1.2: Estimates for latest months. ‘Other capital’ pertains to debt transactions between parent and subsidiaries/branches of FDI enterprises.Data may not tally with the BoP data due to lag in reporting.
Table No. 351.10: Include items such as subscription to journals, maintenance of investment abroad, student loan repayments and credit card payments.
Table No. 36 Increase in indices indicates appreciation of rupee and vice versa. For 6-Currency index, base year 2012-13 is a moving one, which gets updated every year. REER figures are based on Consumer Price Index (combined).
Methodological details are available in December 2005 and April 2014 issues of the Bulletin.
CURRENT STATISTICS
RBI Bulletin May 2017 85
Detailed explanatory notes are available in the relevant press releases issued by RBI and other publications/releases of the Bank such as Handbook of Statistics on the Indian Economy.
Table No. 37Based on applications for ECB/Foreign Currency Convertible Bonds (FCCBs) which have been allotted loan
registration number during the period.
Table Nos. 38, 39, 40 & 41 Explanatory notes on these tables are available in December issue of RBI Bulletin, 2012.
Table No. 431.3: Pertain to multiateral net settlement batches.
3.1: Pertain to three centres – Mumbai, New Delhi and Chennai.
3.3: Pertain to clearing houses managed by 21 banks.
6: Available from December 2010.
7: Include IMPS transactions.
9: Includes ATMs deployed by Scheduled Commercial banks and White Label ATMs (WLA). WLA are included
from April 2014 onwards.
Table No. 45(-): represents nil or negligible
The table format incorporates the ownership pattern of State Governments Securities and Treasury Bills along
with the Central Government Securities. In addition, State Governments’ holding of securities are shown as a
separate category for the first time.
State Government Securities include special bonds issued under Ujwal DISCOM Assurance Yojana (UDAY)
scheme.
Bank PDs are clubbed under Commercial Banks. However, they form very small fraction of total outstanding
securities.
The category ‘Others’ comprises State Governments, Pension Funds, PSUs, Trusts, HUF/Individuals etc.
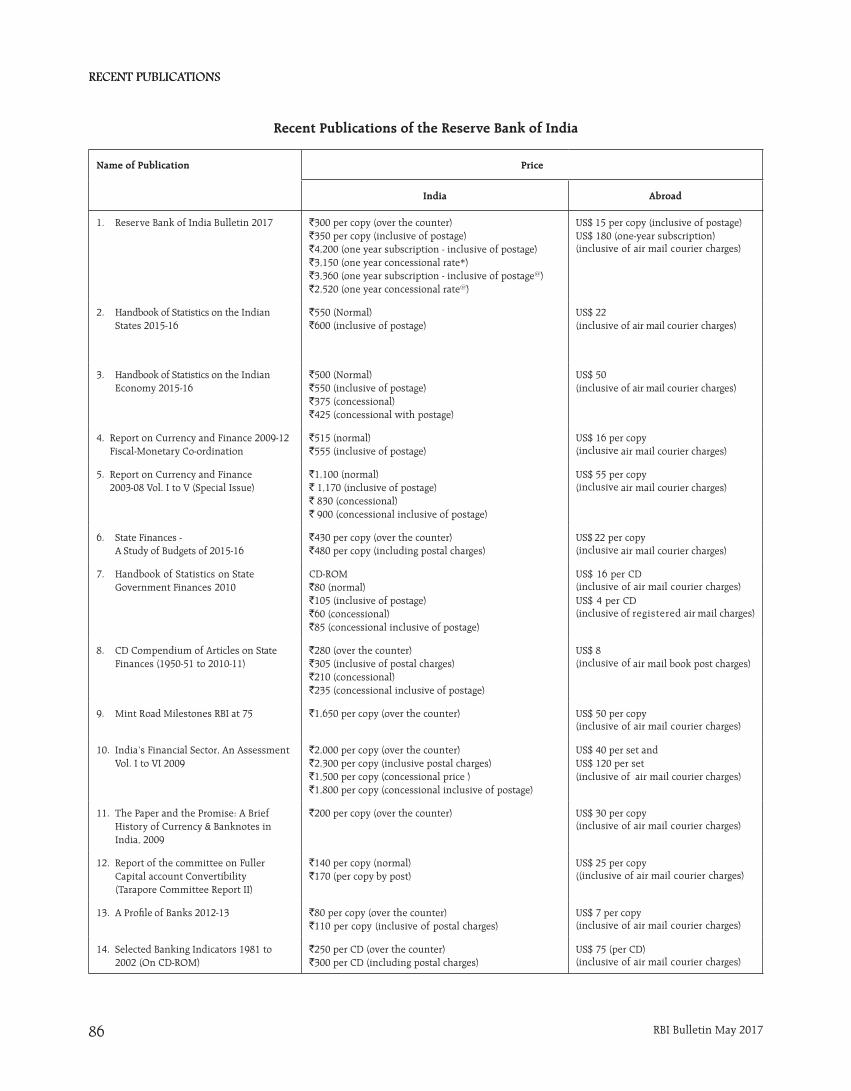
RECENT PUBLICATIONSRECENT PUBLICATIONS
RBI Bulletin May 201786
Name of Publication Price
India Abroad
1. Reserve Bank of India Bulletin 2017 `300 per copy (over the counter)`350 per copy (inclusive of postage)`4,200 (one year subscription - inclusive of postage)`3,150 (one year concessional rate*)`3,360 (one year subscription - inclusive of postage@)`2,520 (one year concessional rate@)
US$ 15 per copy (inclusive of postage) US$ 180 (one-year subscription)(inclusive of air mail courier charges)
2. Handbook of Statistics on the Indian States 2015-16
`550 (Normal)`600 (inclusive of postage)
US$ 22(inclusive of air mail courier charges)
3. Handbook of Statistics on the Indian Economy 2015-16
`500 (Normal)`550 (inclusive of postage)`375 (concessional)`425 (concessional with postage)
US$ 50(inclusive of air mail courier charges)
4. Report on Currency and Finance 2009-12 Fiscal-Monetary Co-ordination
`515 (normal)`555 (inclusive of postage)
US$ 16 per copy (inclusive air mail courier charges)
5. Report on Currency and Finance 2003-08 Vol. I to V (Special Issue)
`1,100 (normal)` 1,170 (inclusive of postage)` 830 (concessional)` 900 (concessional inclusive of postage)
US$ 55 per copy (inclusive air mail courier charges)
6. State Finances -A Study of Budgets of 2015-16
`430 per copy (over the counter)`480 per copy (including postal charges)
US$ 22 per copy(inclusive air mail courier charges)
7. Handbook of Statistics on State Government Finances 2010
CD-ROM`80 (normal)`105 (inclusive of postage)`60 (concessional)`85 (concessional inclusive of postage)
US$ 16 per CD (inclusive of air mail courier charges)US$ 4 per CD (inclusive of registered air mail charges)
8. CD Compendium of Articles on State Finances (1950-51 to 2010-11)
`280 (over the counter)`305 (inclusive of postal charges)`210 (concessional)`235 (concessional inclusive of postage)
US$ 8 (inclusive of air mail book post charges)
9. Mint Road Milestones RBI at 75 `1,650 per copy (over the counter) US$ 50 per copy (inclusive of air mail courier charges)
10. India’s Financial Sector, An Assessment Vol. I to VI 2009
`2,000 per copy (over the counter)`2,300 per copy (inclusive postal charges)`1,500 per copy (concessional price )`1,800 per copy (concessional inclusive of postage)
US$ 40 per set andUS$ 120 per set (inclusive of air mail courier charges)
11. The Paper and the Promise: A Brief History of Currency & Banknotes in India, 2009
`200 per copy (over the counter) US$ 30 per copy (inclusive of air mail courier charges)
12. Report of the committee on Fuller Capital account Convertibility (Tarapore Committee Report II)
`140 per copy (normal)`170 (per copy by post)
US$ 25 per copy ((inclusive of air mail courier charges)
13. A Profile of Banks 2012-13 `80 per copy (over the counter)`110 per copy (inclusive of postal charges)
US$ 7 per copy (inclusive of air mail courier charges)
14. Selected Banking Indicators 1981 to 2002 (On CD-ROM)
`250 per CD (over the counter) `300 per CD (including postal charges)
US$ 75 (per CD)(inclusive of air mail courier charges)
Recent Publications of the Reserve Bank of India

RECENT PUBLICATIONSRECENT PUBLICATIONS
RBI Bulletin May 2017 87
Name of Publication Price
India Abroad
15. Statistical Tables Relating to Banks in India 2012-13
`240 per copy (over the counter)`300 (inclusive of postage)
US$ 13 per copy (inclusive of air mail courier charges)
16. Quarterly Statistics on Deposits and Credit of Scheduled Commercial Banks 1981-2003 (on CD-ROM)
`185 per copy (over the counter)`240 per copy (including postal charges)
US$ 20 per copy US$ 55 per copy (inclusive of air mail courier charges)
17. Basic Statistical Returns of Scheduled Commercial Banks in India Vol. 41 March 2012
`270 per copy (over the counter)`310 per copy (inclusive of postal charges)
US$ 10 per copy (inclusive of air mail courier charges)
18. Private Corporate Business Sector in India - Selected Financial Statistics from 1950-51 to 1997-98
`500 per CD (over the counter) US$ 100 per CD ROM (inclusive of air mail courier charges)
19. Banking Glossary (2012) `80 per copy (over the counter)`120 per copy (inclusive of postal charges)
20. Anuvad Ke Vividh Aayam (Hindi) `165 per copy (over the counter)`205 per copy (inclusive of postal charges)
21. Bank Me Rajbhasha Niti Ka Karyanvayan: Dasha Aur Disha (Hindi)
`150 per copy (over the counter)`200 per copy (inclusive of postal charges)
Notes 1. Many of the above publications are available at the RBI website (www.rbi.org.in).2. Time Series data are available at the Database on Indian Economy (http://dbie.rbi.org.in). 3. The Reserve Bank of India History 1935-1997 (4 Volumes), Challenges to Central Banking in the Context of Financial Crisis and the Regional
Economy of India: Growth and Finance are available at leading book stores in India.* Discount of 25% is available for students, teahers/lecturers, academic/educaation institutions, public libraries and Booksellers in India
provided the proof of eligibility is submitted from institution. @ In order to promote electronic payments it has been decided to offer 20% discount to domestic subscribers who are willing to pay through
NEFT. General Instructions
1. Publications once sold will not be taken back.2. Publications will not be supplied on a consignment VPP basis.3. Wherever concessional price is not indicated, a discount of 25 per cent is available for students, teachers/lecturers, academic/education institutions,
public libraries and book sellers in India provided the proof of eligibility is submitted from the concerned institution. Back issues of the publication are generally not available.
4. The publications are available for sale (Monday to Friday), at the Sales and Distribution Division, Department of Corporate Services, Reserve Bank of India, Amar Building, Ground Floor, Sir P. M. Road, Fort, P. B. No.1036, Mumbai - 400 001. The contact number of Sales Section is 022-2260 3000 Extn.: 4002, Email: [email protected].
5. Subscription should be made preferably by NEFT & forwarding letter enclosing NEFT details should be address to to the Chief General Manager, Department of Corporate Services, Reserve Bank of India, 2nd floor, Main Building, Mumbai - 400 001.
Following information is required to be filled in NEFT form by you:
Beneficiary Name Department of Corporates Services, RBI
Name of the Bank Reserve Bank of India
Branch and addess Fort, Mumbai
IFSC of Bank Branch RBIS0MBPA04
Type of Account Current Account
Account Number 41-8691632-86
Sender to reciver information Name of Subscriber........Subscriber No. ..........
6. Every endeavour will be made to despatch publications expeditiously. In case of rush of orders, dispatch will be executed on a first-come first-served basis. It may take a minimum of a month’s time to complete formalities and then to dispatch the available publications. Complaints regarding ‘non-receipt of publication’ may be sent within a period of 2 months.
7. Kindly send your subscription number, name, address, and email id to [email protected] enabling us to communicate with you in an efficient manner.