May 2016 chemours investor presentation 5 17 16
18
The Chemours Company Goldman Sachs Basic Materials Conference May 17, 2016
-
Upload
chemoursllc -
Category
Investor Relations
-
view
1.634 -
download
1
Transcript of May 2016 chemours investor presentation 5 17 16

The Chemours CompanyGoldman Sachs Basic Materials Conference
May 17, 2016

This presentation contains forward-looking statements, which often may be identified by their use of words like “plans,” “expects,” “will,” “believes,” “intends,” “estimates,” “anticipates” or other words of similar meaning. These forward-looking statements address, among other things, our anticipated future operating and financial performance, business plans and prospects, transformation plans, resolution of environmental liabilities, litigation and other contingencies, plans to increase profitability, our ability to pay or the amount of any dividend, and target leverage that are subject to substantial risks and uncertainties that could cause actual results to differ materially from those expressed or implied by such statements. Forward-looking statements are not guarantees of future performance and are based on certain assumptions and expectations of future events which may not be realized. The matters discussed in these forward-looking statements are subject to risks, uncertainties and other factors that could cause actual results to differ materially from those projected, anticipated or implied in the forward-looking statements, as further described in our filings with the Securities and Exchange Commission, including our annual report on Form 10-K for the fiscal year ended December 31, 2015. Chemours undertakes no duty to update any forward-looking statements.
This presentation contains certain supplemental measures of performance that are not required by, or presented in accordance with, generally accepted accounting principles in the United States (“GAAP”). These Non-GAAP measures include Adjusted Net Income (Loss), Adjusted EPS, Adjusted EBITDA and Free Cash Flow, which should not be considered as replacements of GAAP. Free Cash Flow is defined as Cash from Operations minus cash used for PP&E purchases. Further information with respect to and reconciliations of such measures to the nearest GAAP measure can be found in the schedules to the press release or the appendix hereto.
Management uses Adjusted Net Income (Loss), Adjusted EPS, Adjusted EBITDA and Free Cash Flow to evaluate the Company’s performance excluding the impact of certain non-cash charges and other special items in order to have comparable financial results to analyze changes in our underlying business from quarter to quarter.
Historical results prior to July 1, 2015 are presented on a stand-alone basis from DuPont historical results and are subject to certain adjustments and assumptions as indicated in this presentation, and may not be an indicator of future performance.
Additional information for investors is available on the company’s website at investors.chemours.com.
Safe Harbor Statement
1
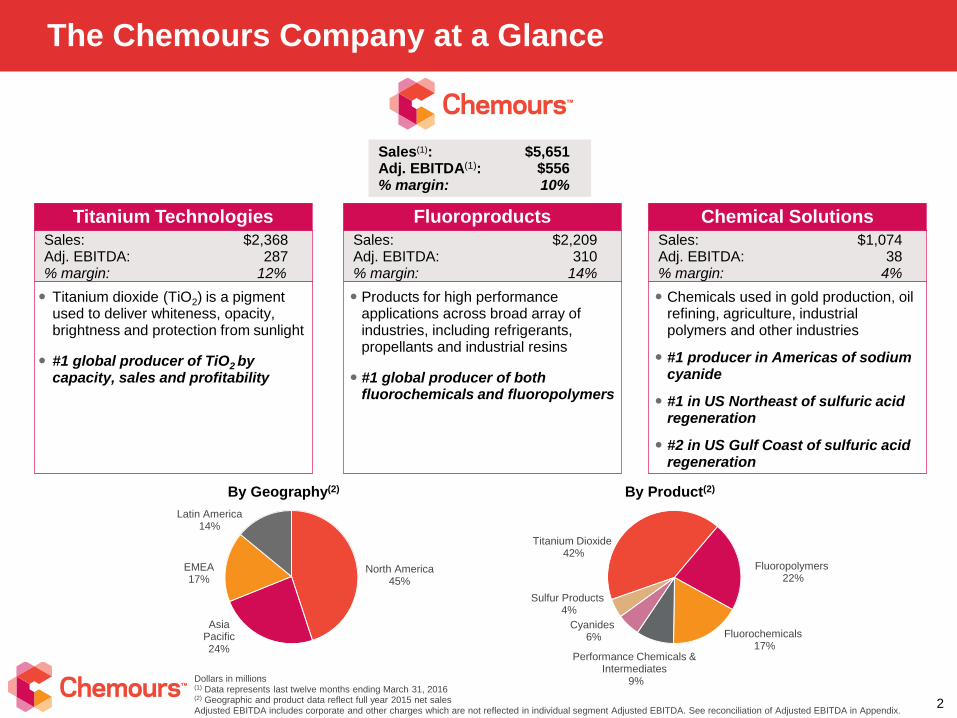
Titanium Dioxide42%
Fluoropolymers22%
Fluorochemicals17%
Performance Chemicals & Intermediates
9%
Cyanides6%
Sulfur Products4%
Chemicals used in gold production, oil refining, agriculture, industrial polymers and other industries
#1 producer in Americas of sodium cyanide
#1 in US Northeast of sulfuric acid regeneration
#2 in US Gulf Coast of sulfuric acid regeneration
Titanium dioxide (TiO2) is a pigment used to deliver whiteness, opacity, brightness and protection from sunlight
#1 global producer of TiO2 by capacity, sales and profitability
Products for high performance applications across broad array of industries, including refrigerants, propellants and industrial resins
#1 global producer of both fluorochemicals and fluoropolymers
The Chemours Company at a Glance
Sales(1): $5,651Adj. EBITDA(1): $556% margin: 10%
Titanium Technologies
Sales: $2,368Adj. EBITDA: 287% margin: 12%
Fluoroproducts
Sales: $2,209Adj. EBITDA: 310% margin: 14%
Chemical Solutions
Sales: $1,074Adj. EBITDA: 38% margin: 4%
By Geography(2) By Product(2)
Dollars in millions(1) Data represents last twelve months ending March 31, 2016 (2) Geographic and product data reflect full year 2015 net salesAdjusted EBITDA includes corporate and other charges which are not reflected in individual segment Adjusted EBITDA. See reconciliation of Adjusted EBITDA in Appendix.
2
North America45%
Asia Pacific24%
EMEA17%
Latin America14%
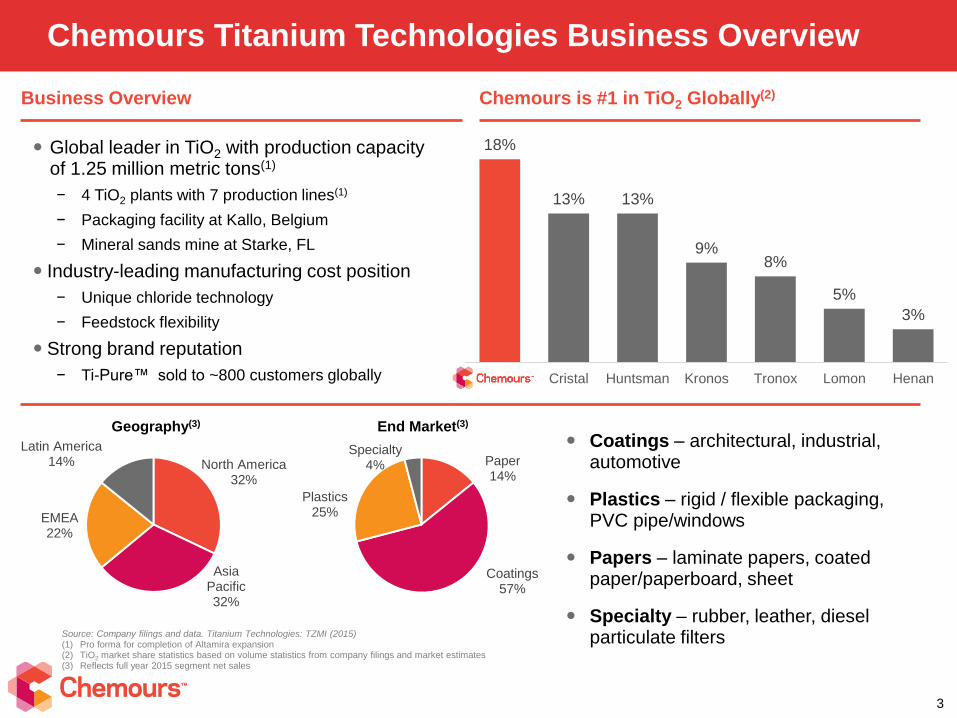
Paper14%
Coatings57%
Plastics25%
Specialty4%North America
32%
Asia Pacific32%
EMEA22%
Latin America14%
Global leader in TiO2 with production capacity of 1.25 million metric tons(1)
− 4 TiO2 plants with 7 production lines(1)
− Packaging facility at Kallo, Belgium
− Mineral sands mine at Starke, FL
Industry-leading manufacturing cost position
− Unique chloride technology
− Feedstock flexibility
Strong brand reputation
− Ti-Pure™ sold to ~800 customers globally
Chemours Titanium Technologies Business Overview
Coatings – architectural, industrial, automotive
Plastics – rigid / flexible packaging, PVC pipe/windows
Papers – laminate papers, coated paper/paperboard, sheet
Specialty – rubber, leather, diesel particulate filters
Geography(3) End Market(3)
Source: Company filings and data. Titanium Technologies: TZMI (2015)(1) Pro forma for completion of Altamira expansion(2) TiO2 market share statistics based on volume statistics from company filings and market estimates(3) Reflects full year 2015 segment net sales
3
Business Overview Chemours is #1 in TiO2 Globally(2)
18%
13% 13%
9%8%
5%
3%
Chemours Cristal Huntsman Kronos Tronox Lomon Henan
TiO2 Market Dynamics
4
Excess supply carried prices below a sustainable profit level and below the relative value of high-quality products
Quality and performance of TiO2 products differ considerably across segments of the market that serve different applications
Manufacturing capabilities determine cost, productivity improvement options and ability to serve higher value applications
Chemours capabilities bring real value to the customer, consumer and community
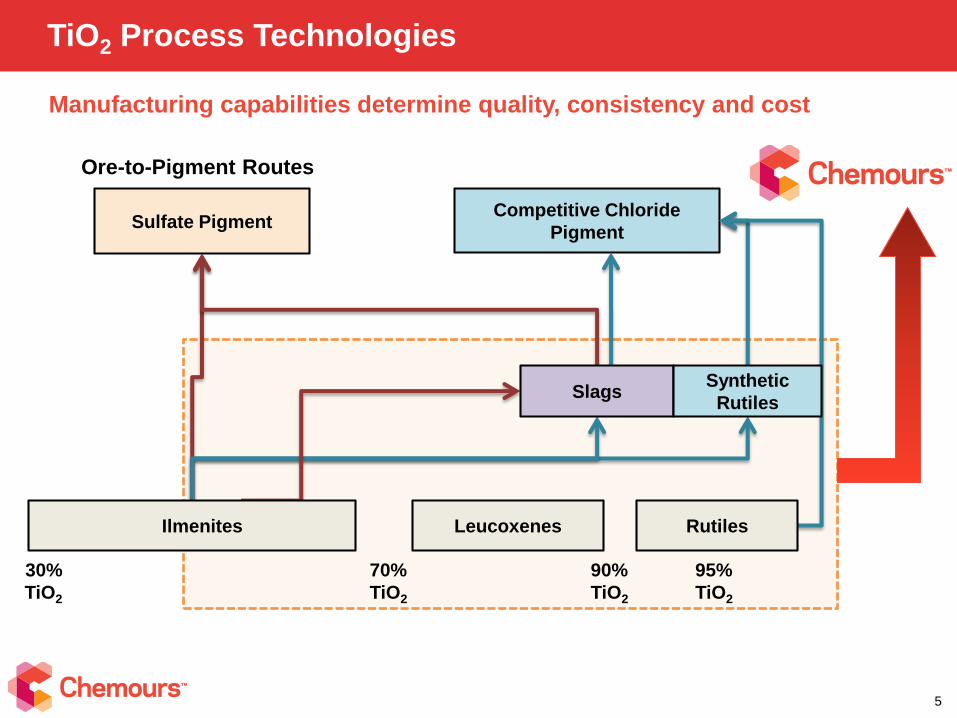
Manufacturing capabilities determine quality, consistency and cost
TiO2 Process Technologies
Ore-to-Pigment Routes
30%
TiO2
95%
TiO2
90%
TiO2
70%
TiO2
Sulfate PigmentCompetitive Chloride
Pigment
SlagsSynthetic
Rutiles
Ilmenites Leucoxenes Rutiles
5
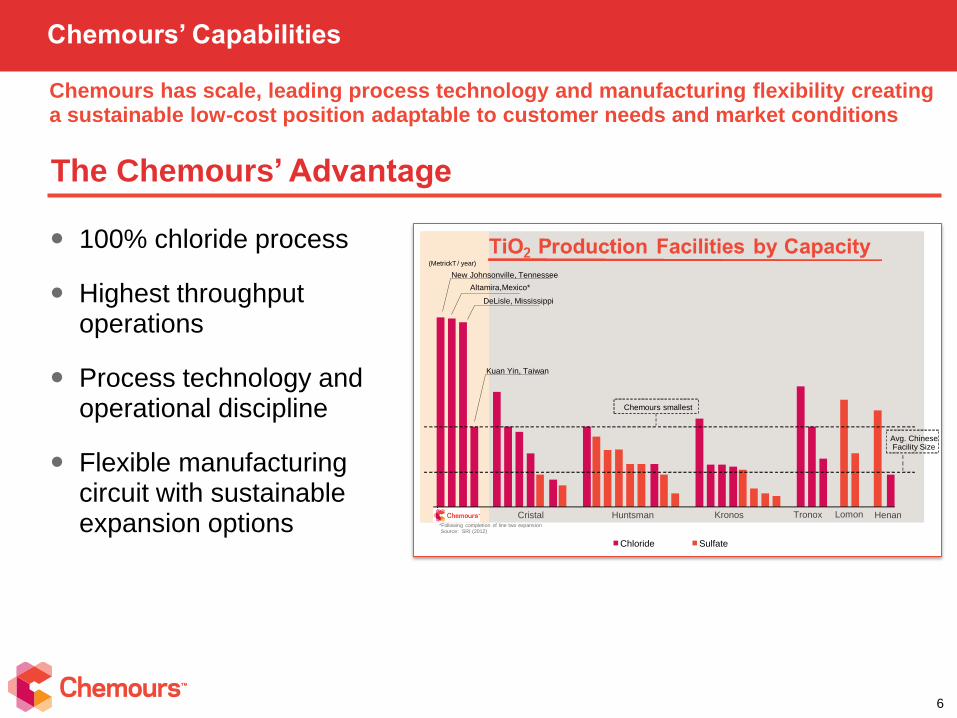
Chemours has scale, leading process technology and manufacturing flexibility creating a sustainable low-cost position adaptable to customer needs and market conditions
Chemours’ Capabilities
6
100% chloride process
Highest throughput operations
Process technology and operational discipline
Flexible manufacturing circuit with sustainable expansion options
The Chemours’ Advantage
`
Chloride Sulfate
New Johnsonville, Tennessee
Kuan Yin, Taiwan
(Metric kT / year)
DeLisle, Mississippi
*Following completion of line two expansionSource: SRI (2012)
Altamira, Mexico*
Chemours smallest
Avg. Chinese Facility Size
Cristal Huntsman Kronos Tronox Lomon Henan
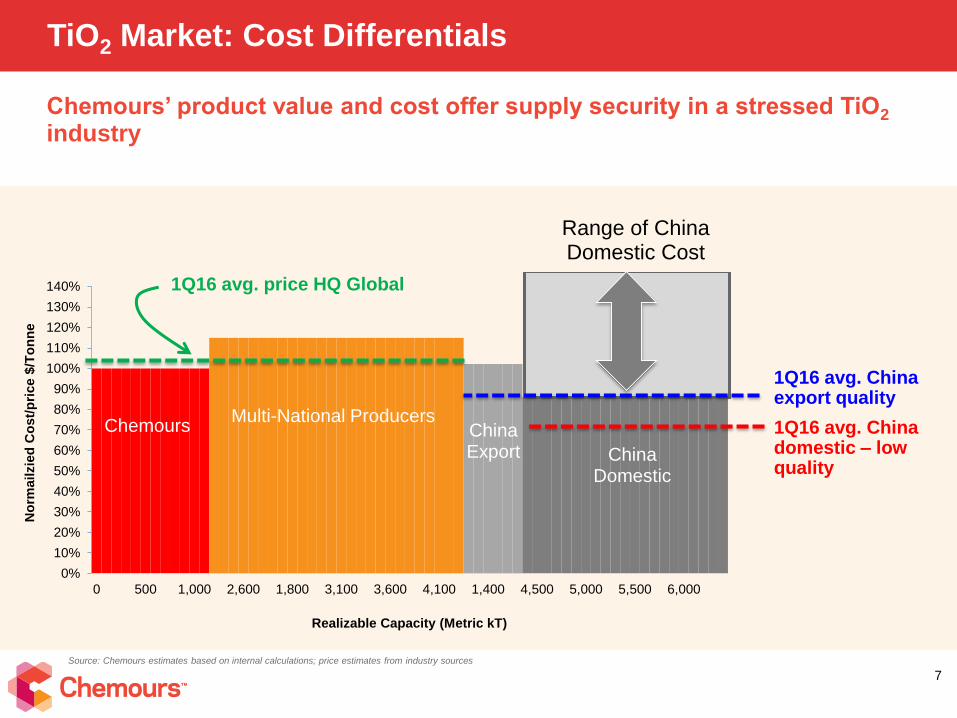
Chemours’ product value and cost offer supply security in a stressed TiO2
industry
TiO2 Market: Cost Differentials
7
0%
10%
20%
30%
40%
50%
60%
70%
80%
90%
100%
110%
120%
130%
140%
0 500 1,000 2,600 1,800 3,100 3,600 4,100 1,400 4,500 5,000 5,500 6,000
No
rmailzie
d C
ost/
pri
ce $
/To
nn
e
Realizable Capacity (Metric kT)
Multi-National Producers
1Q16 avg. China export quality
Range of China Domestic Cost
ChinaExport
Chemours
ChinaDomestic
1Q16 avg. price HQ Global
Source: Chemours estimates based on internal calculations; price estimates from industry sources
1Q16 avg. China domestic – low quality

Altamira enhances leading cost position and manufacturing flexibility
Altamira: World-Class TiO2 Asset
8
Construction completed, with production
gradually ramping to nameplate capacity of
200,000 metric tonnes per year
● $20 million of annual EBITDA
improvement expected
● Approximately 20% increase
to Chemours total nameplate capacity
● Expands Chemours’ ore grade flexibility
● Product qualification at customers
is underway
● Chemours adjusting production
throughout our network to remain
matched to our customer demand as
Altamira comes online
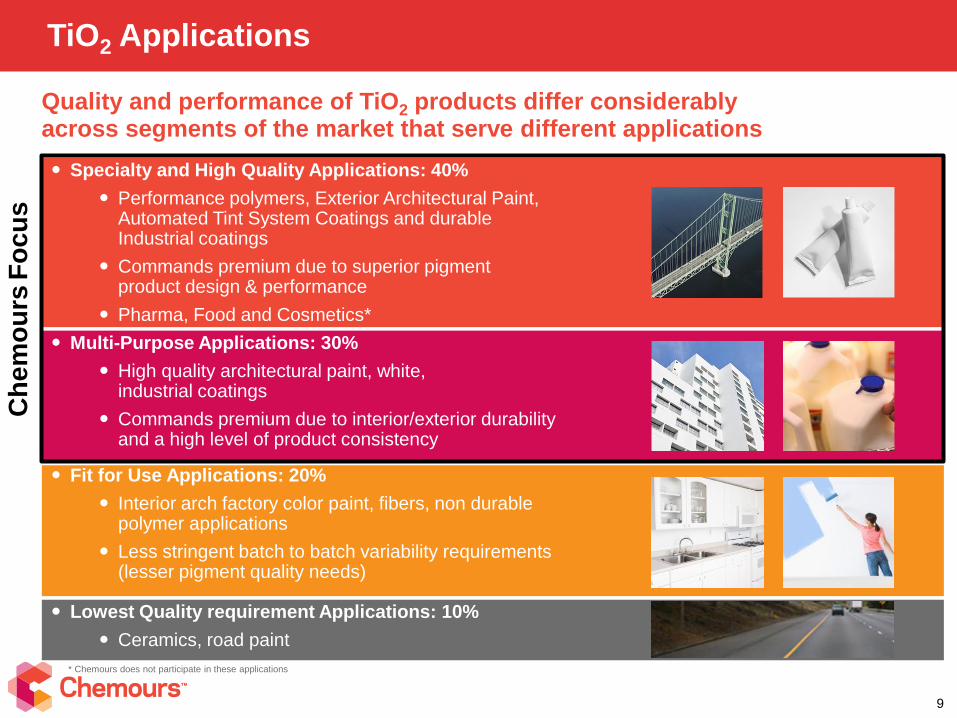
Quality and performance of TiO2 products differ considerably across segments of the market that serve different applications
TiO2 Applications
Specialty and High Quality Applications: 40%
Performance polymers, Exterior Architectural Paint, Automated Tint System Coatings and durable Industrial coatings
Commands premium due to superior pigment product design & performance
Pharma, Food and Cosmetics*
Multi-Purpose Applications: 30%
High quality architectural paint, white, industrial coatings
Commands premium due to interior/exterior durability and a high level of product consistency
Fit for Use Applications: 20%
Interior arch factory color paint, fibers, non durable polymer applications
Less stringent batch to batch variability requirements (lesser pigment quality needs)
Lowest Quality requirement Applications: 10%
Ceramics, road paint
Ch
em
ou
rsF
oc
us
9
* Chemours does not participate in these applications
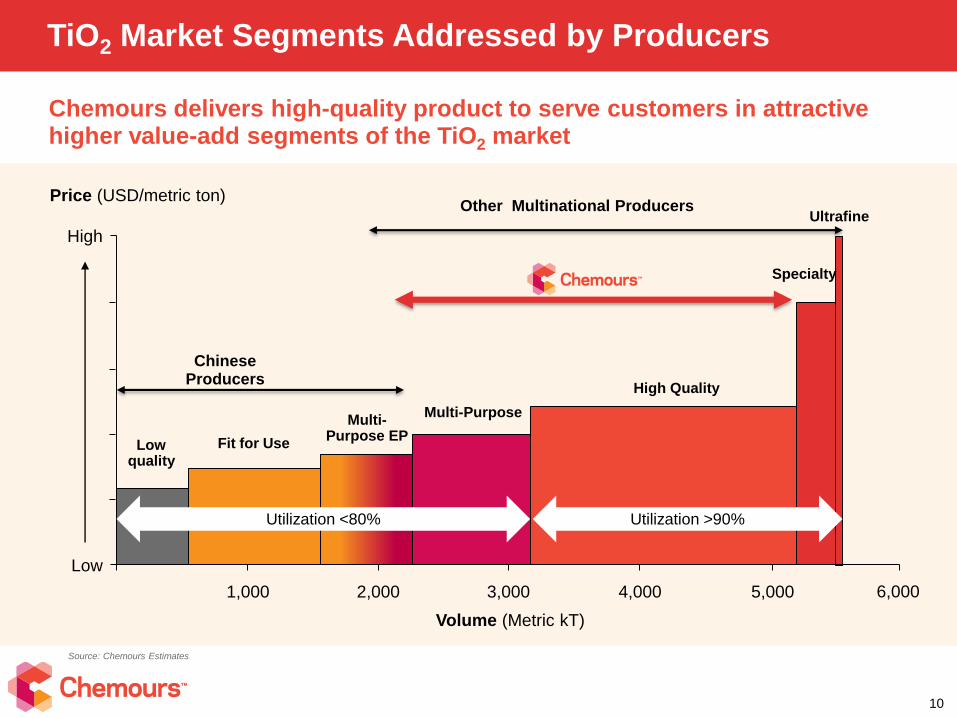
Chemours delivers high-quality product to serve customers in attractive higher value-add segments of the TiO2 market
TiO2 Market Segments Addressed by Producers
10
5,0001,000 4,0003,0002,000
Lowquality
Fit for Use
Volume (Metric kT)
Multi-PurposeMulti-
Purpose EP
High Quality
Specialty
Price (USD/metric ton)
6,000
Ultrafine
High
Low
Utilization <80% Utilization >90%
ChineseProducers
Other Multinational Producers
Source: Chemours Estimates
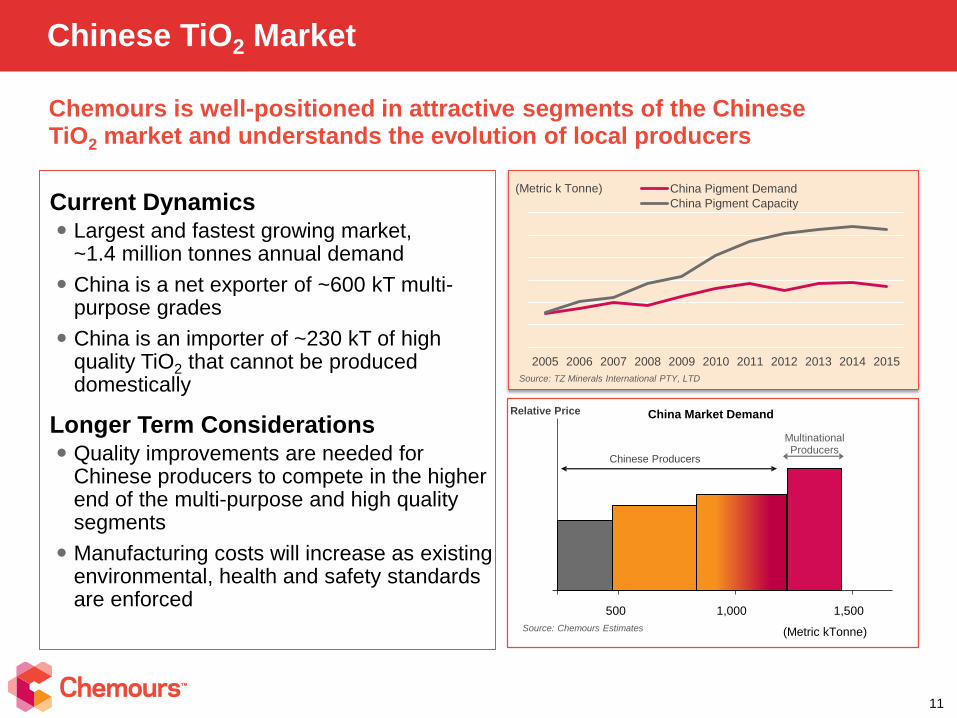
Chemours is well-positioned in attractive segments of the Chinese TiO2 market and understands the evolution of local producers
Chinese TiO2 Market
11
Current Dynamics Largest and fastest growing market,
~1.4 million tonnes annual demand
China is a net exporter of ~600 kT multi-purpose grades
China is an importer of ~230 kT of high quality TiO2 that cannot be produced domestically
Longer Term Considerations Quality improvements are needed for
Chinese producers to compete in the higher end of the multi-purpose and high quality segments
Manufacturing costs will increase as existing environmental, health and safety standards are enforced
2005 2006 2007 2008 2009 2010 2011 2012 2013 2014 2015
China Pigment Demand
China Pigment Capacity
(Metric k Tonne)
Source: TZ Minerals International PTY, LTD
500 1,5001,000
Chinese Producers
China Market Demand
(Metric kTonne)
Relative Price
Multinational Producers
Source: Chemours Estimates

Chemours’ Profitability Focus
12
Working towards improving profitability that supports sustainable reinvestment levels
Pricing Actions
Our January 1 price increase was implemented across the globe
Our May 1 increase of $150/t reflects additional need to restore Chemours’ profitability
to a sustainable level
Chemours applies an analytical approach to pricing and will seek prices consistent with
factors such as:− Product value
− Supply/Demand
− Reinvestment economics
Cost Reductions
Shutdown of Edge Moor plant and line at New Johnsonville, TN
Integrated ore capability – from sourcing to use
Fixed cost and working capital reductions as part of Transformation Plan
Chemours is Positioned for Success in the TiO2 Market
13
Proven ability to meet customers’ demand using our leading process
technology
Delivering high-quality product to serve customers in attractive higher value-
add segments of the TiO2 market
Unique production capabilities from scale, leading process technology and
manufacturing flexibility provide sustainable low-cost position
Altamira enhances leading cost position and manufacturing flexibility
Focus on achieving economics that support sustainable reinvestment levels
Positioned to participate in attractive segments of the TiO2 market

Appendix
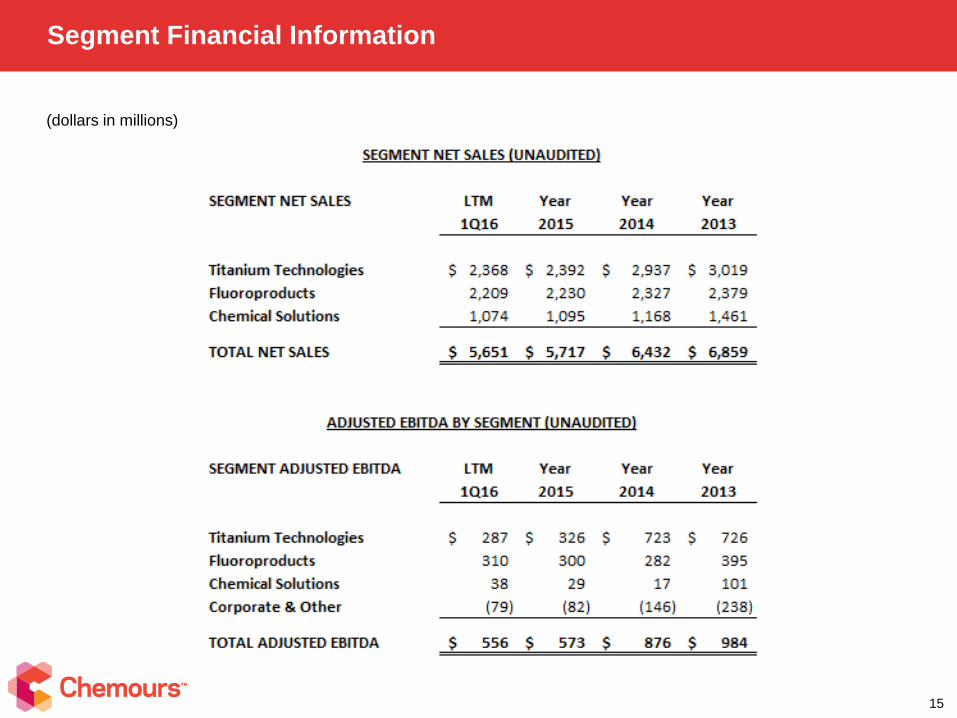
Segment Financial Information
15
(dollars in millions)
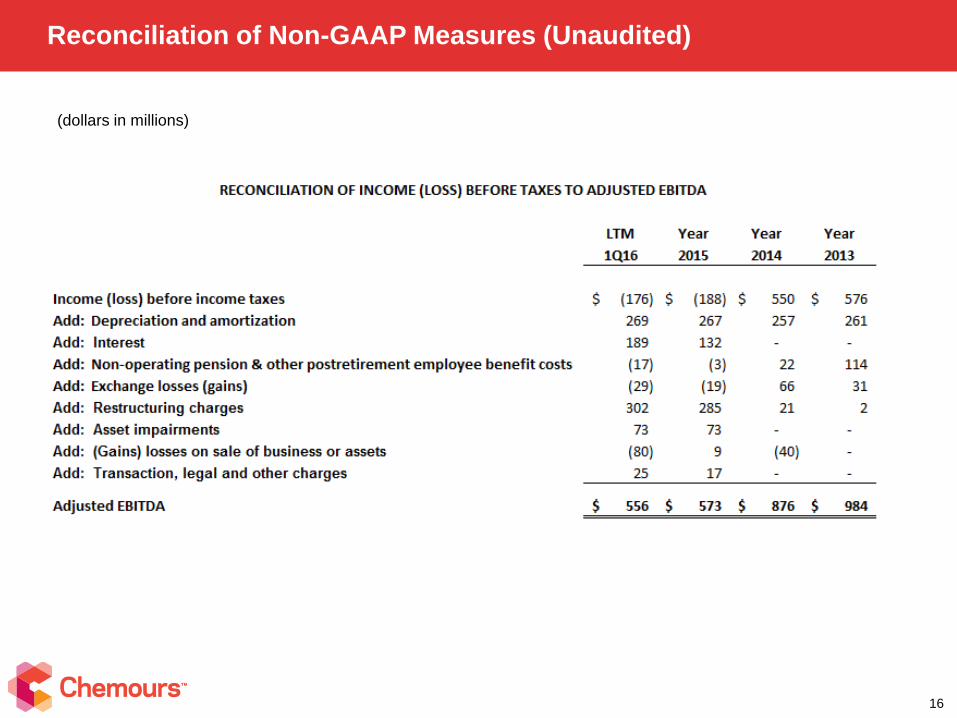
Reconciliation of Non-GAAP Measures (Unaudited)
16
(dollars in millions)

17©2016 The Chemours Company. Chemours™ and the Chemours Logo are trademarks or registered trademarks of The Chemours Company