May 2012 SPECIAL REQUEST REPORT ON SHORT ... OCA analysis of website data (Feb‐Apr 12), City/State...
9
May 2012 Special Request Results Why We Did This Report This memo responds to a request from Council Member Spelman regarding the difference in 311 and 911 calls between short‐term rentals (STRs) and other residential properties. What We Did To complete this special request, we: Randomly sampled 466 residential properties with a geographic distribution comparable to that of the identified STRs and determined the number of 311 and 911 calls at these locations Compared the call distribution to that of STRs See Attachment A for the distribution of STRs and our sample. Mayor and Council, I am pleased to present this special request report on short‐term rentals. BACKGROUND On April 20, 2012, the Office of the City Auditor presented the Short‐term Rentals Audit to the Audit and Finance Committee. This audit included the number and types of 311 and 911 calls among short‐term rentals and compared them to calls for the City as a whole. OBJECTIVE AND SCOPE Our objective was to determine whether short‐term rental properties differ from other residential properties in their use of the 311 and 911 systems. The scope included 311 and 911 calls in calendar year 2011. WHAT WE FOUND We found that the average number of calls per property and the percent of properties associated with 311 or 911 calls were similar for STRs and the sample of residential properties (see Exhibit 1). EXHIBIT 1 Properties Associated with 311 and 911 Calls STRs Sampled Residential Percent with 311 Calls 22.86% 23.82% Average # of 311 Calls 1.71 1.85 Percent with 911 Calls 26.87% 28.54% Average # of 911 Calls 1.96 2.02 SOURCE: OCA analysis of 311 and 911 call data for CY 2011. We found that the most common call types were similar for short‐term rentals (STRs) and residential properties in our sample. Eight of the top ten 311 call categories and seven of the top ten 911 categories were the same for both groups. See Exhibit 2 for the full list of top call types. SPECIAL REQUEST REPORT ON SHORT‐TERM RENTALS For more information on this or any of our reports, email [email protected] SPECIAL REQUEST REPORT ON SHORT‐TERM RENTALS (REVISED 5/24/12)
-
Upload
vuonghuong -
Category
Documents
-
view
215 -
download
0
Transcript of May 2012 SPECIAL REQUEST REPORT ON SHORT ... OCA analysis of website data (Feb‐Apr 12), City/State...

May 2012
Special Request Results
Why We Did This Report
This memo responds to a request from Council Member Spelman regarding the difference in 311 and 911 calls between short‐term rentals (STRs) and other residential properties.
What We Did
To complete this special request, we: Randomly sampled 466
residential properties with a geographic distribution comparable to that of the identified STRs and determined the number of 311 and 911 calls at these locations
Compared the call distribution to that of STRs
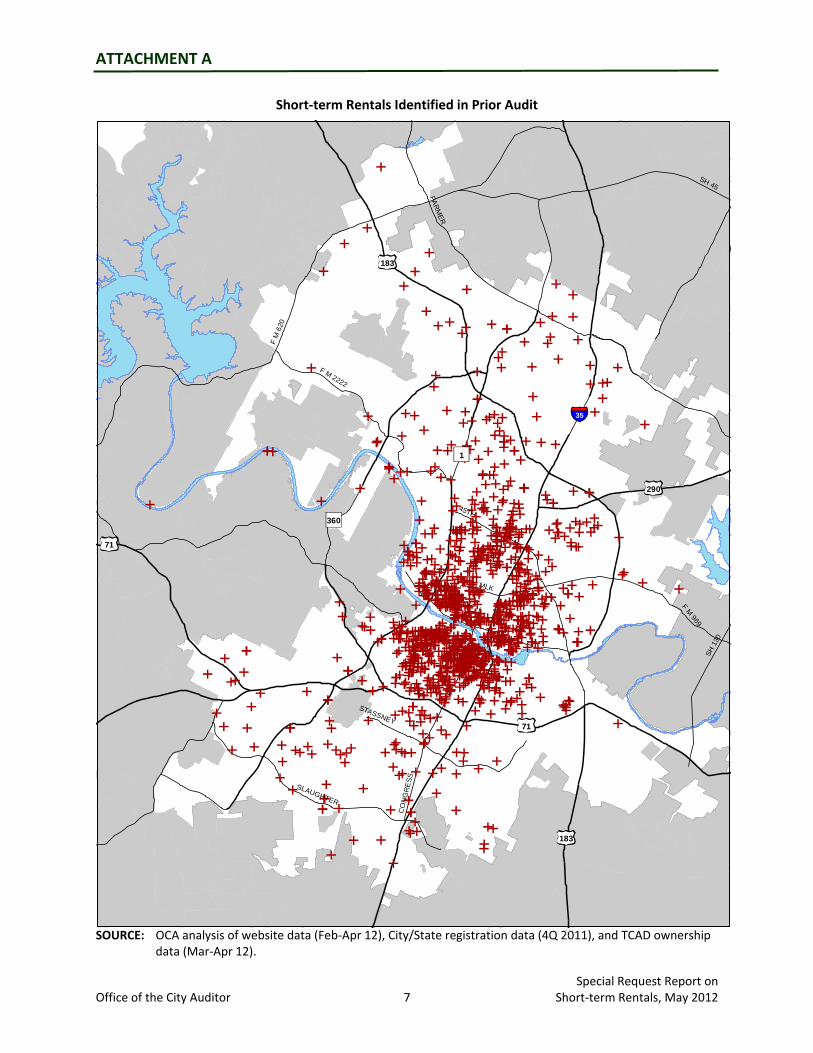
See Attachment A for the distribution of STRs and our sample.
Mayor and Council,
I am pleased to present this special request report on short‐term rentals.
BACKGROUND
On April 20, 2012, the Office of the City Auditor presented the Short‐term Rentals Audit to the Audit and Finance Committee. This audit included the number and types of 311 and 911 calls among short‐term rentals and compared them to calls for the City as a whole.
OBJECTIVE AND SCOPE
Our objective was to determine whether short‐term rental properties differ from other residential properties in their use of the 311 and 911 systems.
The scope included 311 and 911 calls in calendar year 2011.
WHAT WE FOUND
We found that the average number of calls per property and the percent of properties associated with 311 or 911 calls were similar for STRs and the sample of residential properties (see Exhibit 1).
EXHIBIT 1 Properties Associated with 311 and 911 Calls
STRs
Sampled Residential
Percent with 311 Calls 22.86% 23.82%
Average # of 311 Calls 1.71 1.85
Percent with 911 Calls 26.87% 28.54%
Average # of 911 Calls 1.96 2.02 SOURCE: OCA analysis of 311 and 911 call data for CY 2011.
We found that the most common call types were similar for short‐term rentals (STRs) and residential properties in our sample. Eight of the top ten 311 call categories and seven of the top ten 911 categories were the same for both groups. See Exhibit 2 for the full list of top call types.
SPECIAL REQUEST REPORT ONSHORT‐TERM RENTALS
For more information on this or any of
our reports, email [email protected]
SPECIAL REQUEST REPORT ONSHORT‐TERM RENTALS (REVISED 5/24/12)
Special Request Report on Office of the City Auditor 2 Short‐term Rentals, May 2012
EXHIBIT 2 Top Call Types for 311 and 911 Calls
STR 311 Categories Residential 311 Categories
STR 911 Categories Residential 911 Categories
Austin Resource Recovery (ARR) Cart Management
ARR Cart Management Alarm Burglar Alarm Burglar
Code Compliance Water Waste Report City Ordinance Violation
DOC / C.O. Violation
Water Waste Report Code Compliance Suspicious Person Suspicious Person
ARR Missed Garbage ARR Missed Garbage ID Property Crimes Hang‐up Residence
APD Nonemergency – Unavailable
APD Nonemergency ‐ Unavailable
Service Suspicious Vehicle
ARR Missed Recycling ARR Missed Recycling Burglary Residence Disturbance Other
Street Light Issue – Address
Street Light Issue‐ Address
Suspicious Vehicle ID Property Crimes
ARR General ARR General Check Welfare Service Parking Violation
ARR Billing Inquiry ARR Missed Yard Trimmings
Disturbance Other Hang‐up Mobile
ARR Call Transfer – CIC Only
ARR Missed Bulky Items Collection
Alarm Robbery (tied) Family Disturbance
Parking Violation (tied) SOURCE: OCA analysis of 311 and 911 call data for CY 2011.
For STRs, the majority of 311 calls came from properties with only a few calls each (see Exhibit 3). This indicates that service level is driven by the overall number of properties, rather than by a small group of frequent users (see Exhibit 4 for Pareto analysis).
EXHIBIT 3 Distribution of 311 Calls Among STRs
311 Calls per Property
Number of Properties
Percent of Properties
Percent of 311 Calls
0 847 77.1% 0.0% 1 151 13.8% 35.2% 2 56 5.1% 26.1% 3 29 2.6% 20.3% 4 9 0.8% 8.4% 5 2 0.2% 2.3% 6 or more 4 0.2% 7.7% Total 1098 100.0% 100.0% SOURCE: OCA analysis 311 data for CY 2011.

Special Request Report on Office of the City Auditor 3 Short‐term Rentals, May 2012
EXHIBIT 4 Pareto Analysis of 311 Calls for STRs
SOURCE: OCA analysis of 311 call data for CY 2011.
For 911 calls, approximately half the calls came from STR properties with only one or two calls, but frequent users (with six or more calls) accounted for 18% of calls despite being only one percent of all properties (see Exhibit 5, and Exhibit 6 for Pareto analysis).
EXHIBIT 5 Distribution of 911 Calls Among STRs
911 Calls per Property
Number of Properties
Percent of Properties
Percent of 911 Calls
0 803 73.1% 0.0% 1 169 15.4% 29.2% 2 66 6.0% 22.8% 3 26 2.4% 13.5% 4 11 1.0% 7.6% 5 10 0.9% 8.7% 6 or more 13 1.2% 18.2% Total 1098 100.0% 100.0% SOURCE: OCA analysis of 911 data for CY 2011.
0.0%
10.0%
20.0%
30.0%
40.0%
50.0%
60.0%
70.0%
80.0%
90.0%
100.0%
1 2 3 4 6 or more
5 0
Percent of Properties
Cumulative Percent of Calls

Special Request Report on Office of the City Auditor 4 Short‐term Rentals, May 2012
EXHIBIT 6 Pareto Analysis of 911 Calls for STRs
SOURCE: OCA analysis of 911 data for CY 2011.
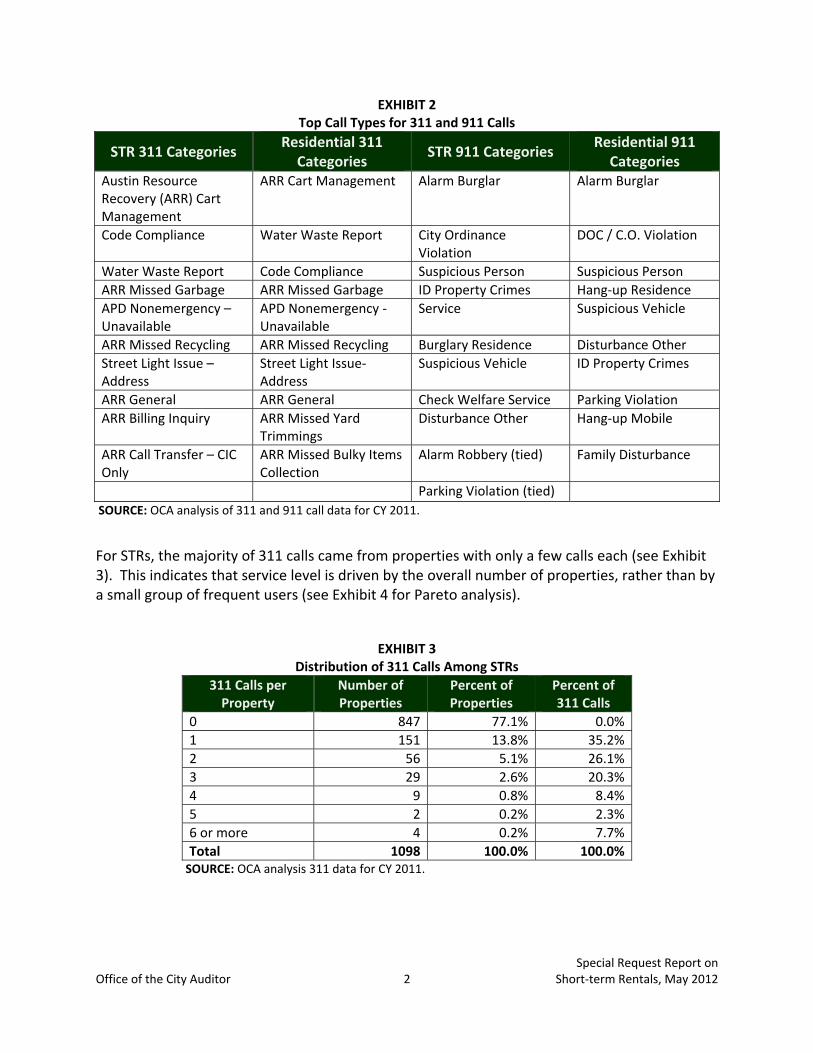
Among the sampled residential properties, for both 311 and 911 calls the majority came from properties with either one or two calls or six or more calls (see Exhibits 7 and 8). This indicates that service level is a combination of the overall number of properties and a few frequent users (see Exhibits 9 and 10 for Pareto analysis). The frequent users with six or more calls accounted for 25% of 311 calls and 22% of 911 calls, despite making up 0.6% and 1.5% of the population, respectively.
EXHIBIT 7 Distribution of 311 Calls Among Sampled Residential Properties
311 Calls per Property
Number of Properties
Percent of Properties
Percent of 311 Calls
0 355 76.18% 0.00% 1 79 16.95% 38.54% 2 16 3.43% 15.61% 3 10 2.15% 14.63% 4 3 0.64% 5.85% 5 0 0.00% 0.00% 6 or more 3 0.64% 25.37% Total 466 100.00% 100.00%
SOURCE: OCA analysis of 311 data for CY 2011 for sampled residential properties.
0.0%
10.0%
20.0%
30.0%
40.0%
50.0%
60.0%
70.0%
80.0%
90.0%
100.0%
1 2 6 or more
3 5 4 0
Percent of Properties
Cumulative Percent of Calls
Special Request Report on Office of the City Auditor 5 Short‐term Rentals, May 2012
EXHIBIT 8 Distribution of 911 Calls Among Sampled Residential Properties
311 Calls per Property
Number of Properties
Percent of Properties
Percent of 311 Calls
0 333 71.46% 0.00% 1 82 17.60% 30.60% 2 21 4.51% 15.67% 3 13 2.79% 14.55% 4 4 0.86% 5.97% 5 6 1.29% 11.19% 6 or more 7 1.50% 22.01% Total 466 100.00% 100.00%
SOURCE: OCA analysis of 911 data for CY 2011 for sampled residential properties.
EXHIBIT 9 Pareto Analysis of 311 Calls for Sampled Residential Properties
SOURCE: OCA analysis of 311 call data for CY 2011 for sampled residential properties.
0.00%
10.00%
20.00%
30.00%
40.00%
50.00%
60.00%
70.00%
80.00%
90.00%
100.00%
1 6 or more
2 3 4 5 0
Percent of properties
Cumulative percent of calls

ATTACHMENT A
Special Request Report on Office of the City Auditor 7 Short‐term Rentals, May 2012
Short‐term Rentals Identified in Prior Audit
SOURCE: OCA analysis of website data (Feb‐Apr 12), City/State registration data (4Q 2011), and TCAD ownership
data (Mar‐Apr 12).
35
360
1
SH 45
SH
130
F M 2222
F M
620
PAR
ME
R
F M 969
45TH
CO
NG
RE
SS
SLAUGHTER
MLK
STASSNEY
183
290
71
183
71

ATTACHMENT A
Special Request Report on Office of the City Auditor 8 Short‐term Rentals, May 2012
Residential Properties Selected for Sample
SOURCE: OCA analysis of STR and residential properties.
35
360
1
SH
130
SH 45
F M 2222
F M
620
F M
685
PAR
ME
R
F M 969
F M 1826
45TH
F M 1327
CO
NG
RE
SS
SLAUGHTER
MLK
STASSNEY
183
71
290
71
183