May 2011 HSBC GIF Global Emerging Markets Equity Absolute ......- One of the largest offshore...
41
For professional clients only HSBC GIF Global Emerging Markets Equity Absolute Return Presentation May 2011
Transcript of May 2011 HSBC GIF Global Emerging Markets Equity Absolute ......- One of the largest offshore...
1
For professional clients only
HSBC GIF Global Emerging Markets Equity Absolute Return Presentation
May 2011
2
HSBC Overview
HSBC Global Asset Management
The Investment Team & Emerging Markets Investment Resources
Investment Philosophy and Process
Risk management
Market overview
HSBC GIF Global Emerging Markets Equity Absolute Return Fund overview
Appendix
Contents

HSBC Overview
4
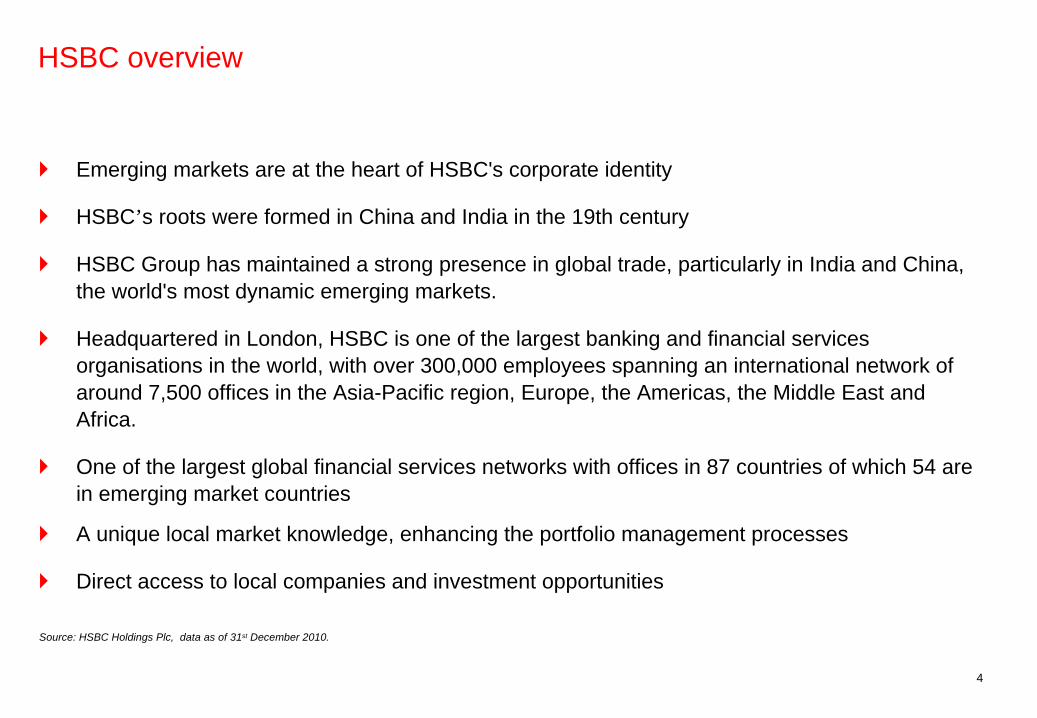
HSBC overview
Emerging markets are at the heart of HSBC's corporate identity
HSBC’s roots were formed in China and India in the 19th century
HSBC Group has maintained a strong presence in global trade, particularly in India and China, the world's most dynamic emerging markets.
Headquartered in London, HSBC is one of the largest banking and financial services organisations in the world, with over 300,000 employees spanning an international network of around 7,500 offices in the Asia-Pacific region, Europe, the Americas, the Middle East and Africa.
One of the largest global financial services networks with offices in 87 countries of which 54 are in emerging market countries
A unique local market knowledge, enhancing the portfolio management processes
Direct access to local companies and investment opportunities
Source: HSBC Holdings Plc, data as of 31st December 2010.

5
Mexico
Honduras
El Salvador Nicaragua
Costa Rica Panama
Colombia
PeruBrazil
ParaguayChile
ArgentinaUruguay
South Africa
Mauritius
Algeria
Libya Egypt
PolandCzech RepublicSlovakia
TurkeyLebanon
IsraelPalestine
Georgia
ArmeniaIraq
KuwaitBahrain, QatarUAE
OmanSaudi Arabia
Kazakhstan
Russia
PakistanChina Korea
India
MaldivesSri Lanka
Taiwan
Philippines
Indonesia
BruneiMalaysia
Singapore
Hong Kong
ThailandVietnam
Macau
Malta
HSBC Global Asset ManagementHSBC Holdings plc
Source: HSBC Global Asset Management, as of 31 December 2010
HSBC’s presence in emerging markets
HSBC Global Asset Management

7
HSBC Global Asset Management
HSBC Global Asset Management is a leading global asset management firm managing assets totalling USD443.5 billion at the end of December 2010.
HSBC Global Asset Management offers clients around the world a diverse and full range of active and quantitative investment products including equity, fixed income, liquidity and alternative strategies.
Worldwide client base invested in both segregated accounts and pooled funds.
HSBC Global Asset Management is part of HSBC Holdings plc.
8
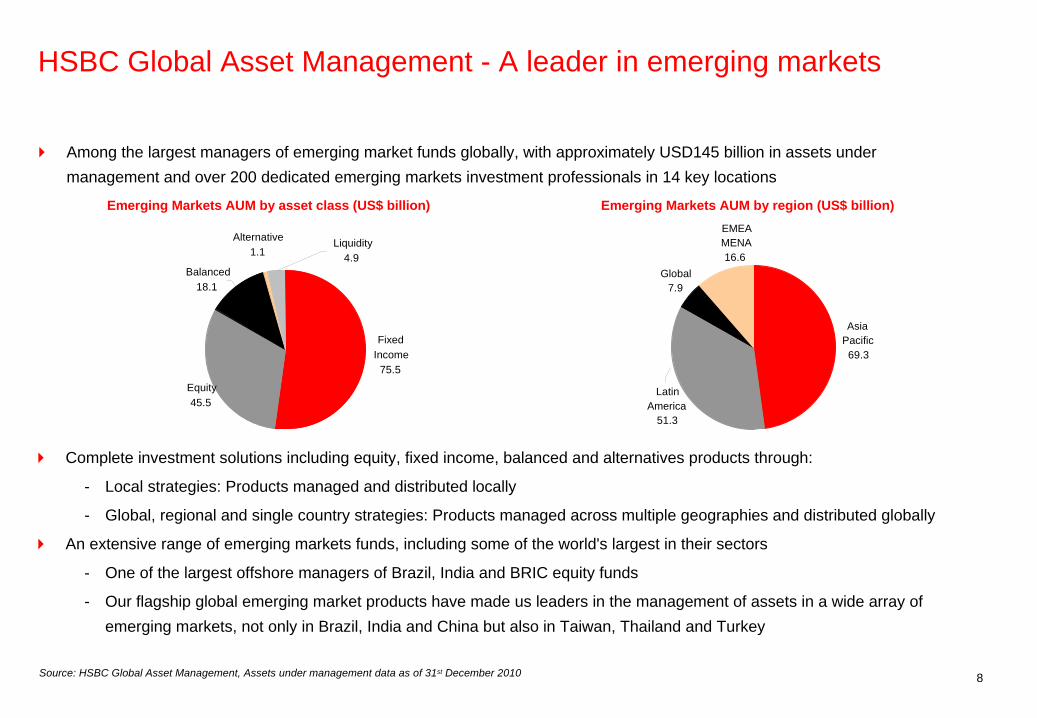
HSBC Global Asset Management - A leader in emerging markets
Complete investment solutions including equity, fixed income, balanced and alternatives products through:
- Local strategies: Products managed and distributed locally
- Global, regional and single country strategies: Products managed across multiple geographies and distributed globally
An extensive range of emerging markets funds, including some of the world's largest in their sectors
- One of the largest offshore managers of Brazil, India and BRIC equity funds
- Our flagship global emerging market products have made us leaders in the management of assets in a wide array of emerging markets, not only in Brazil, India and China but also in Taiwan, Thailand and Turkey
Emerging Markets AUM by region (US$ billion)
Source: HSBC Global Asset Management, Assets under management data as of 31st December 2010
Emerging Markets AUM by asset class (US$ billion)
Among the largest managers of emerging market funds globally, with approximately USD145 billion in assets under management and over 200 dedicated emerging markets investment professionals in 14 key locations
Latin America
51.3
Asia Pacific69.3
EMEAMENA16.6
Global7.9
Equity45.5
Fixed Income
75.5
Balanced18.1
Alternative1.1
Liquidity4.9

The Investment Team & Emerging Markets Investment Resources

10
Global emerging markets equity investment resources
Portfolio Management
Emerging Markets Nick Timberlake (19)
Emerging MarketsOmar Negyal (12)
AsiaStephanie Wu (16)
EMEA Douglas Helfer (16)
Brazil/LATAMNatalia Kerkis (11)
IndiaSanjiv Duggal (15)
ChinaMandy Chan (14)
Research Analysts
EMEATony MacNeary (29) Helen King (5) Ed Conroy (10)
LATAMCarlos Uema (26)Carlos Lima (28)Raquel Diniz (10)Aline Cardodo (10)Ana Browne (6)Tatyana Katalan (7)Guiliano Ajeje (7)Jose Maria Simoe (20)Mariana Araujo (10)Fernando Fontoura (7)
AsiaHugh Lee (9)Kwok Wing Cheong (6) Patrick Crivelli (8)Alan Zhong (6)Debbie Chan (6)Divya Balakrishnan (5)Deborah Yeo (2)Sami Abouzahr (6)Alex Kwan (2)Matthew Lee (10)Elina Fung (9)
New Frontier/ MENAAndrea Nannini (12)
New Frontier/ MENABasak Yavuz (12)
New Frontier/ MENAAndrew Brudenell (12)
AsiaHusan Pai (24)
AsiaMijung Kang (12)
IndiaViresh Mehta (18)
IndiaNilang Mehta (14)
TaiwanLeilani Lam (16)
Bill MaldonadoGlobal CIO Equity
Product Management/ Client Service
Emerging MarketsSoren Beck-Petersen (6)David Wickham (12)Jack O’Brien (2)
Asia Francis Chung (19)
AsiaRoshan Padamadan (4)
AsiaArwen Liu (2)
Latin AmericaVictor Arakaki (7)
Latin AmericaMonica Almeida (5)
Chris CheethamGlobal CIO
As of 31 December 2010; (x) number of years of experience
11
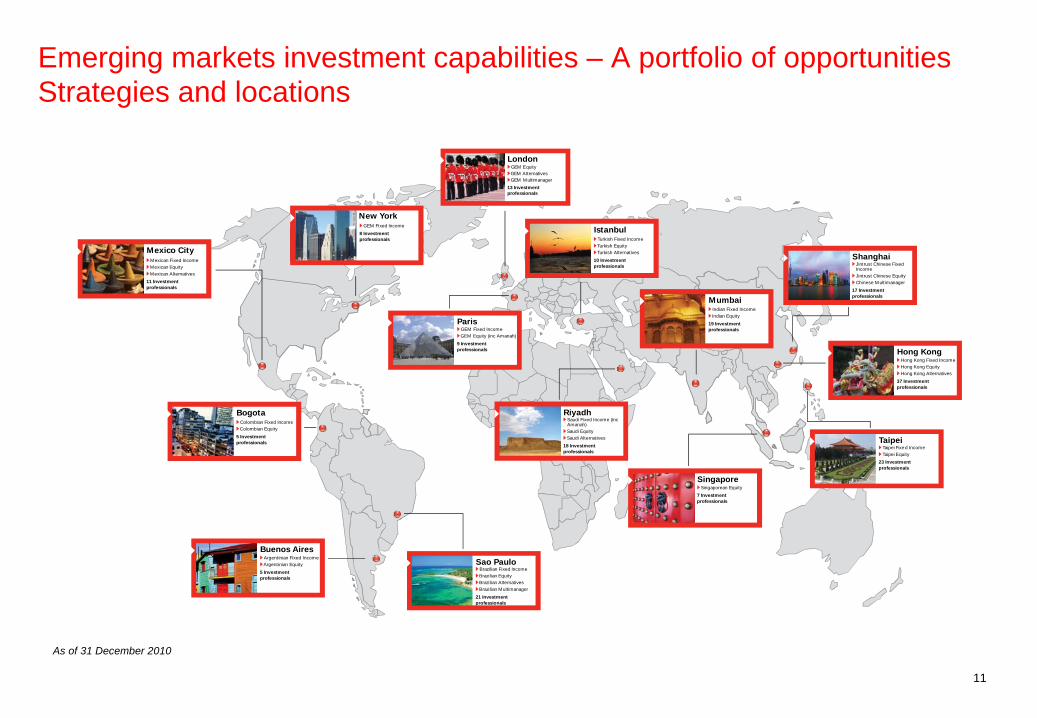
New YorkGEM Fixed Income8 Investmentprofessionals
Mexico CityMexican Fixed IncomeMexican EquityMexican Alternatives11 Investmentprofessionals
BogotaColombian Fixed IncomeColombian Equity5 Investmentprofessionals
Sao PauloBrazilian Fixed IncomeBrazilian EquityBrazilian AlternativesBrazilian Multimanager21 Investmentprofessionals
Buenos AiresArgentinian Fixed IncomeArgentinian Equity5 Investmentprofessionals
LondonGEM EquityGEM AlternativesGEM Multimanager13 Investmentprofessionals
ParisGEM Fixed IncomeGEM Equity (inc Amanah)9 Investmentprofessionals
IstanbulTurkish Fixed IncomeTurkish EquityTurkish Alternatives10 Investmentprofessionals
RiyadhSaudi Fixed Income (inc
Amanah)Saudi EquitySaudi Alternatives18 Investmentprofessionals
Mumbai Indian Fixed Income Indian Equity19 Investmentprofessionals
SingaporeSingaporean Equity7 Investmentprofessionals
Hong KongHong Kong Fixed IncomeHong Kong EquityHong Kong Alternatives37 Investmentprofessionals
Shanghai Jintrust Chinese Fixed
Income Jintrust Chinese EquityChinese M ultimanager17 Investmentprofessionals
TaipeiTaipei Fixed IncomeTaipei Equity23 Investmentprofessionals
19464
Emerging markets investment capabilities – A portfolio of opportunities Strategies and locations
As of 31 December 2010

Investment Philosophy and Process

13
Investment Process Overview
Stock Analysis
Continuous assessment of portfolio positioning.
Monitoring of volatility and beta on portfolio and position basis.
Volatility and drawdown risk as inputs into gross and net exposure.
Implement investment ideas.
Use of limits on gross, net, country and sector exposure to control risk.
Target weighted percentile ranking of longs and shorts (5th- 15th for longs and 85th- 95th for shorts).
Capture snapshot of GEM equities universe, viewed through return on capital and valuation metrics.
Establish percentile ranked list of stocks within universe for both non-financials and financials.
Verify data validity.
Begin with 1st and 100th
percentile ranked stocks.
Key issues:- Corporate
governance- Growth shock or
cost of capital issues
- Dynamic businesses versus static numbers
- Balance sheet- Underlying ROE
drivers
Risk MonitoringPortfolio Construction
Output: Ranked stock list
Output: Individual stock ideas
Output:Portfolio
Output:Assessment of
Portfolio Positions
Universe Analysis
Source: HSBC Global Asset Management March 2011, for illustrative purpose only
14
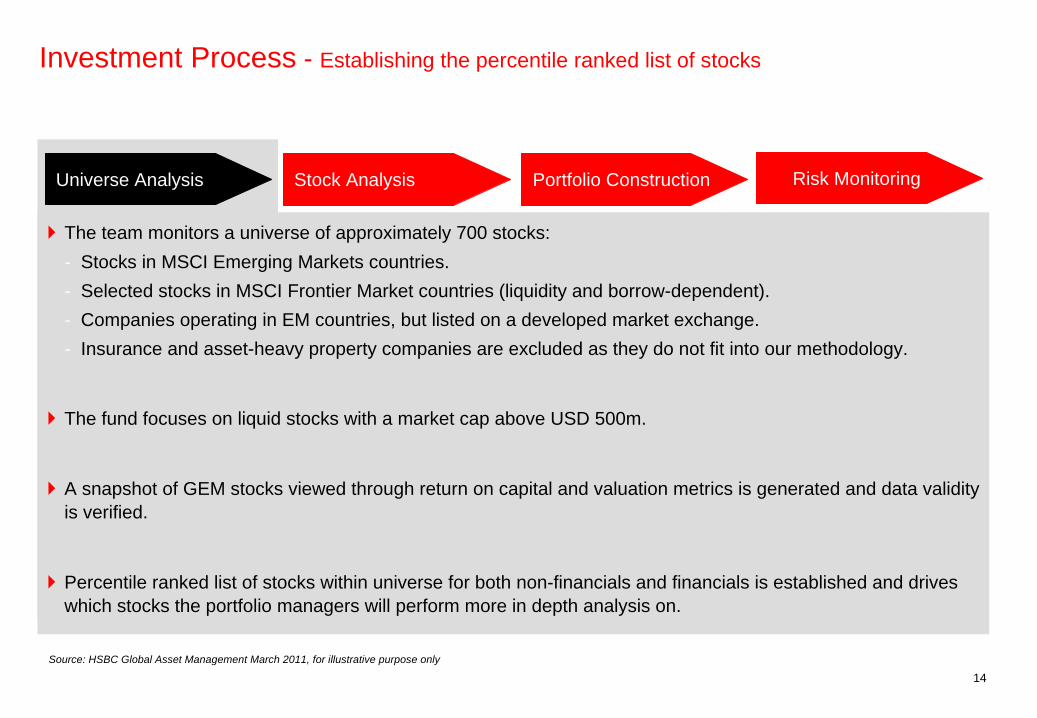
Investment Process - Establishing the percentile ranked list of stocks
The team monitors a universe of approximately 700 stocks:- Stocks in MSCI Emerging Markets countries.- Selected stocks in MSCI Frontier Market countries (liquidity and borrow-dependent).- Companies operating in EM countries, but listed on a developed market exchange.- Insurance and asset-heavy property companies are excluded as they do not fit into our methodology.
The fund focuses on liquid stocks with a market cap above USD 500m.
A snapshot of GEM stocks viewed through return on capital and valuation metrics is generated and data validity is verified.
Percentile ranked list of stocks within universe for both non-financials and financials is established and drives which stocks the portfolio managers will perform more in depth analysis on.
Universe Analysis Stock Analysis Portfolio Construction Risk Monitoring
Source: HSBC Global Asset Management March 2011, for illustrative purpose only

15
Universe Analysis in practice - Percentile ranked stock list example
CompanySymbol Company Name Country Sector ROE PB Percentile
Rank
631349 Chaoda Modern Agriculture (Holdings) Ltd. CHINA Consumer Staples 21.0 1.0 0612793 Steinhoff International Holdings Ltd. SOUTH AFRICA Consumer Discretionary 16.8 0.8 0540472 Transneft RUSSIA Energy 15.5 0.2 0510940 Gazprom Neft RUSSIA Energy 18.9 1.2 1B03MYK Turk Hava Yollari A.O. TURKEY Industrials 19.4 1.2 1B0N3K5 Murray & Roberts Holdings Ltd. SOUTH AFRICA Industrials 26.9 1.7 1645026 Hynix Semiconductor Inc. SOUTH KOREA Information Technology 23.9 1.7 1615333 Aveng Ltd. SOUTH AFRICA Industrials 17.7 1.2 1653703 LG Corp. SOUTH KOREA Industrials 21.0 1.5 2B17KP4 Rosneft RUSSIA Energy 20.6 1.4 2B0ZV10 Grupo Aeroportuario del Pacifico S.A.B. de C.V. MEXICO Industrials 15.4 0.9 2644662 Hyundai Heavy Industries Co. Ltd. SOUTH KOREA Industrials 20.7 1.5 2545220 Tatneft RUSSIA Energy 15.3 0.8 2649092 Kia Motors Corp. SOUTH KOREA Consumer Discretionary 15.9 1.1 2514098 Gazprom OAO (ADS) RUSSIA Energy 14.8 0.8 3B02PDW Tele Norte Leste Participacoes S/A BRAZIL Telecommunication Services 20.0 1.4 3456058 Lukoil Holdings RUSSIA Energy 14.2 0.7 3MTL Mechel OAO (ADS) RUSSIA Materials 30.1 2.1 3B03MYT Turkiye Petrol Rafinerileri A.S. TURKEY Energy 24.7 1.9 3645106 Hyundai Mipo Dockyard Co. Ltd. SOUTH KOREA Industrials 14.7 0.9 4
277167 S.A.C.I. Falabella CHILE Consumer Discretionary 15.2 3.5 96605385 Aneka Tambang INDONESIA Materials 8.6 2.0 97641613 China Merchants Holdings (International) Co. Ltd. HONG KONG Industrials 8.8 2.1 97B01GVY Jaiprakash Associates Ltd. INDIA Industrials 13.7 3.3 97217833 Carso Global Telecom S.A.B. de C.V. MEXICO Telecommunication Services 10.8 2.5 97610943 Compal Communications TAIWAN Information Technology 8.0 1.8 98B1Q2FV GVT (Holding) S/A BRAZIL Telecommunication Services 13.8 3.4 98634427 Daewoo International Corp. SOUTH KOREA Industrials 9.6 2.4 98B2R2ZC China South Locomotive & Rolling Stock Corp. Ltd. CHINA Industrials 13.2 3.2 98635415 EPISTAR Corp. TAIWAN Information Technology 7.7 2.1 98B0B8Z1 China COSCO Holdings Co. Ltd. CHINA Industrials -2.3 2.0 99B06QT3 All America Latina Logistica BRAZIL Industrials 11.5 3.1 99657699 United Spirits Ltd. INDIA Consumer Staples 12.0 3.4 99660944 Motech Industries Inc. TAIWAN Industrials 9.4 2.9 99697245 China Resources Enterprise Ltd. CHINA Consumer Discretionary 7.4 2.4 99B192HJ GMR Infrastructure Ltd. INDIA Utilities 4.4 2.8 99B4Q2TX China Longyuan Power Group Corp. Ltd. CHINA Utilities 7.4 3.2 100688967 Israel Corp. Ltd. ISRAEL Materials 5.1 3.6 100B19RPM OGX Petroleo e Gas Participacoes S/A BRAZIL Energy -5.1 6.0 100
Source: HSBC Global Asset Management, as of January 2010. For illustrative purpose only. The above is for information only and does not constitute investment advice or a recommendation to buy or sell investments
16
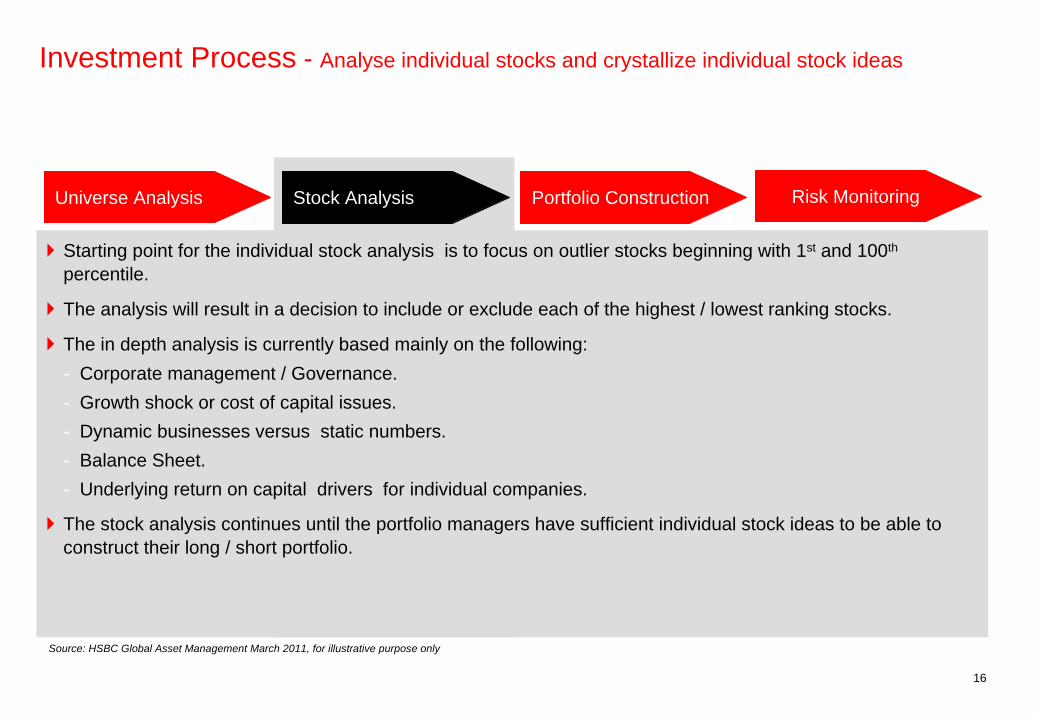
Investment Process - Analyse individual stocks and crystallize individual stock ideas
Starting point for the individual stock analysis is to focus on outlier stocks beginning with 1st and 100th
percentile.
The analysis will result in a decision to include or exclude each of the highest / lowest ranking stocks.
The in depth analysis is currently based mainly on the following:- Corporate management / Governance.- Growth shock or cost of capital issues.- Dynamic businesses versus static numbers.- Balance Sheet.- Underlying return on capital drivers for individual companies.
The stock analysis continues until the portfolio managers have sufficient individual stock ideas to be able to construct their long / short portfolio.
Universe Analysis Stock Analysis Portfolio Construction Risk Monitoring
Source: HSBC Global Asset Management March 2011, for illustrative purpose only
17
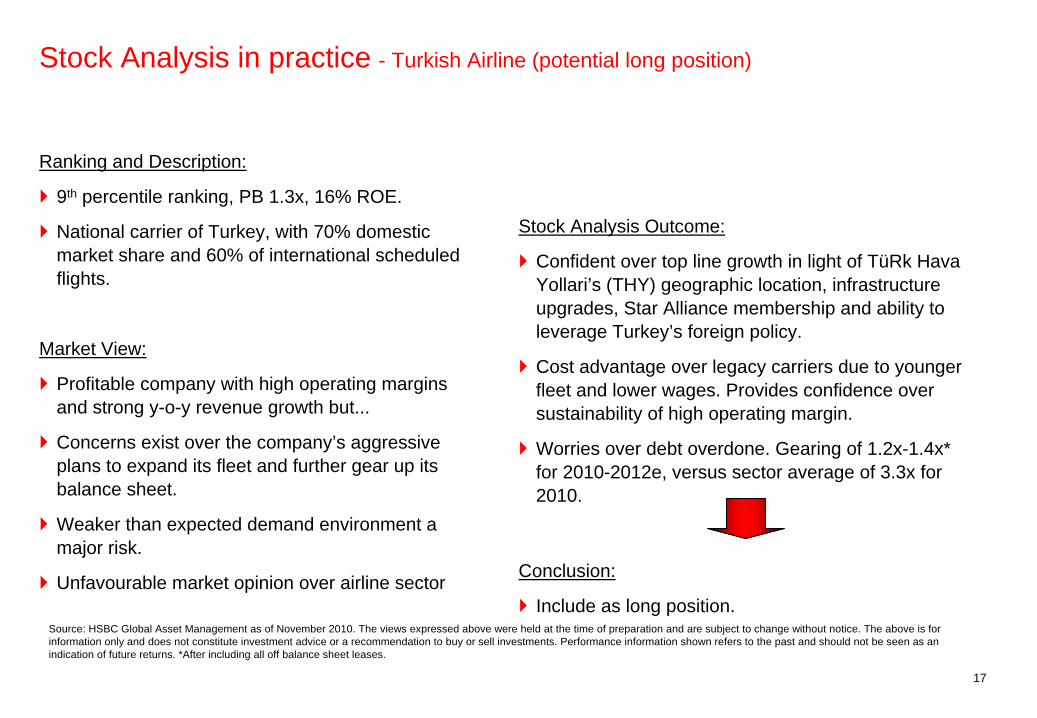
Stock Analysis in practice - Turkish Airline (potential long position)
Ranking and Description:
9th percentile ranking, PB 1.3x, 16% ROE.
National carrier of Turkey, with 70% domestic market share and 60% of international scheduled flights.
Market View:
Profitable company with high operating margins and strong y-o-y revenue growth but...
Concerns exist over the company’s aggressive plans to expand its fleet and further gear up its balance sheet.
Weaker than expected demand environment a major risk.
Unfavourable market opinion over airline sector
Stock Analysis Outcome:
Confident over top line growth in light of TüRk Hava Yollari’s (THY) geographic location, infrastructure upgrades, Star Alliance membership and ability to leverage Turkey’s foreign policy.
Cost advantage over legacy carriers due to younger fleet and lower wages. Provides confidence over sustainability of high operating margin.
Worries over debt overdone. Gearing of 1.2x-1.4x* for 2010-2012e, versus sector average of 3.3x for 2010.
Conclusion:
Include as long position.Source: HSBC Global Asset Management as of November 2010. The views expressed above were held at the time of preparation and are subject to change without notice. The above is for information only and does not constitute investment advice or a recommendation to buy or sell investments. Performance information shown refers to the past and should not be seen as an indication of future returns. *After including all off balance sheet leases.

18
Stock Analysis in practice - GMR Infrastructure (potential short position)
Ranking and Description:
99th percentile ranking, PB 2.1x, 3% ROE.
One of the fastest growing infrastructure organisations in India. Interests in airports, energy, highways and urban infrastructure.
Market View:
GMR is extremely well positioned to benefit from ongoing and much needed infrastructure spend domestically and further afield.
High profile recent projects include Delhi airport and Tamil Nadu power plant. Ongoing and new projects such as Male Airport (Maldives) are expected to act as a further catalyst.
Government of India’s mega Golden Quadrilater, highway projects and irrigation projects have thrown up fresh opportunities.
Proxy for Indian GDP growth.
Stock Analysis Outcome:
Completion of power projects (35% of GMR’s fair value) subject to material planning and implementation risk. Regulatory concerns overhang the airports business.
Gearing an issue as net debt doubled y-o-y in 2010 and forecast to increase. Funding concerns for future projects also still remain.
Estimate ROE to be lower than management forecasts.
Conclusion:
Include as short position.
Source: HSBC Global Asset Management as of November 2010. The views expressed above were held at the time of preparation and are subject to change without notice. The above is for information only and does not constitute investment advice or a recommendation to buy or sell investments. Performance information shown refers to the past and should not be seen as an indication of future returns.

19
Stock Analysis in practice - Overview: In-depth Stock Analysis Outcome
Ranked profitability/valuation ranking drives which stocks we analyse.
In depth stock analysis decides inclusion/exclusion from portfolio.
G I C S M S C I I B E SC o m p a n y S e c t o r M a r k e t C u r r n c yS y m b o l C o m p a n y N a m e C o u n t r y N a m e C a p I S O
# 1 # 2 # 4 # 1 0 r o e p b o v e r a l l % i l e
6 3 1 3 4 9 C h a o d a M o d e r n A g r i c u l t u r e ( H o ld in g s ) L t d . H O N G K O N G C o n s u m e r S t a p le s 2 , 4 9 5 . 1 C N Y 2 1 .4 1 .1 05 4 0 4 7 2 T r a n s n e f t R U S S I A E n e r g y # N / A U S D 1 6 .5 0 .2 0 . 1B 1 V Z 1 Q O r a s c o m T e le c o m H o ld in g E G Y P T T e le c o m m u n ic a t io n S e r v i c e s 3 , 2 8 6 . 9 E G P 3 3 .0 1 .8 0 . 36 1 2 7 9 3 S t e in h o f f I n t e rn a t io n a l H o ld in g s L t d . S O U T H A F R I C A C o n s u m e r D is c r e t io n a r y 3 , 1 0 6 . 5 Z A R 1 6 .8 0 .8 0 . 56 2 1 1 7 3 D a e w o o S h ip b u i ld in g & M a r in e E n g in e e r in g C oS O U T H K O R E A I n d u s t r i a l s 1 , 6 4 1 . 8 K R W 2 2 .4 1 .4 0 . 76 4 5 1 0 6 H y u n d a i M i p o D o c k y a rd C o . L t d . S O U T H K O R E A I n d u s t r i a l s 1 , 1 7 4 . 2 K R W 1 6 .9 1 .0 0 . 9B 1 7 K P 4 R o s n e f t R U S S I A @ N A # N / A U S D 2 0 .8 1 .3 1 . 1B 0 N 3 K 5 M u r r a y & R o b e r ts H o ld in g s L td . S O U T H A F R I C A I n d u s t r i a l s 1 , 7 3 3 . 7 Z A R 2 7 .3 1 .8 1 . 25 2 6 3 2 5 K G H M P o ls k a M ie d z S . A . P O L A N D M a t e r ia l s 3 , 5 9 3 . 5 P L N 2 5 .6 1 .7 1 . 4B 0 3 M Y K T u rk H a v a Y o l la r i A . O . T U R K E Y I n d u s t r i a l s 1 , 1 8 6 . 1 T R Y 1 9 .8 1 .3 1 . 66 5 3 7 0 3 L G C o rp . S O U T H K O R E A I n d u s t r i a l s 5 , 2 9 0 . 8 K R W 2 0 .9 1 .5 1 . 86 1 5 3 3 3 A v e n g L t d . S O U T H A F R I C A I n d u s t r i a l s 1 , 9 4 5 . 9 Z A R 1 7 .7 1 .3 26 7 7 2 2 1 S a m s u n g H e a v y In d u s t r ie s C o . L t d . S O U T H K O R E A I n d u s t r i a l s 3 , 3 9 4 . 3 K R W 2 5 .9 1 .9 2 . 25 1 0 9 4 0 G a z p r o m N e f t R U S S I A E n e r g y # N / A U S D 1 8 .1 1 .3 2 . 36 2 9 0 9 0 L G T e le C o m C o . L t d . S O U T H K O R E A T e le c o m m u n ic a t io n S e r v i c e s 1 , 6 5 7 . 0 K R W 1 4 .5 0 .9 2 . 56 4 4 0 0 2 H o n a m P e t r o c h e m ic a l C o r p . S O U T H K O R E A M a t e r ia l s 1 , 3 3 8 . 3 K R W 1 4 .8 1 .0 2 . 75 4 5 2 2 0 T a t n e f t R U S S I A @ N A # N / A U S D 1 4 .4 0 .9 2 . 94 5 6 0 5 8 L u k o i l H o ld in g s R U S S I A @ N A # N / A U S D 1 4 .1 0 .8 3 . 1B 0 3 0 0 P T h a i O i l P C L T H A I L A N D E n e r g y 1 , 0 0 8 . 8 T H B 1 6 .4 1 .2 3 . 3B 1 7 R 2 H E le t r o p a u lo M e t r o p o l i t a n a P r f B B R A Z I L U t i l i t i e s 1 , 9 1 1 . 3 B R L 3 1 .1 2 .2 3 . 46 4 4 6 6 2 H y u n d a i H e a v y I n d u s t r i e s C o . L t d . S O U T H K O R E A I n d u s t r i a l s 7 , 2 2 5 . 6 K R W 2 5 .3 2 .0 3 . 65 1 4 0 9 8 G a z p r o m O A O ( A D S ) R U S S I A @ N A # N / A U S D 1 3 .8 0 .8 3 . 86 2 9 1 8 1 C h in a P e tr o le u m & C h e m ic a l C o r p . C H I N A E n e r g y 1 2 , 2 7 0 . 2 C N Y 1 5 .9 1 .2 46 4 9 5 4 2 K o r e a Z in c C o . L t d . S O U T H K O R E A M a t e r ia l s 1 , 2 6 6 . 0 K R W 1 8 .4 1 .5 4 . 26 4 9 0 9 2 K ia M o t o r s C o r p . S O U T H K O R E A C o n s u m e r D is c r e t io n a r y 3 , 7 7 9 . 1 K R W 1 6 .1 1 .2 4 . 46 8 9 6 8 3 H y o s u n g C o r p . S O U T H K O R E A M a t e r ia l s 1 , 6 2 7 . 6 K R W 1 4 .4 1 .0 4 . 5B 0 3 J 9 L A i r A s ia B h d M A L A Y S I A I n d u s t r i a l s 4 3 6 . 6 M Y R 1 7 .4 1 .4 4 . 76 4 5 0 2 6 H y n ix S e m ic o n d u c t o r I n c . S O U T H K O R E A I n f o r m a t io n T e c h n o lo g y 8 , 9 4 8 . 9 K R W 3 2 .4 2 .4 4 . 9B 2 B 3 3 2 P T T A r o m a t i c s & R e f in in g P C L T H A I L A N D E n e r g y 8 0 6 . 7 T H B 1 5 .0 1 .2 5 . 12 4 4 0 9 7 C o m p a n h ia d e T r a n s m is s a o d e E n e r g ia E le t r i c B R A Z I L U t i l i t i e s 7 9 2 . 1 B R L 1 9 .4 1 .7 5 . 36 6 8 3 4 4 K a n g w o n L a n d I n c . S O U T H K O R E A C o n s u m e r D is c r e t io n a r y 1 , 3 0 2 . 2 K R W 2 0 .8 1 .8 5 . 56 1 8 2 1 1 A r c e lo r M i t t a l S o u th A f r i c a L t d . S O U T H A F R I C A M a t e r ia l s 2 , 4 6 2 . 0 Z A R 1 9 .8 1 .7 5 . 6B 1 Y B R G C o m p a n h ia E n e rg e t i c a d e M in a s G e r a i s -C E M I B R A Z I L U t i l i t i e s 5 , 8 4 1 . 2 B R L 1 7 .7 1 .4 5 . 8B 0 Z V 1 0 G r u p o A e r o p o r t u a r io d e l P a c i f i c o S .A . B . d e C . VM E X I C O I n d u s t r i a l s 1 , 5 4 8 . 8 M X N 1 3 .6 0 .9 6B 5 9 L 4 L G a z p r o m O A O R U S S I A E n e r g y 5 2 , 7 5 7 . 5 R U B 1 3 .1 0 .8 6 . 26 4 9 6 7 5 H a n w h a C o r p . S O U T H K O R E A M a t e r ia l s 1 , 8 9 2 . 9 K R W 1 6 .3 1 .4 6 . 4B 3 V Z 2 2 C h in a Z h o n g w a n g H o ld in g s L t d . C H I N A M a t e r ia l s 1 , 3 7 7 . 8 C N Y 2 4 .7 2 .2 6 . 66 4 9 7 0 0 O C I C o . L t d . S O U T H K O R E A M a t e r ia l s 1 , 8 8 1 . 3 K R W 2 6 .0 2 .3 6 . 86 7 7 7 4 5 S a s o l L t d . S O U T H A F R I C A E n e r g y 2 0 , 3 1 5 . 1 Z A R 2 0 .2 1 .8 6 . 9B 0 1 V Z N L G D is p la y C o . L td . S O U T H K O R E A I n f o r m a t io n T e c h n o lo g y 7 , 5 7 8 . 5 K R W 1 4 .1 1 .2 7 . 1B 0 3 M Y T T u rk i y e P e t r o l R a f in e r i l e r i A . S . T U R K E Y E n e r g y 2 , 3 4 8 . 1 T R Y 2 2 .0 2 .0 7 . 36 2 8 0 2 1 G o ld F ie ld s L td . S O U T H A F R I C A M a t e r ia l s 7 , 6 8 2 . 1 Z A R 1 5 .1 1 .3 7 . 56 1 0 1 1 5 T a t a S t e e l L td . I N D I A M a t e r ia l s 3 , 2 6 5 . 3 I N R 1 8 .3 1 .7 7 . 76 3 4 9 6 8 F o s c h in i L t d . S O U T H A F R I C A C o n s u m e r D is c r e t io n a r y 1 , 5 6 6 . 6 Z A R 2 6 .4 2 .4 7 . 9
6 1 0 0 4 2 A d i t y a B i r l a N u v o L t d . I N D I A I n d u s t r ia ls 6 2 0 . 8 I N R 5 .1 1 .6 9 1 . 52 0 3 6 9 9 B R F - B r a s i l F o o d s S . A . B R A Z I L C o n s u m e r S t a p le s 7 , 8 8 0 . 2 B R L 5 .7 1 .6 9 1 . 76 1 9 1 3 5 C h in a I n t l M a r in e C o n t B H K D C H I N A I n d u s t r ia ls 9 4 8 . 2 C N Y 7 .0 1 .7 9 1 . 9B 0 C M C H R a n b a x y L a b o r a t o r ie s L t d . I N D I A H e a l t h C a r e 9 3 9 . 9 I N R 1 6 .5 3 .8 9 2B 0 4 K N F A ir C h in a L t d C H I N A I n d u s t r ia ls 1 , 8 9 6 . 9 C N Y 1 4 .4 2 .9 9 2 . 26 0 9 4 9 2 E v e r l ig h t E l e c t r o n ic s C o . L t d . T A I W A N I n f o r m a t io n T e c h n o lo g y 9 5 9 . 8 T W D 1 4 .9 3 .1 9 2 . 46 7 7 1 6 0 S a m s u n g C & T C o r p . S O U T H K O R E A I n d u s t r ia ls 6 , 2 9 7 . 3 K R W 6 .3 1 .6 9 2 . 6B 1 Y 9 Q S A B B L td . ( I n d ia ) I N D I A I n d u s t r ia ls 8 6 8 . 0 I N R 2 0 .6 6 .7 9 2 . 8B 0 1 B 1 L C h in a M e n g n iu D a i r y C o . L td . H O N G K O N G C o n s u m e r S t a p le s 3 , 3 9 8 . 0 C N Y 1 8 .3 4 .7 9 36 7 1 2 8 6 C h in a M e n g n iu D a i r y C o . L td . T A I W A N I n f o r m a t io n T e c h n o lo g y 3 2 8 . 2 T W D 7 .8 1 .8 9 3 . 16 1 0 8 9 9 P o w e r c h i p S e m ic o n d u c to r C o rp . T A I W A N I n f o r m a t io n T e c h n o lo g y 1 , 0 2 7 . 9 T W D - 4 7 .0 1 .4 9 3 . 3B 0 4 K P 8 Z T E C O R P H C H I N A I n f o r m a t io n T e c h n o lo g y 1 , 9 5 6 . 7 C N Y 1 6 .9 4 .2 9 3 . 56 7 1 8 7 1 F o r m o s a P e t ro c h e m ic a l C o rp . T A I W A N E n e r g y 3 , 0 4 5 . 7 T W D 1 6 .0 3 .5 9 3 . 7B 1 L G B 1 T V N S . A . P O L A N D C o n s u m e r D i s c r e t io n a r y 6 2 0 . 2 P L N 1 4 .5 3 .1 9 3 . 96 9 0 5 8 0 T s in g ta o B r e w e r y C o . L t d . C H I N A C o n s u m e r S t a p le s 1 , 5 5 1 . 4 C N Y 1 9 .2 5 .8 9 4 . 16 1 8 8 5 3 Z e e E n t e r ta in m e n t E n t e r p r is e s L t d . I N D I A C o n s u m e r D i s c r e t io n a r y 1 , 1 0 1 . 4 I N R 1 4 .1 2 .9 9 4 . 32 2 9 2 5 8 T I M P a r t ic i p a c o e s S / A B R A Z I L T e le c o m m u n ic a t io n S e r v ic e s 1 , 7 2 9 . 5 B R L 5 .4 1 .6 9 4 . 46 1 8 6 0 2 E V A A ir w a y s C o r p . T A I W A N I n d u s t r ia ls 5 1 7 . 6 T W D 0 .1 1 .5 9 4 . 62 1 9 6 0 2 E m p r e s a s C o p e c S . A . C H I L E I n d u s t r ia ls 6 , 9 9 2 . 6 C L P 1 0 .7 2 .3 9 4 . 86 4 1 6 1 3 C h in a M e r c h a n t s H o ld in g s ( I n te r n a tio n a l ) C o . LH O N G K O N G I n d u s t r ia ls 3 , 7 5 5 . 9 H K D 8 .7 2 .0 9 52 6 6 7 7 7 C o m p a n h ia B r a s i l e i ra d e D i s t r i b u ic a o G r u p o P B R A Z I L C o n s u m e r S t a p le s 2 , 8 4 5 . 7 B R L 1 0 .1 2 .3 9 5 . 2B 2 Q Y 9 6 H y p e r m a r c a s S / A B R A Z I L C o n s u m e r S t a p le s 1 , 5 8 4 . 9 B R L 1 4 .4 3 .5 9 5 . 4B 0 7 1 G 3 I n o t e r a M e m o r i e s I n c . T A I W A N I n f o r m a t io n T e c h n o lo g y 1 , 2 8 0 . 7 T W D 8 .4 2 .0 9 5 . 5B 0 1 G V Y J a ip ra k a s h A s s o c ia t e s L t d . I N D I A I n d u s t r ia ls 2 , 7 0 3 . 6 I N R 1 3 .8 3 .3 9 5 . 72 1 7 8 3 3 C a r s o G lo b a l T e le c o m S . A . B . d e C . V . M E X I C O T e le c o m m u n ic a t io n S e r v ic e s 3 , 1 3 0 . 9 M X N 1 3 .1 3 .0 9 5 . 96 2 4 1 8 5 S a t y a m C o m p u t e r S e r v ic e s L t d . I N D I A I n f o r m a t io n T e c h n o lo g y 1 , 1 1 7 . 7 I N R 1 3 .7 3 .3 9 6 . 16 2 8 3 6 0 N a n y a T e c h n o lo g y C o r p . T A I W A N I n f o r m a t io n T e c h n o lo g y 8 9 0 . 2 T W D 3 .3 1 .7 9 6 . 3B 2 R 2 Z C C h in a S o u t h L o c o m o t iv e & R o l l in g S t o c k C o r p C H I N A I n d u s t r ia ls 1 , 2 5 9 . 7 C N Y 1 3 .1 3 .0 9 6 . 52 1 9 6 1 8 C o m p a n ia C e r v e c e r ia s U n id a s S .A . C H I L E C o n s u m e r S t a p le s 9 6 7 . 8 C L P 9 .3 2 .3 9 6 . 66 3 4 4 2 7 D a e w o o I n t e r n a t i o n a l C o r p . S O U T H K O R E A I n d u s t r ia ls 1 , 5 6 7 . 8 K R W 1 1 .1 2 .7 9 6 . 86 1 0 9 4 3 T a iw a n F e r t i l iz e r C o . L t d . T A I W A N M a t e r ia ls 2 , 3 2 8 . 5 T W D 6 .5 2 .0 9 76 2 9 4 6 7 D o o s a n H e a v y I n d u s t r ie s & C o n s t r u c tio n C o . L S O U T H K O R E A I n d u s t r ia ls 2 , 2 6 0 . 6 K R W 1 0 .7 2 .8 9 7 . 2B 1 4 X J Y P o ly u s G o ld R U S S I A @ N A # N / A U S D 8 .5 2 .3 9 7 . 46 3 5 4 1 5 E P I S T A R C o r p . T A I W A N I n f o r m a t io n T e c h n o lo g y 1 , 7 7 6 . 0 T W D 7 .7 2 .3 9 7 . 62 7 7 1 6 7 S . A .C .I . F a la b e l l a C H I L E C o n s u m e r D i s c r e t io n a r y 1 , 6 3 0 . 8 C L P 1 3 .4 4 .0 9 7 . 7B 3 9 S R 2 T e lm e x I n t e rn a c io n a l S . A . B . d e C . V . M E X I C O T e le c o m m u n ic a t io n S e r v ic e s 4 , 6 5 1 . 4 M X N 9 .7 2 .7 9 7 . 9B 0 B 8 Z 1 C h in a C O S C O H o ld in g s C o . L t d . C H I N A I n d u s t r ia ls 2 , 9 9 7 . 7 C N Y -2 .9 1 .9 9 8 . 16 5 7 6 9 9 U n i t e d S p i r i t s L t d . I N D I A C o n s u m e r S t a p le s 2 , 0 4 2 . 4 I N R 1 2 .2 3 .4 9 8 . 36 5 5 6 6 8 M a l a y s ia n A i r l in e S y s t e m B h d M A L A Y S I A I n d u s t r ia ls 4 6 8 . 0 M Y R 4 .6 2 .1 9 8 . 56 9 7 2 4 5 C h in a R e s o u r c e s E n t e r p r is e L t d . H O N G K O N G C o n s u m e r D i s c r e t io n a r y 4 , 0 9 0 . 5 H K D 7 .5 2 .4 9 8 . 76 6 0 9 4 4 M o t e c h I n d u s t r ie s I n c . T A I W A N I n d u s t r ia ls 9 9 3 . 6 T W D 9 .4 2 .9 9 8 . 86 2 1 1 6 7 D o o s a n I n f r a c o r e C o . L t d . S O U T H K O R E A I n d u s t r ia ls 1 , 2 0 4 . 5 K R W 7 .4 2 .5 9 9B 1 Q 2 F V G V T ( H o ld i n g ) S / A B R A Z I L T e le c o m m u n ic a t io n S e r v ic e s 2 , 7 2 5 . 8 B R L 1 0 .5 3 .6 9 9 . 2B 4 Q 2 T X C h in a L o n g y u a n P o w e r G ro u p C o rp . L t d . C H I N A U t i l i t i e s 1 , 8 2 2 . 2 H K D 7 .4 3 .1 9 9 . 4B 1 9 2 H J G M R I n f r a s t r u c tu r e L t d . I N D I A U t i l i t i e s 8 8 4 . 7 I N R 4 .5 3 .0 9 9 . 66 8 8 9 6 7 I s r a e l C o r p . L t d . I S R A E L M a t e r ia ls 1 , 4 2 8 . 1 I L S 5 .1 3 .5 9 9 . 8B 1 9 R P M O G X P e t r o le o e G a s P a r tic ip a c o e s S / A B R A Z I L E n e r g y 1 2 , 0 8 5 . 3 B R L -2 .8 6 .1 1 0 0
Name Percentile Stock analysis Outcome
OGX Petroleo 99th Analysis suggests growth shock risk is high – do not short
Compal Communications 98th High valuation reflects market optimism on
recovery priced in – go short
Beijing Capital Airport 90th Structural low return on capital but not discounted by market – include as short
Name Percentile Stock analysis Outcome
Chaoda Modern Agriculture 1st Analysis results in long position
Hyundai Heavy 2nd Stock and industry analysis results in long position
LG Corp 2nd Over-complex holding structure – exclude as long
Murray & Roberts 3rd Analysis suggests market overly pessimistic on order prospects – result is long
Source: HSBC Global Asset Management, as of January 2010. For illustrative purpose only. The material contained in this presentation is for information only and does not constitute investment advice or a recommendation to any reader of this material to buy or sell investments

20
Investment Process - Construct optimal long/short portfolio within defined trading limits
The portfolio is constructed by implementing the individual stock ideas and will typically hold approximately 35 long and 35 short stock positions.
Make best use of defined risk limits for:- Gross/Net Exposure- Market/sector exposure- Single name exposure
Position size determined by individual name volatility/risk and liquidity.
Target Weighted Percentile ranking:- Longs 5th – 15th
- Shorts 85th – 95th
Universe Analysis Stock Analysis Portfolio Construction Risk Monitoring
Source: HSBC Global Asset Management March 2011. Please note that the target portfolio and information associated with it are given for illustrative purposes only
21
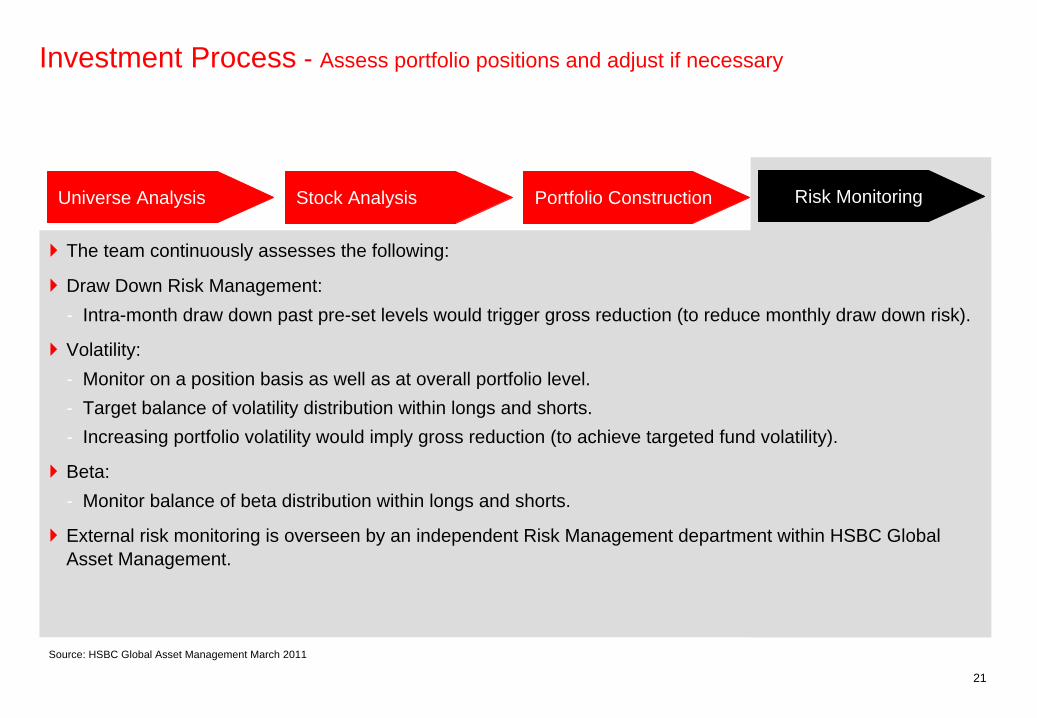
Investment Process - Assess portfolio positions and adjust if necessary
The team continuously assesses the following:
Draw Down Risk Management:- Intra-month draw down past pre-set levels would trigger gross reduction (to reduce monthly draw down risk).
Volatility:- Monitor on a position basis as well as at overall portfolio level.- Target balance of volatility distribution within longs and shorts.- Increasing portfolio volatility would imply gross reduction (to achieve targeted fund volatility).
Beta:- Monitor balance of beta distribution within longs and shorts.
External risk monitoring is overseen by an independent Risk Management department within HSBC Global Asset Management.
Universe Analysis Stock Analysis Portfolio Construction Risk Monitoring
Source: HSBC Global Asset Management March 2011
22
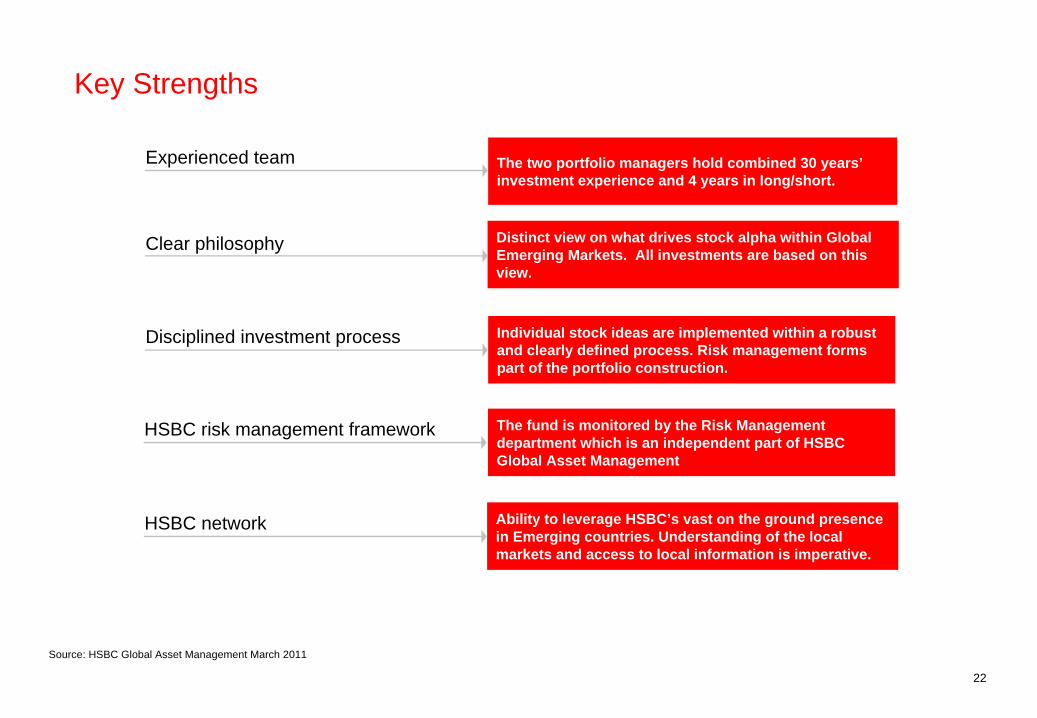
Key Strengths
The two portfolio managers hold combined 30 years’ investment experience and 4 years in long/short.
Experienced team
Distinct view on what drives stock alpha within Global Emerging Markets. All investments are based on this view.
Clear philosophy
Individual stock ideas are implemented within a robust and clearly defined process. Risk management forms part of the portfolio construction.
Disciplined investment process
Ability to leverage HSBC’s vast on the ground presence in Emerging countries. Understanding of the local markets and access to local information is imperative.
HSBC network
HSBC risk management framework The fund is monitored by the Risk Management department which is an independent part of HSBC Global Asset Management
Source: HSBC Global Asset Management March 2011

Risk Management

24
Defined Risk Limits
Source: HSBC Global Asset Management, as of January 2011. For illustrative purposes only
Factor Limit Typical Range
Gross Exposure 0% to 250% 100% to 150%
Country / Sector Exposure -20% to 20% -15% to 15%
Net Beta Exposure -20% to 20%
Net Exposure -30% to 50% -20% to 20%
Single Name Exposure -8% to 8% -3% to 4%
Diversification 60-100 stock names
Volatility 20% 5% to 15%

25
Framework
Investment Team Operational Control Parent Oversight
Portfolio Manager Risk Guidelines and Portfolio Constraints Market Risks
Trading Desk Pre-trade compliance Coherence of orders Counterparty risks Market risks
Risk Control Front-end Systems Clients guidelines In-house risk limits Regulatory guidelines
Management Assistance Operational risk control
Transaction Review Committee
Internal Control/Compliance Process control
HSBC’s Risk Management and Audit Control of processes (including Risk Control Processes)
Follow up of risk control activities
The team is supported by a well proven Risk Management Framework which is put into place to comply with the identified risks characterising investments in the Global emerging markets.
Source: HSBC Global Asset Management March 2011, Information is for illustrative purposes only.
Risk Management Framework

Market Overview

27
Investment Rationale and Philosophy
1992-1995 2005-2010
Source: UBS, December 2010
We believe that the Emerging Market countries will continue to catch up with the Developed Market countries in the coming years.
Average GDP Y-0-Y growth (%)
Ave
rage
rela
tive
cont
ribut
ion
to
Wor
ld N
omin
al G
DP
grow
th (%
)
Europe
Emerging Markets
US
Japan
0%
10%
20%
30%
40%
50%
60%
- 0.50 1.00 1.50 2.00 2.50 3.00 3.50 4.00
Average GDP Y-0-Y growth (%)
Ave
rage
rela
tive
cont
ribut
ion
to
Wor
ld N
omin
al G
DP
grow
th (%
)
5.00
Japan
US
Emerging Markets
Europe
0%
10%
20%
30%
40%
50%
60%
- 2.00 4.00 6.00 8.00

28
Cumulative data Jan 2000- Dec 2010
0%
50%
100%
150%
200%
250%
China
IndiaPeru
Russia
IndonesiaEgyp
tMalays
iaPhilip
pines
Morocco
KoreaThaila
ndTurke
yColo
mbiaPoland
Chile
Brazil
South Afric
a
Czech
RepublicHun
garyMexic
o
0%
200%
400%
600%
800%
1000%
1200%
1400%
1600%
Cum. GDP growth (LHS) Cum. stock mkt return (RHS)
Source: HSBC Global Asset Management, Factset (stock market returns), IMF World Economic Outlook (GDP growth), December 2010. Performance information shown refers to the past and should not be seen as an indication of future returns
The rapid GDP growth within Emerging Market countries since 2000 has not been enough to generate strong stock market returns
Investment Rationale and Philosophy

29
Investment Rationale and Philosophy
There is a strong relationship between valuation and profitability within the GEM universe.
Valuation outliers tend to correct over time.
Concentrating long and short positions within valuation outliers and ignoring mainstream “fairly valued” stocks should enhance returns.
Fundamental analysis to validate profitability is essential and adds significant value.
We believe that…...
Source: HSBC Global Asset Management; September 2010. For illustrative purpose only. The views expressed above were held at the time of preparation and are subject to change without notice, latest data available
0
1
2
3
4
5
6
7
0 5 10 15 20 25 30 35 40
Profitability (RoE)
Valu
atio
n (P
/B)
universelongsshorts
30
Investment Rationale and Philosophy
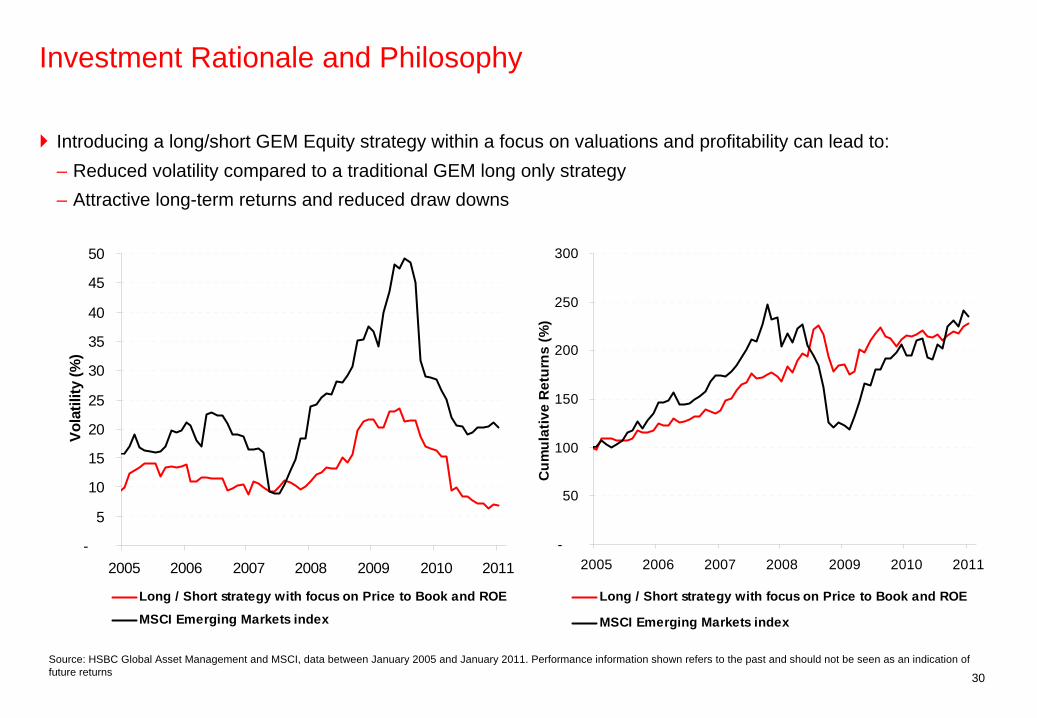
Introducing a long/short GEM Equity strategy within a focus on valuations and profitability can lead to:– Reduced volatility compared to a traditional GEM long only strategy– Attractive long-term returns and reduced draw downs
-
5
10
15
20
25
30
35
40
45
50
2005 2006 2007 2008 2009 2010 2011
Vola
tility
(%)
Long / Short strategy with focus on Price to Book and ROE
MSCI Emerging Markets index
-
50
100
150
200
250
300
2005 2006 2007 2008 2009 2010 2011C
umul
ativ
e R
etur
ns (%
)
Long / Short strategy with focus on Price to Book and ROE
MSCI Emerging Markets index
Source: HSBC Global Asset Management and MSCI, data between January 2005 and January 2011. Performance information shown refers to the past and should not be seen as an indication of future returns

HSBC GIF GEM Equity Absolute Return Fund - Overview

32
Investment Vehicle
Fund type and domicile UCITS III Luxembourg SICAV
Launch Date 16/04/2010
Base Currency USD
Benchmark* 1 Month USD Libor
Liquidity Daily
Minimum Investment
– Institutional Share Class USD 1,000,000
– Retail Share Class USD 5,000
Fee Structure
– Institutional Share Class 1.0 % Fixed Management Fee
– Retail Share Class 1.50 % Fixed Management Fee
*This is the current internal benchmark, which may change and is not detailed in the fund's prospectus. This benchmark is indicative only and is not guaranteed in any way. HSBC Global Asset Management (UK) Limited accepts no liability for any failure to meet this target.
33
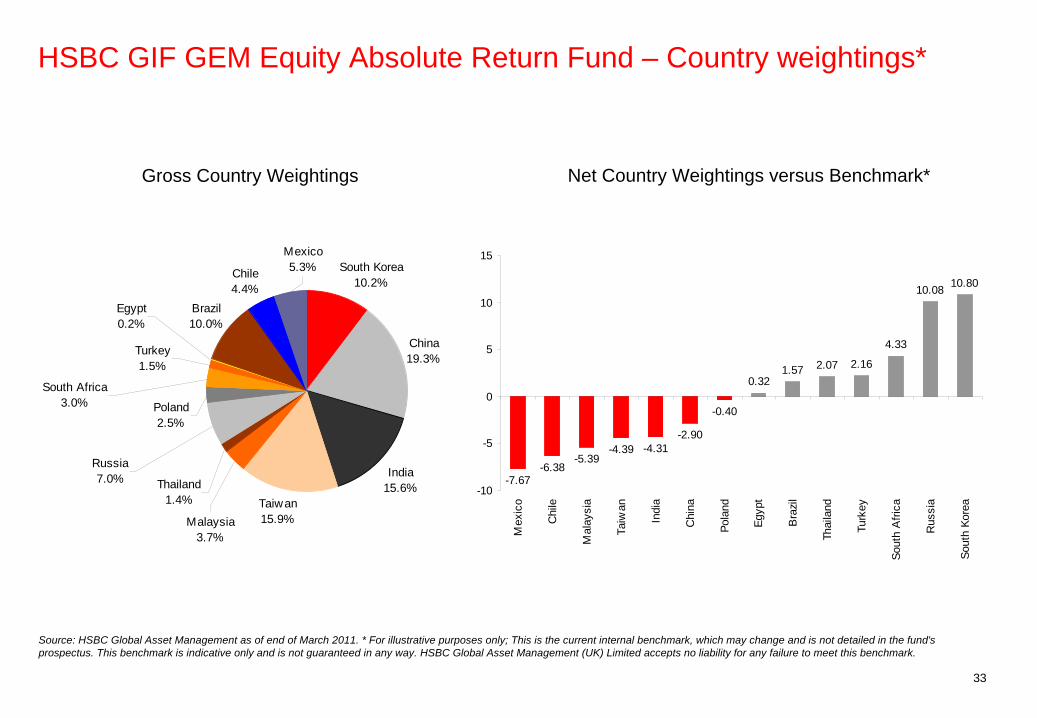
Net Country Weightings versus Benchmark*
Source: HSBC Global Asset Management as of end of March 2011. * For illustrative purposes only; This is the current internal benchmark, which may change and is not detailed in the fund's prospectus. This benchmark is indicative only and is not guaranteed in any way. HSBC Global Asset Management (UK) Limited accepts no liability for any failure to meet this benchmark.
Gross Country Weightings
HSBC GIF GEM Equity Absolute Return Fund – Country weightings*
South Korea10.2%
China19.3%
India15.6%
Taiwan15.9%
Brazil10.0%
Chile4.4%
Turkey1.5%
Poland2.5%
Thailand1.4%
Malaysia3.7%
Russia7.0%
Egypt0.2%
South Africa3.0%
Mexico5.3%
-7.67-6.38
-5.39-4.39 -4.31
-2.90
-0.40
0.321.57 2.07 2.16
4.33
10.08 10.80
-10
-5
0
5
10
15
Mex
ico
Chi
le
Mal
aysi
a
Taiw
an
Indi
a
Chi
na
Pola
nd
Egyp
t
Bra
zil
Thai
land
Turk
ey
Sout
h A
frica
Rus
sia
Sout
h Ko
rea

34
Net Sector Weightings versus Benchmark*Gross Sector Weightings
HSBC GIF GEM Equity Absolute Return Fund – Sector weightings*
Consumer Staples, 19.54
Energy, 13.28
Industrials, 29.63IT, 10.38
Materials, 17.85
Telecoms, 5.56
Utilities, 5.62
Healthcare, 1.89
Financials, 26.98
Consumer Discretionary, 14.27
-16.95
-5.62-2.34 -1.89 -0.83 -0.73
2.174.39 5.64
16.05
-20
-15
-10
-5
0
5
10
15
20
Con
sum
erSt
aple
s
Util
ities
Tele
com
s
Hea
lthca
re
Indu
stria
ls
Con
sum
erD
iscr
etio
nary IT
Ener
gy
Mat
eria
ls
Fina
ncia
ls
Source: HSBC Global Asset Management as of end of March 2011. * For illustrative purposes only; This is the current internal benchmark, which may change and is not detailed in the fund's prospectus. This benchmark is indicative only and is not guaranteed in any way. HSBC Global Asset Management (UK) Limited accepts no liability for any failure to meet this benchmark.
35
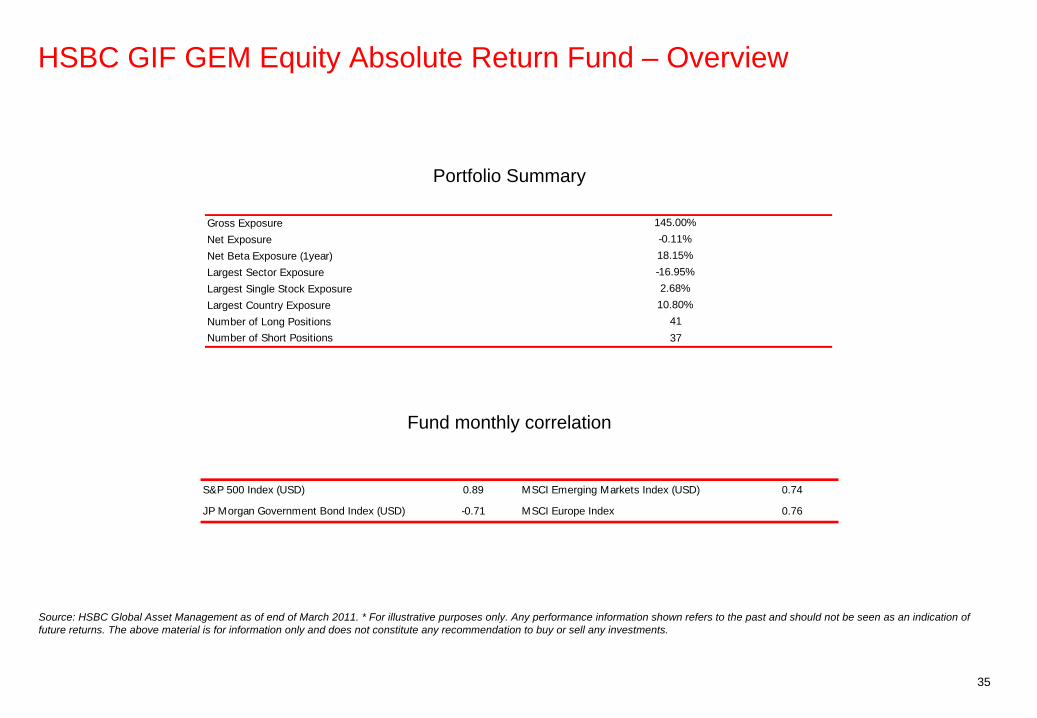
HSBC GIF GEM Equity Absolute Return Fund – Overview
Fund monthly correlation
Portfolio Summary
Gross Exposure 145.00%Net Exposure -0.11%Net Beta Exposure (1year) 18.15%Largest Sector Exposure -16.95%Largest Single Stock Exposure 2.68%Largest Country Exposure 10.80%Number of Long Positions 41Number of Short Positions 37
S&P 500 Index (USD) 0.89 MSCI Emerging Markets Index (USD) 0.74
JP Morgan Government Bond Index (USD) -0.71 MSCI Europe Index 0.76
Source: HSBC Global Asset Management as of end of March 2011. * For illustrative purposes only. Any performance information shown refers to the past and should not be seen as an indication of future returns. The above material is for information only and does not constitute any recommendation to buy or sell any investments.

36
Source: Morningstar as of 31st March 2011. *Past performance is net of fees, bid-bid, USD. It is for illustrative purposes only, and should not be relied on as indication for future returns. The above material is for information only and does not constitute any recommendation to buy or sell any investments.
Performance Net – M1C Share Class
-4.0%
-2.0%
0.0%
2.0%
4.0%
May-10 Jul-10 Sep-10 Nov-10 Jan-11 Mar-119.0
9.5
10.0
10.5
11.0
Fund Return (LHS) Benchmark Return (LHS) Fund NAV (RHS)
Monthly PerformanceJan Feb Mar Apr May Jun Jul Aug Sep Oct Nov Dec YTD
2011 1.33% 0.76% 0.58% 2.70%2010 1.71% -2.68% -0.71% 1.69% -2.90% 2.08% 1.78% -0.74% 3.34% 3.41%
Monthly StatisticsAnnualised Return 6.20% Annualised Volatility 6.65%Cumulative Return 6.20% Sharpe Ratio 0.89Best Month 3.34% Maximum Drawdown -4.59%Worst Month -2.90% Months in Max. Drawdown 4% Positive Months 66.67% Months to Recover 4Annualised Benchmark Return 0.28%

37
Performance Net – L1C Share Class
-4.0%
-2.0%
0.0%
2.0%
4.0%
May-10 Jul-10 Sep-10 Nov-10 Jan-11 Mar-119.0
9.5
10.0
10.5
11.0
Fund Return (LHS) Benchmark Return (LHS) Fund NAV (RHS)
Monthly PerformanceJan Feb Mar Apr May Jun Jul Aug Sep Oct Nov Dec YTD
2011 1.39% 0.79% 0.63% 2.83%2010 1.74% -2.64% -0.66% 1.74% -2.84% 2.15% 1.97% -0.85% 3.38% 3.86%
Monthly StatisticsAnnualised Return 6.80% Annualised Volatility 6.71%Cumulative Return 6.80% Sharpe Ratio 0.97Best Month 3.38% Maximum Drawdown -4.39%Worst Month -2.84% Months in Max. Drawdown 4% Positive Months 66.67% Months to Recover 4Annualised Benchmark Return 0.28%
Source: Morningstar as of 31st March 2011. *Past performance is net of fees, bid-bid, USD. It is for illustrative purposes only, and should not be relied on as indication for future returns. The above material is for information only and does not constitute any recommendation to buy or sell any investments.

Appendix
39
Portfolio Management Team
Nick Timberlake – Senior Portfolio ManagerNick Timberlake is the Global Head of Emerging Markets Equities and has been working in the industry since 1991. Since he joined HSBC in April 2005, Nick has built up the Global Emerging Markets team. Today the team is made up of 17 individuals, 11 of whom are investment professionals. As well as the Core GEM capability, the team run emerging markets assets in excess of $10 billion in BRIC, Russia, Brazil and Latin Americas and Frontier Emerging Market equity capabilities*. Prior to joining HSBC, Nick worked for F&C Asset Management. He holds an MA (Hons) in Geography and Economics from the University of Dundee (UK), is a member of the UK Society of Investment Professionals and a qualified associate of the Institute of Investment Management and Research (IIMR).
Omar Negyal, Senior Portfolio ManagerOmar Negyal is a Senior Portfolio Manager in the Global Emerging Markets Equities team and has been working in the industry since 1998. Prior to joining HSBC in 2009, Omar worked as an Analyst / Portfolio Manager at Lansdowne Partners. He holds a First Class MA and MEng in Chemical Engineering from Cambridge University (UK) and is a CFA Charterholder.

40
This presentation is intended for Professional Clients only and should not be distributed to or relied upon by Retail Clients. The contents of this presentation are confidential and may not be reproduced or further distributed to any person or entity, whether in whole or in part, for any purpose. The material contained herein is for information only and does not constitute investment advice or a recommendation to any reader of this material to buy or sell investments. HSBC Global Asset Management (UK) Limited has based this presentation on information obtained from sources it believes to be reliable but which it has not independently verified. HSBC Global Asset Management (UK) Limited and HSBC Group accept no responsibility as to its accuracy or completeness. This presentation is intended for discussion only and shall not be capable of creating any contractual or other legal obligations on the part of HSBC Global Asset Management (UK) Limited or any other HSBC Group company. Care has been taken to ensure the accuracy of this presentation but HSBC Global Asset Management (UK) Limited accepts no responsibility for any errors or omissions contained therein. This presentation and any issues or disputes arising out of or in connection with it (whether such disputes are contractual or non-contractual in nature, such as claims in tort, for breach of statute or regulation or otherwise) shall be governed by and construed in accordance with English law.The views expressed above were held at the time of preparation and are subject to change without notice.Any forecast, projection or target where provided is indicative only and is not guaranteed in any way. HSBC Global Asset Management (UK) Limited accepts no liability for any failure to meet such forecast, projection or target.The value of investments and any income from them can go down as well as up and investors may not get back the amount originally invested. Where overseas investments are held the rate of currency exchange may cause the value of such investments to go down as well as up.HSBC GIF Global Emerging Markets Equity Absolute Return Fund is a sub-fund of the HSBC Global Investment Funds, a Luxembourg domiciled SICAV. UK based investors in HSBC Global Investment Funds are advised that they may not be afforded some of the protections conveyed by the provisions of the Financial Services and Markets Act 2000. HSBC Global Investment Funds is recognised in the United Kingdom by the Financial Services Authority under section 264 of the Act. The shares in HSBC Global Investment Funds have not been and will not be offered for sale or sold in the United States of America, its territories or possessions and all areas subject to its jurisdiction, or to United States Persons. All applications are made on the basis of the current HSBC Global Investment Funds Prospectus, simplified prospectus and most recent annual and semi-annual reports, which can be obtained upon request free of charge from HSBC Global Asset Management (UK) Limited, 8 Canada Square, Canary Wharf, London, E14 5HQ. UK, or the local distributors. Investors and potential investors should read and note the risk warnings in the prospectus and relevant simplified prospectus. Investments in emerging markets are by their nature higher risk and potentially more volatile than those inherent in established markets. Economies in Emerging Markets generally are heavily dependent upon international trade and, accordingly, have been and may continue to be affected adversely by trade barriers, exchange controls, managed adjustments in relative currency values and other protectionist measures imposed or negotiated by the countries with which they trade. These economies also have been and may continue to be affected adversely by economic conditions in the countries in which they trade.Brokerage commissions, custodial services and other costs relating to investment in Emerging Markets generally are more expensive than those relating to investment in more developed markets. Lack of adequate custodial systems in some markets may prevent investment in a given country or may require a sub-fund to accept greater custodial risks in order to invest, although the Custodian will endeavour to minimise such risks through the appointment of correspondents that are international, reputable and creditworthy financial institutions. In addition, such markets have different settlement and clearance procedures. In certain markets there have been times when settlements have been unable to keep pace with the volume of securities transactions, making it difficult to conduct such transactions. The inability of a sub-fund to make intended securities purchases due to settlement problems could cause the sub-fund to miss attractive investment opportunities. Inability to dispose of a portfolio security caused by settlement problems could result either in losses to a sub-fund due to subsequent declines in value of the portfolio security or, if a sub-fund has entered into a contract to sell the security, could result in potential liability to the purchaser.
Important information
41
MSCI Index – The MSCI information may only be used for your internal use, may not be reproduced or redisseminated in any form and may not be used to create any financial instruments or products or any indices. The MSCI information is provided on an ‘as is’ basis and the user of this information assumes the entire risk of any use it may make or permit to be made of this information. Neither MSCI, any of its affiliates or any other person involved in or related to compiling, computing or creating the MSCI information (collectively, the ‘MSCI Parties’) makes any express or implied warranties or representations with respect to such information or the results to be obtained by the use thereof, and the MSCI Parties hereby expressly disclaim all warranties (including, without limitation, all warranties of originality, accuracy, completeness, timeliness, non-infringement, merchantability and fitness for a particular purpose) with respect to this information. Without limiting any of the foregoing, in no event shall any MSCI Party have any liability for any direct, indirect, special, incidental, punitive, consequential or any other damages (including, without limitation, lost profits) even if notified of, or if it might otherwise have anticipated, the possibility of such damagesThe risk also exists that an emergency situation may arise in one or more developing markets as a result of which trading of securities may cease or may be substantially curtailed and prices for a sub-fund’s securities in such markets may not be readily available.Investors should note that changes in the political climate in Emerging Markets may result in significant shifts in the attitude to the taxation of foreign investors. Such changes may result in changes to legislation, the interpretation of legislation, or the granting of foreign investors the benefit of tax exemptions or international tax treaties. The effect of such changes can be retrospective and can (if they occur) have an adverse impact on the investment return of shareholders in any sub-fund so affected.This sub-fund invests predominantly in one geographic area; therefore any decline in the economy of this area may affect the prices and value of the underlying assets. Stockmarket investments should be viewed as a medium to long term investment and should be held for at least five years. Any performance information shown refers to the past and should not be seen as an indication of future returns.To help improve our service and in the interests of security we may record and/or monitor your communication with us.HSBC Global Asset Management (UK) Limited provides information to Institutions, Professional Advisers and their clients on the investment products and services of the HSBC Group. This presentation is approved for issue in the UK by HSBC Global Asset Management (UK) Limited, who are authorised and regulated by the Financial Services Authority. www.assetmanagement.hsbc.com/ukCopyright © HSBC Global Asset Management (UK) Limited 2011. All rights reserved. 20487/052011/FP11-0916
Important information (cont’d)