Maximum Distance to Oil vs Average Price
71
Maximum Distance to Oil vs Average Price
-
Upload
mikayla-vargas -
Category
Documents
-
view
43 -
download
0
description
Maximum Distance to Oil vs Average Price. Maximum Efficiency of Prime Movers. Energy Density of Primary Fuels. Power Density. Crude Oil Production. Natural Gas Production. Annual Energy Consumption in England and Wales per capita by type. - PowerPoint PPT Presentation
Transcript of Maximum Distance to Oil vs Average Price
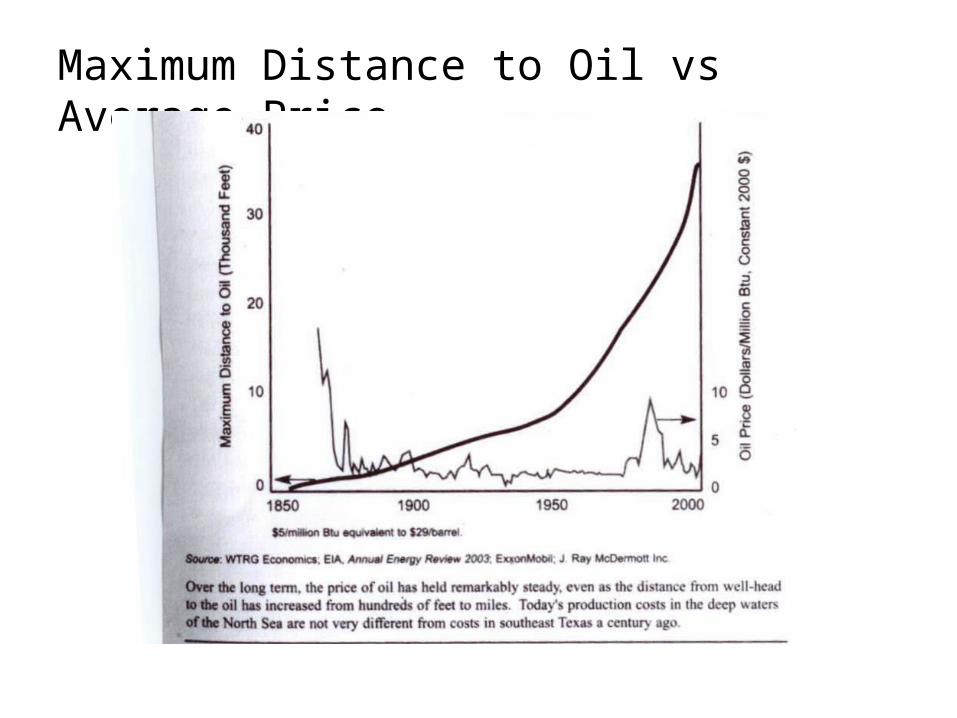
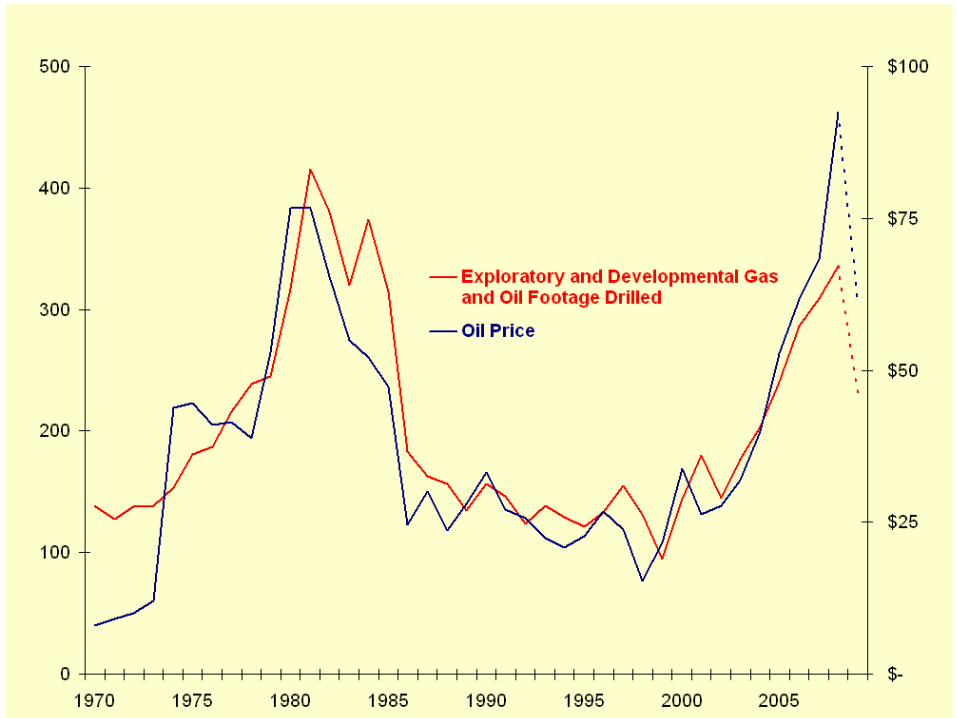
Maximum Distance to Oil vs Average Price
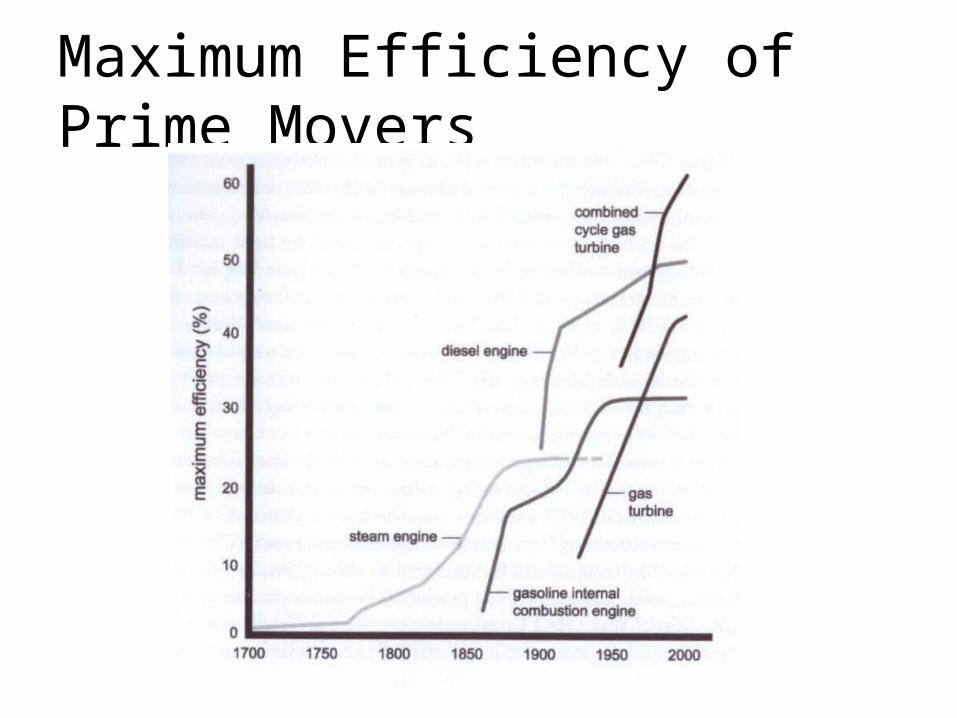
Maximum Efficiency of Prime Movers
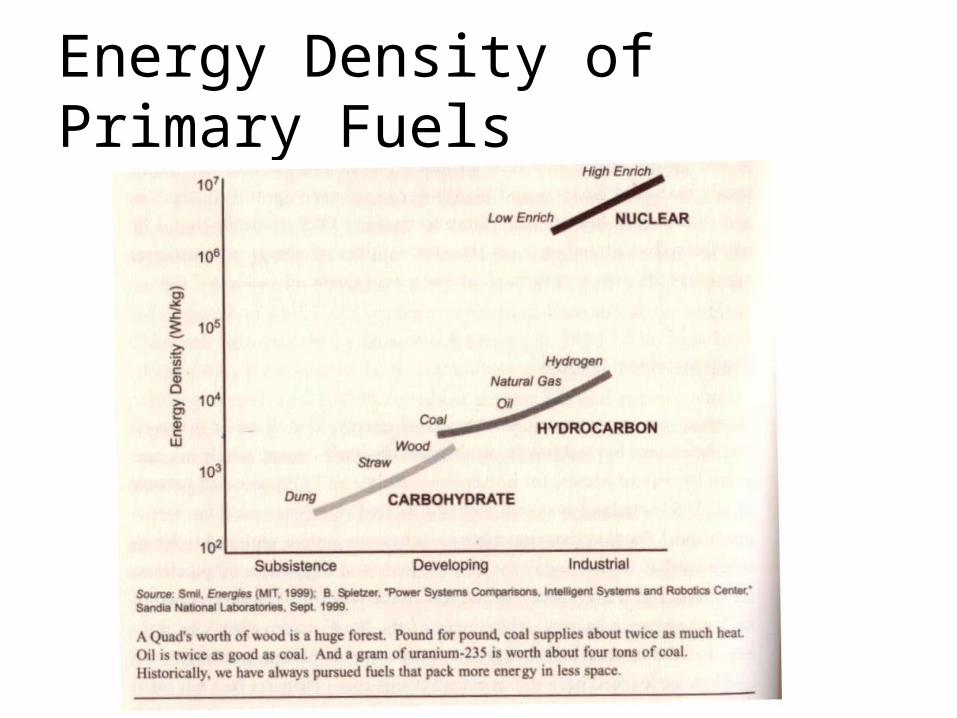
Energy Density of Primary Fuels
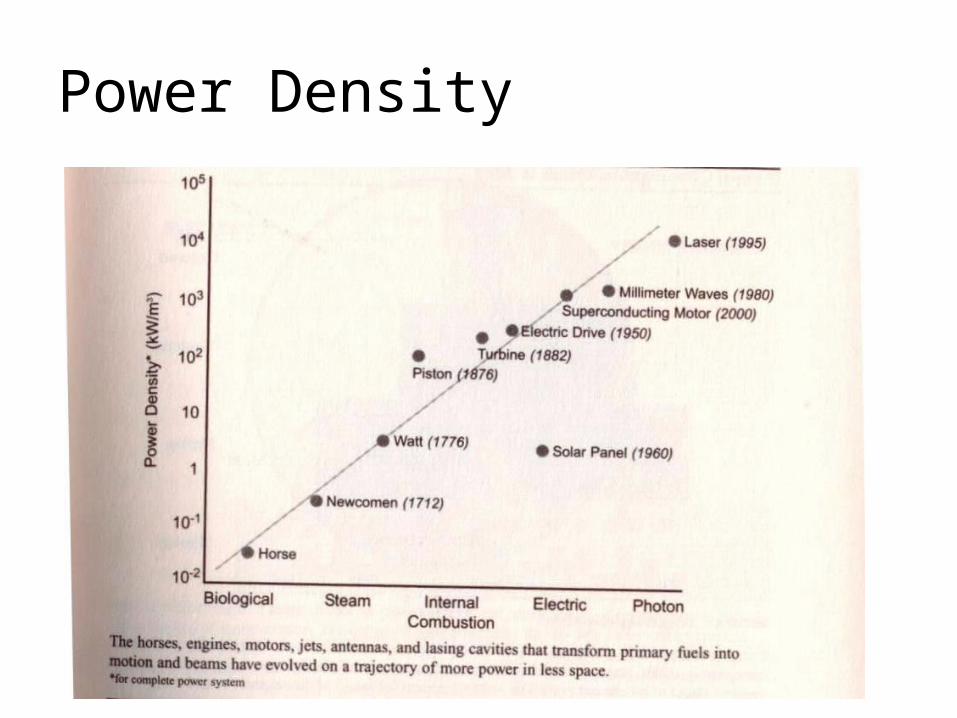
Power Density
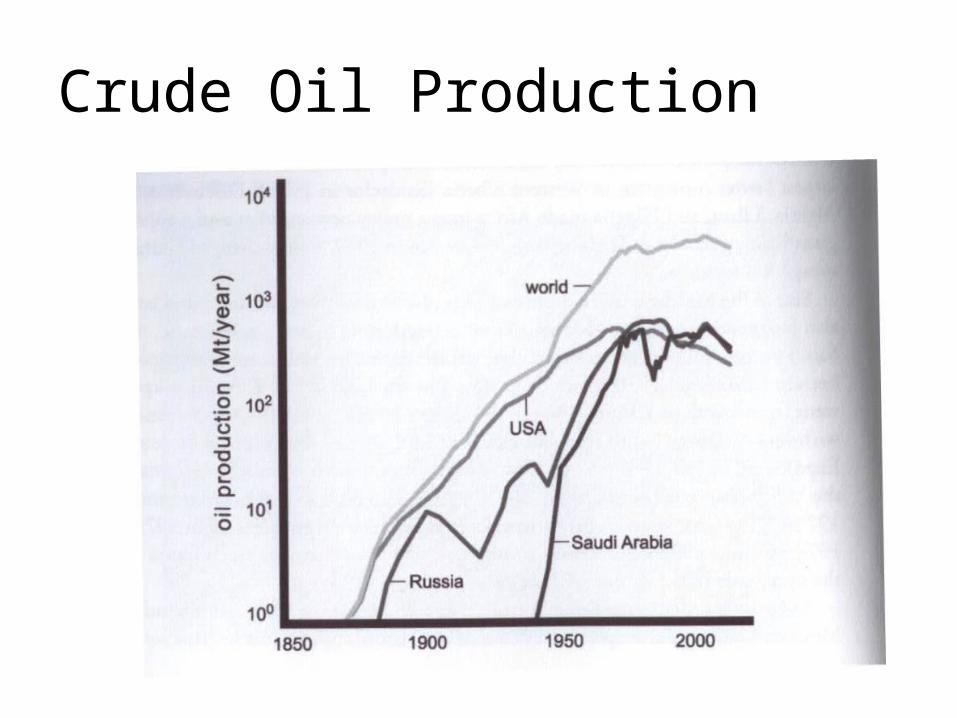
Crude Oil Production

Natural Gas Production
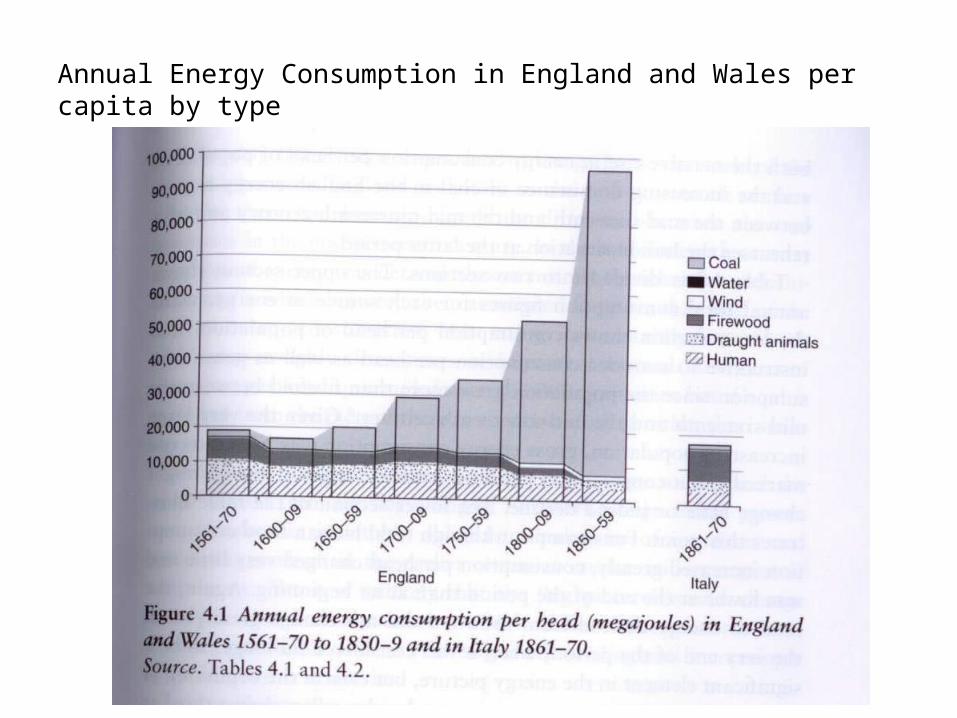
Annual Energy Consumption in England and Wales per capita by type
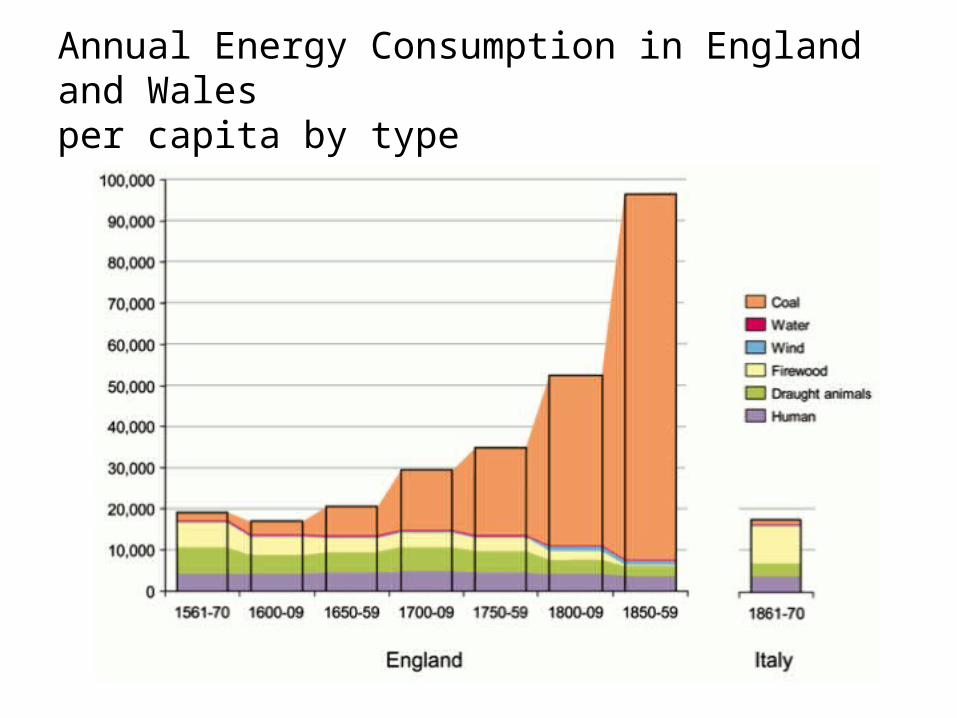
Annual Energy Consumption in England and Wales per capita by type
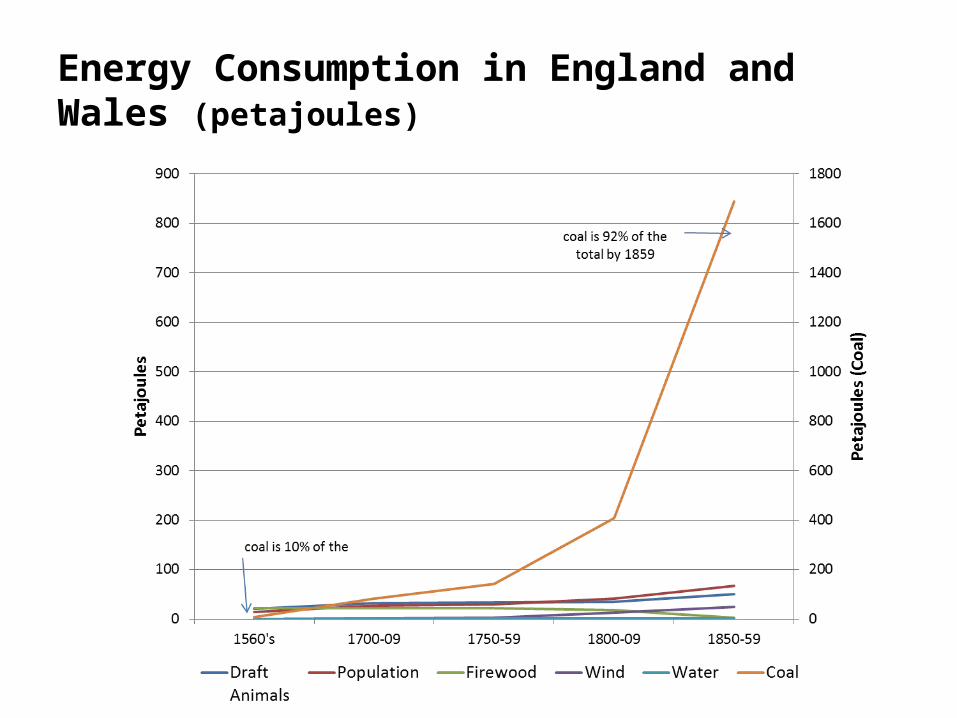
Energy Consumption in England and Wales (petajoules)
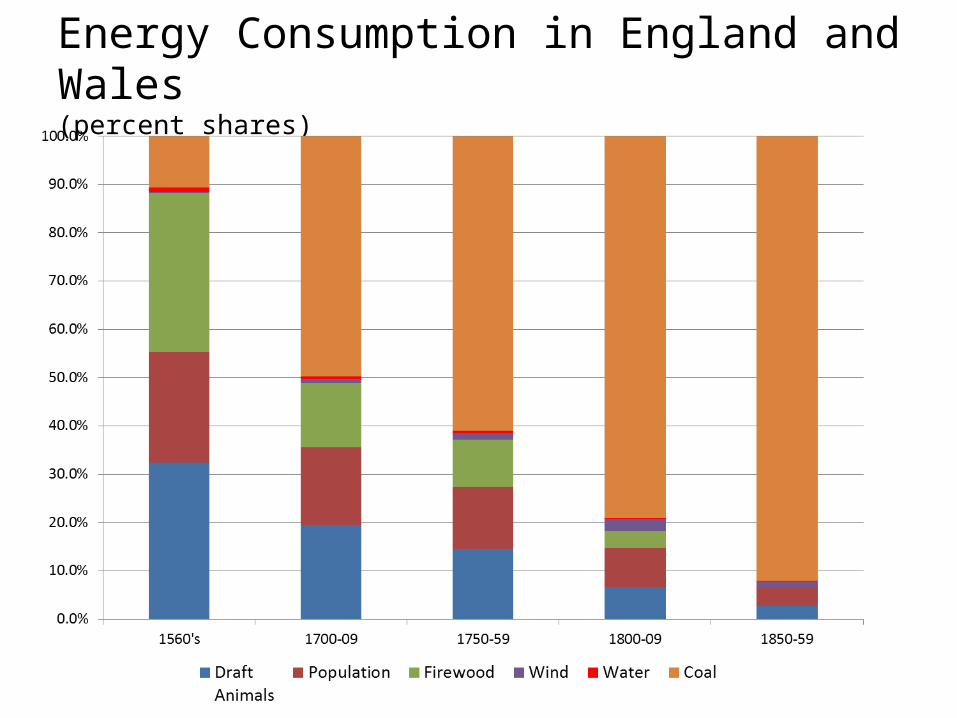
Energy Consumption in England and Wales (percent shares)
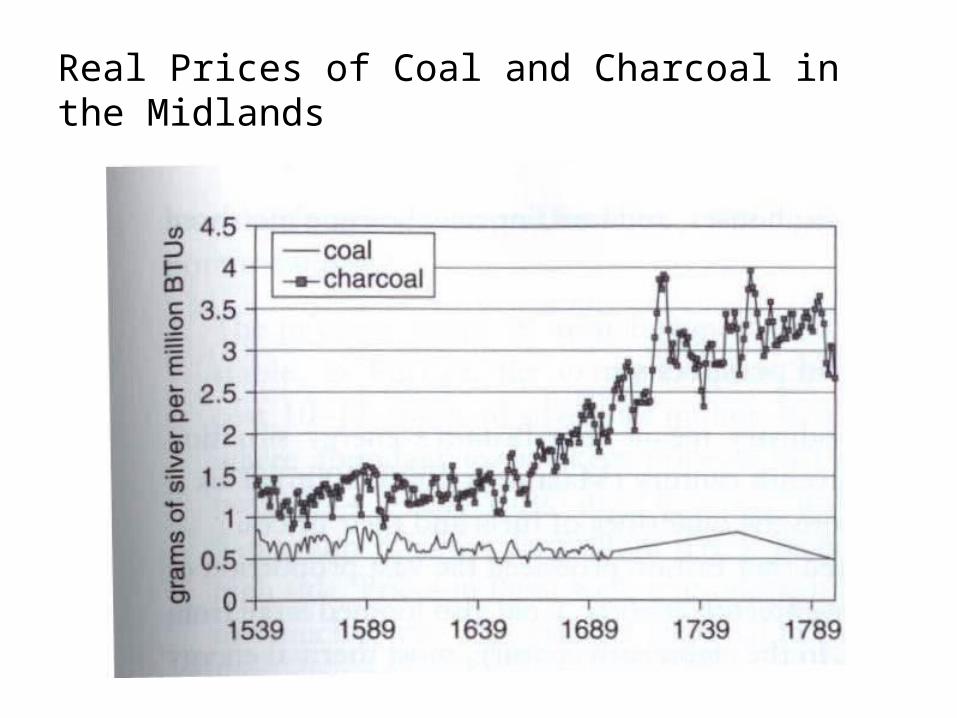
Real Prices of Coal and Charcoal in the Midlands
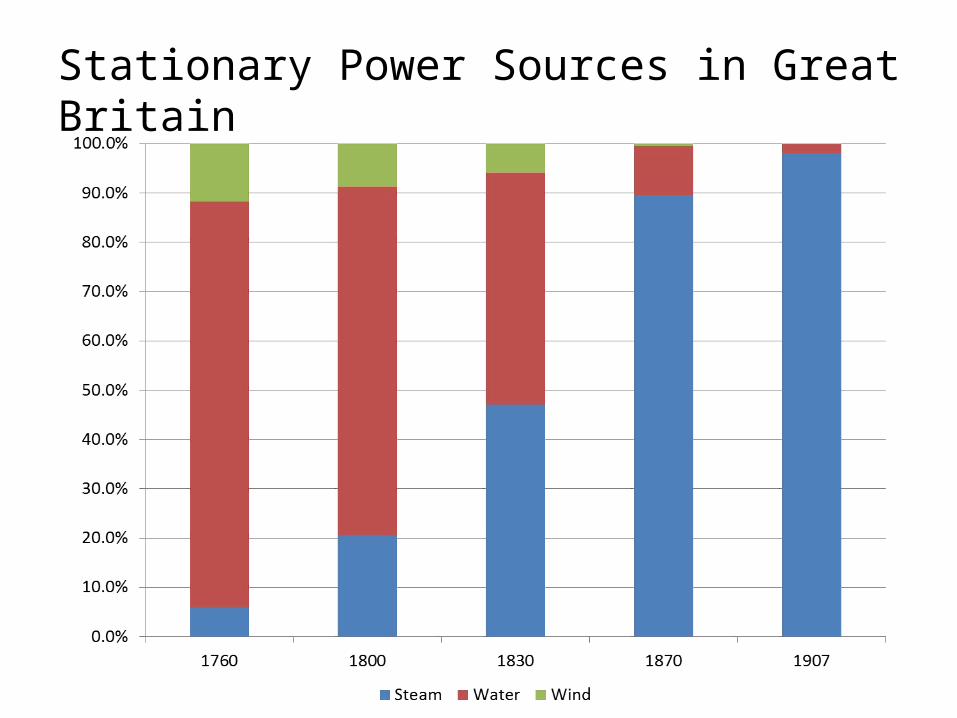
Stationary Power Sources in Great Britain
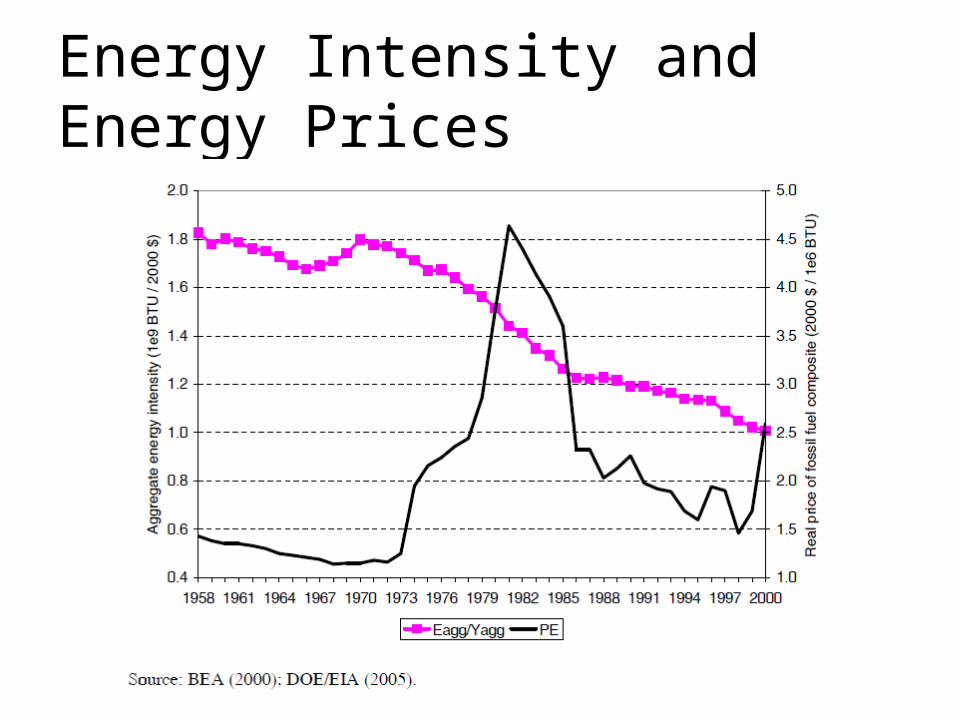
Energy Intensity and Energy Prices
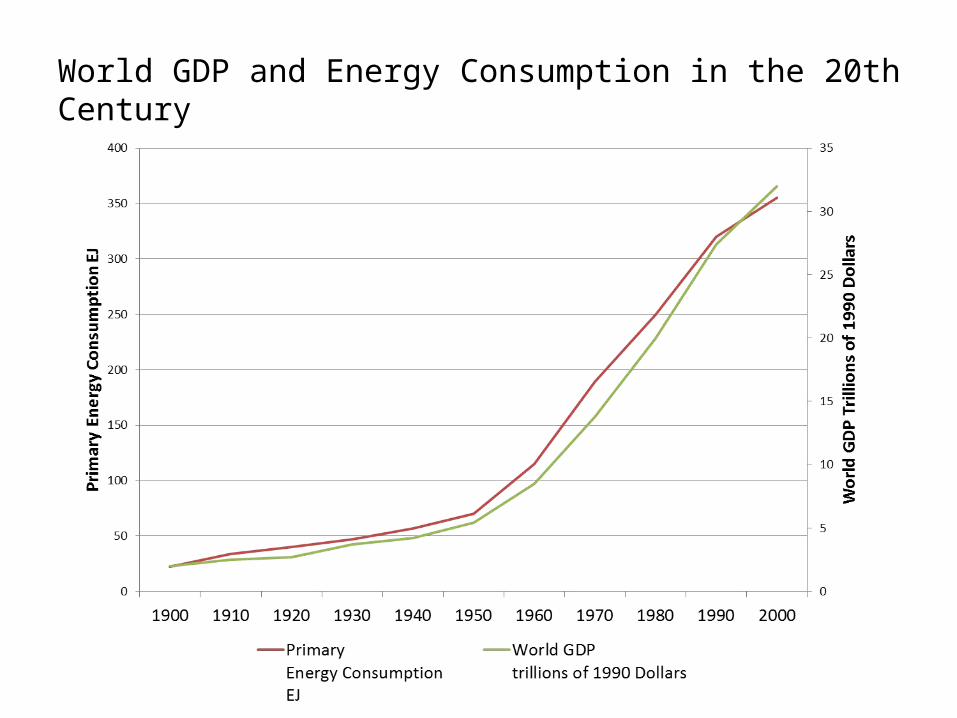
World GDP and Energy Consumption in the 20th Century
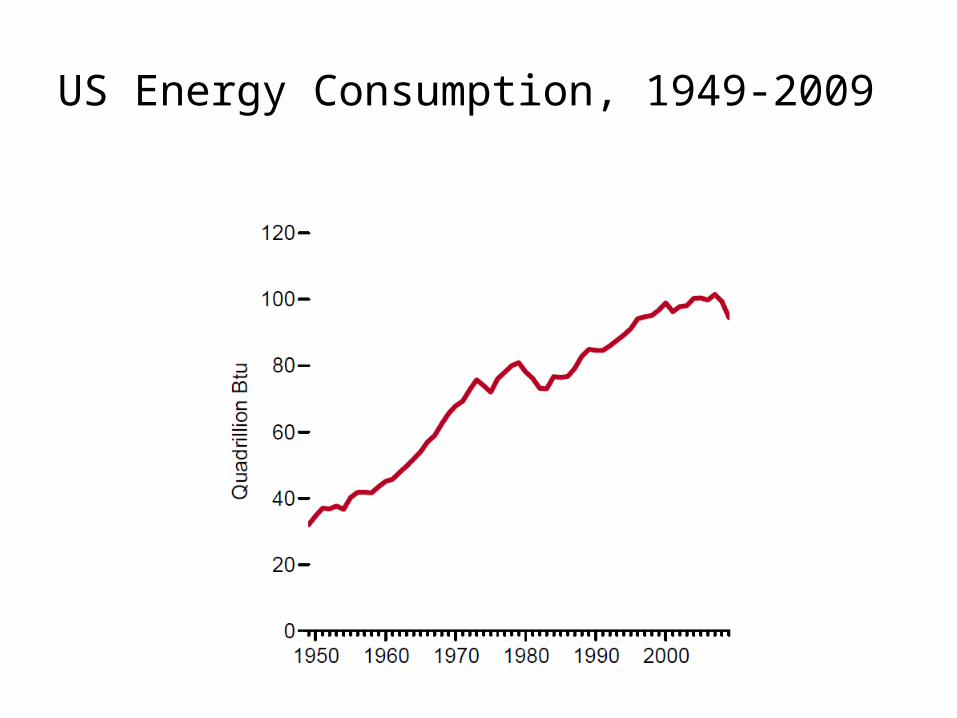
US Energy Consumption, 1949-2009
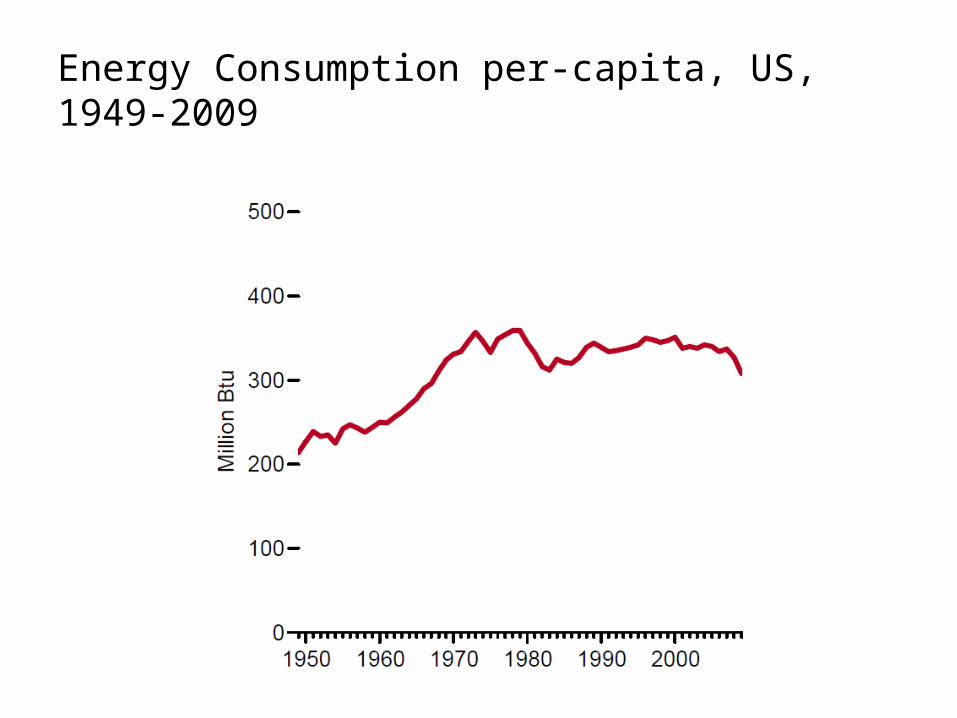
Energy Consumption per-capita, US, 1949-2009
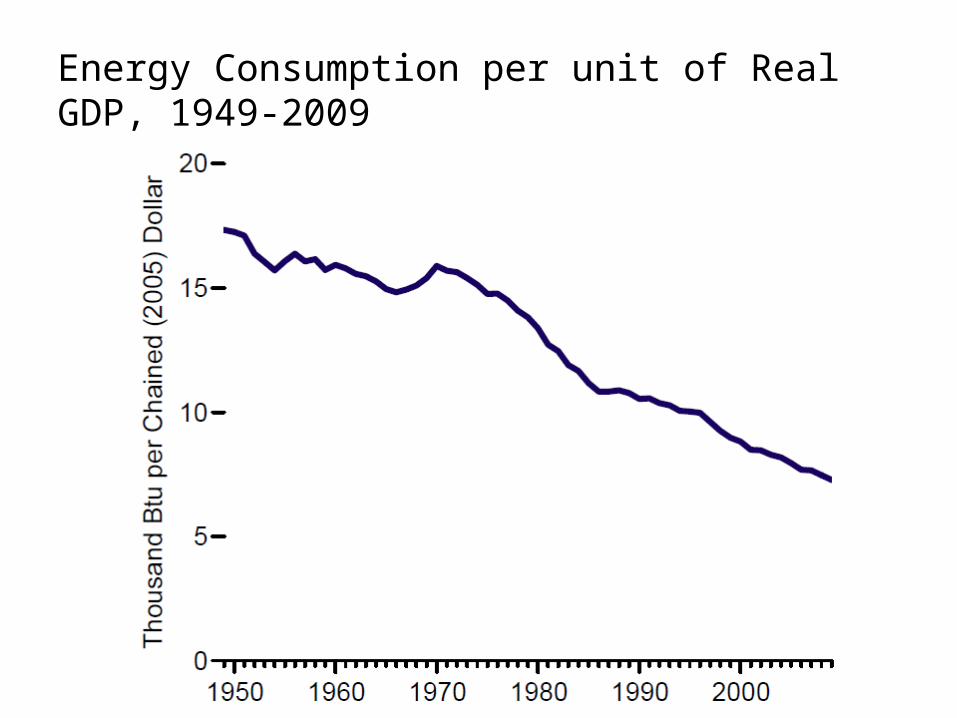
Energy Consumption per unit of Real GDP, 1949-2009
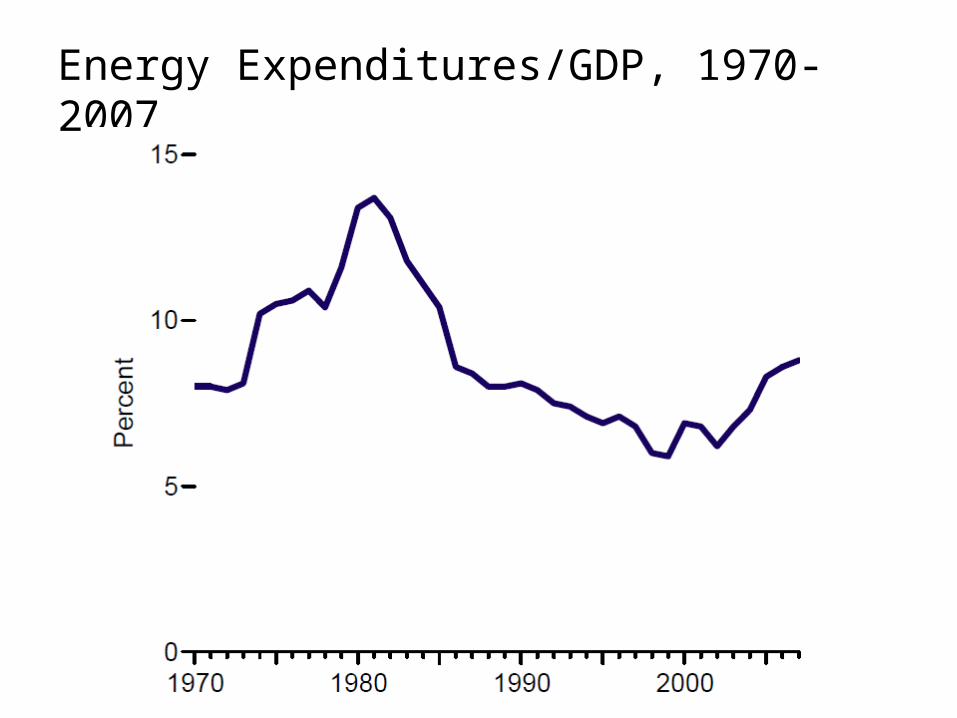
Energy Expenditures/GDP, 1970-2007
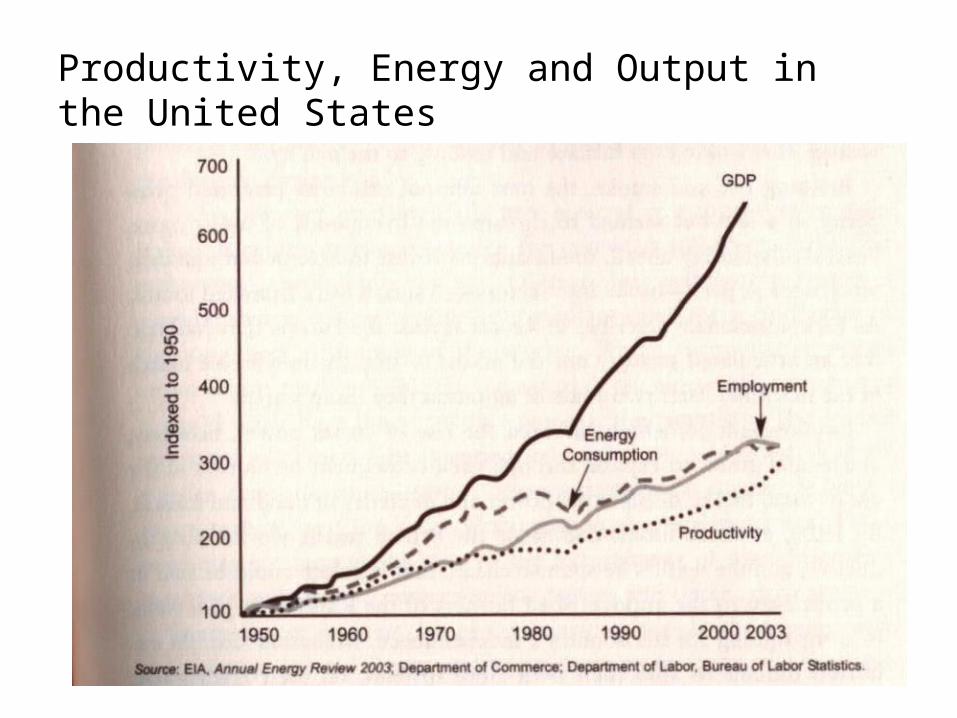
Productivity, Energy and Output in the United States
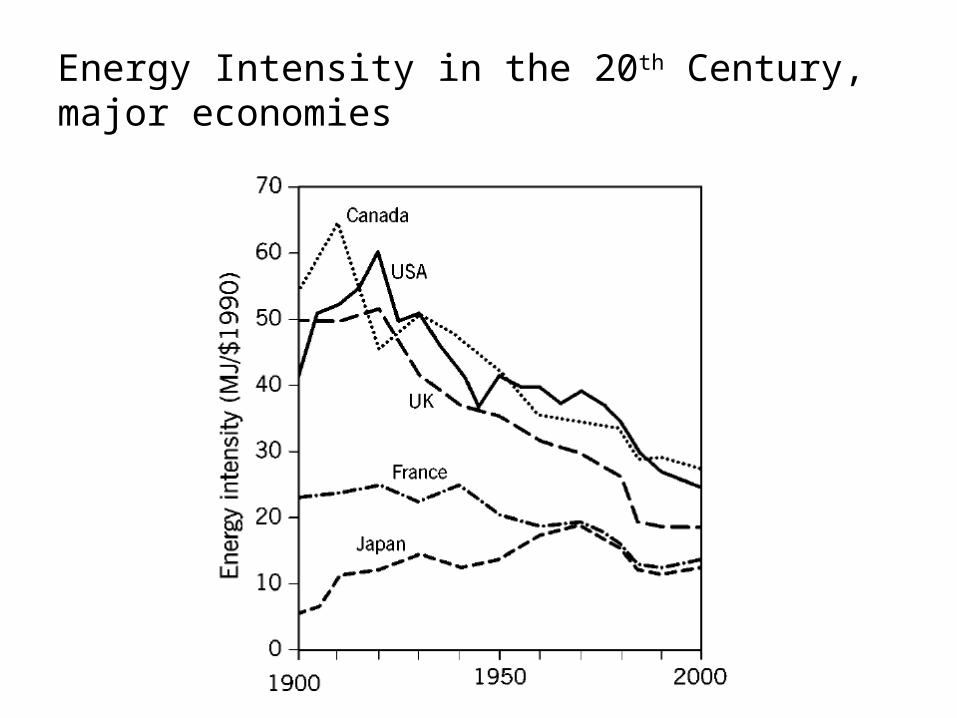
Energy Intensity in the 20th Century, major economies
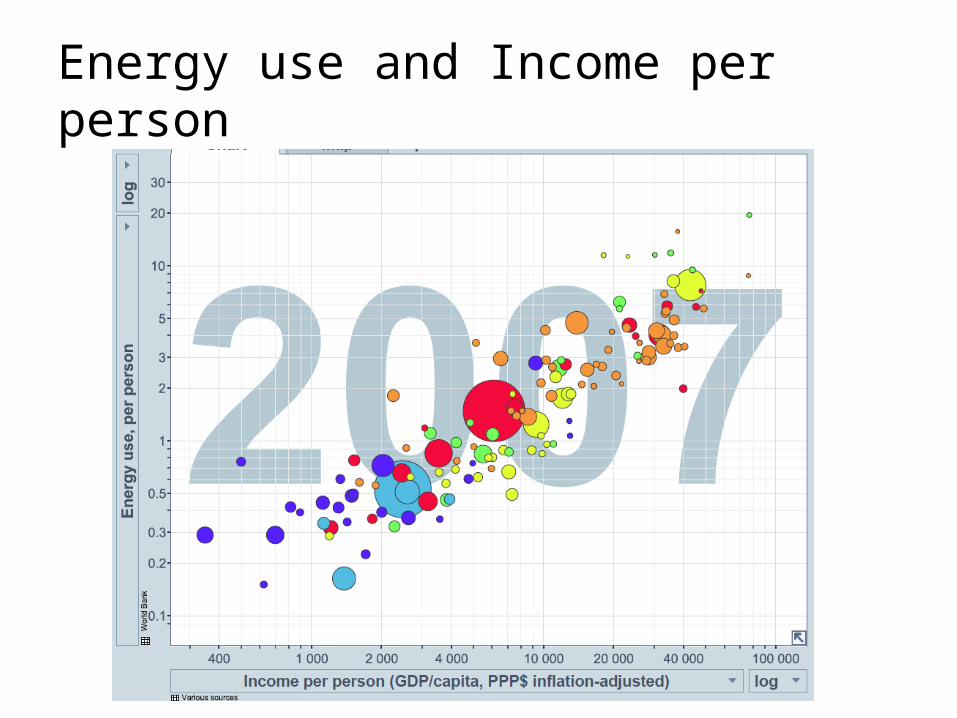
Energy use and Income per person
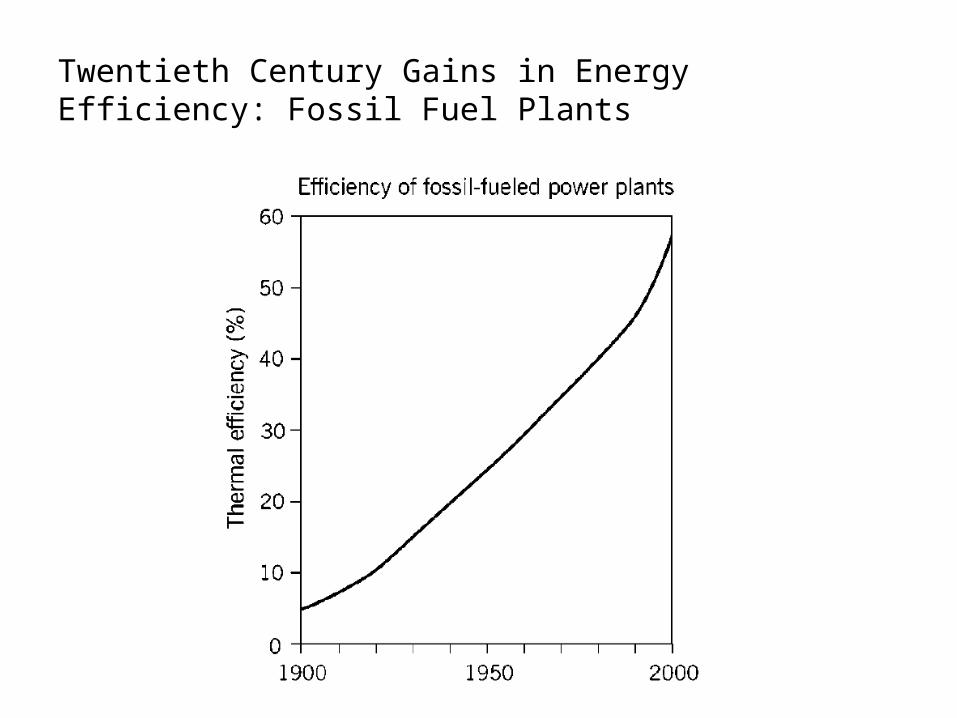
Twentieth Century Gains in Energy Efficiency: Fossil Fuel Plants
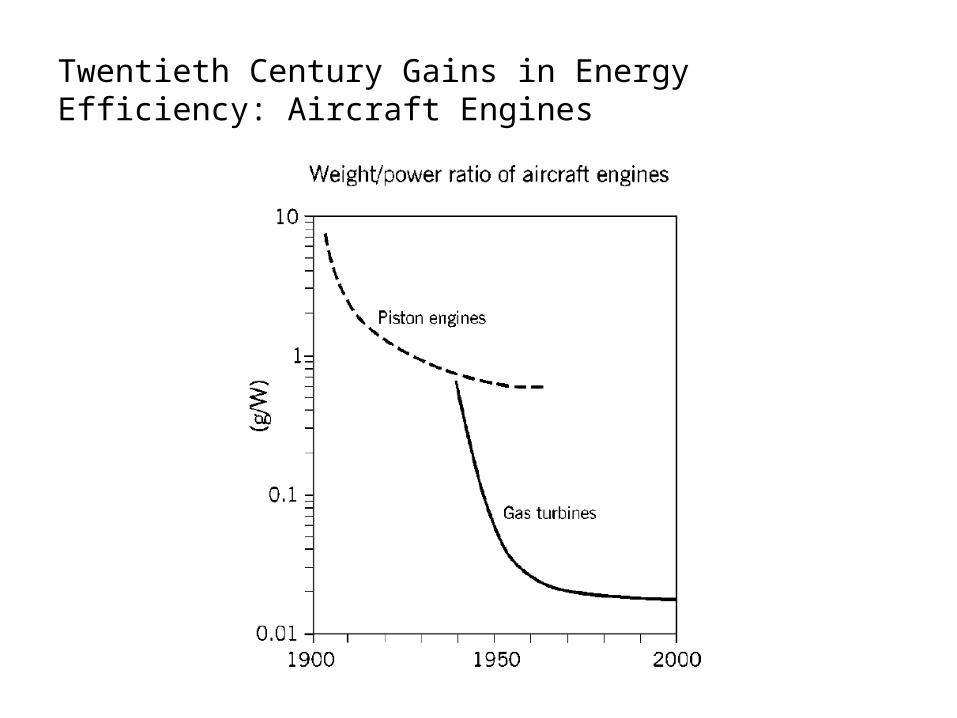
Twentieth Century Gains in Energy Efficiency: Aircraft Engines
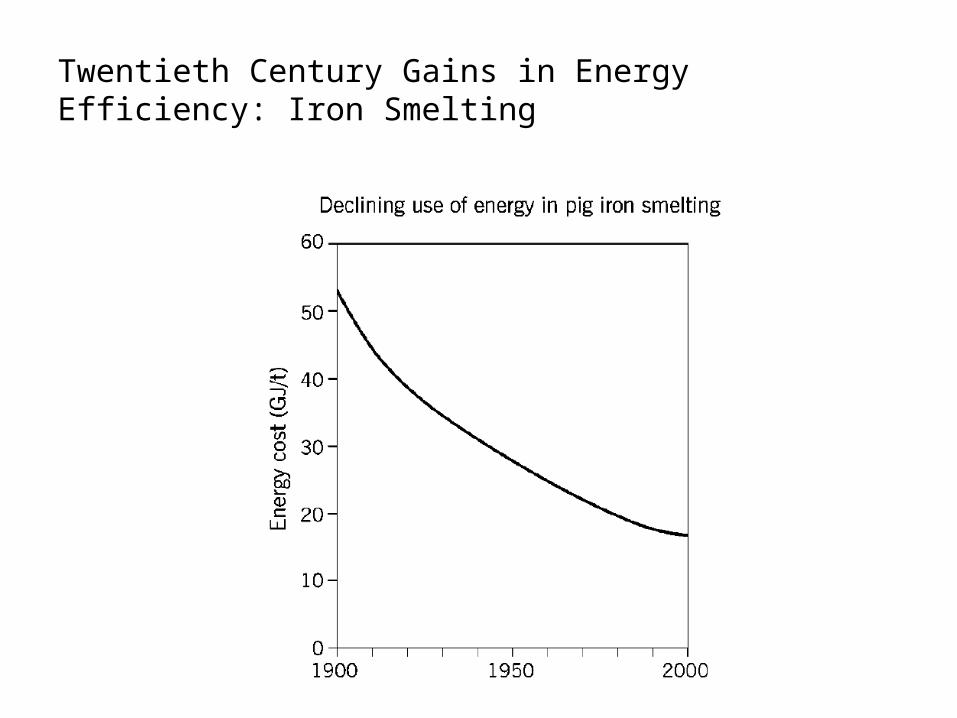
Twentieth Century Gains in Energy Efficiency: Iron Smelting
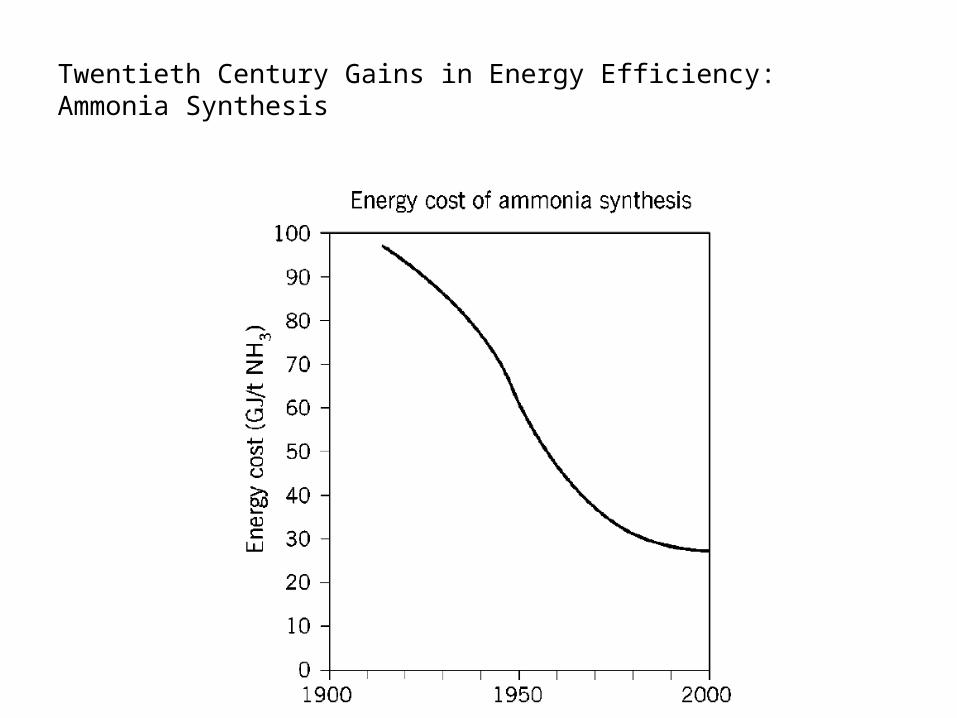
Twentieth Century Gains in Energy Efficiency: Ammonia Synthesis
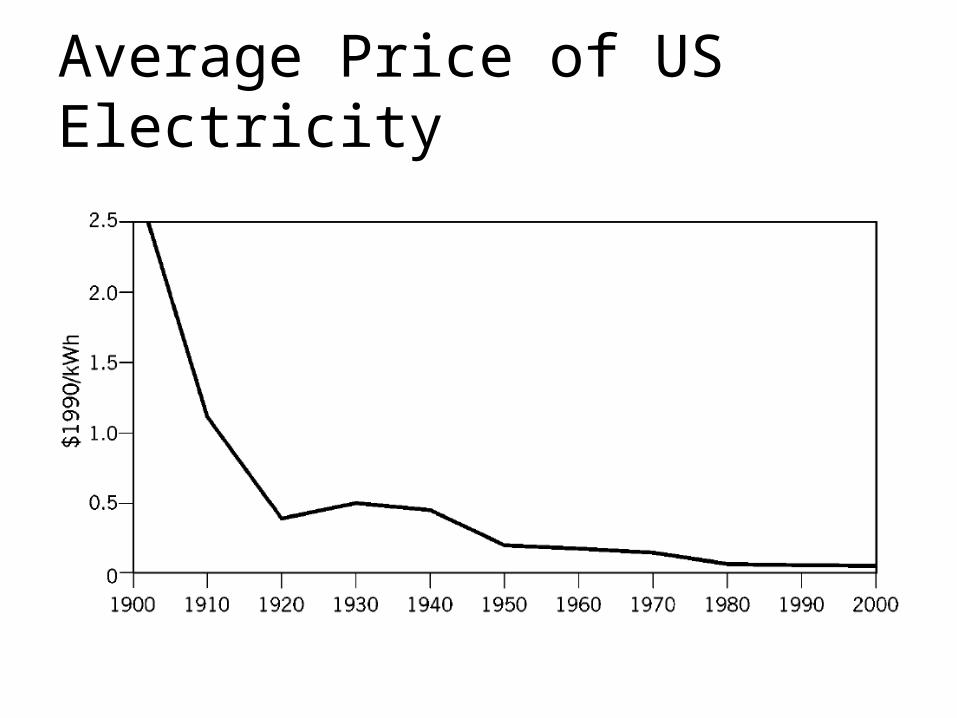
Average Price of US Electricity
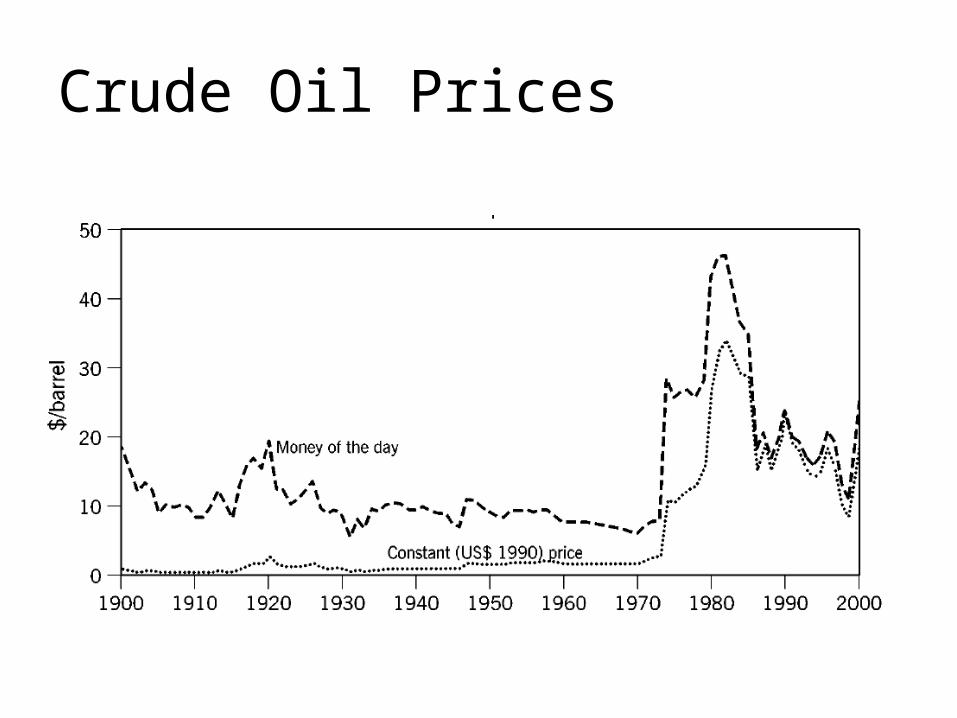
Crude Oil Prices
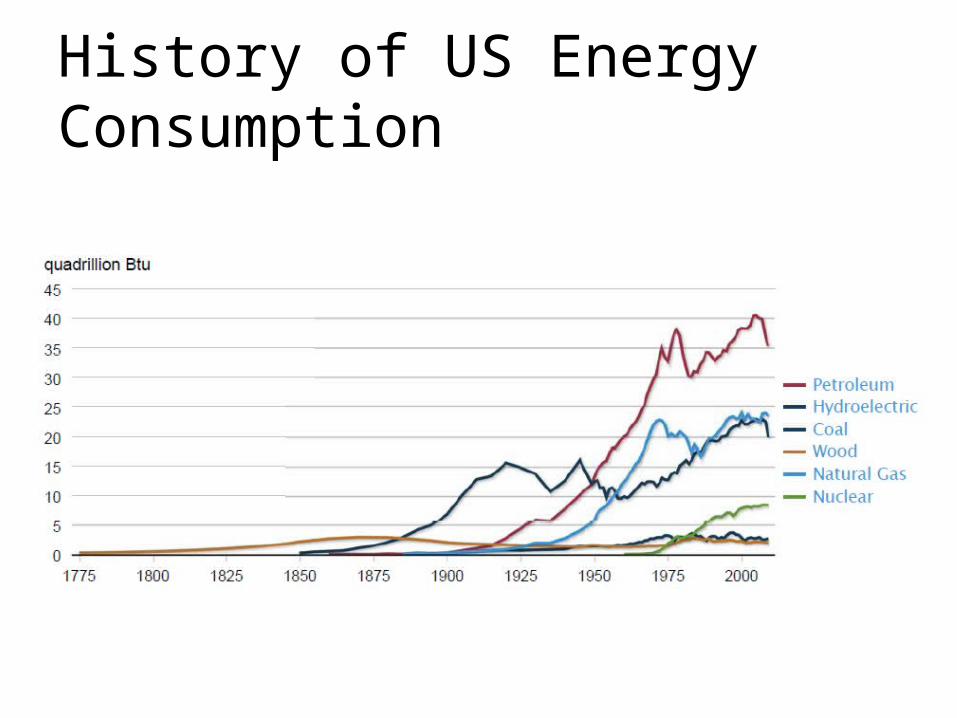
History of US Energy Consumption
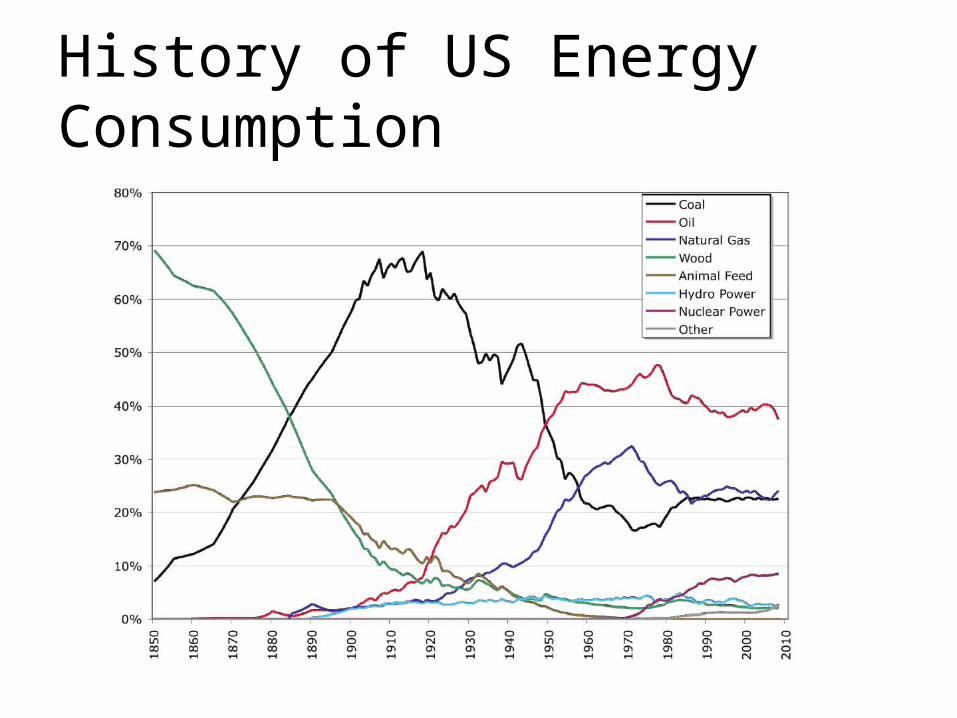
History of US Energy Consumption
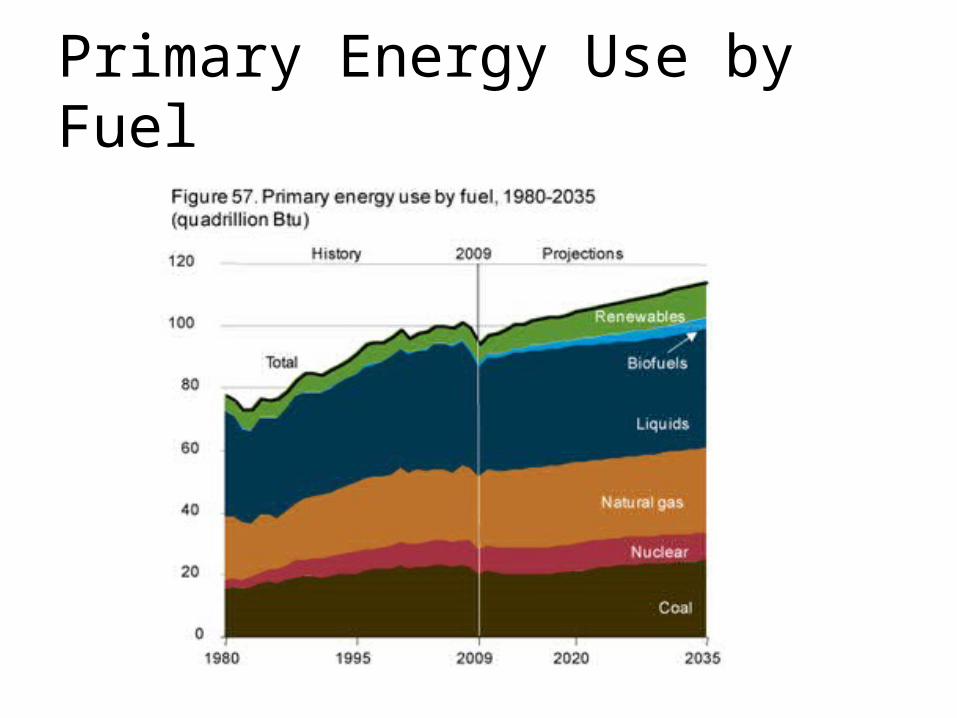
Primary Energy Use by Fuel
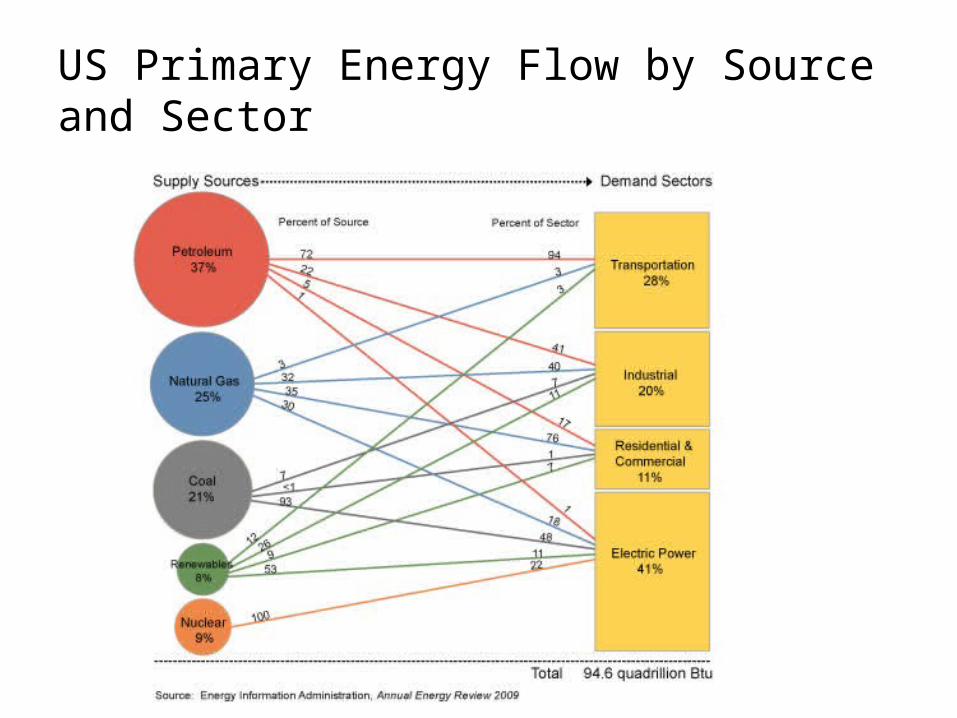
US Primary Energy Flow by Source and Sector
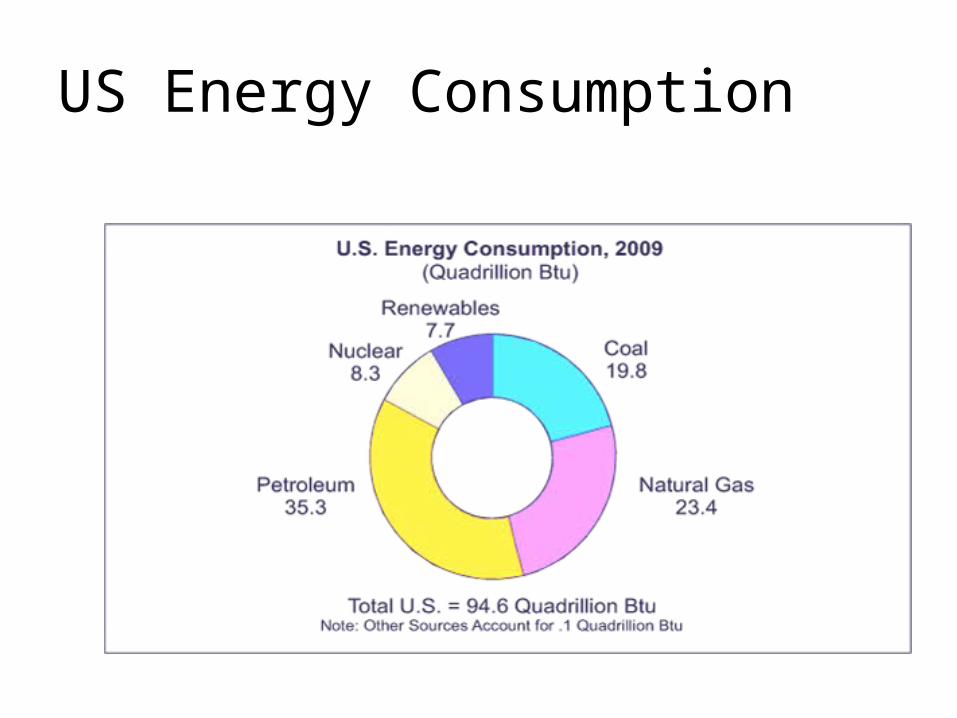
US Energy Consumption
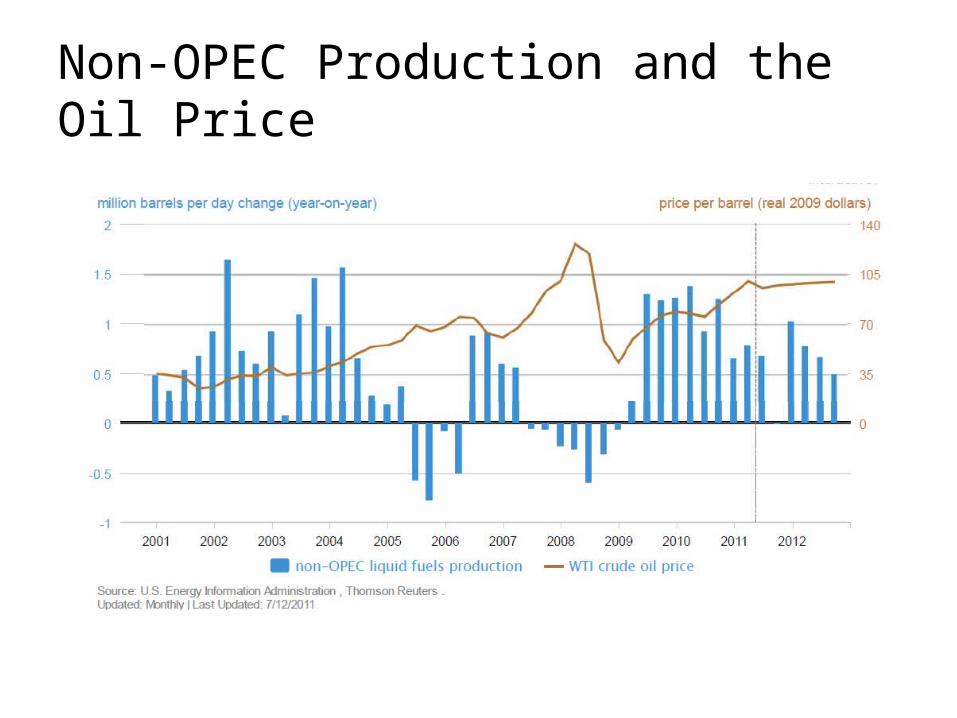
Non-OPEC Production and the Oil Price
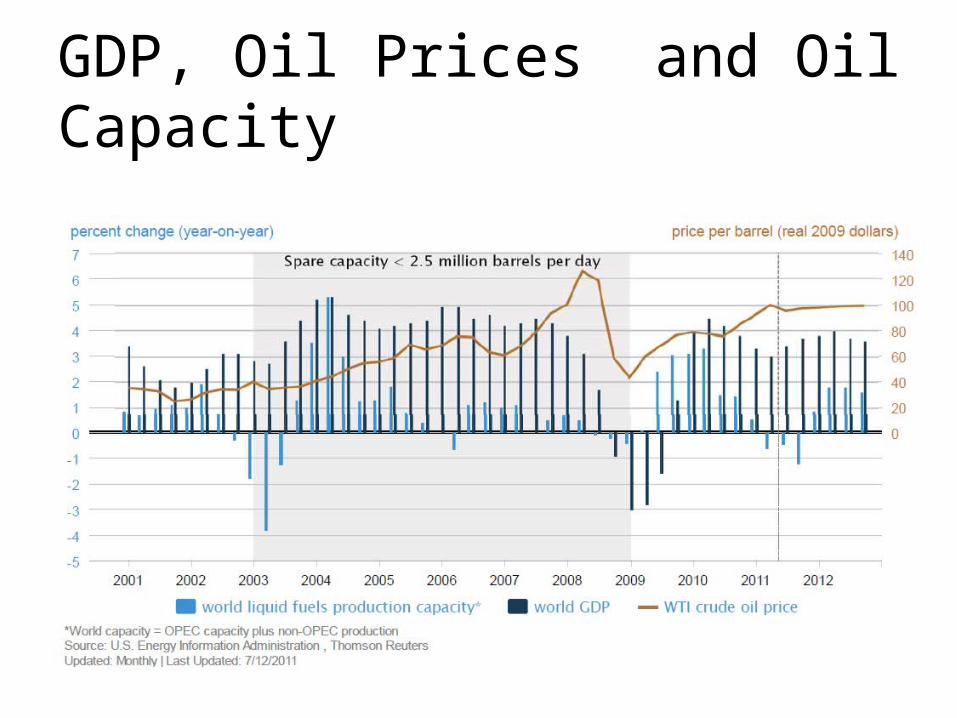
GDP, Oil Prices and Oil Capacity
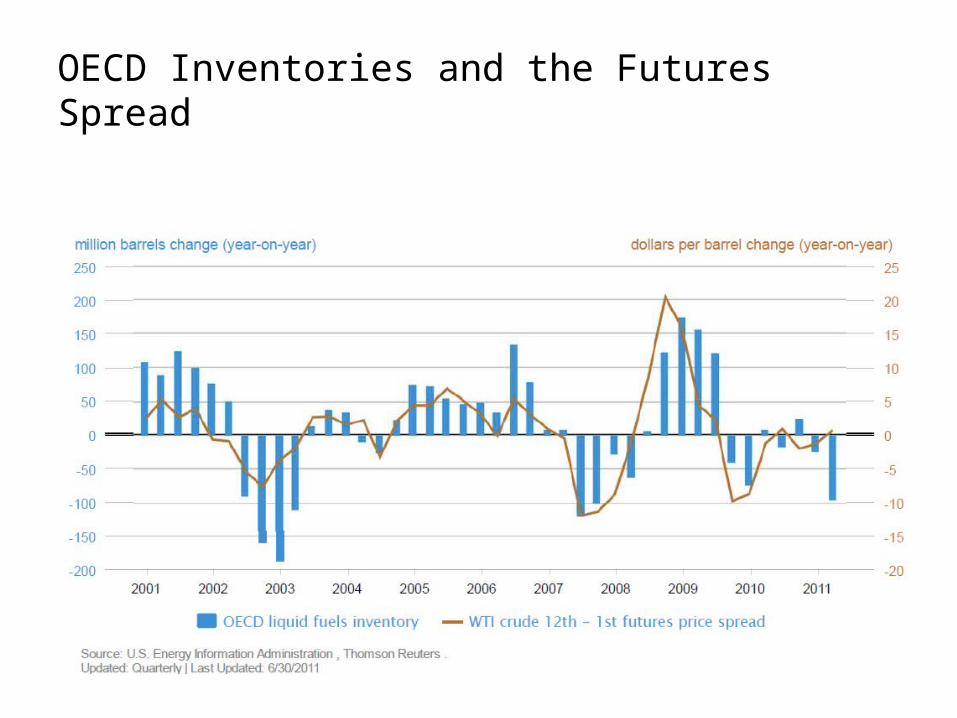
OECD Inventories and the Futures Spread
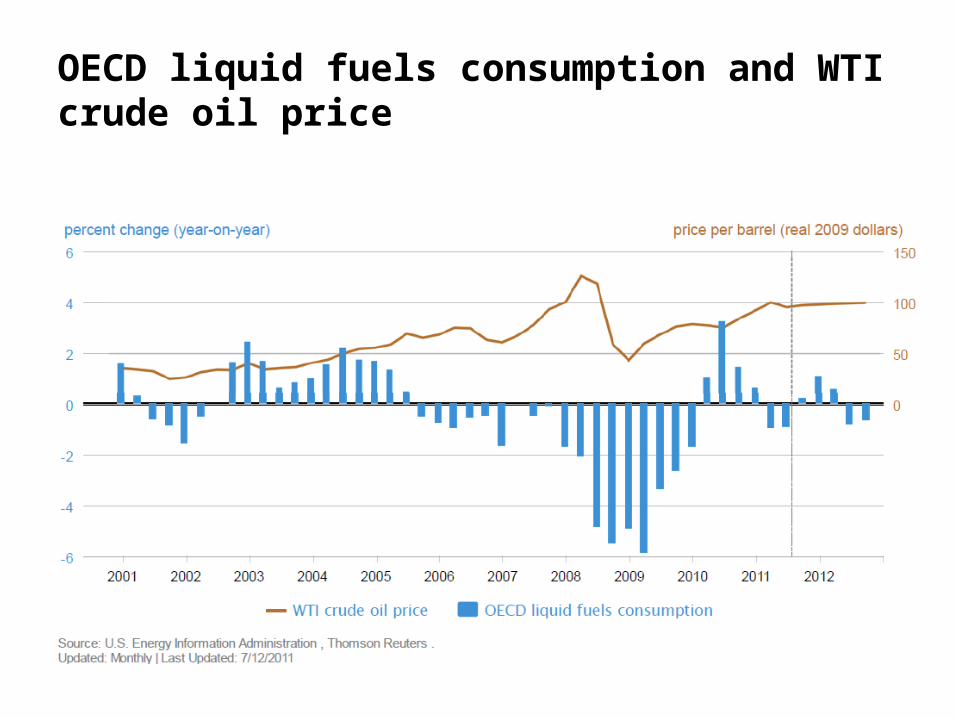
OECD liquid fuels consumption and WTI crude oil price
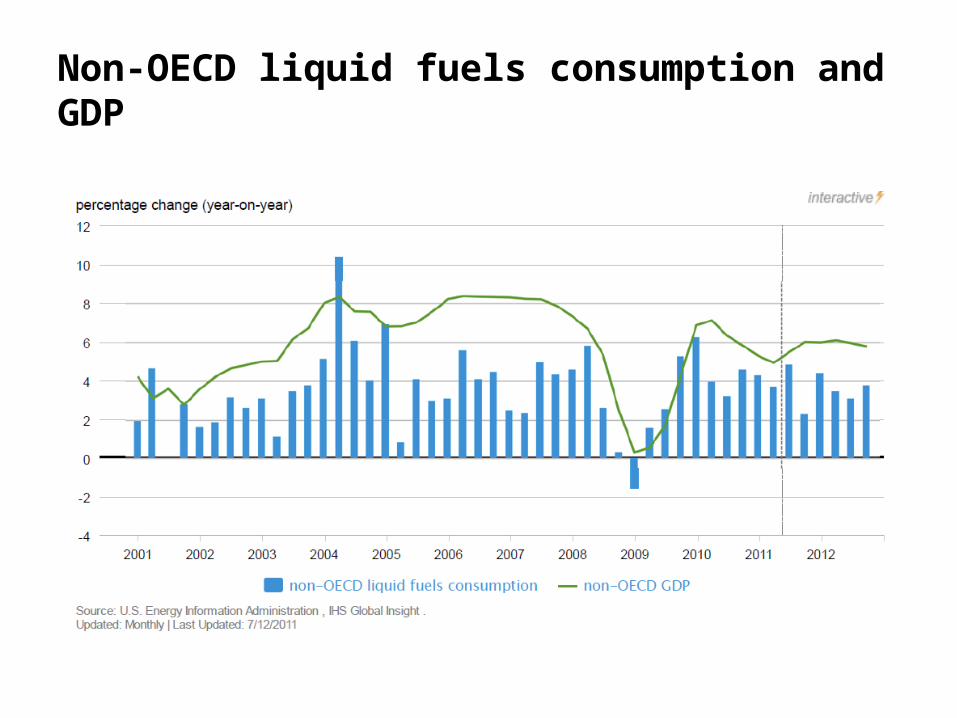
Non-OECD liquid fuels consumption and GDP
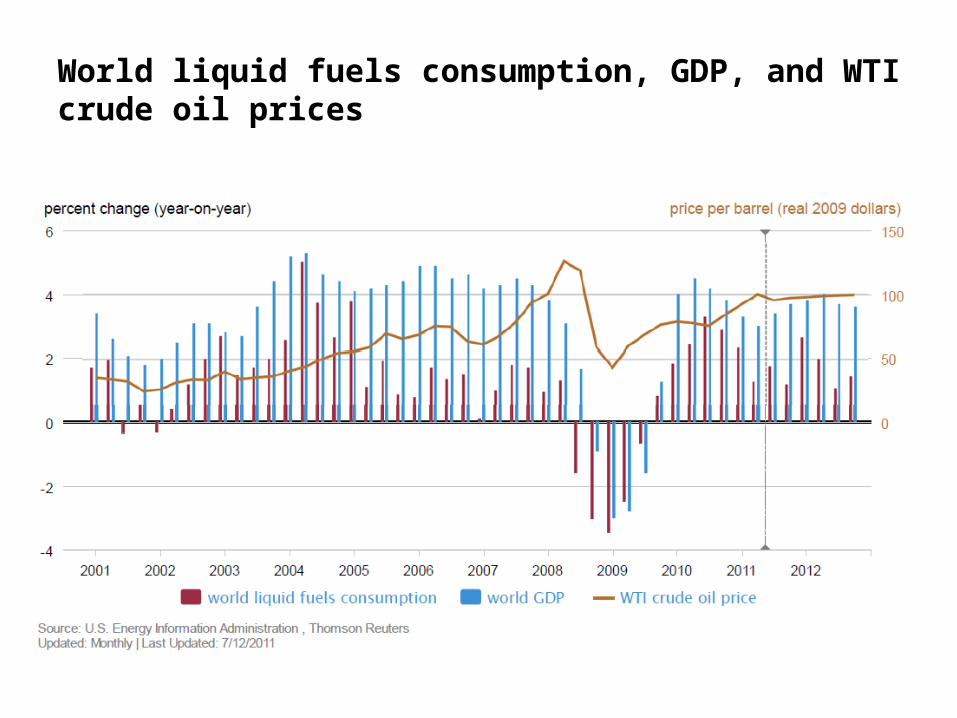
World liquid fuels consumption, GDP, and WTI crude oil prices
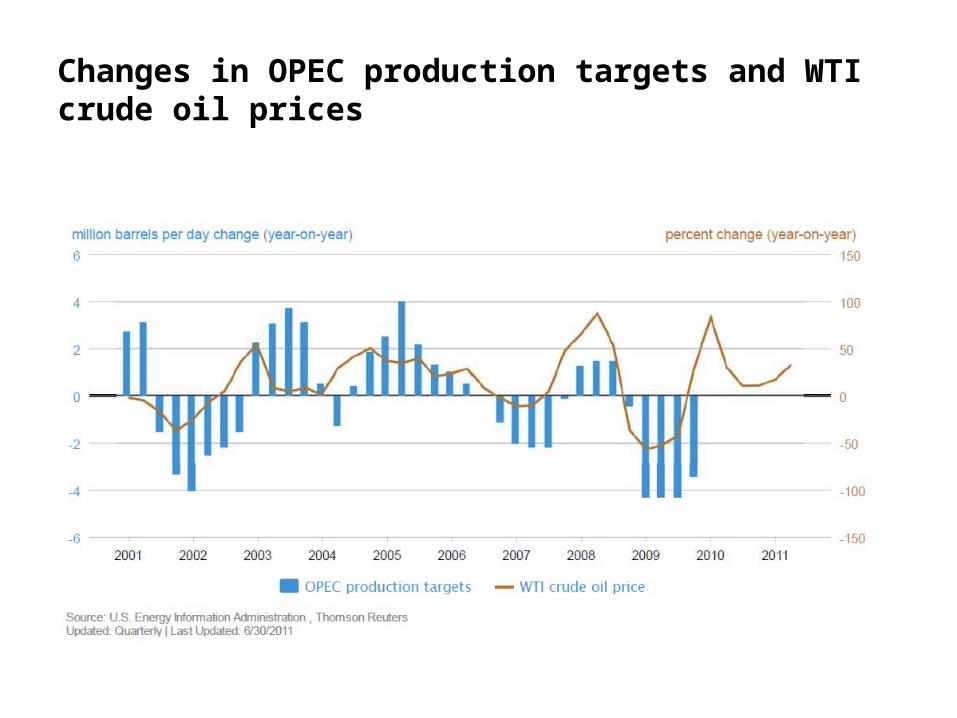
Changes in OPEC production targets and WTI crude oil prices
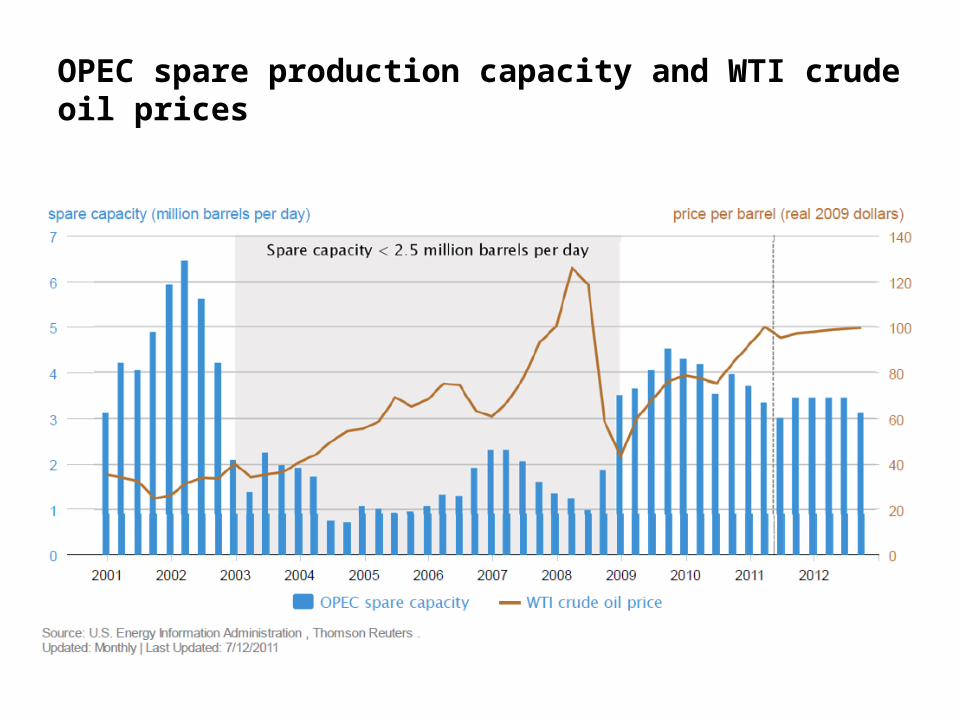
OPEC spare production capacity and WTI crude oil prices
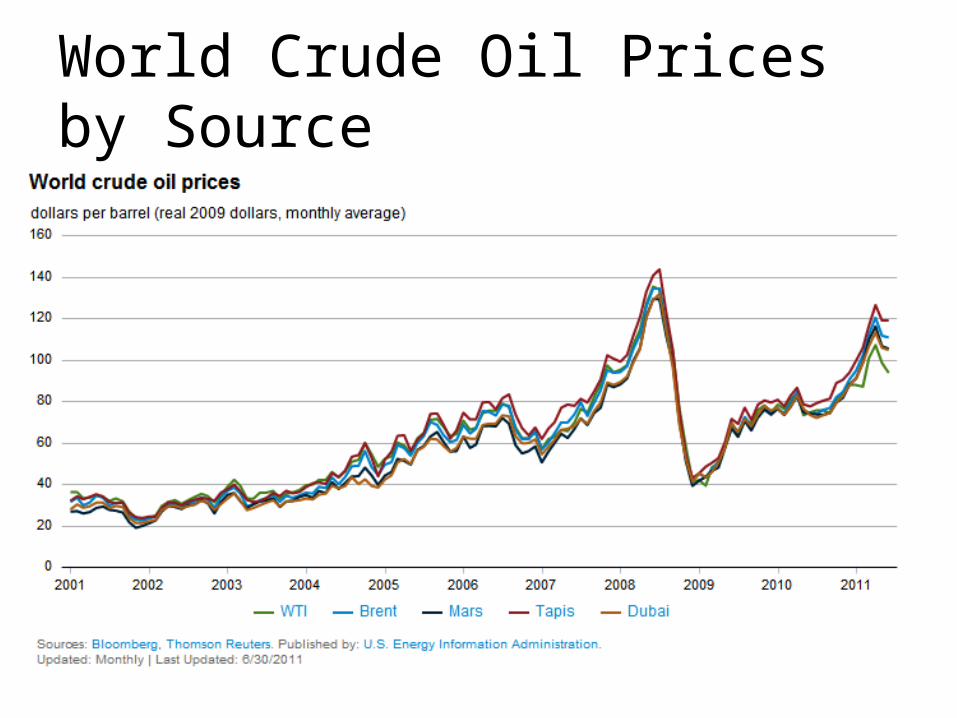
World Crude Oil Prices by Source
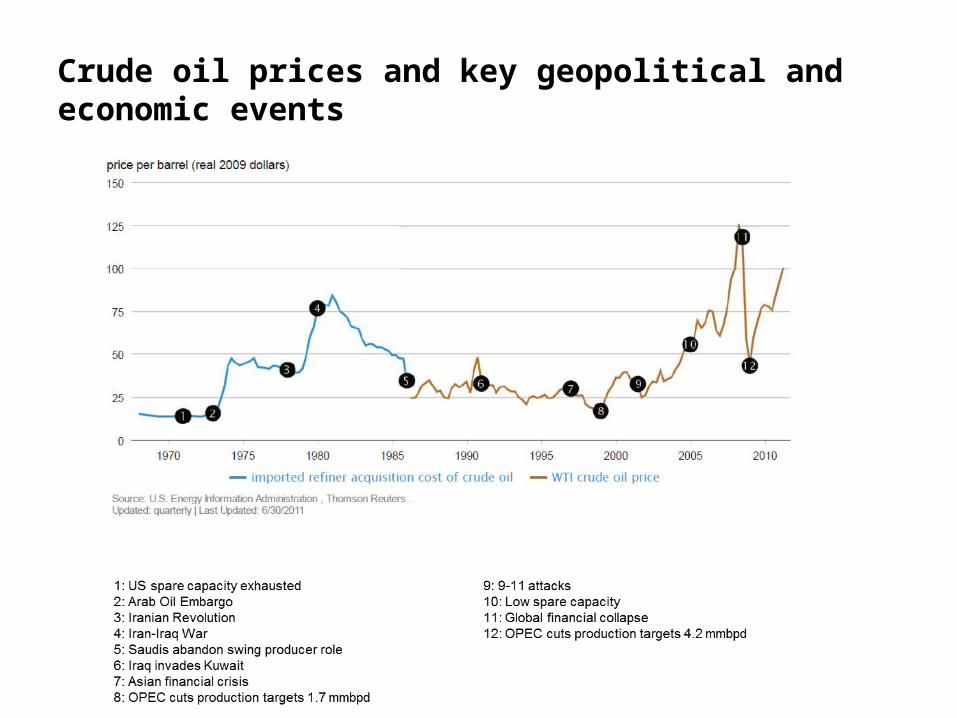
Crude oil prices and key geopolitical and economic events
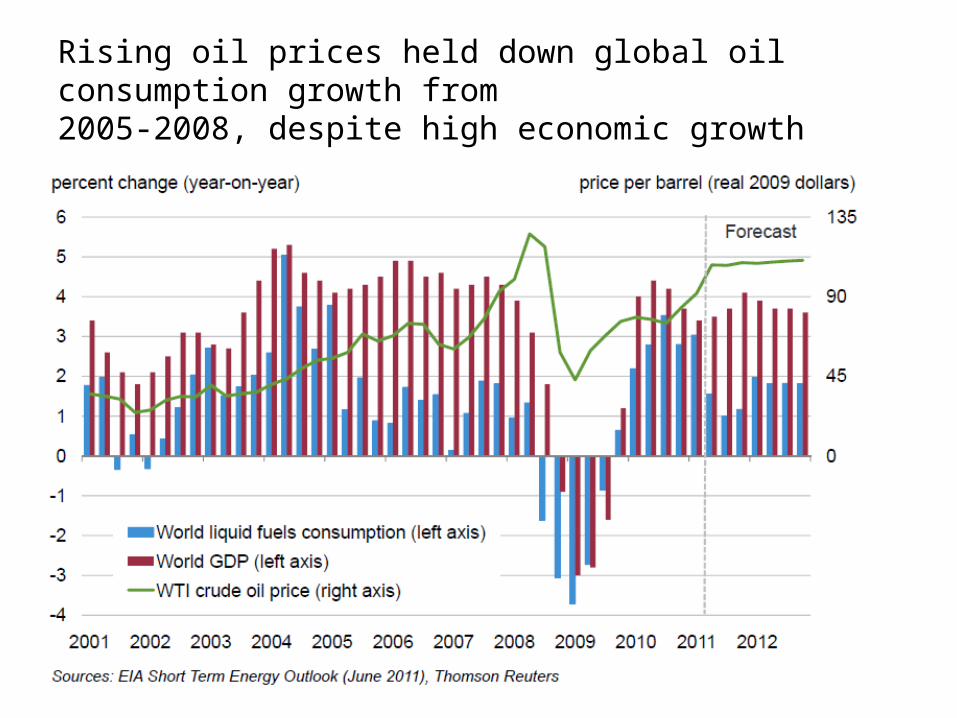
Rising oil prices held down global oil consumption growth from2005-2008, despite high economic growth
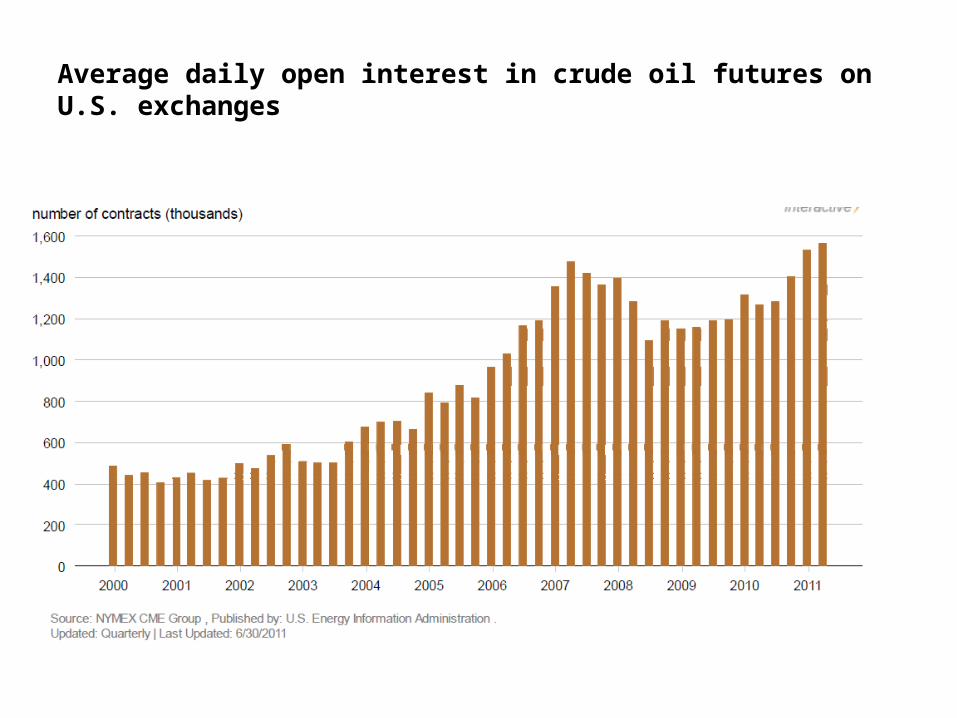
Average daily open interest in crude oil futures on U.S. exchanges
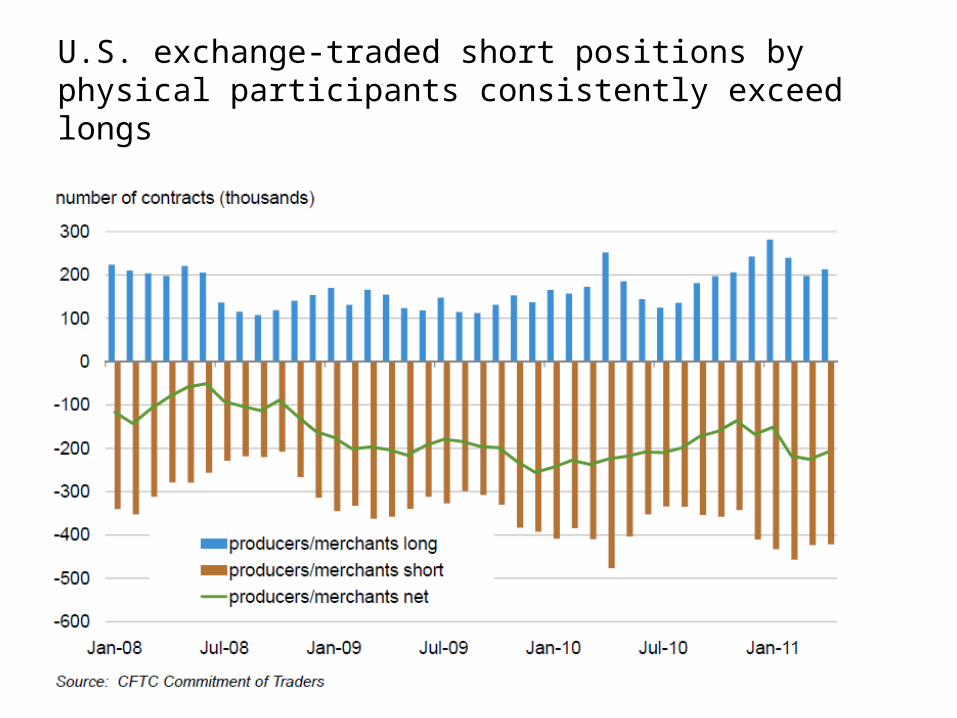
U.S. exchange-traded short positions by physical participants consistently exceed longs
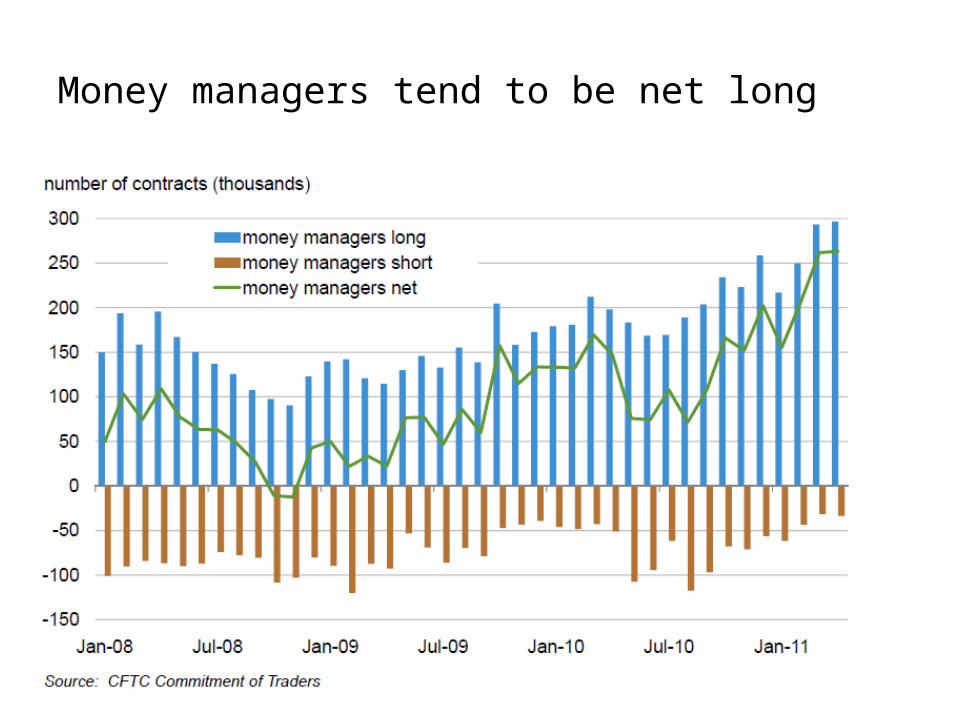
Money managers tend to be net long
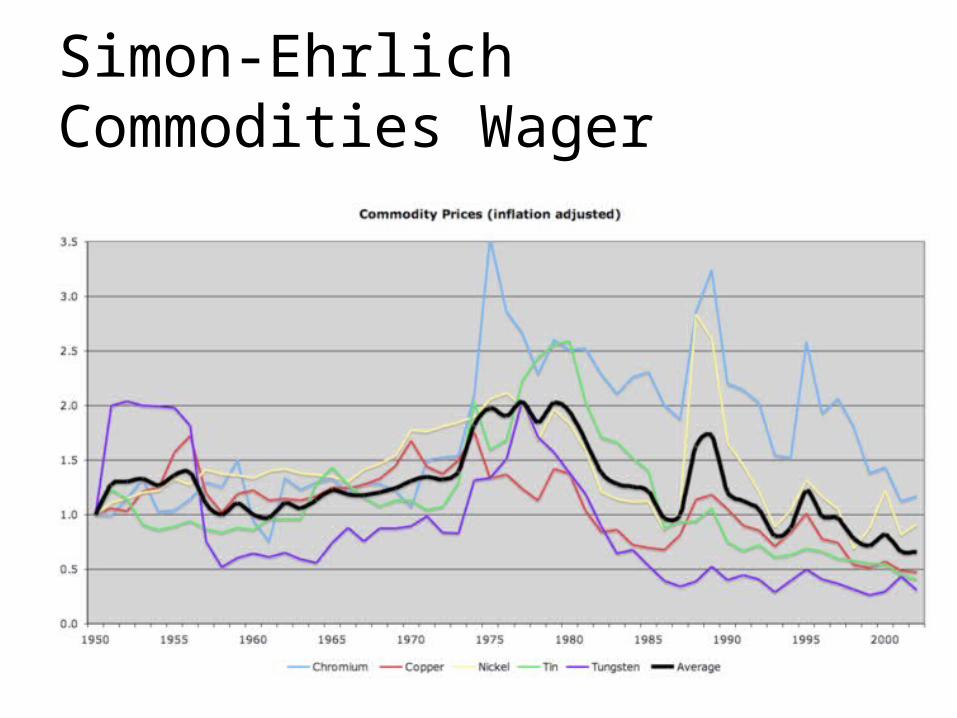
Simon-Ehrlich Commodities Wager

Simon-Ehrlich Wager for the Century
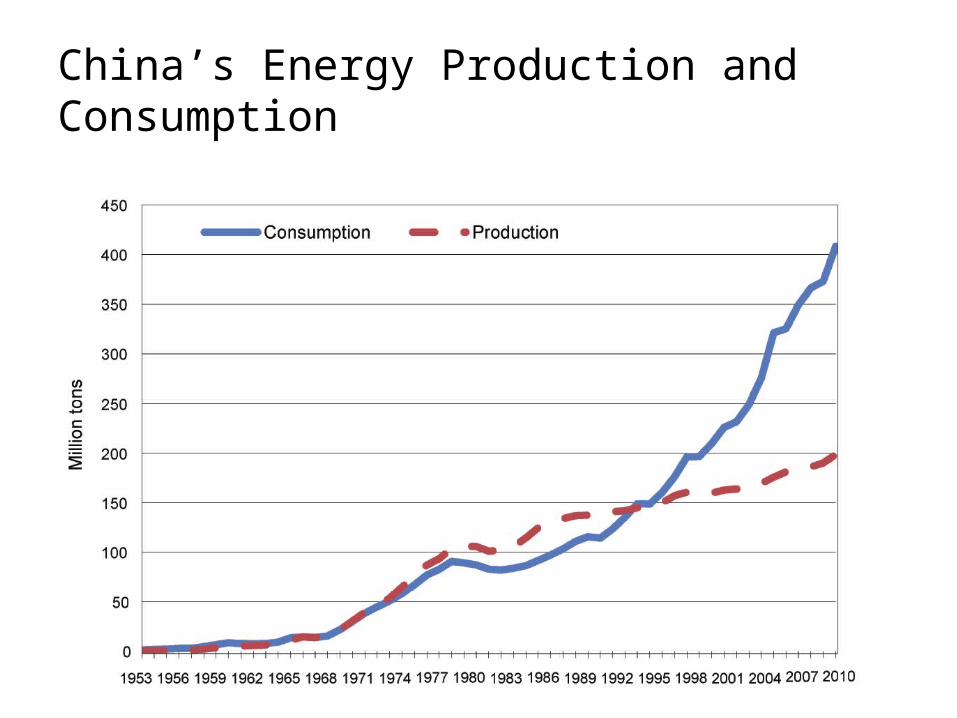
China’s Energy Production and Consumption
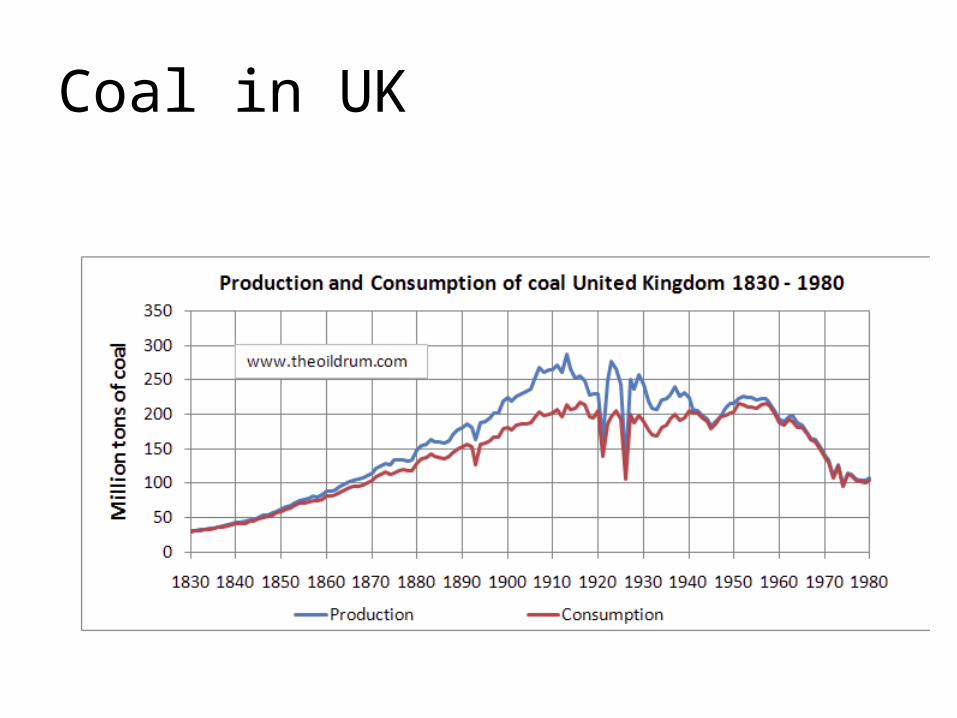
Coal in UK
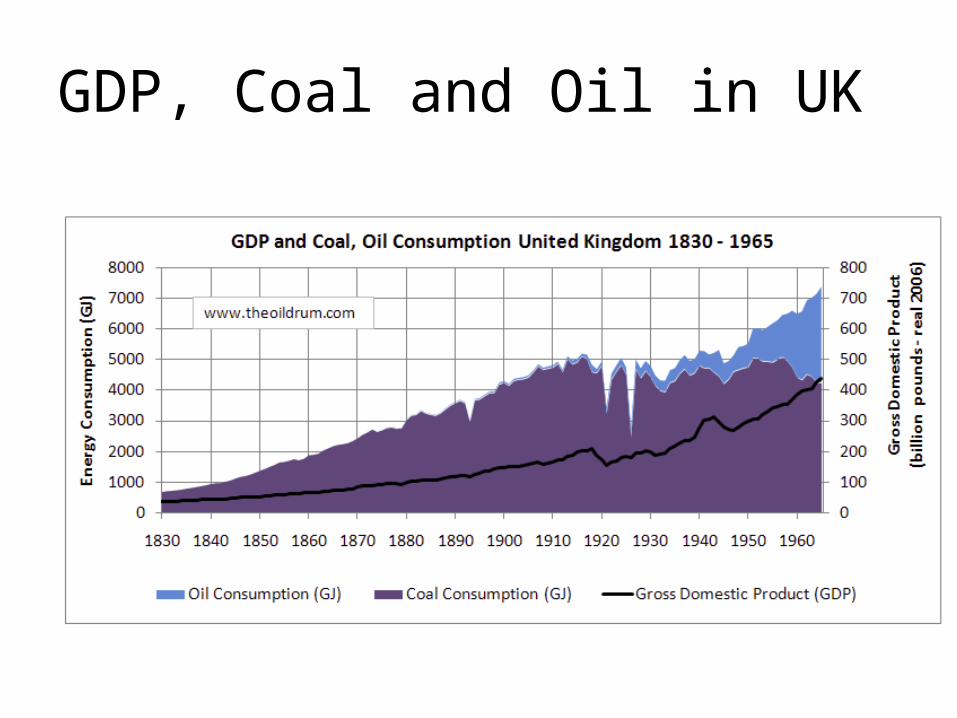
GDP, Coal and Oil in UK
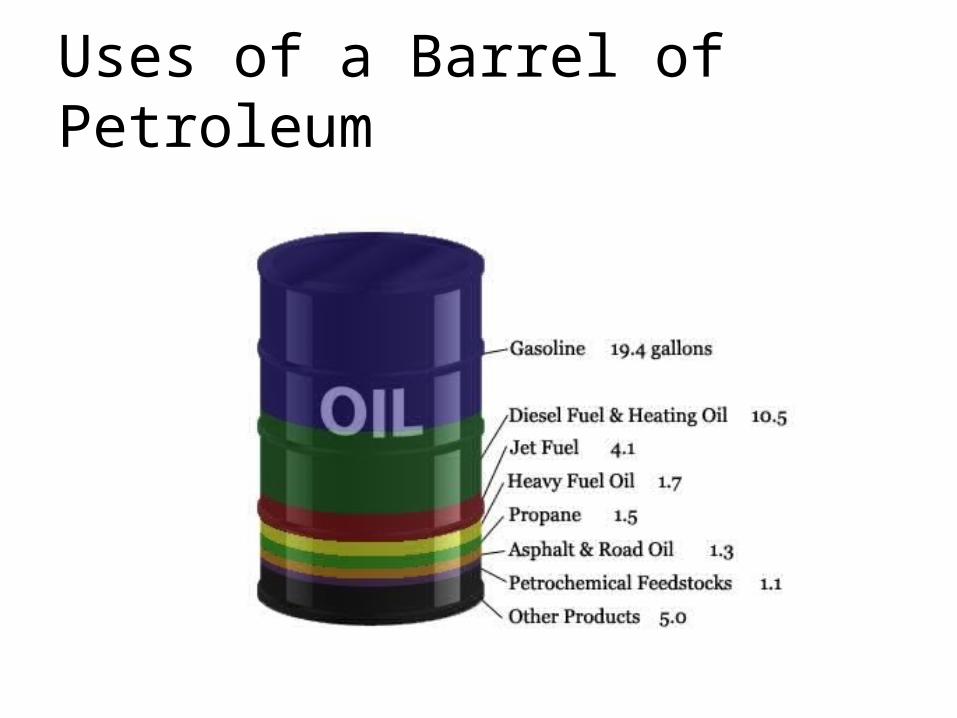
Uses of a Barrel of Petroleum
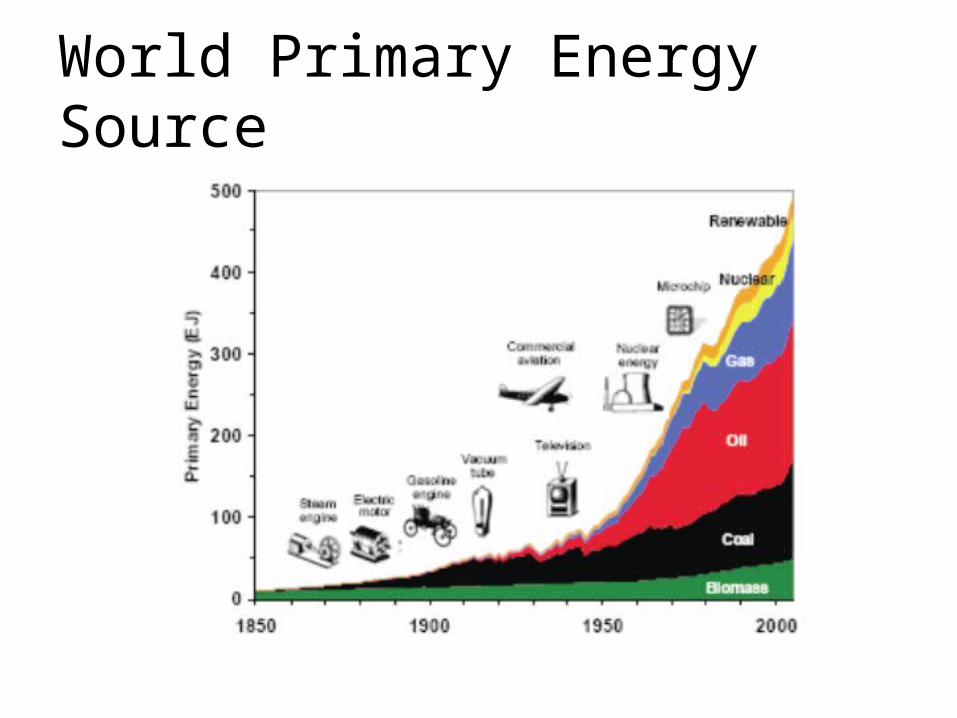
World Primary Energy Source
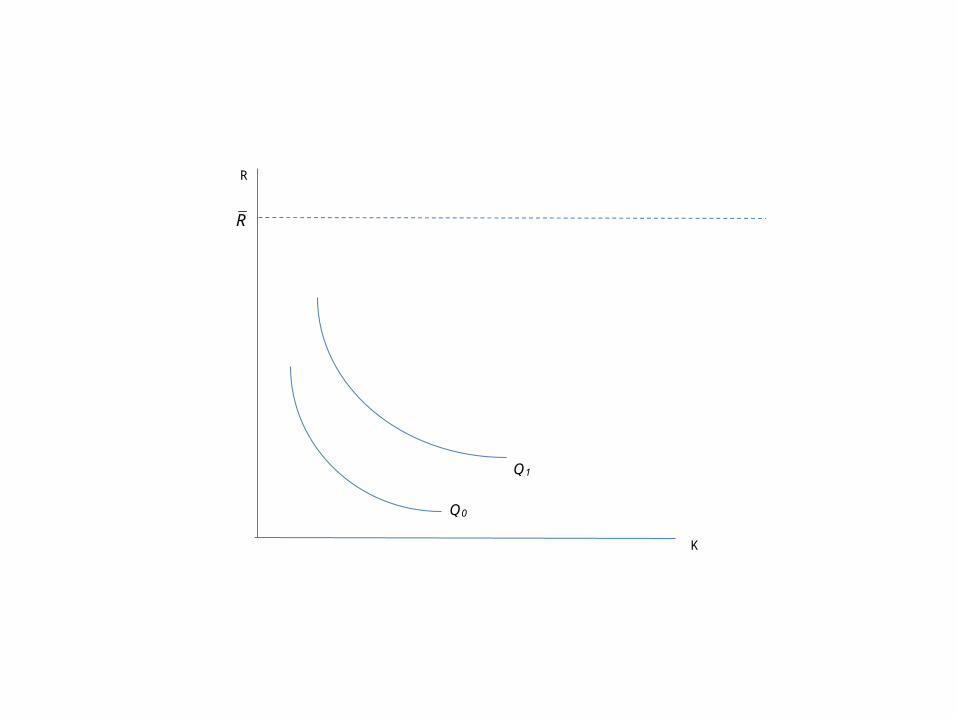
R
Q1
Q0
K
R
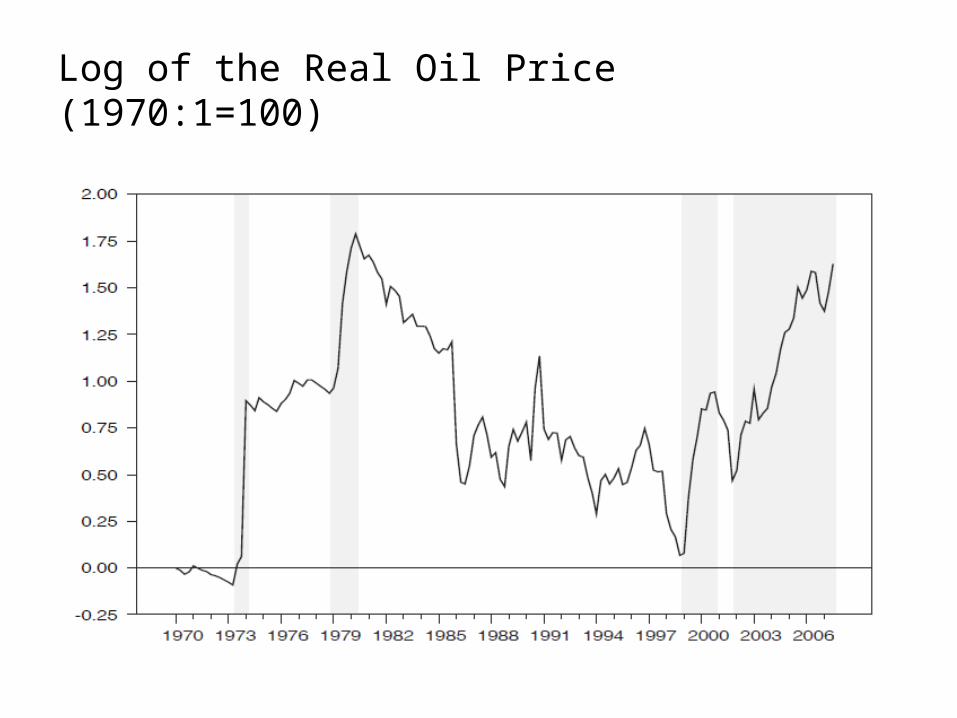
Log of the Real Oil Price (1970:1=100)
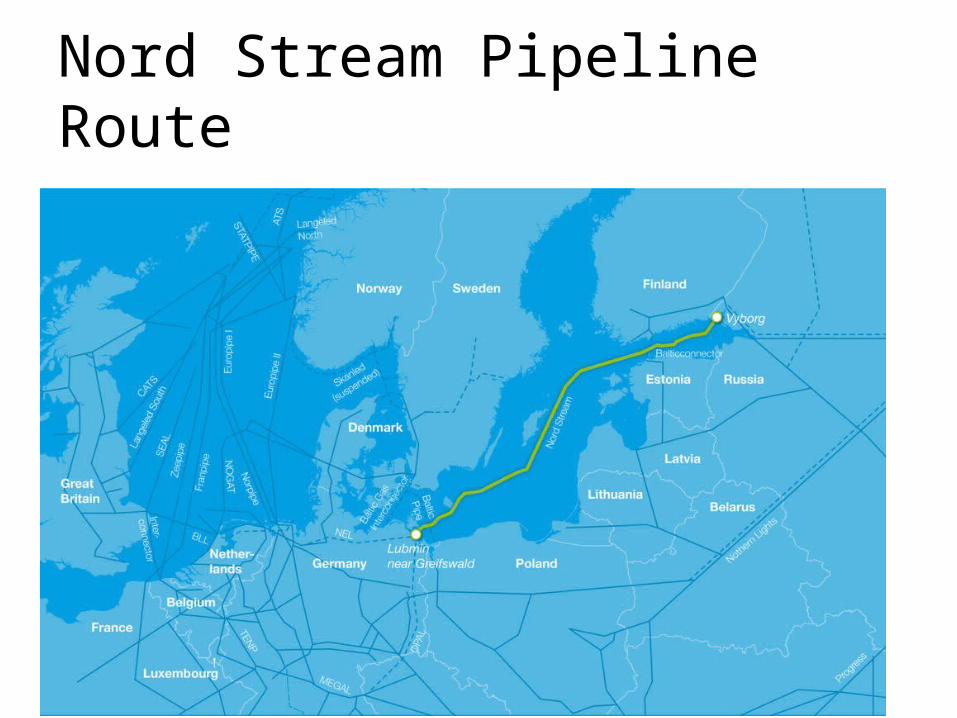
Nord Stream Pipeline Route
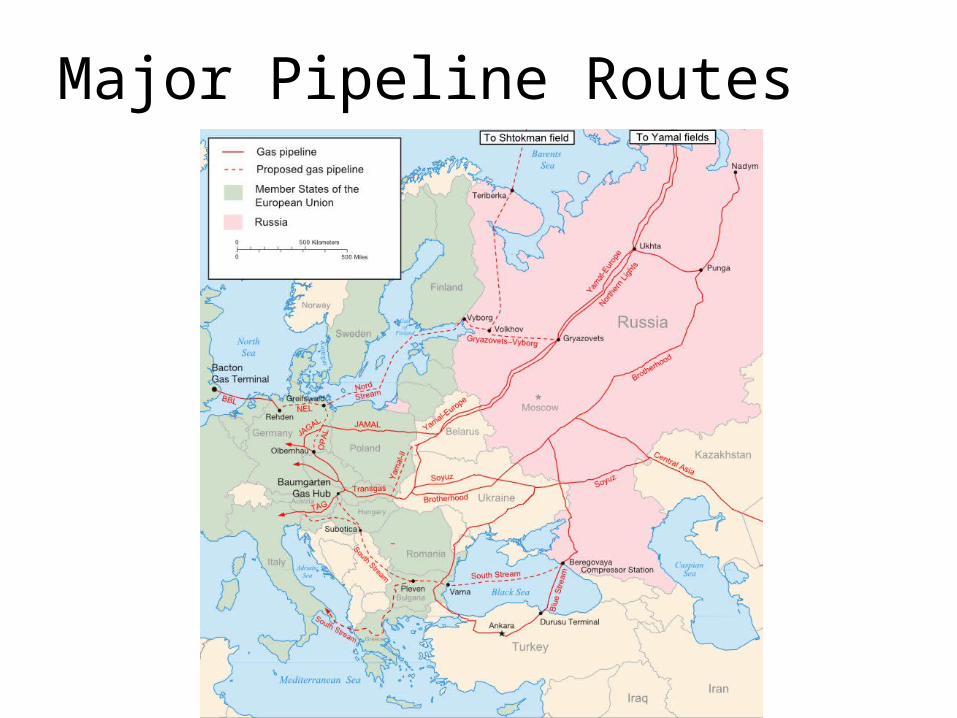
Major Pipeline Routes
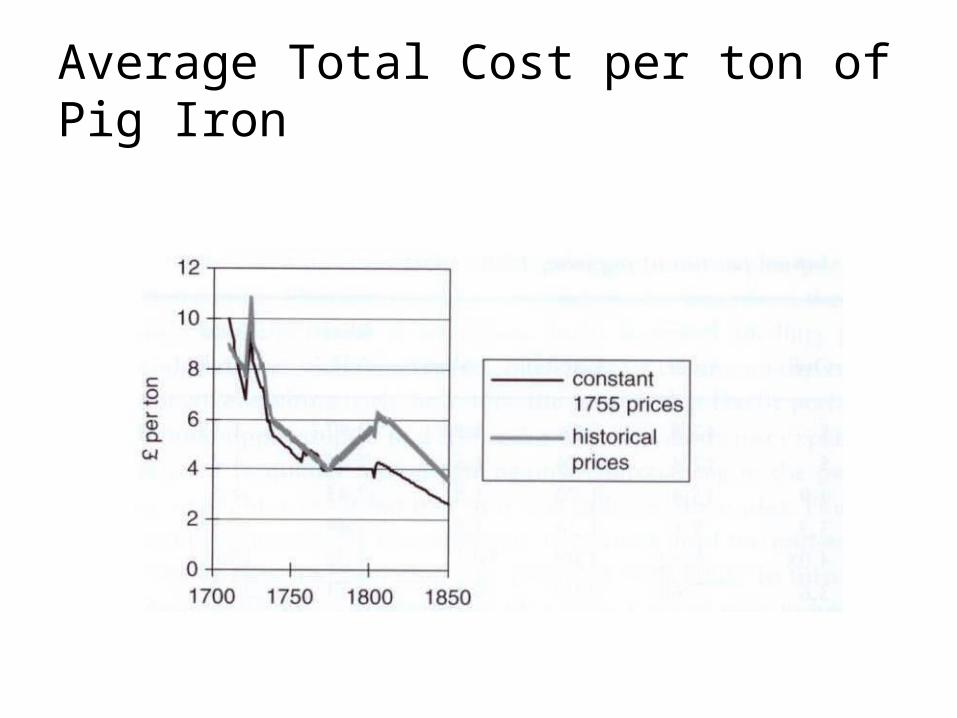
Average Total Cost per ton of Pig Iron
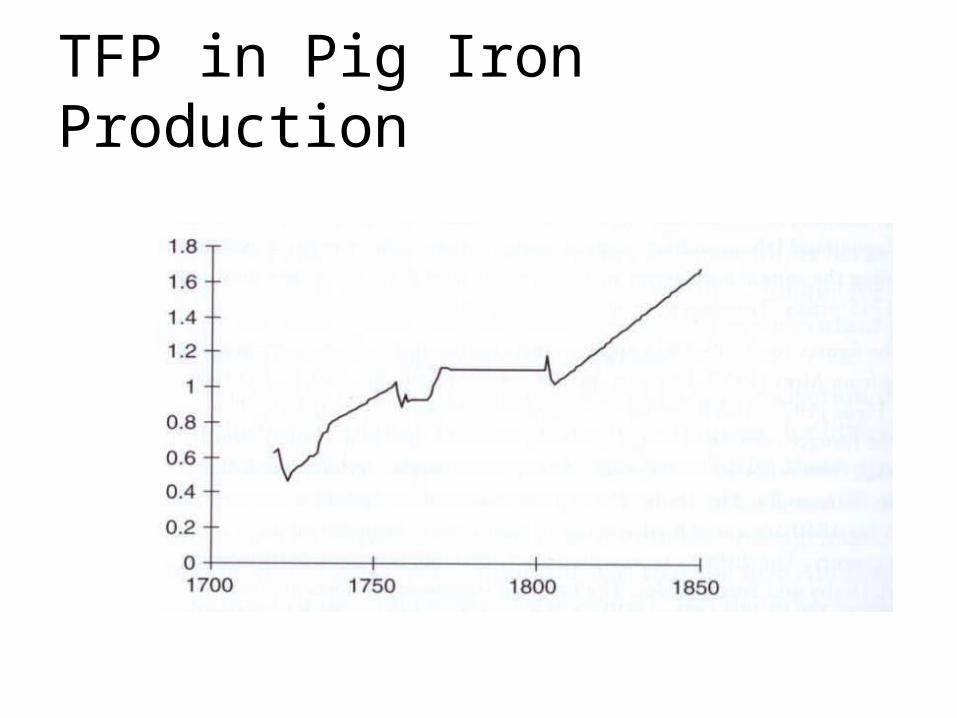
TFP in Pig Iron Production
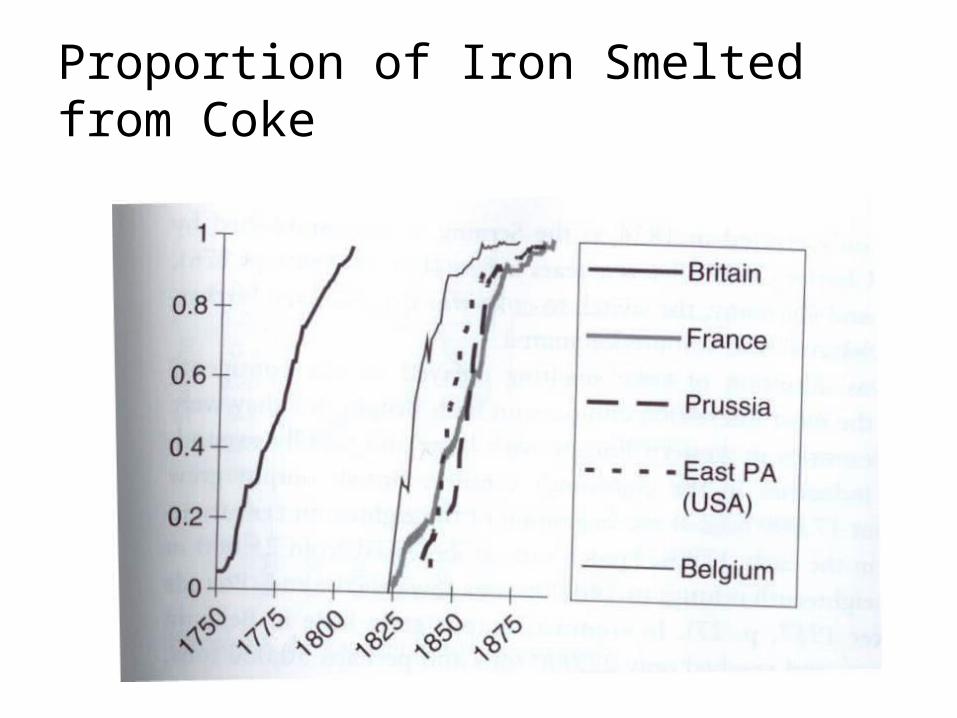
Proportion of Iron Smelted from Coke
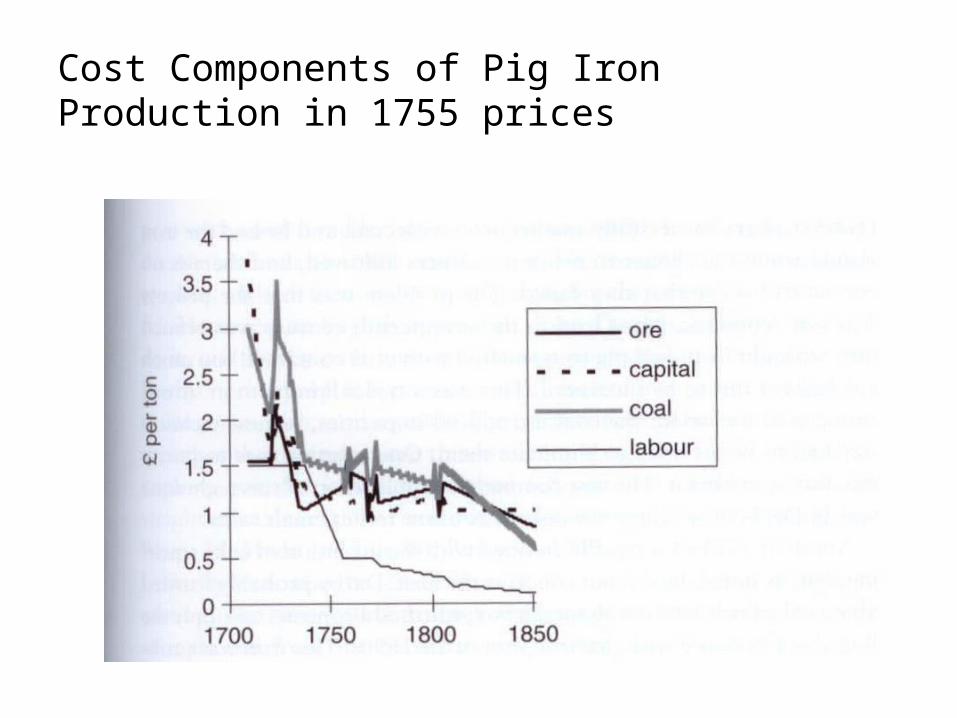
Cost Components of Pig Iron Production in 1755 prices
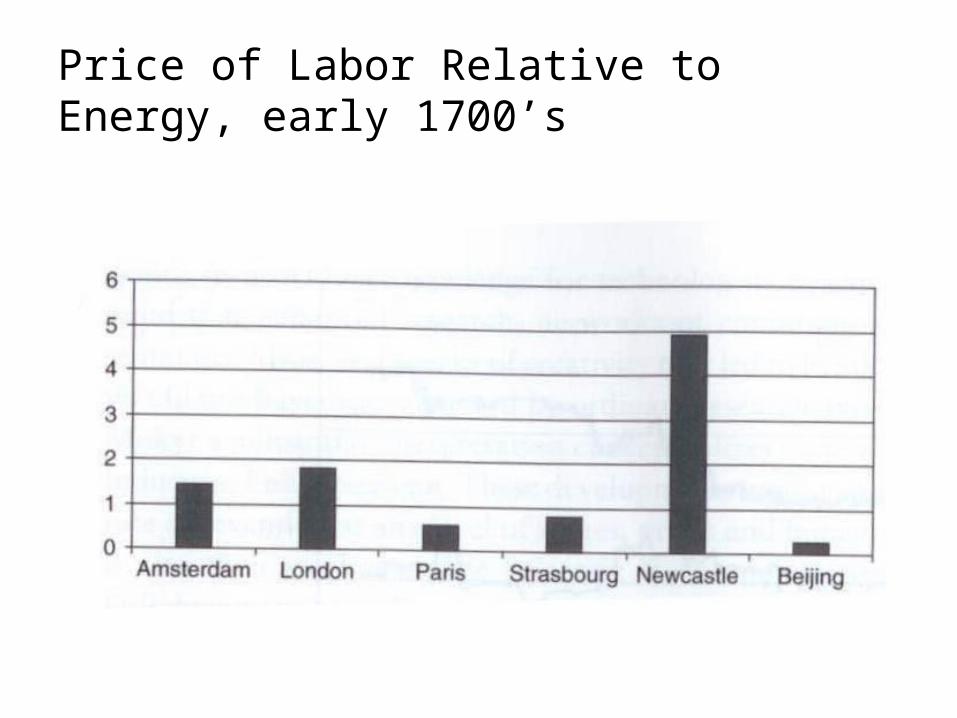
Price of Labor Relative to Energy, early 1700’s
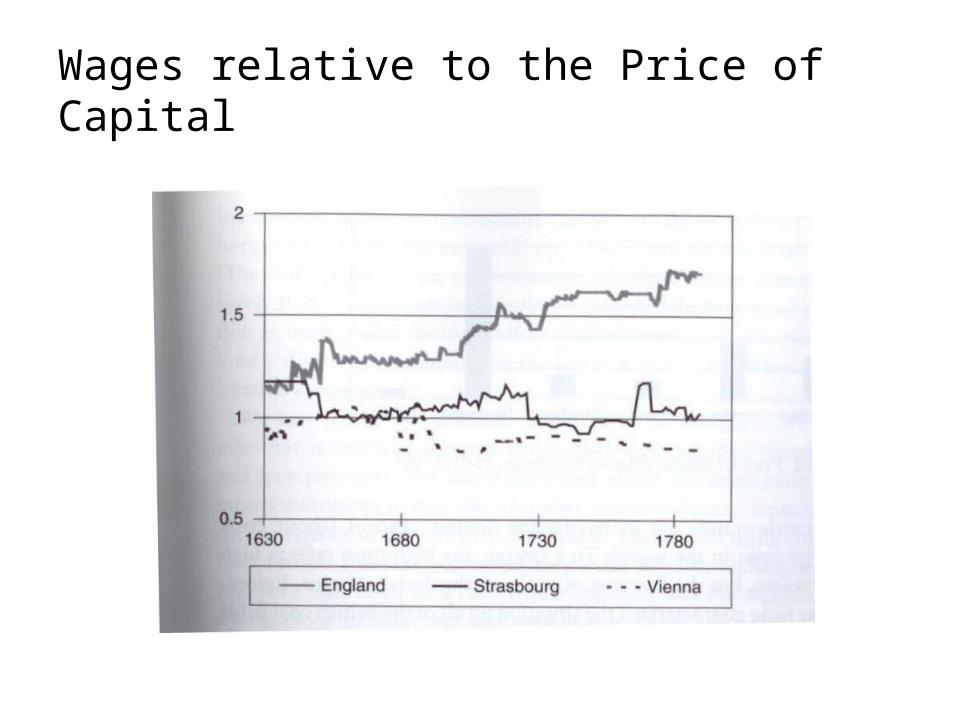
Wages relative to the Price of Capital
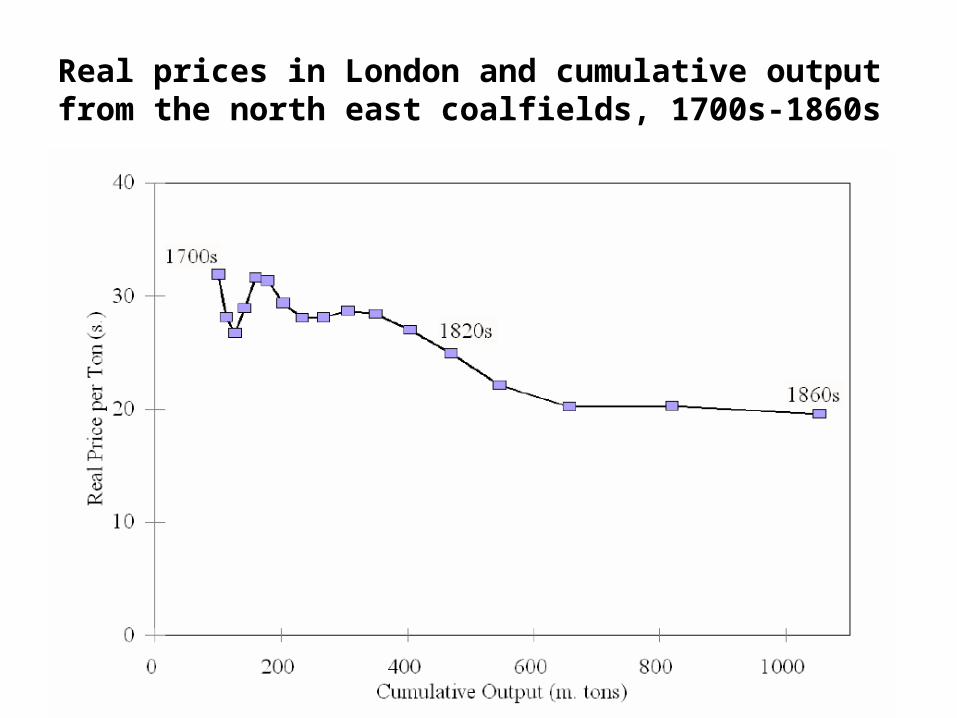
Real prices in London and cumulative output from the north east coalfields, 1700s-1860s
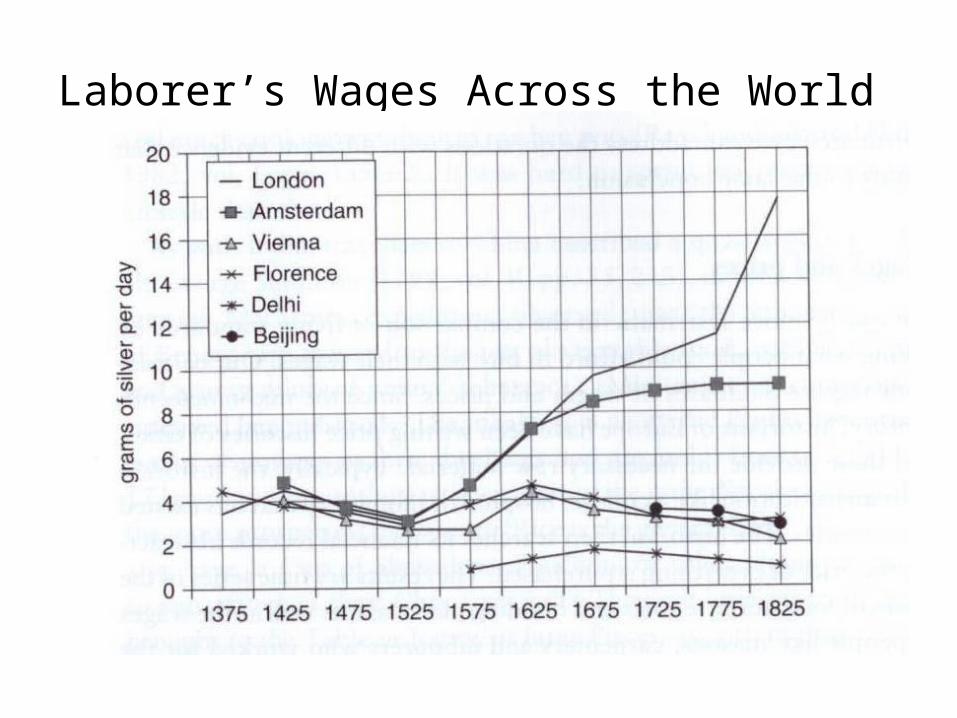
Laborer’s Wages Across the World
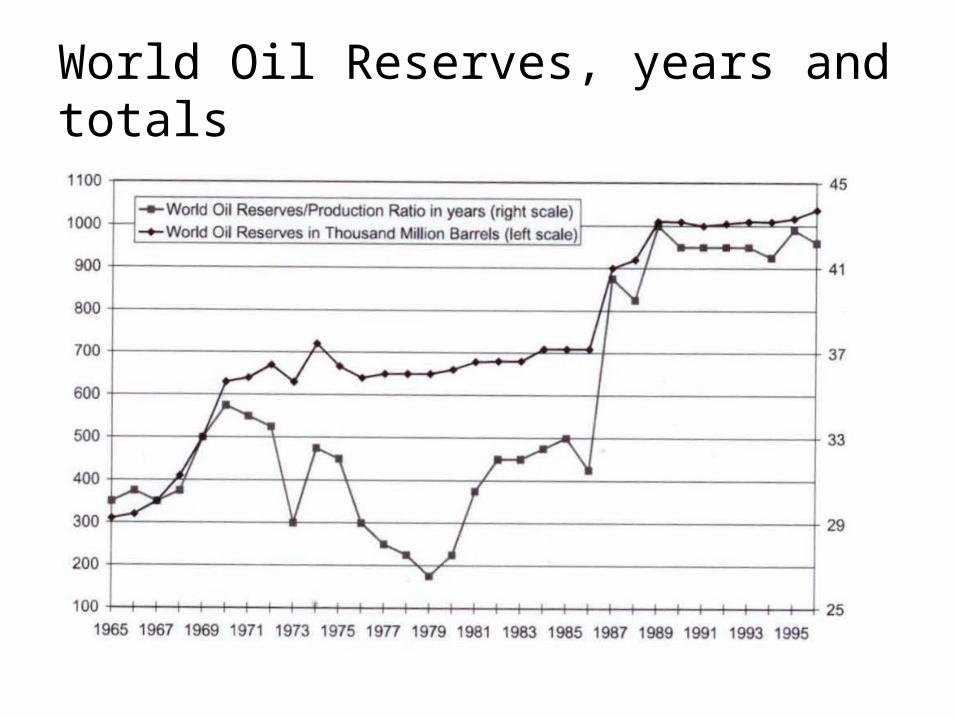
World Oil Reserves, years and totals
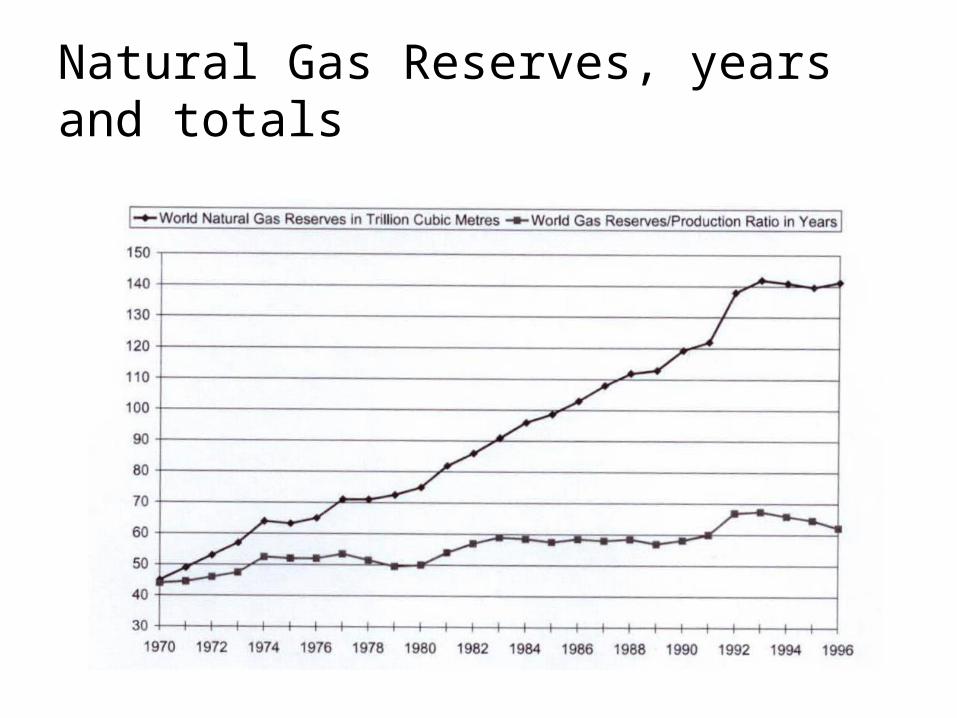
Natural Gas Reserves, years and totals
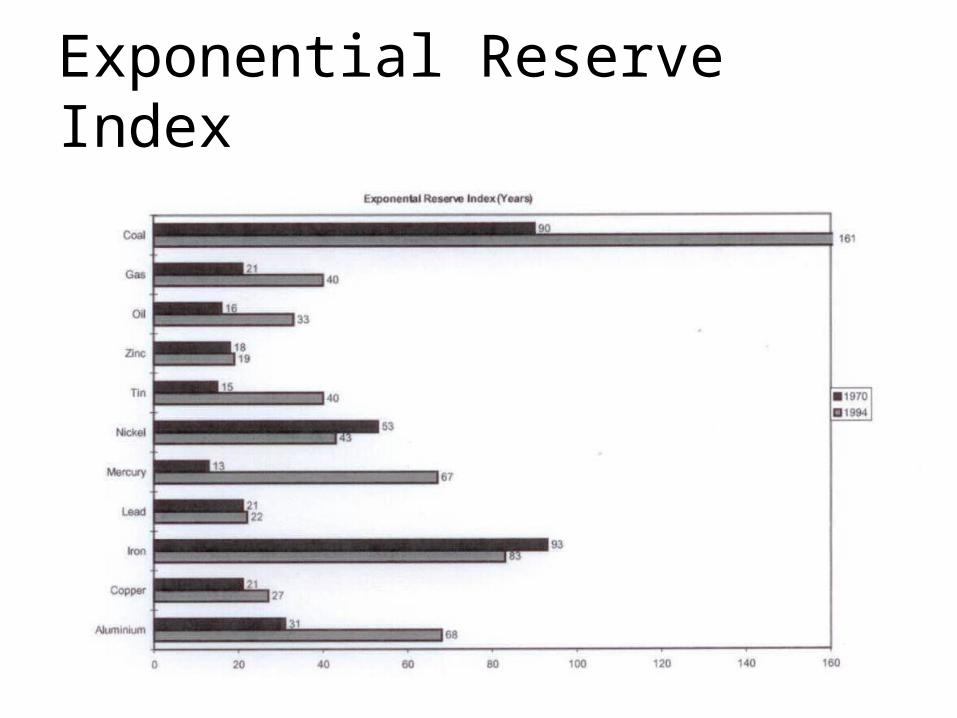
Exponential Reserve Index
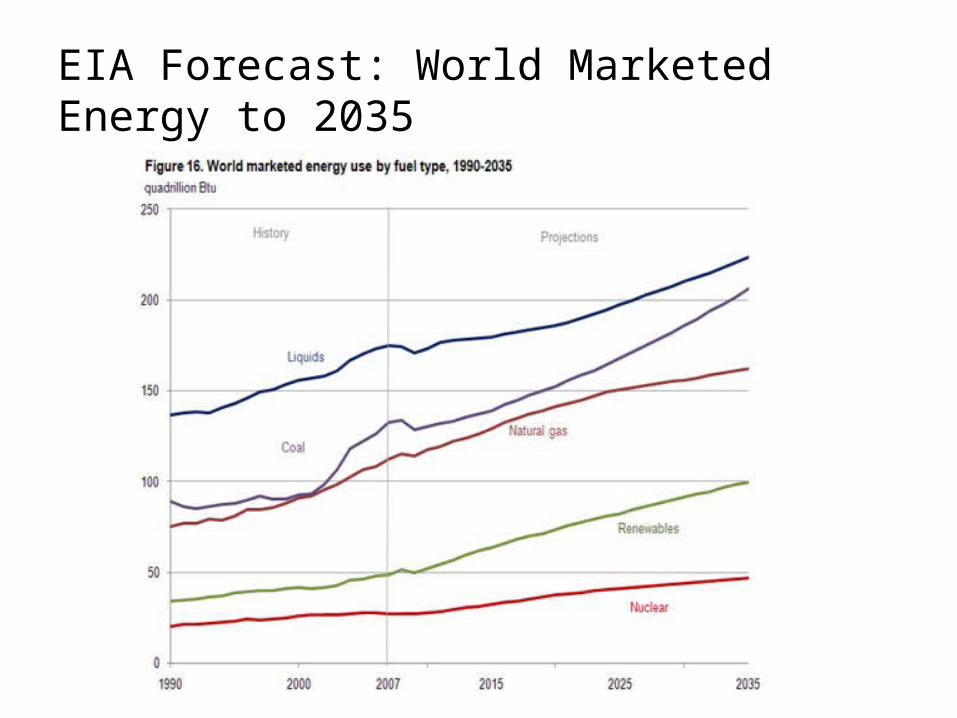
EIA Forecast: World Marketed Energy to 2035


![Maximum Distance Separable Codeswcherowi/courses/m7823/mdscodes.pdf · Maximum Distance Separable Codes. The Singleton Bound For a ... [q+1,3] MDS codes and hyperovals give rise to](https://static.fdocuments.net/doc/165x107/5ad837057f8b9a98098dbe26/maximum-distance-separable-codes-wcherowicoursesm7823mdscodespdfmaximum-distance.jpg)