Maximize the Value from Production Capacity Planning ... · PDF fileyour SAP technology to:...
70
Produced by Wellesley Information Services, LLC, publisher of SAPinsider. © 2015 Wellesley Information Services. All rights reserved. Sean Elliffe Reveal USA Maximize the Value from Production Capacity Planning, Scheduling, Sequencing, and Leveling in Your Integrated Supply Chain
-
Upload
trinhkhuong -
Category
Documents
-
view
216 -
download
1
Transcript of Maximize the Value from Production Capacity Planning ... · PDF fileyour SAP technology to:...

Produced by Wellesley Information Services, LLC, publisher of SAPinsider. © 2015 Wellesley
Information Services. All rights reserved.
Sean Elliffe Reveal USA
Maximize the Value from Production Capacity Planning, Scheduling, Sequencing, and Leveling in Your Integrated Supply Chain

1
In This Session
• Learn standard yet powerful techniques to improve production
capacity planning by more than 10%. Find out how to fully exploit
your SAP technology to:
Decipher the options between process, repetitive, and discrete
manufacturing decisions
Establish the best manufacturing strategy and set the rules to
automatically dispatch and sequence a variety of products and
strategies onto a production line
Ensure production activities are aligned with capacity
constraints, customer service demands, and raw material
supply

2
What We’ll Cover
• Manufacturing flows available in SAP
• Key differences in the repetitive and discrete environments
• Connecting with the strategic focus of the business
• Planning strategies within the integrated supply chain
• Foundational dynamics for capacity planning and scheduling
• Governance process to protect supply chain performance
• Competitive priorities to increase upper-quartile performance
• Wrap-up

3
Manufacturing Flow
• SAP has three manufacturing flows:
Repetitive Manufacturing time-based/rate-based flow
Discrete Manufacturing order-based flow
Process Manufacturing order-based flow
• Choice of manufacturing flow
Influences Shop Floor Control and, less, Production Planning
This means you can use the following SAP Planning Tools in
each of the above manufacturing flows:
SCM-APO Demand Planning and Supply Network Planning
ECC Demand Management
ECC Long-Term Planning
In process manufacturing, a product typically cannot be disassembled to its constituent parts,
e.g., a soft drink or packaged fruit juice cannot be broken down into its ingredients
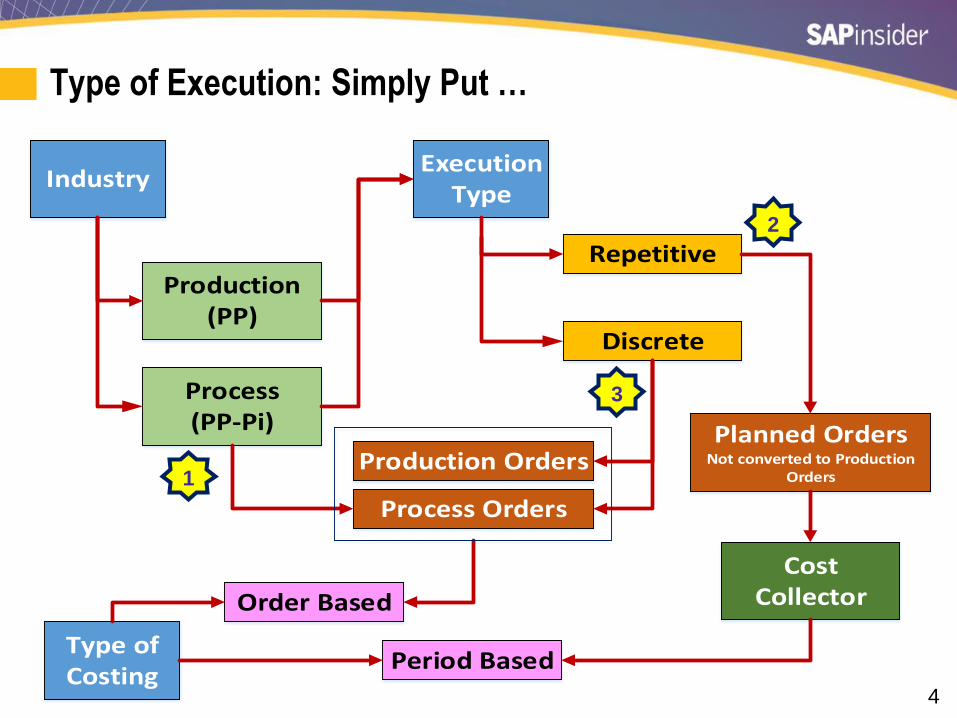
4
IndustryExecution
Type
Production(PP)
Process(PP-Pi)
Repetitive
Discrete
Production Orders
Process Orders
Type of Costing
Order Based
Period Based
Cost Collector
Planned OrdersNot converted to Production
Orders
Type of Execution: Simply Put …
1
2
3

5
Repetitive Manufacturing
Repetitive Manufacturing no Production Orders
Routings and Confirmations
Simple routings – one operation /
one work center
Simple BOM – one or two levels
Semi-finished products processed
immediately not put into an
interim storage
No confirmations, or if needed,
they are less detailed, and the
recording of actual data is very
simplified
Usually, there is no Quality Control
in SAP in a REM process
REM can be used for make-to-
stock or make-to-order albeit that
we usually see it in a MTS
business.
Planned Orders
Generally easiest flow for
producing in SAP
Plnd orders not converted to
Production orders
No reservations for raw material
Shop Floor must know what to put
on the line
Components consumed
anonymously during backflush
Traceability reporting possible
only through the batch number of
the FG
No finite scheduling of the orders
Costing is done on cost collector.
Cost Collector
Cost collector is an ‘open’ order
for a specific combination of FG
or product version which collects
all costs and revenues for a long
period of time (even indefinitely)
Each time we produce the FG or
product version , revenues and
costs (via backflush and
confirmation) are posted on this
CO-objects. Cost follow up is
simple usually too simple for
complex production.

6
Repetitive Manufacturing: Process Flow
Material Staging Interactive pull list is to inform you of
components whose stock levels have to be
replenished at the production storage
location.
From the missing quantities screen, you can
directly trigger a stock transfer from the
central warehouse to the production storage
location.
Production Execution and
Backflushing: Product is usually manufactured in a constant flow
over the production line.
You record actual data (backflush) at regular
intervals for production quantities manufactured.
The system posts the component consumption
and production activities with the goods receipt of
the finished product.
If you work with longer lead times, you can also
backflush at reporting points on production line.
This means you can post component consumption
closer to the actual time that the components were
consumed.
Processing the Master Plan: Planned orders created in the MRP run for a material in a
planning table.
Here, you no longer refer to planned orders but to run
schedule quantities.
You can then change these run schedule quantities in
the planning table taking the capacity situation into
account, if necessary.
Production is now controlled on the basis of these run
schedule quantities.
System generates purchase requisitions for externally
procured material components or services.

7
Discrete Manufacturing
Discrete Manufacturing based on Production Orders
Production by Lot Size
Grouping requirements into lots
during requirements planning
Planning with existing basic data
Independent of a particular sales
order.
Make to Order
Produce products with reference
to a particular sales order
Quantities managed, in terms of
stock for individual sales order
Assemblies and components can
also be procured for the sales
order that generates the
requirements, and managed in
stock for this sales order
A sales order BOM can then be
generated for sales order BOM
is used to produce the product
Planning with existing basic data
independent of a sales order.
Assembly Processing
Form of MTO where Assembly
order is created with the SO
Components for the product have
already been produced and now
only need to be assembled
Availability check is carried out for
the components when SO created
increases reliability with which
dates can be confirmed
Changes to the sales order are
automatically made in the
production order and vice-versa
Planning with existing basic data
independent of a sales order.

8
Discrete Manufacturing: Process Flow
Creation / processing of production order: Manually or by converting a planned order that was
created in production planning and procurement
planning
Reservations are automatically generated for the
necessary material components
System generates purchase requisitions for externally
procured material components or services.
Capacity Management: Capacity requirements are generated in the work
centers that are to process the production order
Evaluation of capacity and if necessary levelling
capacities at any stage in production order
processing before production starts
Preliminary costing carried out to determine the
planned costs
Relevant materials and capacities are available to
release the production order and print the
relevant shop floor papers.
Production: Components to produce the product are
withdrawn from stock for the production
order and the goods issue is posted
Required product is produced according to
the production order
Quantities produced and the times needed
to do so are confirmed for the production
order
Products are placed into stock and the
goods receipt is posted
Quality Inspection aligned to production
process

9
Process Manufacturing
Process Manufacturing Process Orders similar to Production Orders
No Disassembly into Constituent Parts
In process manufacturing a
product typically cannot be
disassembled to its constituent
parts
Once it is produced, a soft drink or
packaged fruit juice cannot be
broken down into its ingredients
Range of Products include solder,
chemicals, coatings,
pharmaceutical goods, bio-
engineered products, and fuels
such as petrol.
Processing is what makes the difference
Typically, process manufacturing
involves things of a liquid or once-
liquid form that went through some
kind of “processing”
Processing usually means adding
energy or some kind of conditional
change - say, adding thermal
energy - for chemical conversion
Processing usually means
exposing a mixed substance to
heat, cold, time, pressure or other
conditional changes. These
changes permanently create an
entirely new thing.
Factors highlighting differences
Key Differentiators:
Ingredients, rather than parts or
assemblies
Formulas, rather than BOMs
(chemicals, food and beverage,
gasoline, paint and
pharmaceutical)
Typically produced in Bulk, rather
than discrete countable units that
can be labeled on an individual
basis.

10
Generic Criteria That Suggest Selection of ERM
• The same or similar products are produced over a lengthy period
of time
• The products produced are not manufactured in individually
defined lots. Instead, a total quantity is produced over a certain
period at a certain rate per part-period.
• The products produced always follow the same sequence through
the machines and work centers in production
• Routings tend to be simple and do not vary much
• Primarily in an MTS type environment

11
What We’ll Cover
• Manufacturing flows available in SAP
• Key differences in the repetitive and discrete environments
• Connecting with the strategic focus of the business
• Planning strategies within the integrated supply chain
• Foundational dynamics for capacity planning and scheduling
• Governance process to protect supply chain performance
• Competitive priorities to increase upper-quartile performance
• Wrap-up

12
Detailed Comparison
Order-Based Production (Discrete) Repetitive Manufacturing (REM)
1. PLANNING
1. Capacity Planning is done at the work center level
2. Planned orders are transformed by Planning into
Production Orders
3. Reservations are created for the components
4. Finished products are typically manufactured in
individual lots, and the sequence on the work centers
can vary between different finished products
1. MPS creates planned orders
2. Capacity planning is done against production Lines
(Planning Table)
3. Thus, there is no release of production orders, nor
reservation for raw material
4. The same product is produced on a certain production
line over a longer period of time
2. MASTER DATA
1. Bills of material and routings are more complex
2. Production versions optional
1. Routings tend to be very simple
2. Usually simple bills-of-material (one or two levels
maximum)
3. Production versions required

13
Order-Based Detailed Comparison
Repetitive Manufacture
D
i
s
c
r
e
t
e
MRP
Planned Order
Create Production Order
Release Production Order
Completion Confirmation
FG Receipt
Back flush Material
Planning Table (Run Schedule)
Back flush

14
Production Orders: Processes

15
Structure: Master Data
Operation
Operation
Operation
Operation
Operation
Materials
BoM
Routing
Work Center Cost
Center Activity Type
Production Version
Finance
Planned Order
Production Order
BoM Components must be allocated To the required Operation. If no allocation, default is 1st Op.
Activity rates at this level
Copied into Read PP Data

16
Detailed Comparison
Order-Based Production (Discrete) Repetitive Manufacturing (REM)
3. SHOP FLOOR CONTROL
1. Discrete manufacturing is characterized by
requirements that occur on an irregular basis and a
workshop-oriented process
2. Semi-finished products are usually put into an interim
storage location prior to further processing
3. Confirmations are usually based on actual quantities
(labor, machine, energy, etc.)
4. Confirmations are done at Production Order Operation
level or at Order level
5. Better shop floor visibility
6. Production lines are thus replenished via the
production orders
7. Back flush is possible, but often, the actual quantities
of components are issued by production order
1. Products are not manufactured in individual lots (lot is
typically one shift)
2. The semi-finished products are processed
immediately, without being put into an interim storage
location
3. There is no confirmation, or if needed, they are less
detailed, and the recording of actual data is very
simplified
4. Traceability reporting is possible, but only through the
batch number of the finished product
5. Confirmation will be without ref to planned orders

17
Shop Floor Control
Confirmation
Quantity Processed in Operation (
scrap and Yield)
Reduction of Capacity on Resources
Update of cost
Update of the Order Data
Backflushing
Automatic GR for FG
MRP Related Update of
Expected Yield
Who carried out the
Operation
Resource information
Actual Start and Finish
Date
Activity Used to Carry out Operation

18
Comparison: Shop Floor Control
Discrete STD SAP Reports Repetitive STD SAP Reports

19
Detailed Comparison
Order-Based Production (Discrete) Repetitive Manufacturing (REM)
4. ORDER INFORMATION SYSTEM
Target vs. Actual Analysis at different levels
• Work Center
• Operation
• Order
• Material
The visibility offered by standard SAP reporting
functionality for discrete Manufacturing to analyze the shop
floor from a lead time and schedule adherence perspective
is far superior than Repetitive. Repetitive assumes that you
don’t need this level of control, as it is period based.

20
Detailed Comparison (cont.)
Order-Based Production (Discrete) Repetitive Manufacturing
5. INVENTORY MANAGEMENT
1. Requirements dates for Purchasing from MRP output
2. Reservations are generated for raw materials
3. Component materials are staged with specific
reference to the individual production orders or to
storage locations
4. Consumption takes place by goods issue or back flush
5. Components are order-specific
1. Requirements dates for Purchasing from MRP output
2. No reservation for raw materials
3. Material staging to the Shop Floor not order-specific
4. Raw materials are put in a staging storage location as
total requirements
5. Material handlers must know what to put on the
production line
6. Back flush takes place at the goods receipt of the
finished product
7. Components are consumed anonymously from the
staging storage location during the back flush

21
Detailed Comparison (cont.)
• Routings are valuated with activity prices at standard
Primary costs on cost center divided by planned activities from Long-Term Planning as an example
• Bill of Material
Consumption of raw material, packaging at moving average price
Consumption of semi-finished or finished goods at standard
• Month-end
Revaluate the activities at actual price
WIP calculation based on Production Order Status
Calculated Variances are charged to P&L
Settlement of Variances at month-end or at close status
• Costing runs for standard cost can be done on a monthly basis
Can break down costs by component, i.e., packaging, steel, molding (up to 46)
Can use additives for various costs, such as forwarding freight between plants
Overhead cost as a % or quantity of a component
Costing templates for complex calculation
• Similar functionalities as production orders, except:
Only visible at product level
Settlement happens at month-end
Order-Based Production (Discrete) Repetitive Manufacturing (REM)
6. CONTROLLING
1. Order-based
2. Detailed controlling for each order by comparing plan
and actual figures
3. Settlement is done at the Production Order level
4. Actual production costs at Order level
1. Period-based
2. Costing is done on cost collector level
3. Settlement is at Material level
4. Cost follow up is really simple in REM; usually too
simple for complex production

22
Comparison Summary
Order-Based Production (Discrete) Repetitive Manufacturing (Period/Rate-Based)
1. There is frequent switching from one product to another
2. Each product is manufactured in individually defined
lots
3. Costs are calculated per order
4. Usually has a changing sequence of work centers
where the products are processed
5. The order of work centers is determined in routings,
which can often be very complex
6. Semi-finished products are frequently placed in interim
storage prior to further processing
7. Component materials are staged with specific reference
to the individual production orders
8. Confirmations for the various steps and orders
document the work progress and can be used for fine
control
9. Order-based cost controlling
1. The same product is produced on a certain production
line over a longer period of time
2. In production, a total quantity is produced according to
a certain production rate over a certain period of time
3. Costs are collected periodically at a product cost
collector
4. Usually involves a relatively constant flow through
production lines
5. The routings of the individual products are very similar
6. Semi-finished products often directly processed
without interim storage
7. Components are often staged at the production lines
without reference to a particular order
8. The confirmations (back flushes) are usually executed
periodically with no reference to an order (for example,
all the quantities produced in one shift)
9. Period-based cost controlling

23
What We’ll Cover
• Manufacturing flows available in SAP
• Key differences in the repetitive and discrete environments
• Connecting with the strategic focus of the business
• Planning strategies within the integrated supply chain
• Foundational dynamics for capacity planning and scheduling
• Governance process to protect supply chain performance
• Competitive priorities to increase upper-quartile performance
• Wrap-up

24
Connect to the Strategic Business Focus
Typical Business Cycle
Typical Areas of
Optimization
Challenge Data Integrity
Housekeeping
1 Business Rules
Integration
2
Production and Capacity Planning
process often relies on
information outside of SAP
To close the gap and ensure
“Visibility in System,” it is essential
to “use standard available
functionality”
SAP

25
Information Maturity Drives Value
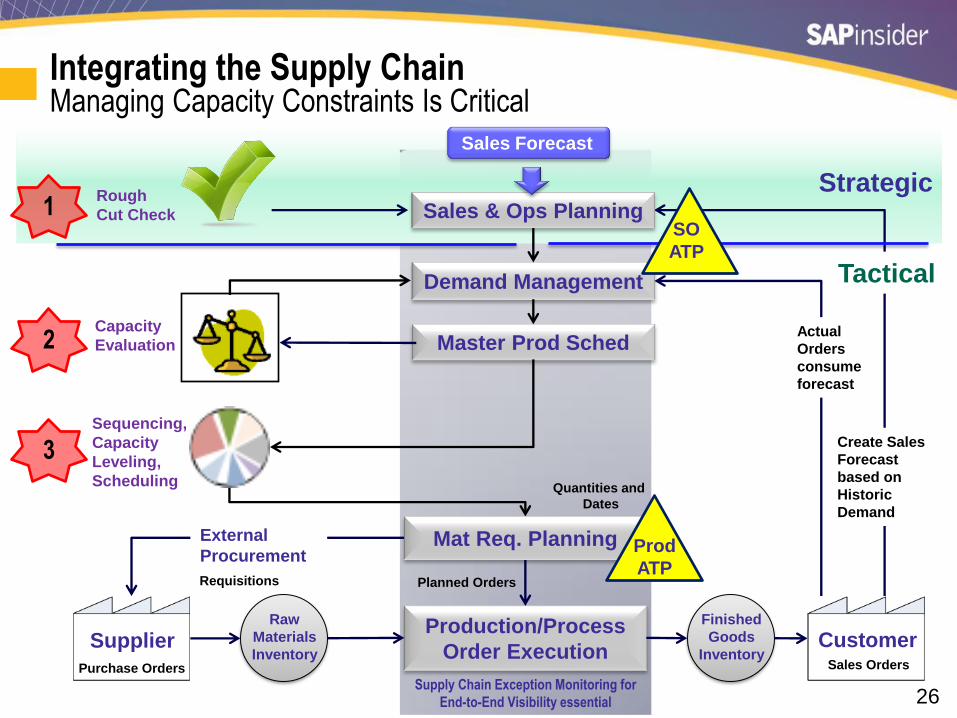
26 Supply Chain Exception Monitoring for
End-to-End Visibility essential
Strategic
Demand Management
Production/Process
Order Execution Supplier
Raw
Materials
Inventory
Finished
Goods
Inventory
Create Sales
Forecast
based on
Historic
Demand
External
Procurement
Master Prod Sched Actual
Orders
consume
forecast
Customer
Sales & Ops Planning
Mat Req. Planning
Tactical
Sales Forecast
Planned Orders Requisitions
Quantities and
Dates
Sequencing,
Capacity
Leveling,
Scheduling
Capacity
Evaluation
Rough
Cut Check 1
2
3
SO
ATP
Prod
ATP
Sales Orders Purchase Orders
Integrating the Supply Chain Managing Capacity Constraints Is Critical

27 Supply Chain Exception Monitoring for
End-to-End Visibility essential
Strategic
Demand Management
Production/Process
Order Execution Supplier
Raw
Materials
Inventory
Finished
Goods
Inventory
Create Sales
Forecast
based on
Historic
Demand
External
Procurement
Master Prod Sched Actual
Orders
consume
forecast
Customer
Sales & Ops Planning
Mat Req. Planning
Tactical
Sales Forecast
Planned Orders Requisitions
Align S&OP in SAP – Sales Forecast,
CO-PA, RCCP, Business Plans, and
simplify process, e.g., Planning Books
Sequencing,
Capacity
Leveling,
Scheduling
Capacity
Evaluation
Rough
Cut Check 1
2
3
Rough Cut Resource
Planning
Capacity Evaluation functionality
available and not used effectively in
SAP, resulting in move to introduce
external systems to compensate
Sequencing, capacity
levelling, and scheduling
functionality to be used
SO
ATP
Sales Order ATP set up to
align to business needs
Prod
ATP
Component availability
for production orders Conversion of Production
Orders at opening period
Fair Share allocations
Sales Orders Purchase Orders
Integrating the Supply Chain Managing Capacity Constraints Is Critical (cont.)
Quantities and
Dates
Poor Data Integrity/Housekeeping
negatively impact S/D planning
Planning strategies/business
rules aligned/adjusted

28
Bringing It All Together Customer demand driven in product hierarchies from
S&OP through demand management supported by
product allocation and available-to-promise
Strategic Supply Make Distribution New
Products
Pull Demand
with S&OP
Cycle Time
Waste
Inventory
Scheduli-ng in SAP
Reduce Safety Stock
Master Data
Areas of Strategic Focus

29
What We’ll Cover
• Manufacturing flows available in SAP
• Key differences in the repetitive and discrete environments
• Connecting with the strategic focus of the business
• Planning strategies within the integrated supply chain
• Foundational dynamics for capacity planning and scheduling
• Governance process to protect supply chain performance
• Competitive priorities to increase upper-quartile performance
• Wrap-up

30
Correct Planning Strategies Key to Driving Your Advantage
• We need the planning strategy for a product to create the demand program. Planning strategies:
Represent the methods of production for planning and manufacturing or procuring a product
Provide the business procedures for planning production quantities and dates – MTS/MTO/FTO
By using these correctly, we can:
Use sales orders and/or sales forecast values to create the demand program
Move the stocking level down to the assembly level, so that final assembly is triggered by the incoming sales order
Carry out Demand Management specifically for the assembly
• We can combine planning strategies at, say, the finished good level (40) and still apply a different strategy for an assembly (70) in the Bill of Materials (BOM)

31
Planning Strategies and Available to Promise (ATP)
• Consider carefully which Planning Strategy and ATP check to use
for each Material to be planned in S&OP Demand Management
To select Planning Strategy and ATP checking group, ask:
At which level of the Bill of Materials will stock be held?
Will sales orders that exceed the Demand plan add to the
plan or be ignored?
Will Replenishment lead time be taken into account in the
ATP check if Stock and Production/Process orders do not
exist?
Will ATP be performed based on “Scope of Check” or simply
against the Plan (Planned Independent Requirements)

32
Making the Decision – MTS vs. MTO vs. FTO Does Procurement/Production Take Place Before/After Sales Order?
• Make to stock means you make and procure in anticipation of actual orders
This supply plan is generated by MRP based on forecasted demand
Stock purchased or manufactured is placed in free available stock and issued to actual demand as required
• Make to Order means your procurement plan is generated based upon the entry of actual orders only
You can be MTO for a finished product, but still be MTS for the sub-assemblies and/or raw materials
• To procure or produce sub-assemblies based on plans which are independent of finished products, you use strategies for the planning of components
20
50 60
52 63
10
11
40
70 59 74
FTO Planning Material
FTO Planning Material
SO-Specific Stock
Generic Stock
Generic Stock (59 – components
into generic stock)
FG Forecast Driver
FG Forecast Driver excl 20
Sub-Assembly Forecast Driver

33
Business Decisions on MTS/MTO/FTO Strategies Planning Strategies to Align the Plan to Execution

34
Balancing Supply and Demand Across the Supply Chain
Supply
Finish Start Schedule
Act
ual
Pla
n
MRP
Demand Forecast (S&OP)
Sales
Production
Maintenance
Planned Order
Purchase Requisition
Process/Production Order
Purchase Order
Inventory
Rules MRP ATP
8
7
5
4
1
2
3
6
Production Schedule
Schedule Firming
Expedite
Proposal
BOM
Over/Under Can’t plan Integration
Exception Monitoring (EM) Wheel©

35
Exception Messages Measure Process Efficiency

36
Forecast
Finished Product
Ind Req Planned
Order Dep Req Purchase
Requisition
Purchase
Order
Sales
Order
Production
Order Reservation
Supplier
GR GI GR
Sales
Order
Finished Product
RAW Material Plan
Schedule
Actual Vendor
X X X
X X X
X X X Del Customer
Semi-Finished Product
FG Inventory
EM Aligns Supply Chain: Plan Schedule Actual

37
What We’ll Cover
• Manufacturing flows available in SAP
• Key differences in the repetitive and discrete environments
• Connecting with the strategic focus of the business
• Planning strategies within the integrated supply chain
• Foundational dynamics for capacity planning and scheduling
• Governance process to protect supply chain performance
• Competitive priorities to increase upper-quartile performance
• Wrap-up

38
Capacity Planning Links with Business Goals and S&OP
Capacity planning is the process of
determining the production capacity
needed by an organization to meet
changing demands for its products
“Capacity” is the maximum amount of
work that an organization is
capable of completing in a given
period of time
The main purpose of capacity planning is to reduce cost and
improve productivity
Associated Goals
• Maximize profits & Customer Service
• Minimize costs, inventory levels, changes in work force, overtime, use of subcontracting, change in production rates, number of machine setups, idle time for plant, and personnel

39
Capacity Planning Is …
Factors affecting capacity include:
• Number of workers and ability of workers
• Number of machines
• Waste, scrap, defects, errors
• Productivity
• Suppliers
• Government regulations
• Preventive maintenance
Process to determine how much and when capacity is needed to produce new or more product
Relevant in the long-term and the short-term, although there are different issues at stake for each
1
3
2
Issues facing Capacity Planning over a Time Horizon
Link back to S&OP

40
Capacity Planning and Bottleneck Management
• Capacity = the “throughput” or # of units a facility can hold, receive, store, or produce in a period of time:
Bottlenecks control throughput of products processed – SO
Schedule work centers at a rate that prevents bottlenecks
Use time buffer inventory (where appropriate) to eliminate bottlenecks
• Capacity planning helps overcome bottlenecks:
Uses information to produce a load profile for each capacity
Compares planned orders with capacity of work center
Identifies under loads and overloads, enabling proactive action
The Bottleneck is the priority for optimization.
Optimizing features in “A” or “C” will not bring
about change in overall performance until the
performance issues in “B” are addressed.

41
What Is Capacity Planning in SAP?
Capacity Planning is both:
• Evaluation
Available capacity & capacity requirements are determined & compared with each other in lists or graphics
Planner manually makes changes to the demand and/or supply and rechecks the evaluation (an iterative process)
• Leveling
Optimal capacity commitment is made automatically to all capacities (e.g., labor and machine)
Optional: sequence like orders together to spend less time setting up and more time producing
Capacity Resource Planning (CRP) in SAP ECC provides a fully
integrated view of resource utilization across the organization
Capacity
Leveling
Capacity
Evaluation
CRP functionality
broken into two main
constituent parts
It is a process to ensure the economic use of
work centers …

42
Capacity Information
• The SUPPLY of Capacity is held in the Work Center’s Capacities
Work Centers can have one or more Capacities, e.g.:
Machine hours (aka, Processing unit hours)
Labor hours
• The DEMAND on Capacity comes from the Routings or Recipes copied into Planned, Production, or Process Orders
Defining available capacity
Generating capacity
requirements (load)
Evaluating available capacity
1. Available capacity defined within capacity categories in the work center master data
2. Capacity requirements generated through detailed scheduling in MRP or mass
processing (COHV)
3. Capacity evaluation – overview
of capacity load and available
capacity. Can be accumulated
into hierarchy to evaluate group
of work centers.
Capacity Evaluation Enables comparison of capacity requirements to available capacity

43
Elements of Capacity Evaluation Comparison of Capacity Requirements to Available Capacity
Capacity category
Physical resource assigned (machine, labor, etc.)
Available capacity (standard)
Calculated from daily operating time, breaks, efficiencies, and utilizations
Capacity version
Use of capacity maintained, by period, that differs from the standard available capacity
(e.g., utilizing shifts/intervals to model work schedule)
Defining available capacity
Generating capacity
requirements (load)
Evaluating available capacity
Capacity requirement
Represents the capacity load and is calculated using formulas from the work center,
dates, and quantities from planned and production orders
Load distribution
Determines how a capacity requirement for a given capacity type, which spans multiple
days, is distributed across each day in the time interval
Capacity requirement reduction
Progress-based reduction of planned capacity load
Capacity evaluation
Provides an overview of the capacity load and available capacity
Hierarchy/accumulation
Available capacity, load, and evaluation for a group of work centers

44
Multiple Capacities at One Work Center
• Business need: Ability to evaluate labor and machine capacity at
a given work center
SAP allows us to define and create as many capacity categories
as needed within a work center
Each capacity category can only be created once within a
work center
To meet the business need, set up individual labor and machine
capacity categories for the work center
Either one or both of these capacity categories can point to a
pooled capacity, if relevant
When performing capacity evaluation for the work center, we
have visibility into the capacity situation for each capacity
category

45
Multiple (Pooled) Capacity Category Evaluations
Person

46
Capacity Planning During Sales & Operations Planning
Outcomes of Rough Cut Capacity Check
1. Prevent an impossible demand plan from being sent to Demand Management/MPS (MRP)
2. Provide Senior Supply Chain directors with a mid-term view (3 months-3 years) of the capacity situation so they can react, e.g.:
Add additional shifts in upcoming months
Purchase additional equipment
Re-engineer the product to require fewer capacity resources
Qualify subcontract vendors so some production can be subcontracted

47
Capacity Planning After the Master Production Scheduling (MPS) Run
Outcomes of Capacity Evaluation of the MPS run
1. Balance the Capacity Load in the mid-term (2 weeks-3 months)
Sales Orders will ATP against this plan in weekly buckets
Component materials will be procured to meet this plan
2. Demand and Supply Planners will:
Adjust forecast (Planned Independent Requirements) to keep plan under 100% capacity
Make a strategic decision to subcontract some production
3. Production Managers will:
Add additional shifts of capacity and/or overtime

48
Near-Term Sequencing, Leveling, and Scheduling of Planned Orders
Outcomes of Sequencing, Leveling, and Scheduling
1. The system will sequence like setups together for the next 1 day-2
weeks. Spend less time setting up and more time producing.
2. This process “fine tunes” the near-term schedule from weekly
buckets to the exact date/time the order will run; it considers both
machine capacity and labor capacity
3. Provides a final requirements date for component materials
4. The one and only Production Schedule is in SAP – can print a
production schedule with one button!

49
Sequence and Capacity-Level Bottleneck Work Center
• Dispatch the operations from the lower pool to the upper work
center, taking into consideration the capacity and working times

50
Capacity Adjustment Decisions
Overloaded Capacity:
• Increase capacity by:
Adding extra shifts
Scheduling overtime or weekends
Adding equipment and/or personnel
• Reduce load by:
Reducing lot sizes
Holding work in Production Control (WIP)
Subcontracting work outside
Under-Loaded Capacity:
• Reduce capacity by:
Temporarily re-assigning people
Reducing the length of shifts
Eliminating the # of shifts
• Increase load by:
Releasing orders early
Increasing lot sizes
Making items normally outsourced

51
Capacity Evaluation Links Back to Integrated Planning
Defining available capacity
Generating capacity
requirements (load)
Evaluating available capacity

52
Analysis Helps Drive Us to Predictability
Future plan based on
independent requirements
Past consumption based
on historic activity
Make changes and rerun the future
plan to find the ideal fit

53
What We’ll Cover
• Manufacturing flows available in SAP
• Key differences in the repetitive and discrete environments
• Connecting with the strategic focus of the business
• Planning strategies within the integrated supply chain
• Foundational dynamics for capacity planning and scheduling
• Governance process to protect supply chain performance
• Competitive priorities to increase upper-quartile performance
• Wrap-up

54
Grouping the Data: Swim Lanes
Critical
A, B, C

55
Data Hierarchy and Ownership

56
Integrated Supply to Demand
Gate Control
Crowd Control
Logistics
MRP
Master Data
MRP
Master Data
Routings
Work Centers
BOMs

57
Integrated Supply to Demand (cont.)
Gate Control
Crowd Control
Logistics
MRP
Master Data
MRP
Master Data
Produce Later than Planned
Schedule Out
Schedule In
Impacting Customer Orders
Inflating Inventory
Breaks down trust
and reliability of the
data
58
What We’ll Cover
• Manufacturing flows available in SAP
• Key differences in the repetitive and discrete environments
• Connecting with the strategic focus of the business
• Planning strategies within the integrated supply chain
• Foundational dynamics for capacity planning and scheduling
• Governance process to protect supply chain performance
• Competitive priorities to increase upper-quartile performance
• Wrap-up

59
5 Competitive Priorities That Add Value to Decisions Increase Upper-Quartile Performance
1. Cost – standardized products enabling economies of scale
2. Quality – conform to requirements or fitness for use
3. Delivery – speed and reliability
4. Flexibility – product range, volume capability, introduce new
5. Innovation – focus on target market segments with tailored mix
Set precise and explicit performance
goals based on priorities

60
Impact on Upper Quartile Performance: S&OP Benefits to the Organization
• Effectively implemented and applied, S&OP delivers significant benefits to the organization:
Aberdeen Group cited best in class S&OP yields:
1. 14% increase in Operating Margin
2. 4% increase in Gross Margin Dollars
3. 55% reduction in Inventory write-offs
4. 17% increase in new product revenues
5. 35% reduction in lost sales
Oliver Wight Group reports:
1. Increased Forecast Accuracy by: 18% to 25%
2. Increased Sales Revenue by: 10% to 15%
3. Increased On-Time Delivery by: 10% to 50%
4. Inventory Reduction by: 18% to 46%
5. Safety Stock Reduction by: 11% to 45%
6. Increased Productivity by: 30% to 45%
Prime Determinants of business
performance:
1. Complete Order Fill Rate
2. Gross Margin
3. Customer Retention

61
Impact on Upper Quartile Performance: Capacity Planning
• Clear financial benefits from efficient capacity plans with MRP:
Insufficient capacity quickly leads to:
Deteriorating delivery performance – loss of sales revenue
Unnecessary increase of WIP – more carrying costs/higher inventory
Frustration of sales personnel and those in manufacturing:
Demand Supply disconnect
Excess capacity can be costly and unnecessary
• Manage capacity properly to reduce barriers to:
Achievement of maximum/optimum company performance
Introduction of new products into production, stinting growth
• Capacity directly influences company’s decisions on:
Technology
Facilities and Equipment
Human Resources
Outsourcing
Cost of Doing Business

62
Quote on the Importance of Measures
“You cannot improve what you cannot measure ...
The emerging best metrics, such as gross margin,
encompass the two-way impact of demand and
supply decisions, rather than having separate and
unrelated metrics for each.”
Maha Muzumdar and John Fontanella, “The Secrets to S&OP Success” (Supply
Chain Management Review, Aberdeen Group, April 2006).

63
What We’ll Cover
• Manufacturing flows available in SAP
• Key differences in the repetitive and discrete environments
• Connecting with the strategic focus of the business
• Planning strategies within the integrated supply chain
• Foundational dynamics for capacity planning and scheduling
• Governance process to protect supply chain performance
• Competitive priorities to increase upper-quartile performance
• Wrap-up

64
Where to Find More Information
• R. Anthony Inman, “Capacity Planning” (Reference for Business – Encyclopedia of Business, 2nd Edition).
www.referenceforbusiness.com/management/Bun-Comp/Capacity-Planning.html
• Dr. Karl Knapp, “Competitive Priorities” (KarlKnapp.com).
http://karlknapp.com/resources/wikisummaries/supplychain_mgt/competitive_priorities.html
• “Competitive Priorities of Amul” (StudyMode, November 2011).
www.studymode.com/essays/Competitive-Priorities-Of-Amul-853488.html
• Mike Herald, “Systematically Eliminating Manufacturing Bottlenecks” (First Edge Solutions, September 2012).
www.firstedgesolutions.com/systematically-eliminating-manufacturing-bottlenecks/#!prettyPhoto

65
Where to Find More Information (cont.)
• Richard C. Ling and Walter E. Goddard, Orchestrating Success: Improve Control of the Business with Sales & Operations Planning (Wiley, 1989).
www.amazon.com/Orchestrating-Success-Business-Operations-Planning/dp/0471132276/ref=la_B001KCD3B0_1_1?s=books&ie=UTF8&qid=1425407412&sr=1-1
Book about improving control of the business with sales and operations planning
• Thomas Craig, “3 Issues to Supply Chain Management Success: Supply Chain Process, People, & Technology” (LTD Management, July/August 2003).
www.ltdmgmt.com/072503.asp
• http://en.wikipedia.org/wiki/Sales_and_operations_planning
Wikipedia’s definition for Sales and Operation Planning with reference to APICS
• www.kinaxis.com/en/company/supply-chain-resource-center/supply-chain-whitepapers/
“S&OP for Business Orchestration: Four Requirements for Making the Transformation” (Kinaxis).

66
7 Key Points to Take Home
• Understanding the key differences between manufacturing flows is key to deciding the best application to your business
• Planning strategies control the MTS/MTO/FTO relationships, and your organization should be educated on their use and impact
• Capacity Planning is done in an iterative way, making sure that each department’s resources are considered
• How we stock material to meet the plan and which dates we promise our customers are significantly influenced by the Planning Strategy and ATP checking rules, so these must be chosen carefully
• Strive for an accurate plan. If the schedule deviates from the plan, it may be necessary to correct the plan. Consider how to best control the integration from S&OP to execution to ensure stability in the supply chain based on capacity performance.
• Apply exception management on a daily basis with the objective to reduce exceptions to zero
• Ensure an owner for S&OP with the authority to influence integration and who is accountable to the head of the organization

67
Your Turn!
How to contact me:
Sean Elliffe
Connect with me on LinkedIn
Please remember to complete your session evaluation

68
Disclaimer
SAP and other SAP products and services mentioned herein as well as their respective logos are trademarks or registered trademarks of SAP SE (or
an SAP affiliate company) in Germany and other countries. All other product and service names mentioned are the trademarks of their respective
companies. Wellesley Information Services is neither owned nor controlled by SAP SE.

Wellesley Information Services, 20 Carematrix Drive, Dedham, MA 02026 Copyright © 2015 Wellesley Information Services. All rights reserved.