MAXIMIZATION OF ENERGY GENERATION FROM SMALL HYDROPOWER ...714288/FULLTEXT01.pdf · MAXIMIZATION OF...
50
MAXIMIZATION OF ENERGY GENERATION FROM SMALL HYDROPOWER PLANT IN SRI LANKA A dissertation submitted to the Department of Energy Technology, Royal Institute of Technology, Sweden for the partial fulfillment of the requirement for the Degree of Master of Science in Engineering By Pathiranage Guminda Sanjeewa Priyadarshana 2014 Department of Energy Technology Royal Institute of Technology Stockholm, Sweden
Transcript of MAXIMIZATION OF ENERGY GENERATION FROM SMALL HYDROPOWER ...714288/FULLTEXT01.pdf · MAXIMIZATION OF...

MAXIMIZATION OF ENERGY GENERATION FROM
SMALL HYDROPOWER PLANT IN SRI LANKA
A dissertation submitted to the Department of Energy Technology, Royal Institute of Technology,
Sweden for the partial fulfillment of the requirement for the Degree of Master of Science in Engineering
By
Pathiranage Guminda Sanjeewa Priyadarshana
2014
Department of Energy Technology
Royal Institute of Technology
Stockholm, Sweden

2
MAXIMIZATION OF ENERGY GENERATION FROM
SMALL HYDROPOWER PLANTIN SRI LANKA
By
Pathiranage Guminda Sanjeewa Priyadarshana
Supervised by
OUSL Supervisors:
Dr. N.S. Senanayake& Mr. Ruchira Abeyweera
KTH Supervisors:
Prof. Mark Howells& Mr. Francesco Fuso Nerini

3
Declaration
The work submitted in this thesis is the result of my own investigation, except where otherwise stated.
It has not already been accepted for any other degree and is also not being concurrently submitted for any other degree.
Pathiranage Guminda Sanjeewa Priyadarshana
Date
We/I endorse declaration by the candidate.
Dr. N.S. Senanayaka Prof. Mark Howells& Mr. Ruchira Abeyweera & Mr. Francesco Fuso Nerini
(OUSL Supervisors) (KTH Supervisors)

4
Abstract
Sri Lanka has a number of small waterfalls and channels. Related to this there is a significant
potential to develop small hydropower plants, thus to generate much needed electricity for
country’s development efforts. Small hydro power plants cause less environmental effects
compared to large scale hydro power generation and power generation using fossil fuel.
Therefore, it is a timely requirement to explore the possibilities of utilizing small water streams to
generate electricity as much as possible as well as to optimize the energy generation with the
available water in those water streams. The importance of small hydro power is highlighted in
the Sri Lanka’s energy generation plan, and the Ceylon Electricity Board (CEB) annual report
states that in year 2011 total installed capacity of small hydro plant was around 200MW and it is
expected to expand energy generation to around 800GWh.
This study focuses on finding out optimum operating parameters to maximize the energy
generation of existing small hydro power plant in the country. By selecting a few small hydro
power plants, preliminary studies were performed to identify optimum values of water flow rate
to maximize the efficiency of the power generation. The study revealed that the selected plants
had not operated at the maximum efficiency; hence they did not optimally utilize the available
water.

5
Acknowledgments
I would like to express my sincere gratitude to Professor Torsten H. Fransson Head, Department
of energy technology for expanding the DSEE Programme to Sri Lanka and pave the way for us
to explore the world of sustainable energy engineering. I am really grateful to Professor Mark
Howells and Mr. Francesco Fuso Nerini for their unwavering guidance, support towards
successful research activity.
I specially thank my local supervisors, Dr. N.S. Senanayaka and Mr. Ruchira Abeyweera for their
unwavering guidance, support and advice for carrying out this research work successfully. I am
also very appreciative for their extensive help in fulfillment of some publications related to this
research work, in some prestigious international forums.
I am indebted to my parents, wife and son for constant support and encouragement for
successfully carrying out this work. My gratitude also due to all academic staff of Open
University Sri Lanka, all academic staff of KTH Sweden and Sri Lanka Sustainable Energy
Authority for the support given with my studies.
I have been assisted extensively by Mr. Asela, Mr. Manjula Wickramathilaka in obtaining required
measurements and data for the research activity which I should greatly appreciate. Finally, my
thanks go to various other personnel without whose help this work wouldn’t be a success.
Understandably, their individual names cannot be mentioned here due to being large in number.

6
Table of contents
Declaration ....................................................................................................................................................3
Abstract ………………………………………………………………………………………...4
Acknowledgement………………………………………………………………………...…….5
Abbreviation..................................................................................................................................................7
List of figures…………………………………………………………………...........................…8
List of tables………………………………………………………………………………….…9
1 Introduction……………………………………………………………………..………..10
1.1 Litterature survey .......................................................................................................................10
1.2 Hydropower sector in Sri Lanka..............................................................................................15
2 Problem formulation and objectives...............................................................................................22
3 Method ................................................................................................................................................23
4 Analysis of Data………………………………………………………………………......25
4.1 Data collected from Ella Pita Ella Small hydro plant ……………………………...………..25
4.2 Data collected from Kebilladowa Small hydro plant……………………………...…………...25
4.3 Data collected from Watawala Small hydro plant ………………………...………………....26
4.4 Electrical power – flow rate curves………………………………………………………... 26
4.5 Turbine efficiency – flow rate curves…………………………………………………….... 27
4.6 Maximum energy from the available water……………………………………………….... 30
4.6.1 Kebilladowa Plant……………………………………………………….... 30
4.6.2 Watawala Plant…………………………………………………….…….. 33
5 Conclusions and future work ...........................................................................................................35
References ...................................................................................................................................................37
Annexure A: Rain fall data of Nuwara Eliya (1981-2011)……………………………………...38
Annexure B: Rain fall data of Watawala (1993-2012)…………………………………………..39
Annexure C: US 300PM Protable Ultrasonic Flow Meter Catalogue…………………………..40
AnnexureD: US 300PM Protable Ultrasonic Flow Meter – Photogrphs of Flow Measurements
at Ella Pita Ella Small Hydro Power Plant……………………………...………………………50

7
Abbreviation
g
Q
H
a
P
T
CEB
MHPP
SHPP
SLSEA
DMSL
Overall efficiency
Gravitational Constant
Water flow Rate
Water head
Constant
Generator electric power output
Time period of operation at optimum condition
Ceylon Electricity Board
Mini hydro power plant
Small hydro power plant
Sri Lanka Sustainable Energy Authority
Department of Meteorology Sri Lanka
Subscripts
n nthelement

8
List of figures
Figure 1.1.1 Original and Degrade Performance curves of turbine……..…………………....…12
Figure 1.1.2 Efficiency curves of typical hydro turbine……………………….…...……….…...13
Figure 1.2.1 CO2 emission data analysis in 2013…………………………...……...……………15
Figure 1.2.2 The electricity generation in CEB…………………………………...……….….…16
Figure 1.2.3 Typical layout of hydro power plant…………………………….……...……..…...17
Figure 4.4 Electrical Power Vs. Average Flow Rate…………………………….……....……....27
Figure 4.5.1 Turbine Efficiency vs. Flow Rate curve for Ella Pita Ella SHPP……………...…28
Figure 4.5.2 Turbine Efficiency vs. Flow Rate curve for Kebilladowa SHPP…………...………….…29
Figure 4.5.3 Turbine Efficiency vs. Flow Rate curve for Watawala SHPP……………..…………......29
Figure 4.6.1.1 Comparison of actual flow rate and optimum flow rate on monthly basis for
Kebilladowa SHPP……………………...………………………………………………….......31
Figure 4.6.1.2 Actual generation of energy and the optimum generation on monthly basis for
Kebilladowa SHPP…………………………………...……………………………………..….32
Figure 4.6.1.3 Loss of generation due to non-operation of the plant at optimum efficiency for
Kebilladowa SHPP………………...……………………………………………………...……32
Figure 4.6.2.1 Comparison of actual flow rate and optimum flow rate on monthly basis for
Watawala SHPP……………………...………………………...……………………………….33
Figure 4.6.2.2 Actual generation of energy and the optimum generation on monthly basis for
Watawala SHPP…………………………………………...……………………...…………….34
Figure 4.6.2.3 Loss of generation due to non-operation of the plant at optimum efficiency for
Watawala SHPP……………………...……………...………………………………………….34

9
List of tables
Table 1.2.1Hydro Power Plant Category ……..………..……………………….………….…15
Table 1.2.2 Total Energy generation Laxapana Complex……..………..…………………….…18
Table 1.2.3 Total Energy generation Mahaweli Complex….……………………………….…...18
Table 1.2.4 Total Energy generation Other Hydro Complex……….………………………..…19
Table 1.2.5 Age analysis of hydropower stations in Sri Lanka…………………………….….…21
Table 4.1 Summary of data from Ella Pita Ella Small Hydro Plant……………...……………....25
Table 4.2 Summary of data from Kebilladowa Small Hydro Plant……………………...……..….25
Table 4.3 Summary of data from Watawala Small Hydro Plant………………...………….……26
Table 4.4 Electrical Power and Average Flow Rate data……………………………………..…26
Table 4.5.1 Summary of overall efficiency calculation for Ella Pita Ella Power Plant…………27
Table 4.5.2 Summary of overall efficiency calculation for Kebilladowa Power Plant……...……27
Table 4.5.3 Summary of overall efficiency calculation for Watawala Power Plant……………..28
Table 4.6.1.1 Details calculation results of Kebilladowa SHPP……...……………………….…31
Table 4.6.2.1 Detail calculation results of Watawala SHPP…………...……………………...…33

10
1 Introduction
The government owned Ceylon Electricity Board (CEB) is the main producer and the provider
of electricity in Sri Lanka. CEB generation divisions consist of sixteen large hydro power plants
totaling to an installed capacity of 1205 MW. As per the annual report of CEB most of them
exceeded their 25 years of operation. The rest of the small hydro power plant is mainly owned by
private power producers. At the same time there are large numbers of rural hydro power projects
which are available most frequently in the area of still not covered by national grid. Hydro power
unit cost is around 1.50 Sri Lanka rupees whereas thermal power generation takes it more than
20.00 Sri Lanka rupees. Therefore effectiveness and improvement of hydro power generation
more effective to national economy of Sri Lanka.
In the backdrop of end of conflict situation that existed for over 30 years, Sri Lanka has is geared
to fast development and the expansion of economic activity. This situation inevitably call for
higher energy demands that the country could not meet unless it focus on new sources as well as
maximizing efficiency of power generation together with sustainable utilization. In this scenario,
hydro power generation has a major role to play, and furthermore with the reach of limit in
exploitation of large hydro power sources, small water streams can make a major impact in
satisfying the demand at affordable costs. Therefore, it is very timely requirement to study the
problems of the present small hydro power plant and research on ways and means to optimize
the energy generation from these resources. In view of searching solutions to this uncertain
situation in the energy sector, this study was undertaken to find out possible means of
maximizing the water potentials in small hydro power generation.
1.1 Literature survey
Hydropower is energy that comes from the force of moving water. The fall and movement of
water is part of a continuous natural cycle called the water cycle. Energy from the sun evaporates
water in the Earth’s oceans and rivers and draws it upward as water vapour. When the water
vapour reaches the cooler air in the atmosphere, it condenses and forms clouds. The moisture
eventually falls to the Earth as rain or snow, replenishing the water in the oceans and rivers.
Gravity drives the water, moving it from high ground to low ground. The force of moving water
can be extremely powerful. Hydropower is called a renewable energy source because the water on

11
Earth is continuously replenished by precipitation. As long as the water cycle continues, we won’t
run out of this energy source [1].
Hydropower has been used for centuries. The Greeks used water wheels to grind wheat into
flour more than 2,000 years ago. In the early 1800s, American and European factories used the
water wheel to power machines. The water wheel is a simple machine. The water wheel is located
below a source of flowing water. It captures the water in buckets attached to the wheel and the
weight of the water causes the wheel to turn. Water wheels convert the potential energy
(gravitational energy) of the water into motion. That energy can then be used to grind grain; drive
sawmills, or pumps water. In the late 19th century, the force of falling water was used to generate
electricity. The first hydroelectric power plant was built on the Fox River in Appleton, WI in
1882. In the following decades, many more hydroelectric plants were built. At its height in the
early 1940s, hydropower provided 33 percent of this country’s electricity. By the late 1940s, the
best sites for big dams had been developed. Inexpensive fossil fuel plants also entered the
picture. At that time, plants burning coal or oil could make electricity more cheaply than hydro
plants. Soon they began to underprice the smaller hydroelectric plants. It wasn’t until the oil
shocks of the 1970s that people showed a renewed interest in hydropower [1].
Devapura Jayasena Wimalasurendra (1874-1953) was a Sri Lankan engineer who played a
prominent role in the establishment of hydropower in Sri Lanka and is known as the "Father of
Hydropower”. Having had his initial proposals on hydro power he constructed the first Ceylon's
small hydro power station in at Blackpool, between Nanu Oya and Nuwara Eliya, to supply
electricity to the Nuwara Eliya town. In 1918 he submitted a paper to the Engineering
Association of Ceylon titled "Economics of Hydro Power Utilization in Ceylon", in it he
proposed the possibility of hydro power from Maskelioya and Kehelgamuoya capable of lighting
100,000 lamps (114.5 MW) and the concept of developing a national grid [2]. With his initiation
Sri Lankan hydro power generation sector was groomed to present condition and Sri Lanka
energy sector has enriched with hydro power generation, approximately it could be higher than
45% of total generation as per the data shown in CEB annual report 2010. Hydro power
contributes around 45% of the national electricity generation in year 2010, whereas wind
contributes less than 1% of total generation [3]. As a renewable energy source it has become
more important economical resource compared to other renewable sources. Hydro power
produces no direct waste and contribution to CO2, green house gasescompared to fossil fuel
plants.At present, all most all hydro potentials available in the country have been utilized for
electricity generation and few remaining are under construction.therefore it is very important to
improve the efficiency of the existing power plants.

12
The performance levels for the turbine design could be identified as three levels such as Installed
Performance Level (IPL), Current Performance Level (CPL) as well as Determination of
Potential Performance Level (PPL). The Installed Performance Level (IPL) is described by the
unit performance characteristics at the time of commissioning. These may be determined from
reports and records of efficiency and/or model testing conducted prior to and during unit
commissioning. The Current Performance Level (CPL) is described by an accurate set of unit
performance characteristics determined by unit efficiency testing, which requires the
simultaneous measurement of flow, head, and power under a range of operating conditions, as
specified in the standards referenced in this document. Determination of the Potential
Performance Level (PPL) typically requires reference to new turbine design information from
manufacturer to establish the achievable unit performance characteristics of replacement turbine.
Turbines installed performance level (IPL) degrade after operating it long time period and ended
up with lower efficiency than design values. As can be seen in figure 1.4 the turbine efficiency
reduce after operating it long time period [7]. According to previous research activity (Figure 1.4)
the Overall efficiency of the turbine was reduced from 90% to 86% approximately during the
period of operation from 1950 to 1985.
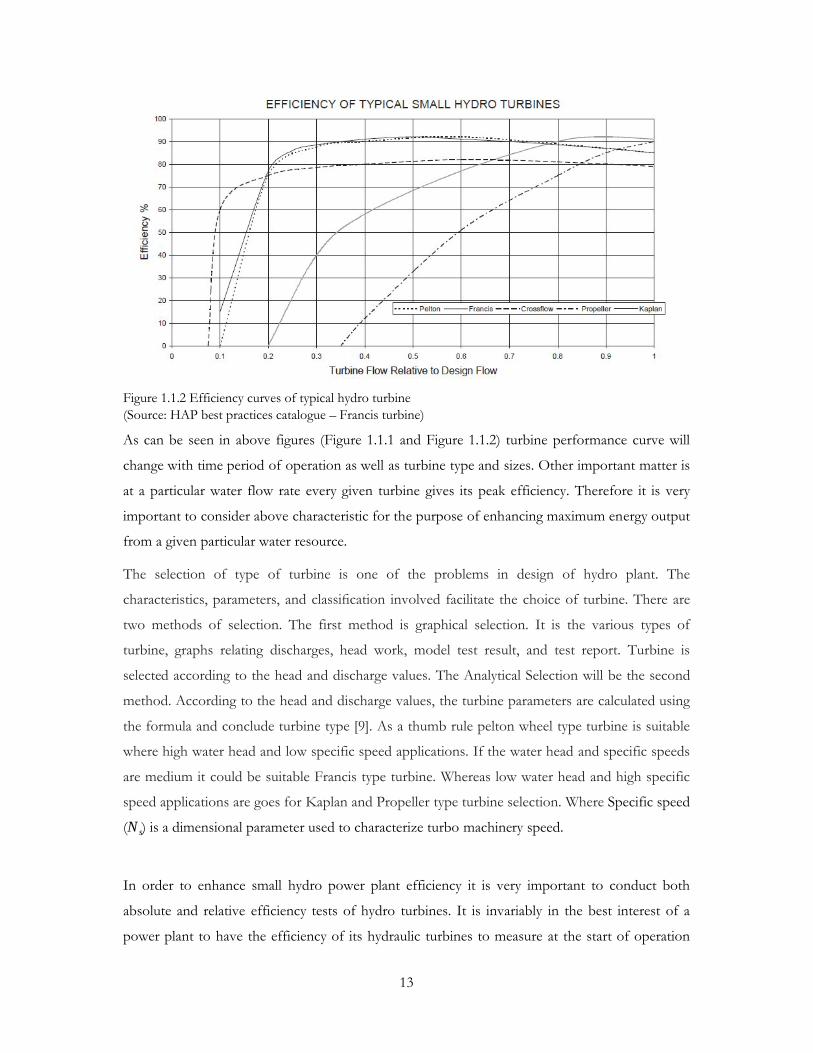
Figure 1.1.1 Original and Degrade Performance curves of turbine(Source: HAP best practices catalogue – Francis turbine)
With the change of turbine size and type efficiency characteristic curves will be differ from one to
another. It could be observed each and every type of turbine has coherent peak efficiency range
at particular flow rate range, It could be seen in figure 1.5 [8].
13
Figure 1.1.2 Efficiency curves of typical hydro turbine(Source: HAP best practices catalogue – Francis turbine)
As can be seen in above figures (Figure 1.1.1 and Figure 1.1.2) turbine performance curve will
change with time period of operation as well as turbine type and sizes. Other important matter is
at a particular water flow rate every given turbine gives its peak efficiency. Therefore it is very
important to consider above characteristic for the purpose of enhancing maximum energy output
from a given particular water resource.
The selection of type of turbine is one of the problems in design of hydro plant. The
characteristics, parameters, and classification involved facilitate the choice of turbine. There are
two methods of selection. The first method is graphical selection. It is the various types of
turbine, graphs relating discharges, head work, model test result, and test report. Turbine is
selected according to the head and discharge values. The Analytical Selection will be the second
method. According to the head and discharge values, the turbine parameters are calculated using
the formula and conclude turbine type [9]. As a thumb rule pelton wheel type turbine is suitable
where high water head and low specific speed applications. If the water head and specific speeds
are medium it could be suitable Francis type turbine. Whereas low water head and high specific
speed applications are goes for Kaplan and Propeller type turbine selection. Where Specific speed
(Ns) is a dimensional parameter used to characterize turbo machinery speed.
In order to enhance small hydro power plant efficiency it is very important to conduct both
absolute and relative efficiency tests of hydro turbines. It is invariably in the best interest of a
power plant to have the efficiency of its hydraulic turbines to measure at the start of operation

14
and subsequently at regular intervals [10]. Normally large type turbines performance is
determined initially in model test and consequently absolute installation and testing. During the
efficiency testing of the turbine it’s normally tested whether the manufacturer recommended
performance have been met, and checking for the adjustments of blades and gate mechanism as
well as the hydraulic governor. In the same time it could obtain information that could be used to
evaluate machine wear and cavitations. Prototype turbine installations always have some
differences from their models which alter their performance characteristics.
The model must be subjected to conditions that would be detrimental to a prototype such as
severe and maximum runway speed [10]. However turbine model test is very important to
identify full performance of the system in actual situation.
There are two basic types of turbine efficiency testing the absolute and the relative. These terms
denotes whether the discharge is measured absolutely or in relation to some other known
parameter. The absolute methods are invariably more complex, expensive and difficult; and are
generally done only once to ensure the contract guarantees have been meat. The discharge water
flow rate measurement will be vital to analyse the current performance of the turbine and the
following techniques methods could be used to measure the water flow rate [10].
1. Gibson Method: The changing the momentum of the fluid column resulting from a load
change is measured to determine the flow rate.
2. Allen Salt Velocity Method: The time for the passage of an injected saline solution two
electrode station is measured to determine the flow rate.
3. Weir Method: A calibrated weir, usually downstream is used to measure discharge.
4. Piezometer Traverse Method: Piezometers are used to determine the velocity profile
which is integrated over the cross-sectional area to determine flow rate.
5. Current Meter Method: Same as the piezometer traverse expect for the use of current
meter instead of piezometers.
6. Sonic Method: Acoustic transducers are used to measure the Doppler or phase shift
between two stations the average flow rate separating the two.
7. Thermodynamic Method: Minute changes in the temperature of the discharge water
compared with the incoming are used to evaluate efficiency.
The relative efficiency testing is comparatively easier than absolute method. For the flow is only
measured relative to or is indexed against some parameter which is a direct function of flow rate.
Almost any parameter will do, such as venturi suction in the penstock or the friction head loss in
a penstock or the centrifugal force of the flow around a bend and so on [10].
15
1.2 Hydro power sector in Sri Lanka
With the increasing electricity demand, Sri Lanka has to think about efficiency improving of the
existing hydro power plants or implementing new thermal power plants with comparatively
higher cost and higher environment effects. Presently Sri Lanka has implemented 300 MW of
coal power plant in Puttalam area, and idea is to extend coal power Generation Island wide. As
can be seen in figure 1.1, coal power plants and other thermal generation create more
environmental adverse effects compare with small & lager hydropower plants. On the other hand
power generation cost per is very high in thermal power generation compared with hydro power
generation. As per the Ceylon Electricity Board (CEB) data in year 2010, power generation cost
per one unit of energy (kWh) for hydro Rs. 1.17 whereas thermal generation it’s goes up to Rs.
15.77.
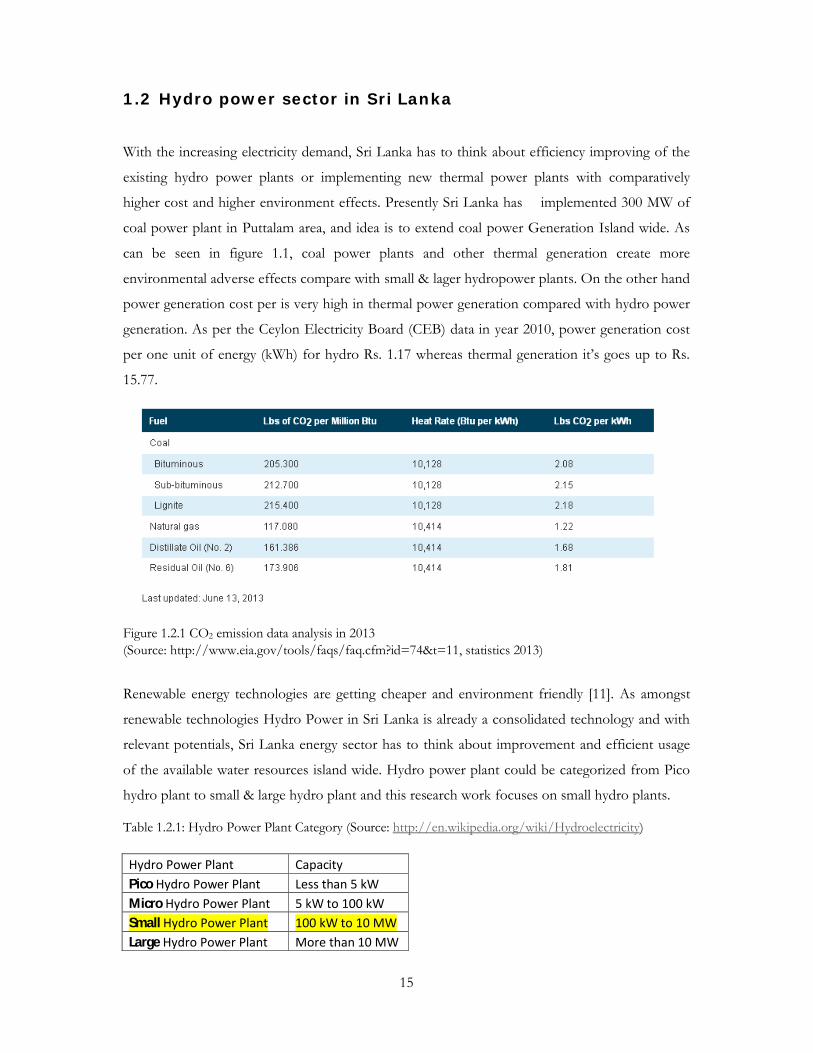
Figure 1.2.1 CO2 emission data analysis in 2013(Source: http://www.eia.gov/tools/faqs/faq.cfm?id=74&t=11, statistics 2013)
Renewable energy technologies are getting cheaper and environment friendly [11]. As amongst
renewable technologies Hydro Power in Sri Lanka is already a consolidated technology and with
relevant potentials, Sri Lanka energy sector has to think about improvement and efficient usage
of the available water resources island wide. Hydro power plant could be categorized from Pico
hydro plant to small & large hydro plant and this research work focuses on small hydro plants.
Table 1.2.1: Hydro Power Plant Category (Source: http://en.wikipedia.org/wiki/Hydroelectricity)
Hydro Power Plant CapacityPico Hydro Power Plant Less than 5 kWMicro Hydro Power Plant 5 kW to 100 kWSmall Hydro Power Plant 100 kW to 10 MWLarge Hydro Power Plant More than 10 MW

16
Most of the large scale power plants are owned and operated by CEB whereas Pico, Micro and
small hydro plants are most probably owned and operated by private companies. As can be seen
in figure 1.2, reasonably higher contribution of energy generation is come from hydro power
plant in Sri Lanka.
Figure 1.2.2 The electricity generation in CEB(Source: CEB annual report 2010)
Micro or small hydro, wind, biomass and solar are the main renewable sources capable of
offering a sustainable contribution to the Sri Lanka’s electricity generation apart from large scale
hydro power generation. Penetration of renewable energy to the electricity generation sector has
been extremely limited by the various constraints such as lack of investment, attitudes,
technology and management of resources. However, during the recent past some interest has
been shown in the construction of small-hydro plants due to its relatively low capital investment
and greater opportunities for grid connection [4].
In general small hydro power plant electrical power output range from 100kW to 10 MW. Since
the most suitable source of energy generation to Sri Lanka would be hydro power this research
activity mainly focus to enhance hydro power generation. Therefore, it is essential to obtain the
maximum capacity from the existing plants by improving the efficiency as much as possible. As

17
can be seen in figure 1.3 the major components of hydro power plant could be identified as water
diversion & screens, pipe line (penstock line), turbine and generator set, tailrace as transmission
line. Therefore hydro power plant efficiency will be depended on friction effects of pipelines,
internal blocking of flow path as well as turbine generator set efficiency.
Figure 1.2.3 Typical layout of hydro power plant(Source: An introduction to hydro power concepts and planning, a publication of canyon hydro)
Mahaweli Hydro complex, Laxapana Hydro Complex and Other Hydro Complexes contributes
40% of the total requirement to the national energy supply while the rest is coming from thermal
Power, mainly diesel and coal. Laxapana Power Complex, having a total installed capacity of
335MW, comprises of five main generating stations at four locations. These include the first
major hydro power station in Sri Lanka, i.e. Old Laxapana Generating Station, which was built
on a pioneering proposal of the visionary engineer, late Mr. D.J. Wimalasurendra. These Power
Stations are situated in cascade in two contributory streams of Kelani River; Wimalasurendra and
Old Laxapana plants fed by KehelgamuOya, and Canyon and New Laxapana Plants fed by
MaskeliyaOya, while Samanala PowerStation at Polpitiya is finally supplied with water from both
these streams. The total Power Generation of the Laxapana Complex was 1,779.5 GWh during
the year 2010, which accounts for 17.8% of the total generation of the network.
18
Table 1.2.2: Total Energy generation Laxapana Complex
(Source: Ceylon Electricity Board, Generation data 2010)
Mahaweli Complex will be the next hydro power scheme which comprises of Kotmale, Victoria,
Randenigala, Rantambe, Ukuwela, Bowatanna and Nillambe Power Stations. The total installed
capacity of the Complex is 666 MW. Mahaweli Complex had generated 2,445 GWh during the
year 2010, which accounts for 22.8% of the total generation of the network. In addition to the
planned maintenance activities of power stations, replacement of the defective excitation system
with Brushless Excitation of two generators at Kotmale Power Station, and the Procontic
Control System at Randenigala Power Station were in progress during the year.
Table 1.2.3: Total Energy generation Mahaweli Complex(Source: Ceylon Electricity Board, Generation data 2010)
Other than the main complexes few hydro power plants are taking in to consider as other hydro
complex which is comprises of Samanalawewa, Kukule, Inginiyagala, and Udawalawe hydro
power stations and Hambantota Wind Power Station. The installed capacity of the Complex is
213 MW. Other Hydro Complex generated 767 GWh during the year 2010, which accounts for
7.2% of the total generation of the network. It is to note that the operating patterns of
Inginiyagala and Udawalawe are solely dependent on the irrigation water releases, and hence the
low plant factors attributed to these stations.

19
Table 1.2.4: Total Energy generation Other Hydro Complex(Source: Ceylon Electricity Board, Generation data 2010)
Ukuwella power station, Old Laxapana and New Laxapana hydro power plants are already exceed
their life span more than 25 year and CEB has plan to rehabilitate them in order to enhance
efficiency of the system. CEB entered into a contract with consortium of Mitsubishi Corporation,
Japan and Indo East Engineering and Construction (Lanka) Pte Ltd for rehabilitation works of
Ukuwela Power Station, initially commissioned in 1976. Under this rehabilitation project,
Turbines, Generators and their associated equipment will be replaced and/or rehabilitated in
order to achieve better efficiency and reliability of the plant at a total cost of Rs. 1,800.0 million.
About 85% of this cost is funded by the JBIC on export credit basis and the Loan Agreement
between Ministry of Finance and JBIC was signed in February 2008. In terms of the Agreement,
the Contract is in force from April 2008, and the works will be completed by the end April 2011
and presently work has completed. Under Laxapana Power plant rehabilitation project, 2 x 50
MW New Laxapana and 2 x 25 MW Wimalasurendra Power Plants will be refurbished and
modernized. Under this contract, the Generator, Turbine Control and Auxiliaries will be
rehabilitated or replaced at a cost of Rs. 6,500 million.
Alstom Hydro France is the contractor for project and 85% of the contract value is provided by
Credit Agricole CIB, France on Export Credit terms and balance 15% is funded by Hatton
National Bank. The Project works started in February 2008 and completed during year 2013.
34Most of hydro power plants in Sri Lanka where constructed and put into operation more than 20
years ago and now they are having long period of operation time. Since the long period of
operation, turbine performance may change with their original condition. Therefore the research
activity mainly focuses on overall efficiency of turbine generator set. Electricity generation sector
of Sri Lanka has higher potential of sustainable energy development and improvement. As far
concern about sustainable energy sources, small hydro, wind and biomass would play vital role.

20
Small hydro power is one of the most efficient and well elaborated kinds of renewable sources of
energy [5].
According to CEB annual report data during the year 2010, four wind power projects of total
capacity 30 MW have been connected to the grid. The total generation was 50 GWh. By the end
of the year, CEB has entered in to 8 Standardized Power Purchase Agreements (SPPA) for an
aggregate capacity of 119MW. SPPA's have been signed for 8 plants of total capacity 92MW. The
construction of some of the above wind plants are in progress. Biomass will be the next
alternative renewable energy source in Sri Lanka. Biomass Power plants consist of three main
categories such as Dendro, Municipal Waste and Agricultural and Industrial Waste. With regard
to Biomass Power Projects, there are two Agricultural and Industrial waste power plants of total
capacity of 11MW have been connected to the grid. The total generation was 32GWh and the
same for the year 2009 was 23GWh. By the end of the year, CEB has entered in to 08
Standardized Power Purchase Agreements (SPPA) for an aggregate capacity of 37MW.
During the year 2010, three small hydro power projects of total capacity 3.7 MW were connected
to the grid. The total grid-connected installed capacity of 84 small hydro power plants reached
170 MW by the end of the year. The total energy generated by these was 642 GWh and for the
year 2009 the corresponding amount was 524 GWh. By the end of 2010, CEB has entered in to
61 Standardized Power Purchase Agreements for an aggregate capacity of 119MW [3].
According to above literatures Sri Lanka energy sector mainly enrich with hydro power and it
contribute more than 45% of total requirement. Electricity generated in three major hydropower
complexes such as Mahaweli Hydro complex, Laxapana Hydro Complex and Other Hydro
Complexes contributes 40% to the national energy supply while the rest is coming from thermal
power, mainly diesel and coal. Hence, obtaining the maximum possible share from hydropower
has the potential of giving overall benefits to the national economy. In order to enhance hydro
power generation CEB has initiated few rehabilitation projects as well as new construction
project such as rehabilitation project of Ukuwela power station, rehabilitation project of new &
old Laxapana power station, construction projects of Upper Kotmale and Broadland power
station etc.

21
Table 1.2.5: Age analysis of hydropower stations in Sri Lanka(Source: Ceylon Electricity Board, Generation data 2010)
Name of the Station Installed Capacity (MW)
Commissioned year Age (years)
InginiyagalaNorton UdawalaweOld LaxapanaPolpitiyaUkuwelaBowatennaNew LaxapanaCanyonKotmaleVictoriaSamanalawelaRandenigalaNilambeRantambeKukule
11.2550650754040100602012101201223.25070
1950195019551955196019761981198419841985198519851986198819902002
65656060503429262625252524222008
As per the data collected from CEB, around 95% of existing hydro power plants in Sri Lanka
have passed the 25 year limit of their life span and previous research activities proves efficiency
deviation with the operating time periods [6]. With the existing energy demand Sri Lanka is not in
a situation to replace old-hydro power plants, within a short period and also its energy
production is mainly depends on hydropower. Age analysis of the hydropower plants in Sri
Lanka is shown in Table 1.
Therefore, it is essential to obtain the maximum capacity from the existing plants by improving
the efficiency as much as possible. As can be seen in figure 1.3 the major components of hydro
power plant could be identified as water diversion & screens, pipe line (penstock line), turbine
and generator set, tailrace as transmission line. Therefore hydro power plant efficiency will be
depended on friction effects of pipelines, internal blocking of flow path as well as turbine
generator set efficiency.

22
2 Problem formulation and objectives
This research activity mainly focuses on overall efficiency of turbine generator set. Since the most
of hydro power plants in Sri Lanka have passed 25 years limit of their life span, field performance
testing of hydraulic turbine is required to find head, power, flow rate relationship which identify
the turbine’s peak operating point [6].
As per the literature review it was identified that turbines performance level goes down with the
time periods of operation. Most of the hydro power plants of Sri Lanka had installed more than
25 years ago. Therefore turbines efficiency and performance could be change from its original
value and optimum level of operation may not be come in to play in present operation condition.
Therefore this research activity is aiming to find out optimum level of operation and possible
extra energy harness from existing water resources.
The objective of this research activity can be listed down as follows:
To identify operation difficulties of small hydro power plants that result in reduction
of total energy generation in Sri Lanka.
Establish operating conditions or operating pattern of small hydro power plant that
will give maximum energy output.

23
3 Method
Three small hydro plants were selected as a sample for the study. These were namely Ella Pita
Ella, Kebilladowa and Watawala. The flow rates were measured at different power outputs for
each plant. The efficiency was computed at different flow rates to obtain the efficiency variation
with the flow rate. The Ella Pita Ella small hydro power plant was analyzed only for the
observation of efficiency & flow rate characteristic curve. Then it could extend for other small
hydro plant which has little bit higher installed capacities.
The flow velocity was measured with the simple float method using plastic ball without rope.
When the measurements were taken the power generation of the plant was adjusted by
controlling the flow rate. Also channel width and flow height were measured to determine the
volume flow rate.
The turbine efficiency was calculated using the following formula for different measured values
of the electrical power output.
Where
Turbine efficiency values were plotted against the flow rate to obtain the efficiency-flow
characteristic curve for each plant.
The actual monthly average flow rates available from past records were used to determine the
volume of water consumed in each month.

24
In the computation, it was assumed that the plant is in operation 24h day and all days in a month.
Then, the number of hours (T) for utilizing this amount of water at maximum efficiency is
determined by dividing Va by the optimum flow rate (Qopt) corresponding to the maximum
turbine efficiency which is obtained from the efficiency -flow characteristic curve for each plant.
The energy (Eopt), which could be generated by operating the plant for time T was calculated by
using the following equation.
In the same manner, the actual energy (Ea) generated in the particular month was calculated using
the following formula for comparison with Ea.

25
4 Analysis of data
4.1 Data collected from Ella Pita Ella Small hydro plant:
Installed capacity -600 kW Cross flow type turbine
Penstock line Diameter = 30 cm H- Head (m) = 70 m
Table 4.1 – Summary of data from Ella Pita Ella Small Hydro Plant
Power (kW) Flow(m3/h)(Test 1)
Flow(m3/h)(Test 2)
Flow(m3/h)(Test 3)
Flow(m3/h) (Average)
100 820 770 890 827
200 1490 1500 1500 1497
300 2140 2170 2190 2167
400 2840 2820 2940 2867
500 3730 3620 3780 3710
600 4840 4850 4800 4830
4.2 Data collected from Kebilladowa Small hydro plant:
Installed capacity -900 kW Pelton wheel type turbine
Penstock line Diameter = 35 cm H- Head (m) = 145 m
Table 4.2 – Summary of data from Kebilladowa Small Hydro Plant
Power (kW)Flow(m3/h)
(Test 1)Flow(m3/h)
(Test 2)Flow(m3/h)
(Test 3)Flow(m3/h) (Average)
100 360 371 382 371
200 682 685 682 683
300 950 975 985 970
400 1245 1280 1285 1270
500 1600 1620 1622 1614
600 2063 2098 2094 2085
700 2505 2525 2518 2516
800 2900 2925 2950 2925
900 3250 3320 3375 3315

26
4.3 Data collected from Watawala Small hydro plant:
Installed capacity -1MWx2 Turgo Impulse type turbine
Penstock line Diameter = 40 cm H- Head (m) = 98 m
Table 4.3 – Summary of data from Watawala Small Hydro Plant
Power (kW) Flow(m3/h)(Test 1)
Flow(m3/h)(Test 2)
Flow(m3/h)(Test 3)
Flow(m3/h) (Average)
100 745 738 740 741
200 1376 1398 1360 1378
300 1900 1938 1940 1926
400 2370 2390 2359 2373
500 2710 2752 2740 2734
600 3082 3070 3076 3076
700 3652 3640 3637 3643
800 4241 4230 4231 4234
900 4886 4826 4856 4856
1000 5393 5441 5402 5412
4.4 Electrical power – flow rate curves
Table 4.4 Electrical Power and Average Flow Rate data
Electrical Power (kW)
Flow(m3/h) (Average)
Ella Pita Ella Kebilladowa Watawala
100 827 371 741200 1497 683 1378300 2167 970 1926400 2867 1270 2373500 3710 1614 2734600 4830 2085 3076700 - 2516 3643800 - 2925 4234900 - 3315 4856
1000 - - 5412
27
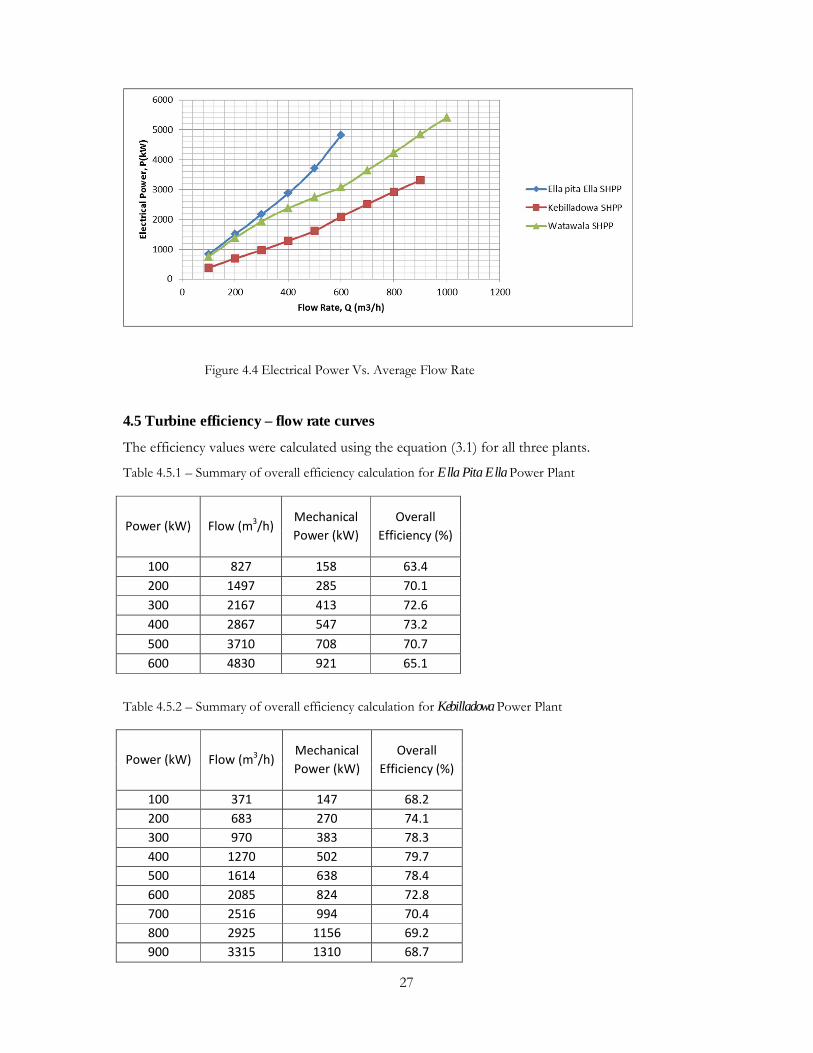
Figure 4.4 Electrical Power Vs. Average Flow Rate
4.5 Turbine efficiency – flow rate curves
The efficiency values were calculated using the equation (3.1) for all three plants.
Table 4.5.1 – Summary of overall efficiency calculation for Ella Pita Ella Power Plant
Power (kW) Flow (m3/h)Mechanical Power (kW)
Overall Efficiency (%)
100 827 158 63.4200 1497 285 70.1300 2167 413 72.6400 2867 547 73.2500 3710 708 70.7600 4830 921 65.1
Table 4.5.2 – Summary of overall efficiency calculation for Kebilladowa Power Plant
Power (kW) Flow (m3/h)Mechanical Power (kW)
Overall Efficiency (%)
100 371 147 68.2200 683 270 74.1300 970 383 78.3400 1270 502 79.7500 1614 638 78.4600 2085 824 72.8700 2516 994 70.4800 2925 1156 69.2900 3315 1310 68.7

28
Table 4.5.3 – Summary of overall efficiency calculation for Watawala Power Plant
Power (kW) Flow (m3/h)Hydraulic
Power (kW)Overall
Efficiency (%)
100 741 197.88 50.5200 1378 367.99 54.3300 1926 514.34 58.3400 2373 633.71 63.1500 2734 730.11 68.5600 3076 821.45 73.0700 3643 972.86 72.0800 4234 1130.69 70.8900 4856 1296.79 69.4
1000 5412 1445.27 69.2
Figure 4.5.1 Turbine Efficiency vs. Flow Rate curve for Ella Pita Ella SHPP
Maximum point:
Turbine Efficiency, ηt =73.3%
Flow Rate, Q (m3/h) =2700

29
Figure 4.5.2 Turbine Efficiency vs. Flow Rate curve for Kebilladowa SHPP
Maximum point:
Turbine Efficiency, ηt =79.9%
Flow Rate, Q (m3/h) =1270
Figure 4.5.3 Turbine Efficiency vs. Flow Rate curve for Watawala SHPP
Maximum point:
Turbine Efficiency, ηt =73%
Flow Rate, Q (m3/h) =3076

30
4.6 Maximum energy from the available water
4.6.1 Kebilladowa Plant
The maximum or optimum energy generation from the available water in each month calculated
using the equations 3.2, 3.3 and 3.4. The following is the sample calculation carried out for the
Kebilladowa plant for month of January.
Water volume
No. of hours for utilizing this amount of water at optimum flow of 1270m3/h = T
Actual efficiency is taken from the Efficiency Vs. flow rate curve in Fig 4.5.2.
Actual Energy
Energy at optimum operating condition,

31
Table 4.6.1.1 below gives the calculated values for and for all months. Figure 4.6.1.1
compares the actual flow with the optimum flow rate in order to achieve the maximum
efficiency. Also Figure 4.6.1.2 and Figure 4.6.1.3 illustrate the variations of month actual energy
with the optimum values and the “losses” or water energy not converted to electrical energy
respectively.
Table 4.6.1.1 Details calculation results of Kebilladowa SHPP
Month Qa (m3/h) Va(m3) T (h) ηa Ea(GWh)Eopt
(GWh)
loss
(GWh)
January 3104.73 2235405.6 1760.16189 0.69 0.609 0.707 0.097
February 1929.2 1389024 1093.719685 0.74 0.406 0.439 0.033
March 179.25 129060 101.6220472 0.67 0.034 0.041 0.007
April 1483.73 1068285.6 841.1697638 0.79 0.333 0.338 0.004
May 385.06 277243.2 218.3017323 0.68 0.074 0.088 0.013
June 128.01 92167.2 72.57259843 0.66 0.024 0.029 0.005
July 801.55 577116 454.4220472 0.77 0.176 0.182 0.007
August 153 110160 86.74015748 0.66 0.029 0.035 0.006
September 761.87 548546.4 431.9262992 0.72 0.156 0.173 0.017
October 2382.15 1715148 1350.510236 0.71 0.481 0.542 0.061
November 1752.75 1261980 993.6850394 0.77 0.384 0.399 0.015
December 937.76 675187.2 531.6434646 0.78 0.208 0.213 0.005
Figure 4.6.1.1 Comparison of actual flow rate and optimum flow rate on monthly basis for Kebilladowa SHPP
Optimum flow rate, 1270m3/h

32
Figure 4.6.1.2 Actual generation of energy and the optimum generation on monthly basis for Kebilladowa SHPP
Figure 4.6.1.3 Loss of generation due to non-operation of the plant at optimum efficiency for Kebilladowa SHPP

33
4.6.2 Watawala Plant
Similar calculations as for the Kebilladowa plant carried out for the Watawala plant and results are
given in the Table 4.6.2.1.
Table 4.6.2.1 Detail calculation results of Watawala SHPP
Month Q a (m3/h) Va(m3) T (h) ηa Ea(GWh)Eopt
(GWh)
loss
(GWh)
January 2880.19 2073736.8 674.16671 0.70 0.388 0.443 0.055
February 1936.87 1394546.4 453.3635891 0.58 0.216 0.298 0.082
March 1039.14 748180.8 243.2317295 0.52 0.104 0.160 0.056
April 5188.45 3735684 1214.461638 0.69 0.688 0.798 0.110
May 5037.95 3627324 1179.23407 0.69 0.668 0.775 0.107
June 4984.96 3589171.2 1166.830689 0.69 0.661 0.767 0.105
July 5375.02 3870014.4 1258.13212 0.69 0.713 0.827 0.114
August 4569.23 3289845.6 1069.520676 0.70 0.615 0.703 0.088
September 5592.18 4026369.6 1308.962809 0.69 0.742 0.860 0.118
October 2662.95 1917324 623.3172952 0.67 0.343 0.410 0.067
November 2275.63 1638453.6 532.6572172 0.61 0.267 0.350 0.083
December 994.87 716306.4 232.8694408 0.52 0.099 0.153 0.054
Figure 4.6.2.1 Comparison of actual flow rate and optimum flow rate on monthly basis for Watawala SHPP

34
Figure 4.6.2.2 Actual generation of energy and the optimum generation on monthly basis for Watawala SHPP
Figure 4.6.2.3 Loss of generation due to non-operation of the plant at optimum efficiency for Watawala SHPP

35
5 Conclusions and futurework
Sri Lanka relies mainly on hydro power and thermal power that utilizes imported fossil fuels.
According to the CEB annual report 2010, in that year the hydro power generation was 5720
GWh and thermal power generation was 4955 GWh. The research has shown that hydro power
generation using large rivers is limited, and by now Sri Lanka has utilized all such possibilities.
This situation naturally leads to thermal power as a convenient alternative, but with high cost in
the backdrop of ever increasing fuel prices. By the mid of 2011 Sri Lanka has commissioned and
commercially startup first ever coal power plant in puttalam area with the collaboration of
Chinese government. The number of Thermal power plant increasing means more adverse effect
on economy as well as socio environmental conditions of Sri Lanka. The next option available is
to explore the renewable energy sources like solar, wind and biomass, and micro or small hydro
power generation using small streams of water ways. Apart from renewable energy sources such
as solar and wind, small hydro power generation is one of the promising renewable energy
sources to be explored in the country with the reaching of maximum utilization of hydro power
generation using large rivers. It has been identified that about 600 small scale hydro power plants
capable of adding about 500MW of power to the national grid are available in the country [4]. On
the other hand existing power plant performances have to check and using possible methods it
should improve to enhance energy output from a particular water resource.
In a recent study carried out to determine the performance of Small hydro power plants in the
country revealed that they did not reach the expected targets. According to the findings of
previous researchers, major issues which severely affected the plant performance were found to
operational issues and the improper or lack of maintenance. In design stage faults also
contributed to reduced generation capacity as well [4]. The objective of the research activity was
to investigate selected Small hydro power plants to determine the actual performance and the
possibilities of improvements. Three Small hydro plants were selected for the study.
According to the literature review findings Electricity generation sector of Sri Lanka enrich with
substantially higher amount of hydro power generation. Ceylon Electricity Board and Sri Lanka
government further planned to extend hydro power generation with the aids of foreign countries
like Japan and China. On the other hand most of the existing hydro power plant in Sri Lanka
exceeds more than 25 years of their life span and their performance level differ from original
design condition. In order to find out their optimum operating conditions power plant authorities
may have to perform actual testing work with some analysis.

36
Hydro power plants of Sri Lanka vary from Pico hydro power station (Up to 10 kW) to large
scale hydro power station (Above 10 MW). Here this research activity mainly focuses on Small
hydro power plants and with the measurements taken during actual operating condition possible
energy saving was calculated. Based on the results Kebilladowa Small hydro power plant and
Watawala Small Hydro Plants have potential to improve energy extraction up to 5% ~10% from
annual generation. This would however require additional costs for the improvement of water
storage capabilities in the evaluated case studies.
With a proper utilization of water resources by means of storage system there is possibility to
improve hydro power sector efficiency. This type of interventions could help avoiding the
requirement of new thermal power plant installation. 1kWh of thermal energy generation
replacement by renewable energy means it’s reduces 2 lbs CO2 emission to the environment (As
can be seen in figure 1.2.1). In order to enhance green technology and make human friendly
environment these research findings could be helpful to the Sri Lanka.

37
References
[1] http://www.need.org/needpdf/infobook_activities/SecInfo/HydroS.pdf (01/09/2013)
[2] http://en.wikipedia.org/wiki/D._J._Wimalasurendra (01/09/2013)
[3] Ceylon Electricity Board Annual Report 2010.
[4] D.H.G.S.R. Somasundara, A.M.A.J. Abeywardana, I.U. Attanayake and N.S. Senanayake
“Problems associated with mini hydro power plants for successful operation- a case study in
Sri Lanka”.
[5] Blyashko, Ya. I. Modern Trends in the Development of Small Hydro Power around the
World and in Russia, Thermal Engineering, 2010, Vol. 57, No. 11, pp. 953 – 960.
[6] Jessica Brandt and Jay Doering, Towards of improved model for predicting hydraulic
turbine efficiency, University of Manitoba.
[7] HAP best practices catalogue – Francis turbine, Prepared by MESA ASSOCIATE INC,
Chattanooga.
[8] Short-cut design of small hydroelectric plants, N.G. Voros, C.T. Kiranoudis and Z.B.
Maroulis, Department of Chemical Engineering, National Technical University of Athens,
Polytechnioupoli,Zografou,Athens.
[9] M. Borota, Mini Hydro Power Plants—Green Power for Users, Directorate for Water
Management , Ministry of Agriculture, Forestry and Water Management, MeritaBorota,
Serbia, 2008.
[10] L.H. Sheldon, “Field testing and optimizing efficiency of hydro turbines”, water power &
Dam Construction January 1982.
[11] http://en.wikipedia.org/wiki/Renewable_energy (20/02/2014)

38
Annexure A: Rain fall data of Nuwara Eliya (1981-2011)
Source: Department of Meteorology Sri Lanka

39
Annexure B: Rain fall data of Watawala (1993-2012)
Source: Department of Meteorology Sri Lanka
YEAR JAN FEB MAR APR MAY JUN JUL AUG SEP OCT NOV DEC
1993 0.0 47.8 NA 219.6 1016.5 1505.6 845.0 484.2 218.8 1101.1 424.2 326.21994 91.8 149.2 28.4 312.6 646.7 410.5 707.2 508.1 481.1 854.6 235.6 35.61995 NA NA NA 610.5 776.6 1187.3 NA NA NA NA NA NA1996 161.7 135.7 22.3 300.0 100.9 503.7 714.3 856.8 1054.0 515.6 171.5 89.92002 NA 54.3 191.4 951.3 810.9 744.6 633.5 509.1 102.0 598.3 322.6 762.52003 226.9 40.3 349.2 636.3 786.8 385.9 652.3 669.5 676.8 381.7 327.8 44.92004 26.0 34.1 108.3 570.3 824.4 753.7 555.1 304.6 448.4 582.2 216.3 189.02005 77.1 124.6 261.9 184.6 216.5 746.5 1169.5 649.3 697.3 1133.9 962.7 358.02006 152.3 47.5 302.0 205.6 571.8 584.6 465.5 350.4 184.7 425.7 470.9 106.92007 96.4 123.7 123.5 423.8 315.0 428.0 501.0 436.0 586.0 626.0 384.0 84.02008 71.0 221.0 494.0 776.0 481.0 405.0 687.0 NA 294.0 732.0 390.0 135.02009 4.0 21.0 334.0 192.0 878.0 632.0 448.0 414.0 628.0 450.0 346.0 314.02010 58.0 24.0 154.0 410.0 854.0 909.0 728.0 731.0 485.0 619.0 556.0 472.02011 271.0 199.0 132.0 495.0 874.0 516.0 512.0 440.0 488.0 232.0 190.0 90.02012 22.7 NA NA 266.5 114.9 374.7 481.4 438.8 NA 576.9 NA NA
Avg 96.8 94.0 208.4 436.9 617.9 672.5 650.0 522.4 488.0 630.6 384.4 231.4
NA- Not Available

40
Annexure C: US 300PM Protable Ultrasonic Flow Meter Catalogue

41

42

43

44

45

46

47

48

49

50