Maximising value through multichannel marketing · multichannel. When you get there, you experience...
26
Maximising value through multichannel marketing Serge Milbank, Stream:20
Transcript of Maximising value through multichannel marketing · multichannel. When you get there, you experience...
Maximising value through multichannel marketing
Serge Milbank, Stream:20
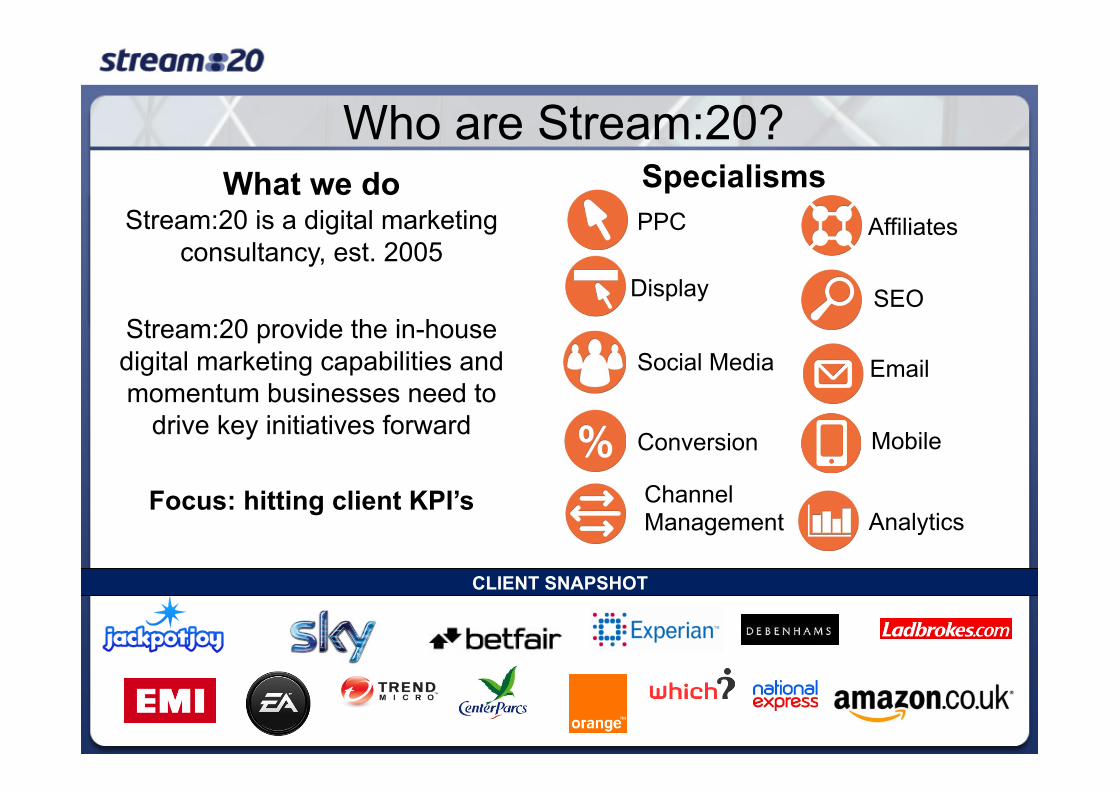
Who are Stream:20? Specialisms
Affiliates
SEO
Channel Management
PPC
Display
Conversion
Social Media
What we do Stream:20 is a digital marketing
consultancy, est. 2005
Stream:20 provide the in-house digital marketing capabilities and momentum businesses need to
drive key initiatives forward
Focus: hitting client KPI’s Analytics
Mobile
CLIENT SNAPSHOT

What do we call Multichannel?
Retail
Affiliates
PPC
SocialDisplaySEO
EmailWeb
Call
Cent
re
AffiliatesPPC
Social
Display
SEO
Mobile
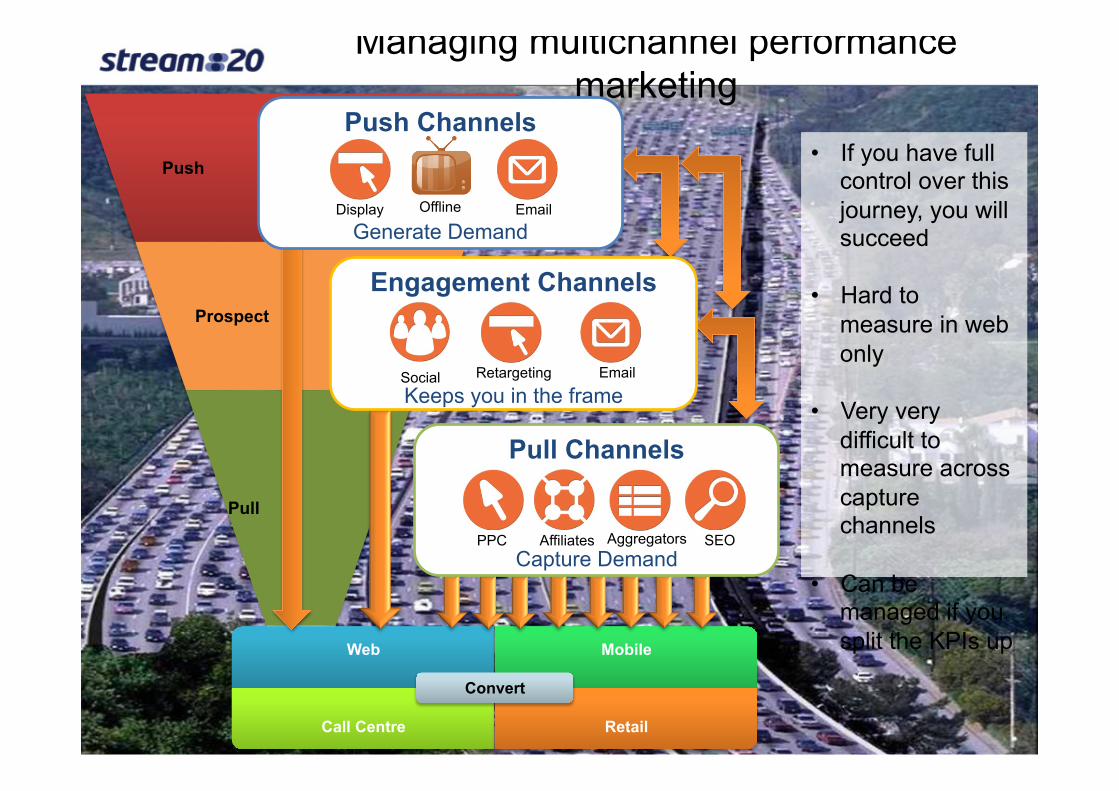
Managing multichannel performance marketing
Push
Prospect
Pull
Convert Web Mobile
Call Centre Retail
Convert
Push Channels
Generate Demand Display Email Offline
Pull Channels
Capture Demand Affiliates PPC SEO Aggregators
Engagement Channels
Keeps you in the frame Social Retargeting Email
• If you have full control over this journey, you will succeed
• Hard to measure in web only
• Very very difficult to measure across capture channels
• Can be managed if you split the KPIs up
Pull channels
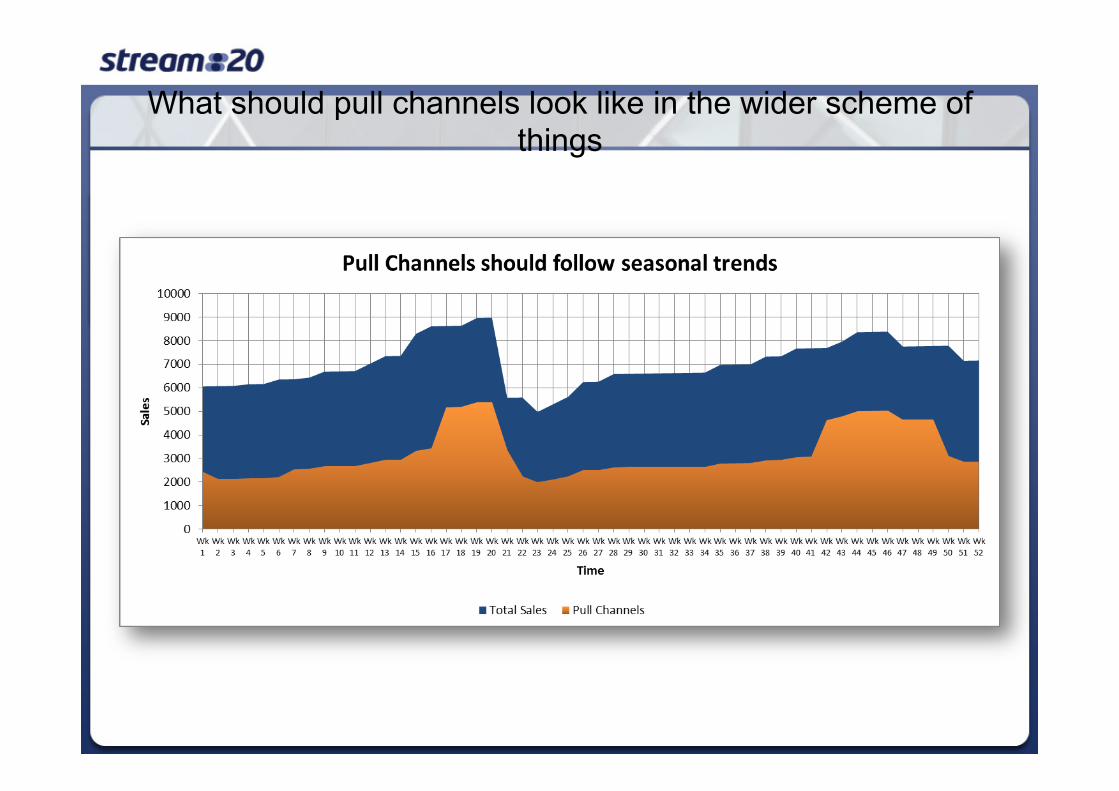
What should pull channels look like in the wider scheme of things

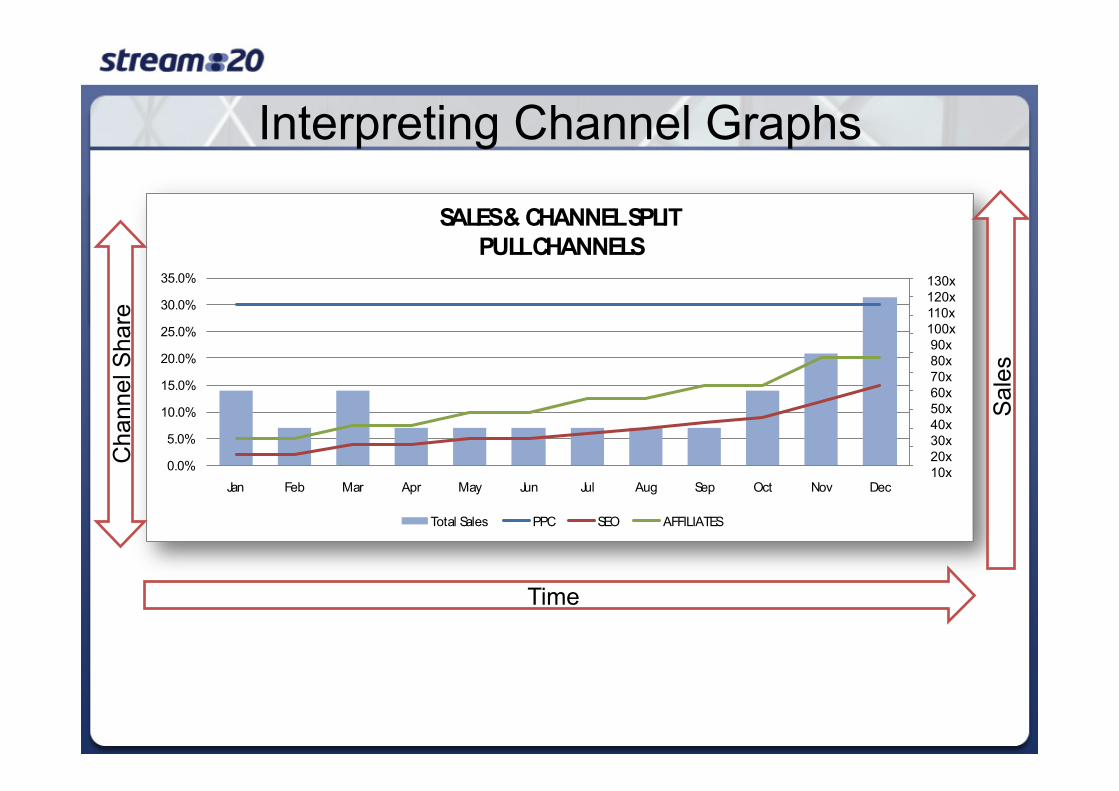
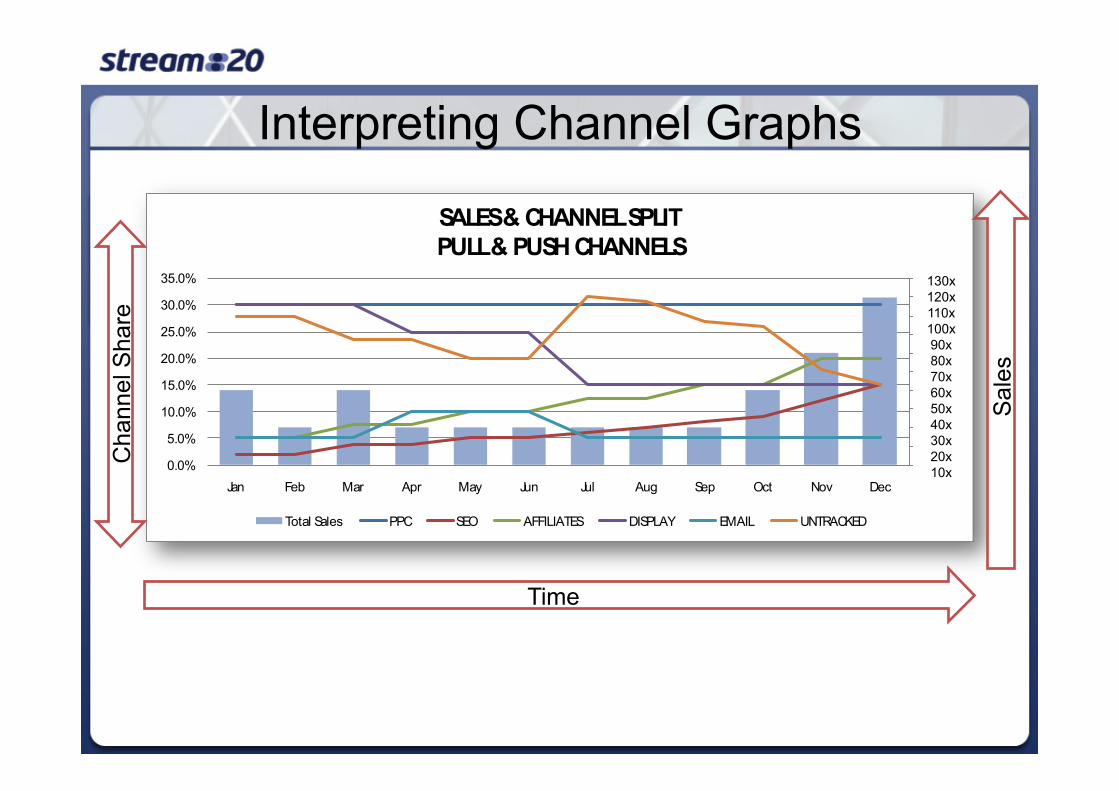
Interpreting Channel Graphs
-500 1,000 1,500 2,000 2,500 3,000 3,500 4,000 4,500 5,000
0.0%
5.0%
10.0%
15.0%
20.0%
25.0%
30.0%
35.0%
Jan Feb Mar Apr May Jun Jul Aug Sep Oct Nov Dec
SALES & CHANNEL SPLITPULL CHANNELS
Total Sales
Time
Sal
es
130x 120x 110x 100x 90x 80x 70x 60x 50x 40x 30x 20x 10x
Interpreting Channel Graphs
-500 1,000 1,500 2,000 2,500 3,000 3,500 4,000 4,500 5,000
0.0%
5.0%
10.0%
15.0%
20.0%
25.0%
30.0%
35.0%
Jan Feb Mar Apr May Jun Jul Aug Sep Oct Nov Dec
SALES & CHANNEL SPLITPULL CHANNELS
Total Sales PPC SEO AFFILIATES
Time
Sal
es
Cha
nnel
Sha
re
130x 120x 110x 100x 90x 80x 70x 60x 50x 40x 30x 20x 10x
Interpreting Channel Graphs
-500 1,000 1,500 2,000 2,500 3,000 3,500 4,000 4,500 5,000
0.0%
5.0%
10.0%
15.0%
20.0%
25.0%
30.0%
35.0%
Jan Feb Mar Apr May Jun Jul Aug Sep Oct Nov Dec
SALES & CHANNEL SPLITPULL & PUSH CHANNELS
Total Sales PPC SEO AFFILIATES DISPLAY EMAIL UNTRACKED
Time
Sal
es
Cha
nnel
Sha
re
130x 120x 110x 100x 90x 80x 70x 60x 50x 40x 30x 20x 10x
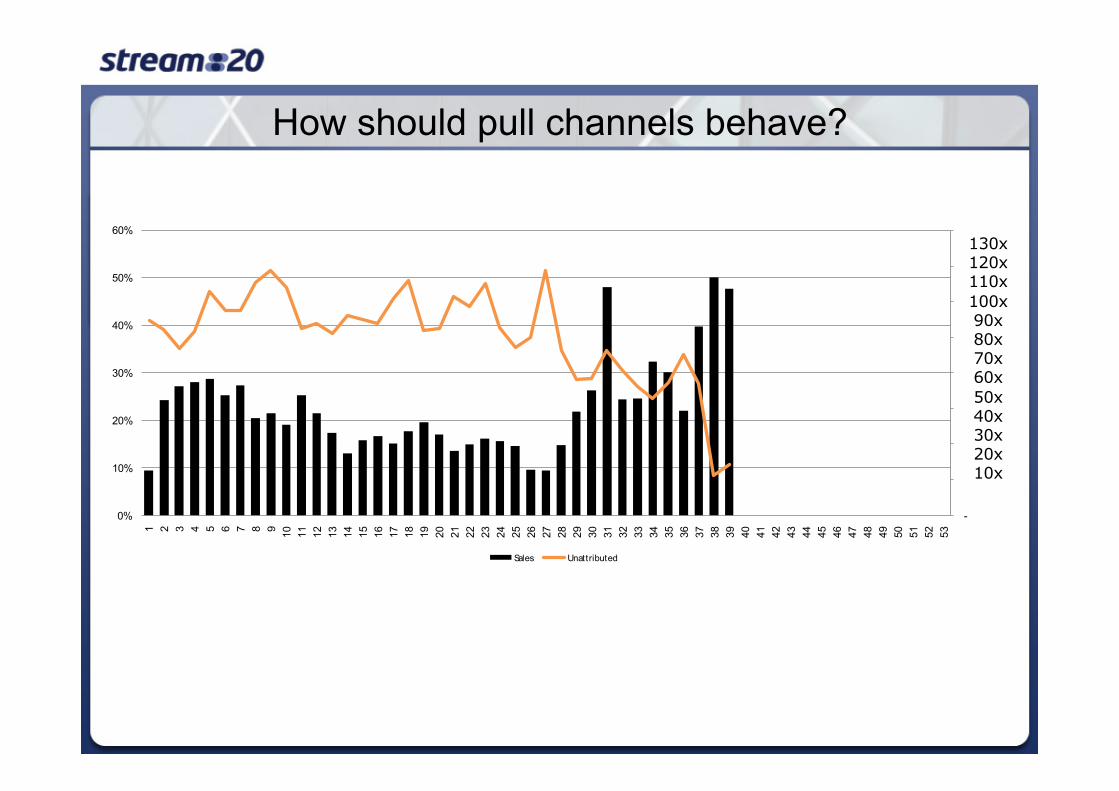
How should pull channels behave?
-
1,000
2,000
3,000
4,000
5,000
6,000
7,000
8,000
0%
10%
20%
30%
40%
50%
60%
1 2 3 4 5 6 7 8 9 10 11 12 13 14 15 16 17 18 19 20 21 22 23 24 25 26 27 28 29 30 31 32 33 34 35 36 37 38 39 40 41 42 43 44 45 46 47 48 49 50 51 52 53
Sales Unattributed
130x120x110x100x90x80x70x60x50x40x30x20x10x
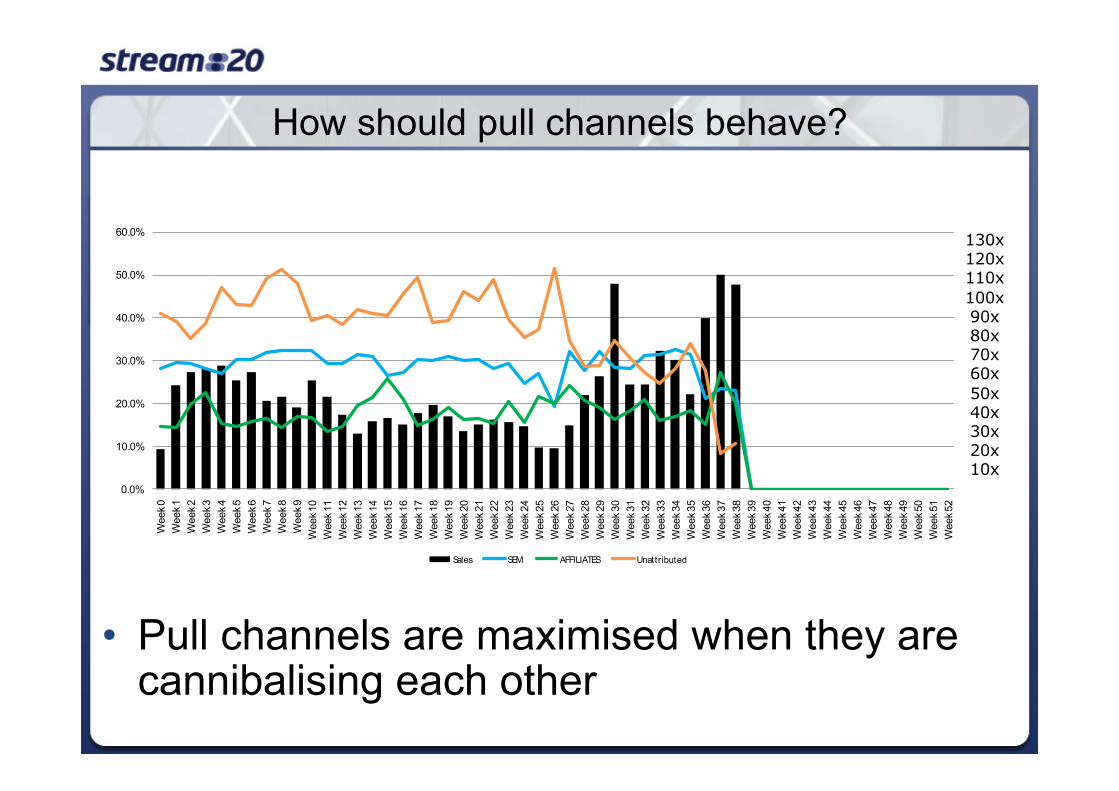
How should pull channels behave?
• Pull channels are maximised when they are cannibalising each other
-
1,000
2,000
3,000
4,000
5,000
6,000
7,000
8,000
0.0%
10.0%
20.0%
30.0%
40.0%
50.0%
60.0%
Wee
k 0W
eek 1
Wee
k 2W
eek 3
Wee
k 4W
eek 5
Wee
k 6W
eek 7
Wee
k 8W
eek 9
Wee
k 10
Wee
k 11
Wee
k 12
Wee
k 13
Wee
k 14
Wee
k 15
Wee
k 16
Wee
k 17
Wee
k 18
Wee
k 19
Wee
k 20
Wee
k 21
Wee
k 22
Wee
k 23
Wee
k 24
Wee
k 25
Wee
k 26
Wee
k 27
Wee
k 28
Wee
k 29
Wee
k 30
Wee
k 31
Wee
k 32
Wee
k 33
Wee
k 34
Wee
k 35
Wee
k 36
Wee
k 37
Wee
k 38
Wee
k 39
Wee
k 40
Wee
k 41
Wee
k 42
Wee
k 43
Wee
k 44
Wee
k 45
Wee
k 46
Wee
k 47
Wee
k 48
Wee
k 49
Wee
k 50
Wee
k 51
Wee
k 52
Sales SEM AFFILIATES Unattributed
130x120x110x100x90x80x70x60x50x40x30x20x10x
Direct Demand Indirect Demand
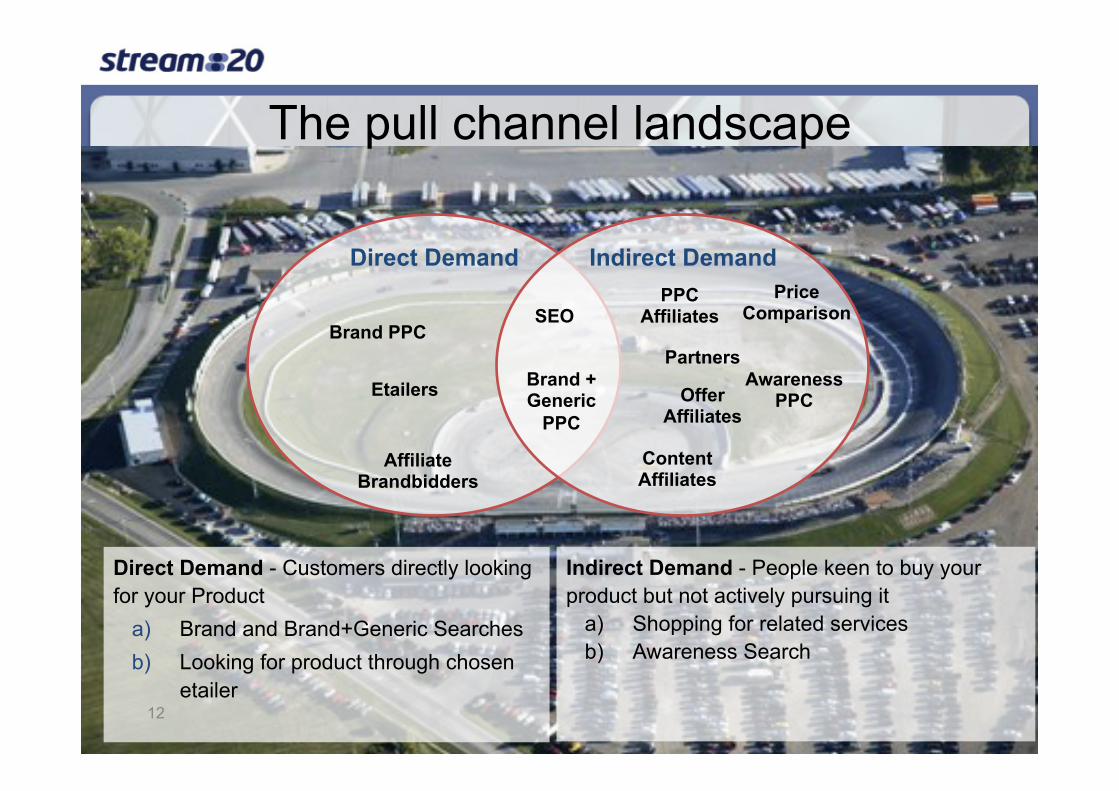
The pull channel landscape
Direct Demand - Customers directly looking for your Product
a) Brand and Brand+Generic Searches b) Looking for product through chosen
etailer 12
Brand PPC
Brand + Generic
PPC
SEO
Affiliate Brandbidders
Content Affiliates
PPC Affiliates
Awareness PPC Etailers
Price Comparison
Partners
Offer Affiliates
Indirect Demand - People keen to buy your product but not actively pursuing it
a) Shopping for related services b) Awareness Search
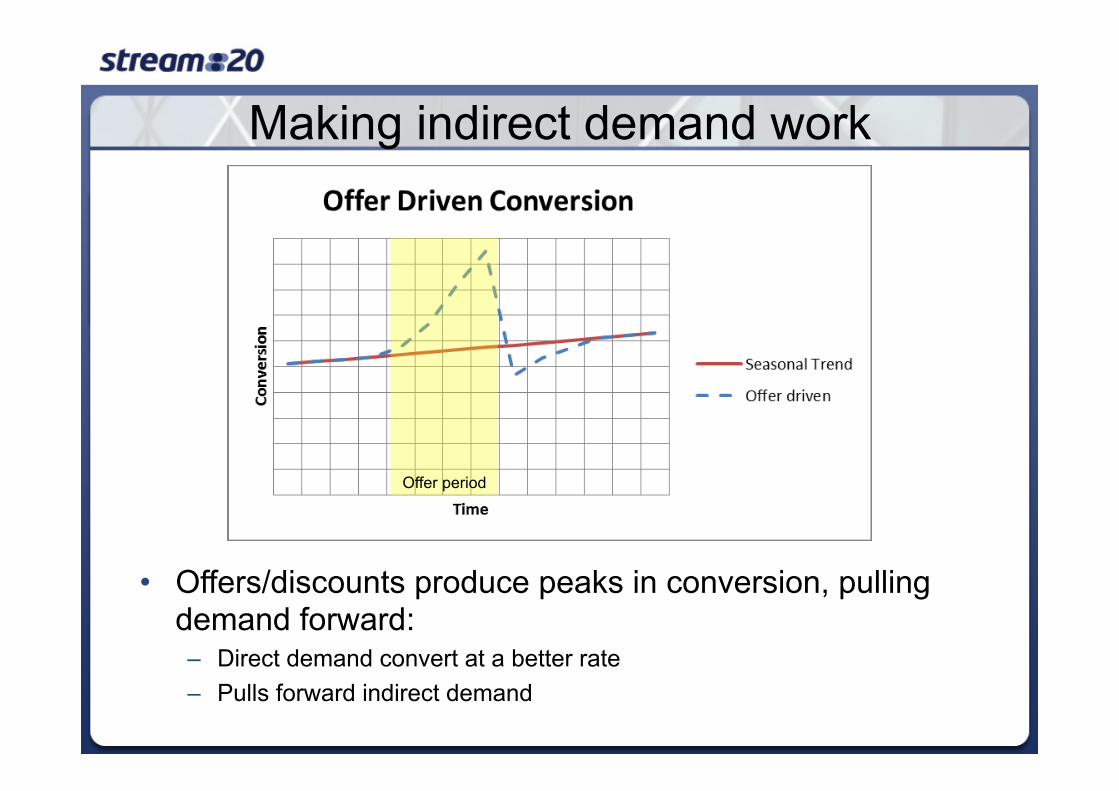
• Offers/discounts produce peaks in conversion, pulling demand forward: – Direct demand convert at a better rate – Pulls forward indirect demand
Offer period
Making indirect demand work
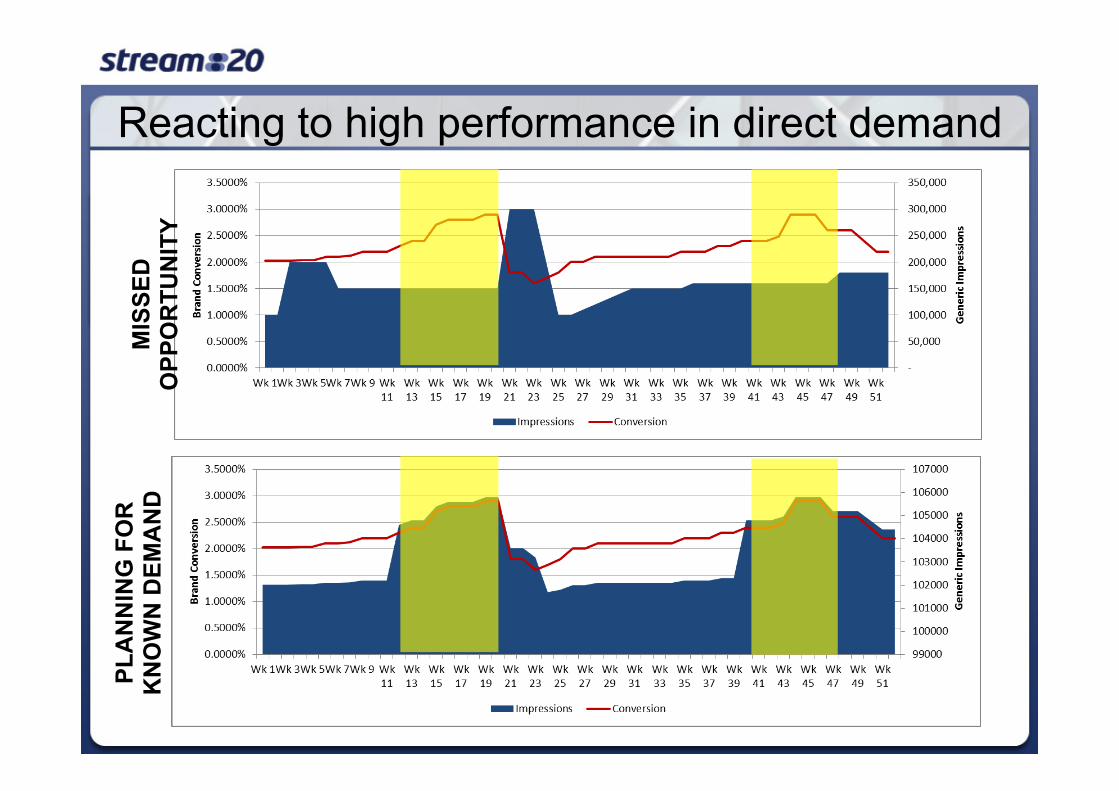
Reacting to high performance in direct demand M
ISSE
D
OPP
OR
TUN
ITY
PLA
NN
ING
FO
R
KN
OW
N D
EMA
ND
Engagement Channels
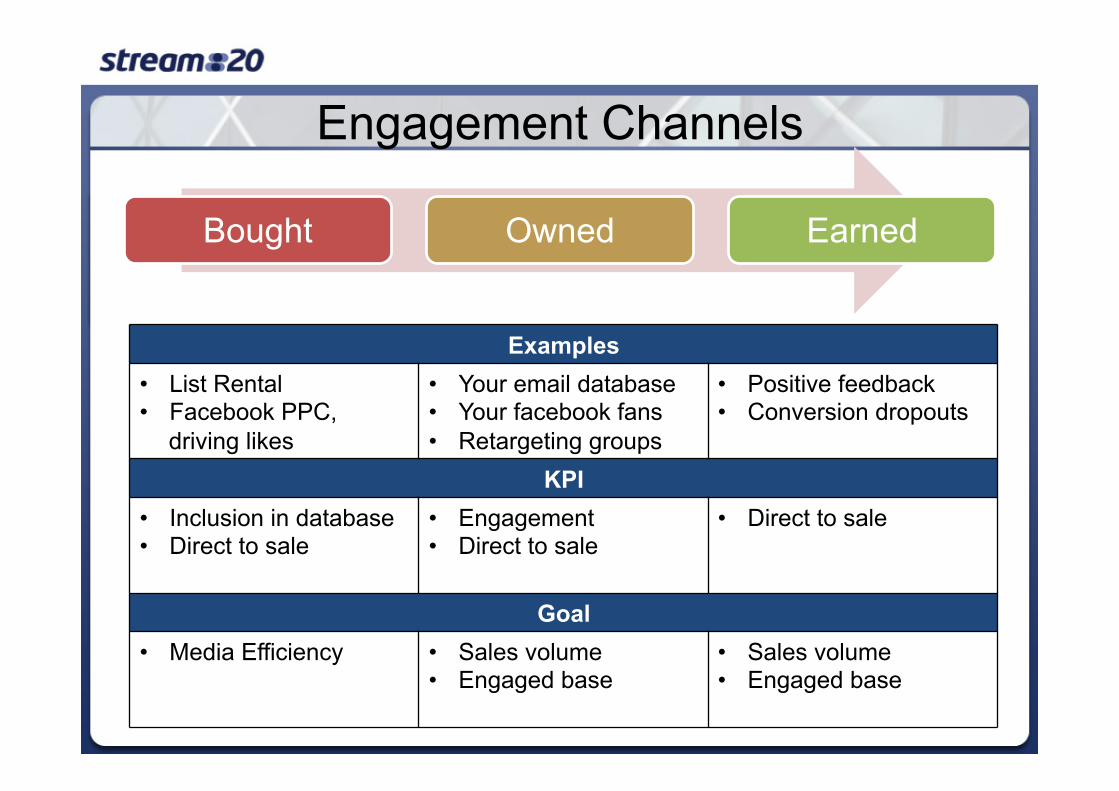
Engagement Channels
• d Bought Owned Earned
Examples • List Rental • Facebook PPC,
driving likes
• Your email database • Your facebook fans • Retargeting groups
• Positive feedback • Conversion dropouts
KPI • Inclusion in database • Direct to sale
• Engagement • Direct to sale
• Direct to sale
Goal • Media Efficiency
• Sales volume • Engaged base
• Sales volume • Engaged base
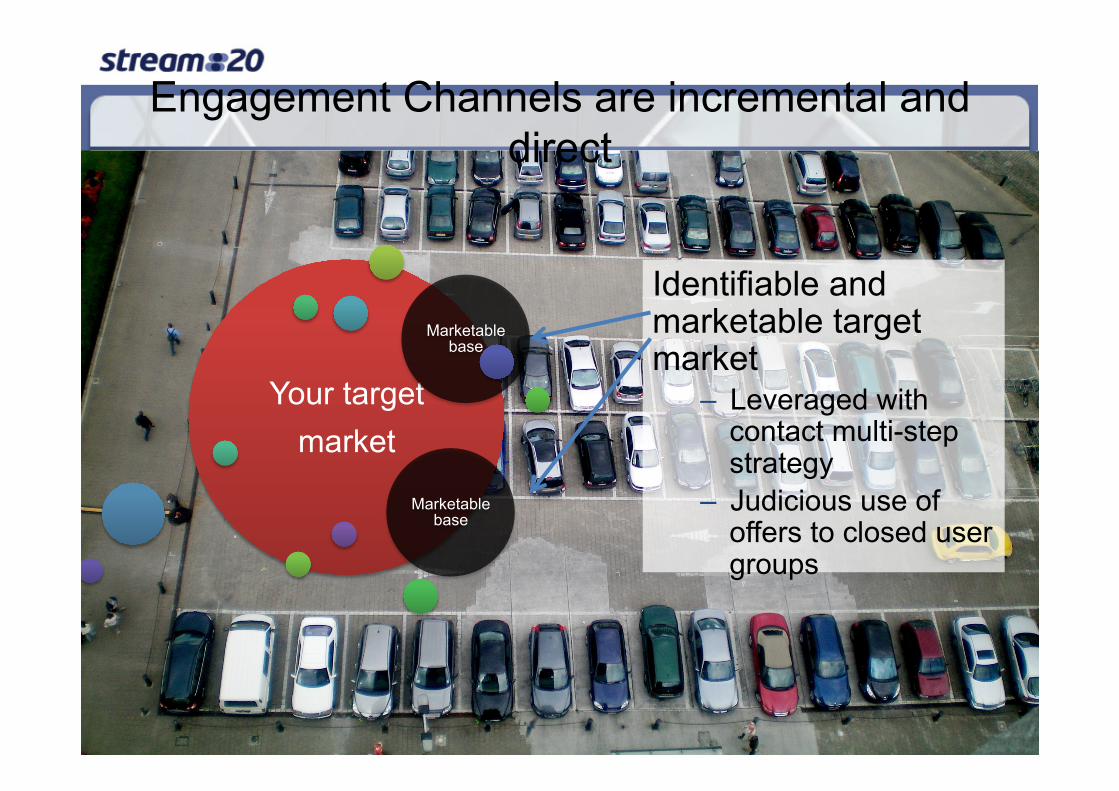
Engagement Channels are incremental and direct
Your target market
Marketable base
Marketable base
Identifiable and marketable target market
– Leveraged with contact multi-step strategy
– Judicious use of offers to closed user groups
Push channels
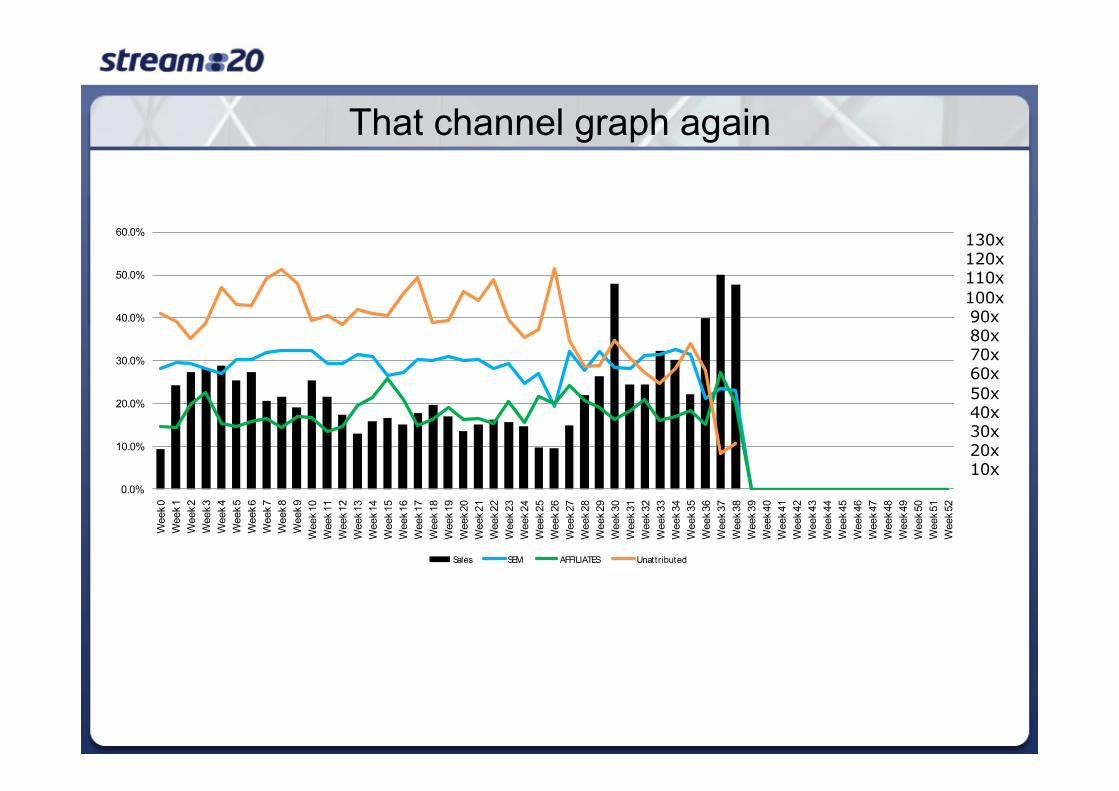
That channel graph again
-
1,000
2,000
3,000
4,000
5,000
6,000
7,000
8,000
0.0%
10.0%
20.0%
30.0%
40.0%
50.0%
60.0%
Wee
k 0W
eek 1
Wee
k 2W
eek 3
Wee
k 4W
eek 5
Wee
k 6W
eek 7
Wee
k 8W
eek 9
Wee
k 10
Wee
k 11
Wee
k 12
Wee
k 13
Wee
k 14
Wee
k 15
Wee
k 16
Wee
k 17
Wee
k 18
Wee
k 19
Wee
k 20
Wee
k 21
Wee
k 22
Wee
k 23
Wee
k 24
Wee
k 25
Wee
k 26
Wee
k 27
Wee
k 28
Wee
k 29
Wee
k 30
Wee
k 31
Wee
k 32
Wee
k 33
Wee
k 34
Wee
k 35
Wee
k 36
Wee
k 37
Wee
k 38
Wee
k 39
Wee
k 40
Wee
k 41
Wee
k 42
Wee
k 43
Wee
k 44
Wee
k 45
Wee
k 46
Wee
k 47
Wee
k 48
Wee
k 49
Wee
k 50
Wee
k 51
Wee
k 52
Sales SEM AFFILIATES Unattributed
130x120x110x100x90x80x70x60x50x40x30x20x10x
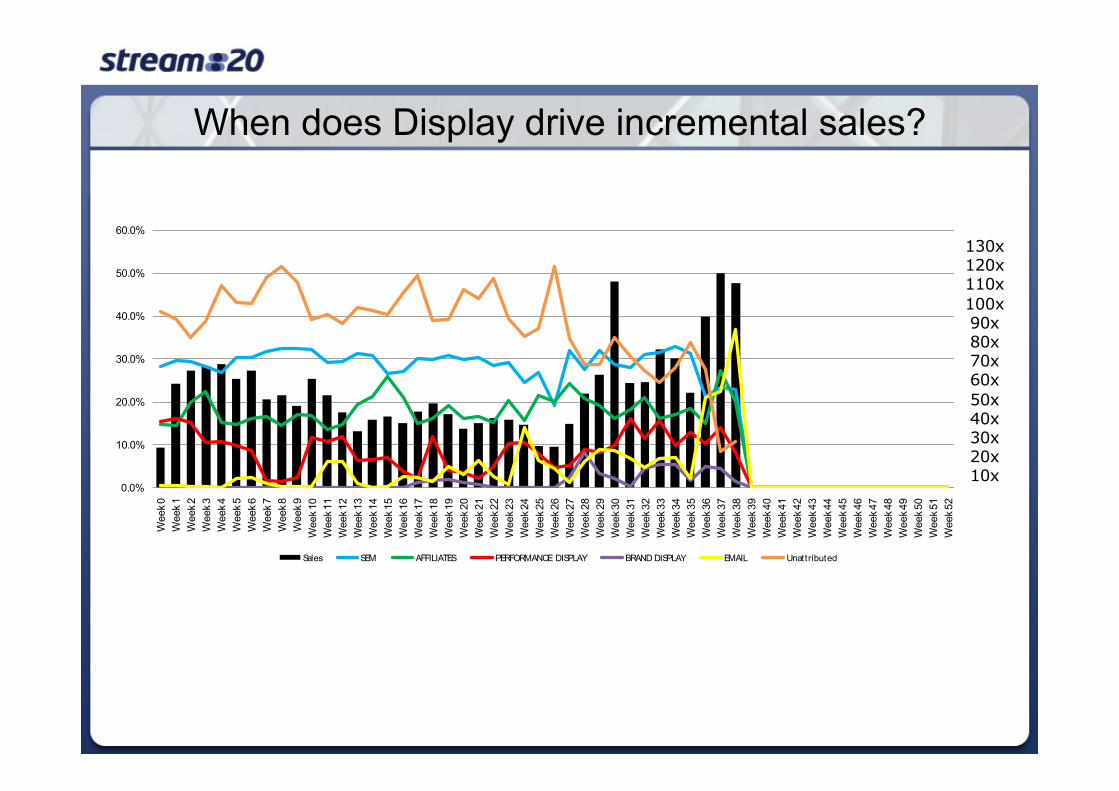
When does Display drive incremental sales?
-
1,000
2,000
3,000
4,000
5,000
6,000
7,000
8,000
0.0%
10.0%
20.0%
30.0%
40.0%
50.0%
60.0%
Wee
k 0W
eek 1
Wee
k 2W
eek 3
Wee
k 4W
eek 5
Wee
k 6W
eek 7
Wee
k 8W
eek 9
Wee
k 10
Wee
k 11
Wee
k 12
Wee
k 13
Wee
k 14
Wee
k 15
Wee
k 16
Wee
k 17
Wee
k 18
Wee
k 19
Wee
k 20
Wee
k 21
Wee
k 22
Wee
k 23
Wee
k 24
Wee
k 25
Wee
k 26
Wee
k 27
Wee
k 28
Wee
k 29
Wee
k 30
Wee
k 31
Wee
k 32
Wee
k 33
Wee
k 34
Wee
k 35
Wee
k 36
Wee
k 37
Wee
k 38
Wee
k 39
Wee
k 40
Wee
k 41
Wee
k 42
Wee
k 43
Wee
k 44
Wee
k 45
Wee
k 46
Wee
k 47
Wee
k 48
Wee
k 49
Wee
k 50
Wee
k 51
Wee
k 52
Sales SEM AFFILIATES PERFORMANCE DISPLAY BRAND DISPLAY EMAIL Unattributed
130x120x110x100x90x80x70x60x50x40x30x20x10x
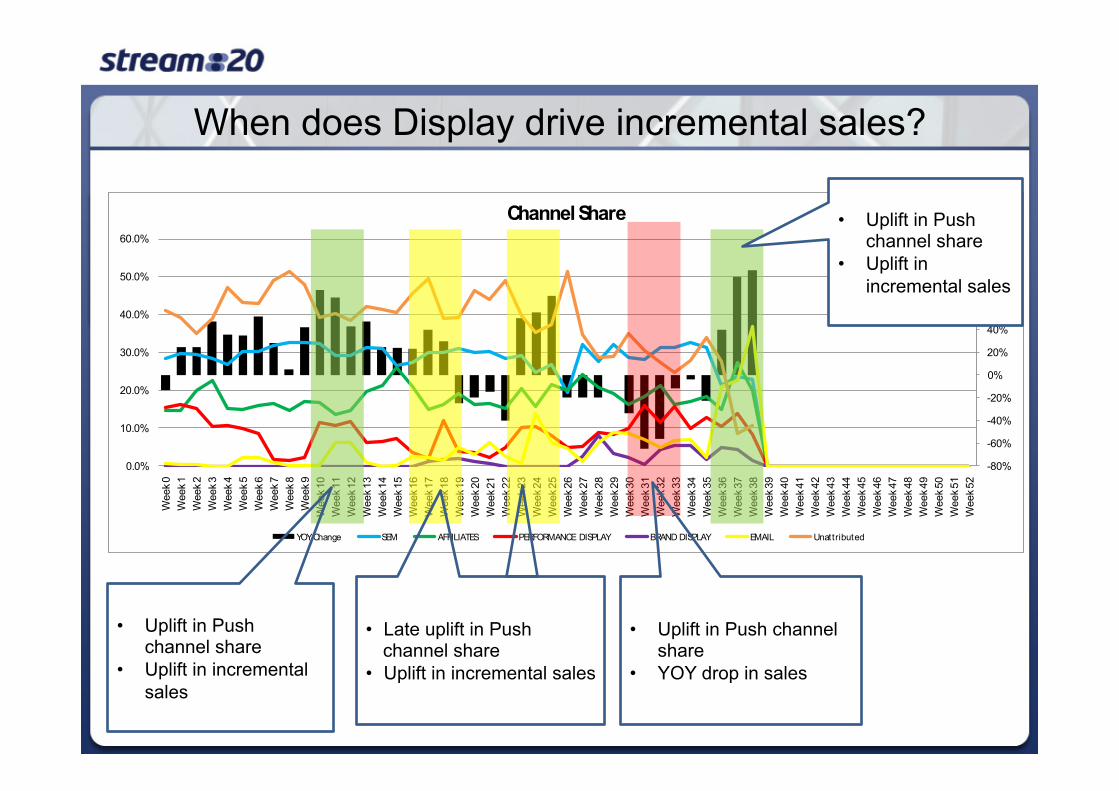
When does Display drive incremental sales?
-80%
-60%
-40%
-20%
0%
20%
40%
60%
80%
100%
120%
0.0%
10.0%
20.0%
30.0%
40.0%
50.0%
60.0%
Wee
k 0W
eek 1
Wee
k 2W
eek 3
Wee
k 4W
eek 5
Wee
k 6W
eek 7
Wee
k 8W
eek 9
Wee
k 10
Wee
k 11
Wee
k 12
Wee
k 13
Wee
k 14
Wee
k 15
Wee
k 16
Wee
k 17
Wee
k 18
Wee
k 19
Wee
k 20
Wee
k 21
Wee
k 22
Wee
k 23
Wee
k 24
Wee
k 25
Wee
k 26
Wee
k 27
Wee
k 28
Wee
k 29
Wee
k 30
Wee
k 31
Wee
k 32
Wee
k 33
Wee
k 34
Wee
k 35
Wee
k 36
Wee
k 37
Wee
k 38
Wee
k 39
Wee
k 40
Wee
k 41
Wee
k 42
Wee
k 43
Wee
k 44
Wee
k 45
Wee
k 46
Wee
k 47
Wee
k 48
Wee
k 49
Wee
k 50
Wee
k 51
Wee
k 52
Channel Share
YOY Change SEM AFFILIATES PERFORMANCE DISPLAY BRAND DISPLAY EMAIL Unattributed
• Uplift in Push channel share
• Uplift in incremental sales
• Late uplift in Push channel share
• Uplift in incremental sales
• Uplift in Push channel share
• YOY drop in sales
• Uplift in Push channel share
• Uplift in incremental sales
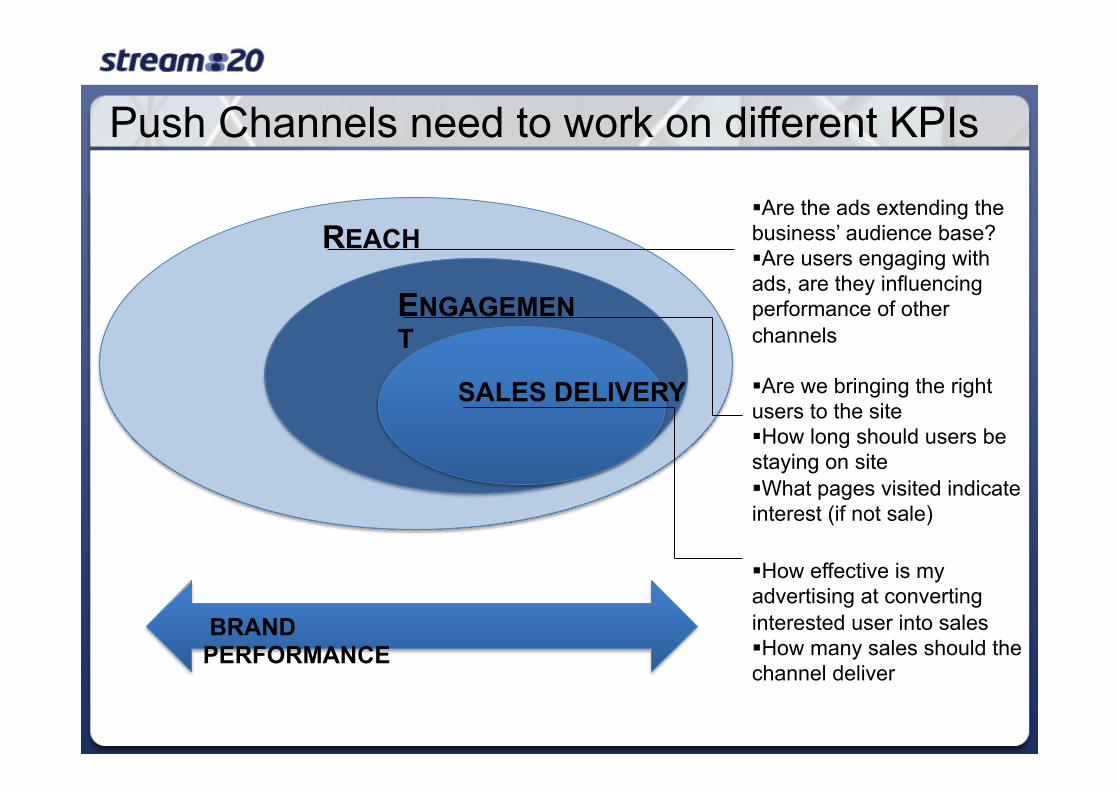
Push Channels need to work on different KPIs
SALES DELIVERY
ENGAGEMENT
REACH § Are the ads extending the business’ audience base? § Are users engaging with ads, are they influencing performance of other channels
§ Are we bringing the right users to the site § How long should users be staying on site § What pages visited indicate interest (if not sale)
§ How effective is my advertising at converting interested user into sales § How many sales should the channel deliver
BRAND PERFORMANCE
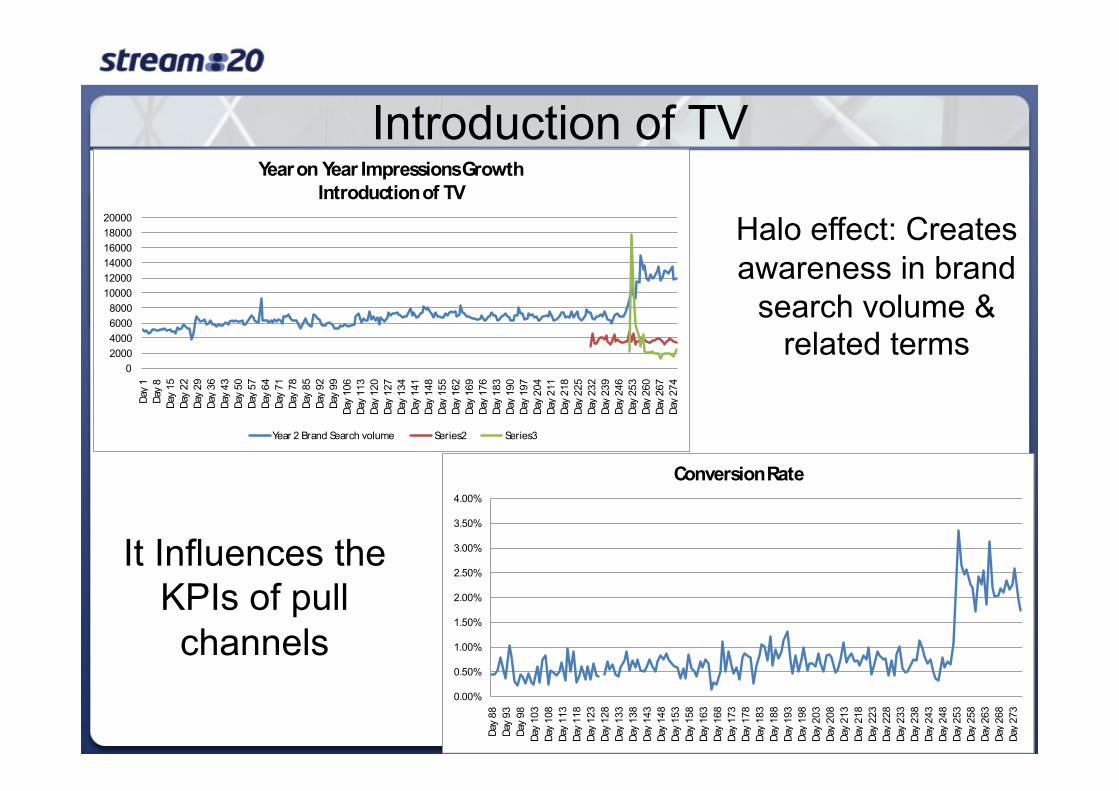
Introduction of TV
It Influences the
KPIs of pull channels
02000400060008000
100001200014000160001800020000
Day
1Da
y 8
Day
15Da
y 22
Day
29Da
y 36
Day
43Da
y 50
Day
57Da
y 64
Day
71Da
y 78
Day
85Da
y 92
Day
99Da
y 10
6Da
y 11
3Da
y 12
0Da
y 12
7Da
y 13
4Da
y 14
1Da
y 14
8Da
y 15
5Da
y 16
2Da
y 16
9Da
y 17
6Da
y 18
3Da
y 19
0Da
y 19
7Da
y 20
4Da
y 21
1Da
y 21
8Da
y 22
5Da
y 23
2Da
y 23
9Da
y 24
6Da
y 25
3Da
y 26
0Da
y 26
7Da
y 27
4
Year on Year Impressions GrowthIntroduction of TV
Year 2 Brand Search volume Series2 Series3
0.00%
0.50%
1.00%
1.50%
2.00%
2.50%
3.00%
3.50%
4.00%Da
y 88
Day
93Da
y 98
Day
103
Day
108
Day
113
Day
118
Day
123
Day
128
Day
133
Day
138
Day
143
Day
148
Day
153
Day
158
Day
163
Day
168
Day
173
Day
178
Day
183
Day
188
Day
193
Day
198
Day
203
Day
208
Day
213
Day
218
Day
223
Day
228
Day
233
Day
238
Day
243
Day
248
Day
253
Day
258
Day
263
Day
268
Day
273
Conversion Rate
Halo effect: Creates awareness in brand
search volume & related terms
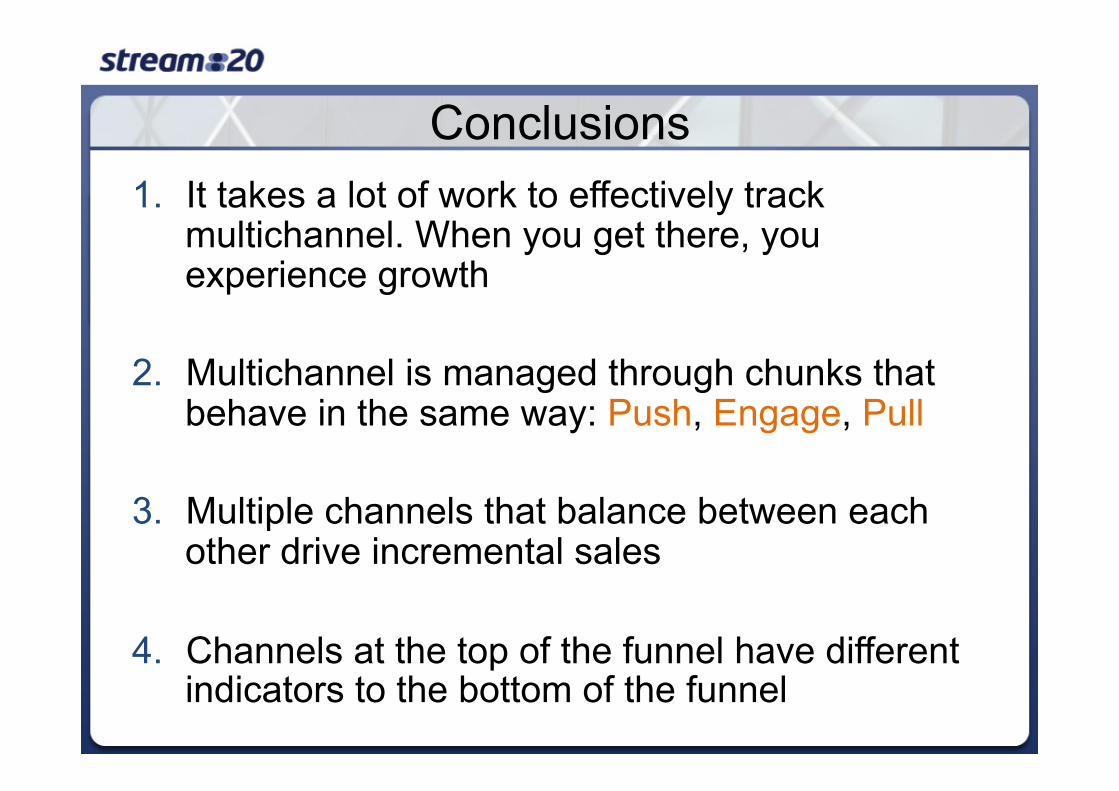
Conclusions 1. It takes a lot of work to effectively track
multichannel. When you get there, you experience growth
2. Multichannel is managed through chunks that behave in the same way: Push, Engage, Pull
3. Multiple channels that balance between each other drive incremental sales
4. Channels at the top of the funnel have different indicators to the bottom of the funnel
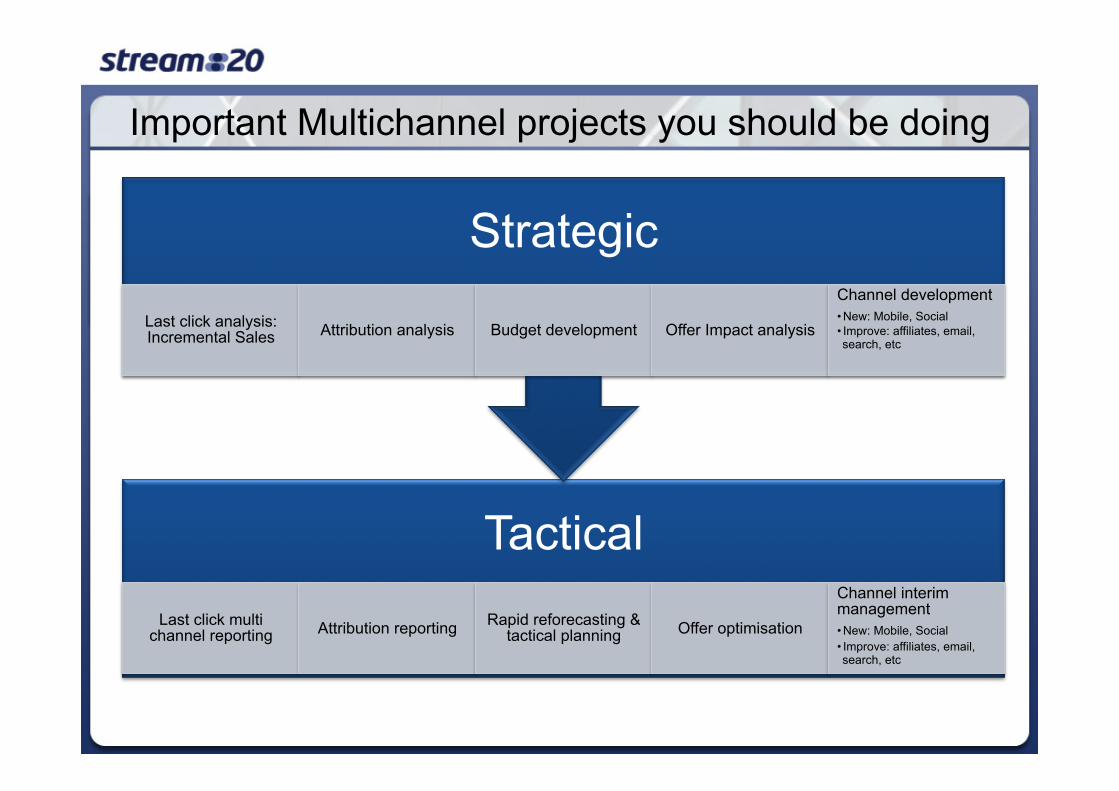
Important Multichannel projects you should be doing
Tactical Last click multi
channel reporting Attribution reporting Rapid reforecasting & tactical planning Offer optimisation
Channel interim management • New: Mobile, Social • Improve: affiliates, email, search, etc
Strategic Last click analysis: Incremental Sales Attribution analysis Budget development Offer Impact analysis
Channel development • New: Mobile, Social • Improve: affiliates, email, search, etc