
MAXI GSC Observations of a Spectral State Transition in ...
6
PASJ: Publ. Astron. Soc. Japan 62, L27–L32, 2010 October 25 c 2010. Astronomical Society of Japan. MAXI GSC Observations of a Spectral State Transition in the Black Hole Candidate XTE J1752223 Satoshi NAKAHIRA, 1 Kazutaka YAMAOKA, 1 Mutsumi SUGIZAKI, 2 Yoshihiro UEDA, 3 Hitoshi NEGORO, 4 Ken EBISAWA, 5 Nobuyuki KAWAI, 6,2 Masaru MATSUOKA, 2,7 Hiroshi TSUNEMI, 8 Arata DAIKYUJI, 9 Satoshi EGUCHI, 3 Kazuo HIROI, 3 Masaki I SHIKAWA, 10 Ryoji I SHIWATA, 4 Naoki I SOBE, 3 Kazuyoshi KAWASAKI, 7 Masashi KIMURA, 8 Mitsuhiro KOHAMA, 2,7 Tatehiro MIHARA, 2 Sho MIYOSHI, 4 Mikio MORII, 6 Yujin E. NAKAGAWA, 11 Motoki NAKAJIMA, 12 Hiroshi OZAWA, 4 Tetsuya SOOTOME, 2 Kousuke SUGIMORI, 6 Motoko SUZUKI, 2 Hiroshi TOMIDA, 7 Shiro UENO, 7 Takayuki YAMAMOTO, 2 Atsumasa YOSHIDA, 1,2 and the MAXI team 1 Department of Physics and Mathematics, Aoyama Gakuin University, 5-10-1 Fuchinobe, Chuo-ku Sagamihara 252-5258 [email protected] 2 Coordinated Space Observation and Experiment Research Group, Institute of Physical and Chemical Research (RIKEN), 2-1 Hirosawa, Wako, Saitama 351-0198 3 Department of Astronomy, Kyoto University, Oiwake-cho, Sakyo-ku, Kyoto 606-8502 4 Department of Physics, Nihon University, 1-8-14 Kanda-Surugadai, Chiyoda-ku, Tokyo 101-8308 5 Department of Space Science Information Analysis, Institute of Space and Astronautical Science, Japan Aerospace Exploration Agency, 3-1-1 Yoshinodai, Chuo-ku, Sagamihara 252-5210 6 Department of Physics, Tokyo Institute of Technology, 2-12-1 Ookayama, Meguro-ku, Tokyo 152-8551 7 ISS Science Project Office, Institute of Space and Astronautical Science, Japan Aerospace Exploration Agency, 2-1-1 Sengen, Tsukuba, Ibaraki 305-8505 8 Department of Earth and Space Science, Osaka University, 1-1 Machikaneyama, Toyonaka, Osaka 560-0043 9 Department of Applied Physics, University of Miyazaki, 1-1 Gakuen Kibanadai-nishi, Miyazaki, Miyazaki 889-2192 10 School of Physical Science, Space and Astronautical Science, The Graduate University for Advanced Studies (Sokendai), 3-1-1 Yoshinodai, Chuo-ku, Sagamihara 252-5210 11 High Energy Astrophysics Laboratory, Institute of Physical and Chemical Research (RIKEN),2-1 Hirosawa, Wako, Saitama 351-0198 12 School of Dentistry at Matsudo, Nihon University, 2-870-1 Sakaecho-nishi, Matsudo, Chiba 101-8308 (Received 2010 March 31; accepted 2010 June 28) Abstract We present the first results on the black-hole candidate XTE J1752223 from the Gas Slit Camera (GSC) aboard the Monitor of All-sky X-ray Image (MAXI) on the International Space Station. Including the onset of an outburst reported by the Proportional Counter Array aboard the Rossi X-ray Timing Explorer on 2009 October 23, MAXI / GSC has been monitoring this source approximately 10 times per day with high sensitivity in the 2–20 keV band. XTE J1752223 was initially in a low / hard state during the first 3 months. An anti-correlated behavior between the 2–4 keV and 4–20 keV bands was observed around 2010 January 20, indicating that the source exhib- ited a spectral transition to the high / soft state. A transient radio jet may have been ejected when the source was in the intermediate state where the spectrum was roughly explained by a power-law with a photon index of 2.5–3.0. The unusually long period in the initial low / hard state implies a slow variation in the mass-accretion rate, and a dramatic soft X-ray increase may be explained by a sudden appearance of the accretion disk component with a relatively low innermost temperature (0.4–0.7keV). Such a low temperature might suggest that the maximum accretion rate was just above the critical gas-evaporation rate required for the state transition. Key words: accretion, accretion disks — black hole physics — stars: individual (XTE J1752223) — X-rays: stars 1. Introduction Galactic Black hole candidates (BHCs) are ideal objects for studying how accretion disks and coronae evolve due to changes in the accretion rate, thanks to their high photon statis- tics and frequent state transitions (see, e.g., McClintock & Remillard 2006 for a review). They are characterized by tran- sient behavior, such as sudden X-ray brightening caused by instabilities originating in the outer accretion disk. During an outburst, which typically lasts a few months, they may go through several distinct spectral states, initial low / hard state (LHS), intermediate or very high state (IMS / VHS), high / soft state (HSS), LHS, and then go back to quiescence. These states are believed to reflect changes in the geometry of the accretion disk and corona (Esin et al. 1997), as well as jets (Markoff et al. 2001; Yuan et al. 2005). BHCs sometimes show powerful radio jets in their outbursts in association with state transitions from the LHS to the HSS. Hence, studying the spectral transition and the disk-jet interaction are important for clarifying the jet production mechanisms (see, e.g., Fender 2006 for a review). The new X-ray transient XTE J1752223 was first detected at the 30 mCrab flux level in the 2–10 keV range on LETTER LETTER LETTER LETTER LETTER LETTER LETTER LETTER LETTER
Transcript of MAXI GSC Observations of a Spectral State Transition in ...
PASJ: Publ. Astron. Soc. Japan 62, L27–L32, 2010 October 25c� 2010. Astronomical Society of Japan.
MAXI GSC Observations of a Spectral State Transitionin the Black Hole Candidate XTE J1752�223
Satoshi NAKAHIRA,1 Kazutaka YAMAOKA,1 Mutsumi SUGIZAKI,2 Yoshihiro UEDA,3 Hitoshi NEGORO,4 Ken EBISAWA,5
Nobuyuki KAWAI,6,2 Masaru MATSUOKA,2,7 Hiroshi TSUNEMI,8 Arata DAIKYUJI,9 Satoshi EGUCHI,3 Kazuo HIROI,3
Masaki ISHIKAWA,10 Ryoji ISHIWATA,4 Naoki ISOBE,3 Kazuyoshi KAWASAKI,7 Masashi KIMURA,8 Mitsuhiro KOHAMA,2,7
Tatehiro MIHARA,2 Sho MIYOSHI,4 Mikio MORII,6 Yujin E. NAKAGAWA,11 Motoki NAKAJIMA,12 Hiroshi OZAWA,4
Tetsuya SOOTOME,2 Kousuke SUGIMORI,6 Motoko SUZUKI,2 Hiroshi TOMIDA,7 Shiro UENO,7 Takayuki YAMAMOTO,2
Atsumasa YOSHIDA,1,2 and the MAXI team1Department of Physics and Mathematics, Aoyama Gakuin University, 5-10-1 Fuchinobe, Chuo-ku Sagamihara 252-5258
[email protected] Space Observation and Experiment Research Group, Institute of Physical and Chemical Research (RIKEN),
2-1 Hirosawa, Wako, Saitama 351-01983Department of Astronomy, Kyoto University, Oiwake-cho, Sakyo-ku, Kyoto 606-8502
4Department of Physics, Nihon University, 1-8-14 Kanda-Surugadai, Chiyoda-ku, Tokyo 101-83085Department of Space Science Information Analysis, Institute of Space and Astronautical Science, Japan Aerospace Exploration Agency,
3-1-1 Yoshinodai, Chuo-ku, Sagamihara 252-52106Department of Physics, Tokyo Institute of Technology, 2-12-1 Ookayama, Meguro-ku, Tokyo 152-8551
7ISS Science Project Office, Institute of Space and Astronautical Science, Japan Aerospace Exploration Agency,2-1-1 Sengen, Tsukuba, Ibaraki 305-8505
8Department of Earth and Space Science, Osaka University, 1-1 Machikaneyama, Toyonaka, Osaka 560-00439Department of Applied Physics, University of Miyazaki, 1-1 Gakuen Kibanadai-nishi, Miyazaki, Miyazaki 889-2192
10School of Physical Science, Space and Astronautical Science, The Graduate University for Advanced Studies (Sokendai),3-1-1 Yoshinodai, Chuo-ku, Sagamihara 252-5210
11High Energy Astrophysics Laboratory, Institute of Physical and Chemical Research (RIKEN), 2-1 Hirosawa, Wako, Saitama 351-019812School of Dentistry at Matsudo, Nihon University, 2-870-1 Sakaecho-nishi, Matsudo, Chiba 101-8308
(Received 2010 March 31; accepted 2010 June 28)
Abstract
We present the first results on the black-hole candidate XTE J1752�223 from the Gas Slit Camera (GSC)aboard the Monitor of All-sky X-ray Image (MAXI) on the International Space Station. Including the onset of anoutburst reported by the Proportional Counter Array aboard the Rossi X-ray Timing Explorer on 2009 October 23,MAXI / GSC has been monitoring this source approximately 10 times per day with high sensitivity in the 2–20 keVband. XTE J1752�223 was initially in a low / hard state during the first 3 months. An anti-correlated behaviorbetween the 2–4 keV and 4–20 keV bands was observed around 2010 January 20, indicating that the source exhib-ited a spectral transition to the high / soft state. A transient radio jet may have been ejected when the source was inthe intermediate state where the spectrum was roughly explained by a power-law with a photon index of 2.5–3.0. Theunusually long period in the initial low / hard state implies a slow variation in the mass-accretion rate, and a dramaticsoft X-ray increase may be explained by a sudden appearance of the accretion disk component with a relatively lowinnermost temperature (0.4–0.7 keV). Such a low temperature might suggest that the maximum accretion rate wasjust above the critical gas-evaporation rate required for the state transition.
Key words: accretion, accretion disks — black hole physics — stars: individual (XTE J1752�223) —X-rays: stars
1. Introduction
Galactic Black hole candidates (BHCs) are ideal objectsfor studying how accretion disks and coronae evolve due tochanges in the accretion rate, thanks to their high photon statis-tics and frequent state transitions (see, e.g., McClintock &Remillard 2006 for a review). They are characterized by tran-sient behavior, such as sudden X-ray brightening caused byinstabilities originating in the outer accretion disk. Duringan outburst, which typically lasts a few months, they may gothrough several distinct spectral states, initial low / hard state
(LHS), intermediate or very high state (IMS / VHS), high / softstate (HSS), LHS, and then go back to quiescence. These statesare believed to reflect changes in the geometry of the accretiondisk and corona (Esin et al. 1997), as well as jets (Markoff et al.2001; Yuan et al. 2005). BHCs sometimes show powerful radiojets in their outbursts in association with state transitions fromthe LHS to the HSS. Hence, studying the spectral transitionand the disk-jet interaction are important for clarifying the jetproduction mechanisms (see, e.g., Fender 2006 for a review).
The new X-ray transient XTE J1752�223 was first detectedat the 30 mCrab flux level in the 2–10 keV range on
LE
TT
ER
LE
TT
ER
LE
TT
ER
LE
TT
ER
LE
TT
ER
LE
TT
ER
LE
TT
ER
LE
TT
ER
LE
TT
ER

L28 S. Nakahira et al. [Vol. 62,
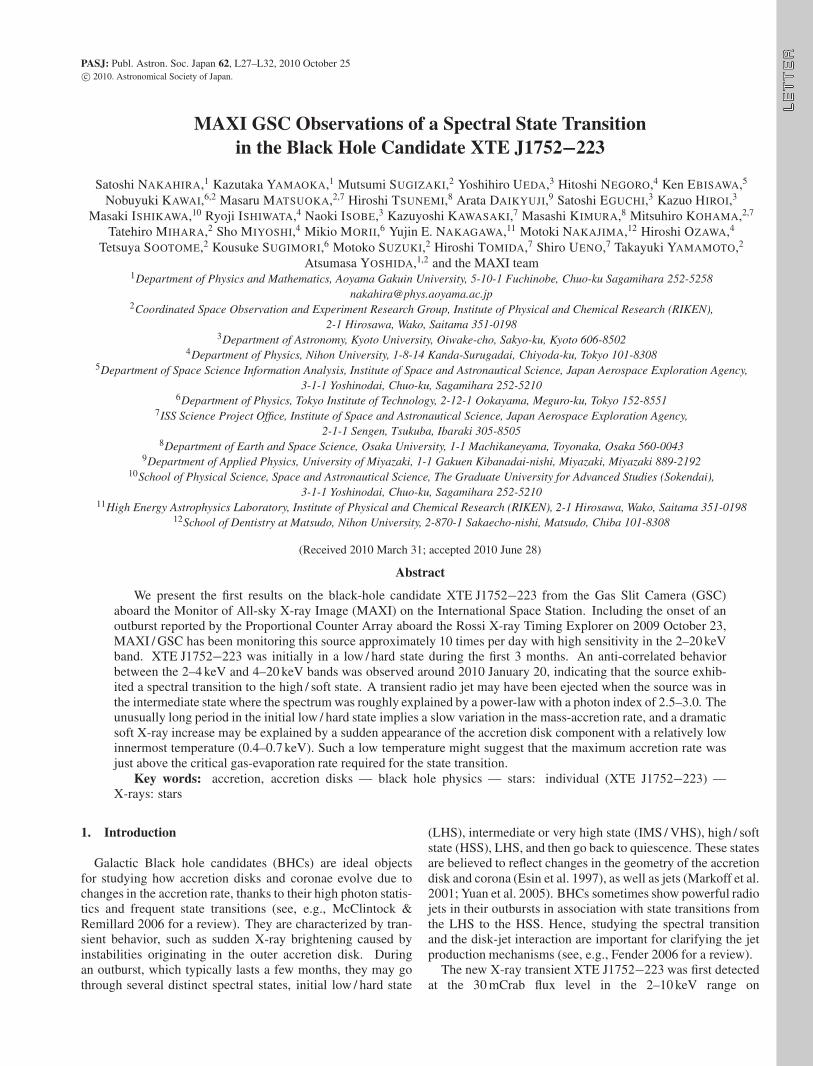
Fig. 1. MAXI / GSC false-color images during the period of December 20 to January 19 (upper panel) and January 20 to February 28 (lower panel).Red: 2–4 keV, Green: 4–10 keV, Blue: 10–20 keV. 10ı radius area from XTE J1752�223 is extracted, and the source clearly reddens because of thespectral transition. There are many bright X-ray sources near XTE J1752�223 with a few hundreds of mCrab such as GX 9+1 and GX 3+1. Source andbackground regions used for the light curve analysis are shown by green circles on both images.
2009 October 23 during galactic bulge monitoring with theProportional Counter Array (PCA) of the Rossi X-ray TimingExplorer (RXTE) (Markwardt et al. 2009a). On October 24,the source also triggered the Swift Burst Alert Telescope (BAT)at a 100 mCrab flux in the 15–50 keV range (Markwardt et al.2009a). The position was determined to be (RA, Dec) =(17h52m15:s14, �22:ı20033:008) with a 500 uncertainty by follow-up Swift X-Ray Telescope (XRT) localization (Markwardtet al. 2009b). The energy spectrum is consistent with a power-law with a photon index of 1.38˙0.01, and the power spectrumshows band-limited noise with a total rms of �30%, suggestingthat the source was in a typical LHS (Shaposhnikov et al.2009; Munoz-Darias et al. 2010). The optical (Torres et al.2009a), near-infrared (Torres et al. 2009b), and radio counter-parts (Brocksopp et al. 2009) were also discovered within theX-ray error circle during the initial phase. Possible double-sided jets were detected on 2010 February 11 (Brocksopp et al.2010a, 2010b); however, the BH mass, inclination angle andthe distance have not yet been determined.
Since 2009 August 3, the highly sensitive all-skymonitor, Monitor of All-sky X-ray Image, MAXI (Matsuokaet al. 2009), has been activated on the Exposed Facilityof the Japanese Experimental Module “Kibo” of theInternational Space Station (ISS). Soon after the discovery ofXTE J1752�223, when the MAXI was still in the commis-sioning phase, the source was found at the 30 mCrab level in anX-ray image of the MAXI Gas Slit Camera (GSC) (Nakahiraet al. 2009). MAXI / GSC also observed a rapid spectral soft-ening on 2010 January 22 due to a spectral transition from theLHS to the HSS (Negoro et al. 2010). The MAXI initial resultsare described in Matsuoka et al. (2010) and Ueno et al. (2010).
In this paper, we report on MAXI GSC observations ofXTE J1752�223 during its outburst since 2009 October. In theobservation and result section, we demonstrate MAXI’s spec-tral performance for such a bright source. Finally, we discussthe origin of the rather unusual behavior of XTE J1752�223 inthe light curve and spectral hardness.
2. Observations and Results
MAXI carries two scientific instruments: the GSC andthe Solid State Camera (SSC). GSC consists of twelve one-dimensional position-sensitive proportional counters operatedin the 2–20 keV range, while SSC is composed of 32 X-rayCCD cameras with an energy range of 0.5–12 keV. GSCobserves two different directions (horizontal and zenithal direc-tion) with an instantaneous field of view of 3ı � 160ı, eachcovered by six cameras. It covers 70% of the whole sky inevery orbit 32 times per day at maximum. Both instrumentshave been working properly in orbit, but four out of the twelveGSC cameras have been turned off due to discharges in theproportional counters. See Matsuoka et al. (2009) for moredetails concerning MAXI. In this paper, we use only the GSCdata, which offer a larger sky coverage and effective area thanthose of SSC.
Figure 1 shows two 1-month integrated X-ray sky imageswith a radius of 10ı centered on XTE J1752�223 in the 2–20 keV band. These false-color images are produced by super-posing red (2–4 keV), green (4–10 keV), and blue (10–20 keV)images. Data from all of the counters were combined, andtwo images were made for two separate periods (from 2009December 20, to 2010 January 19, and 2010 January 20 to

No. 5] MAXI/GSC Observations of XTE J1752�223 L29
Fig. 2. MAXI light curve of XTE J1752�223 in four energy ranges (2–20, 2–4, 4–10, and 10–20 keV from the top to the fourth panel) in comparisonwith Swift / BAT (15–50 keV: the fifth panel). The hardness ratio between the 2–4 keV and the 4–10 keV bands is shown in the bottom panel. Right panel:The period in the left panel when the plasma ejection was detected (January 21 as shown by the dashed line) is expanded.
2010 February 28). XTE J1752�223 is clearly detected inboth GSC images. Because of its location near the GalacticCenter (l , b) = (6:ı42, 2:ı11), many bright X-ray sources, suchas GX 9+1, GX 5�1, and GX 3+1, are visible in this field.The point spread function (PSF) of the MAXI / GSC is esti-mated to be about 2:ı0 (FWHM) in this energy range. Theposition of XTE J1752�223, determined by GSC, is consistentwith the Swift / XRT localization.
We calculated the net source counts by subtracting the back-ground from the on-source data. To avoid source contami-nation from the nearby bright sources GX 9+1 (2:ı82 away)and SAX J1748.9�2021 in the globular cluster NGC 6440(Patruno et al. 2010; 2:ı13 away), we carefully selected thesource and background regions as circles of 1:ı17 and 2:ı48radius, respectively (see figure 1). The extracted source countswere normalized by dividing by the total exposure (in units ofcm2 s) obtained with a time integral of the collimator effec-tive area. The Crab Nebula was analyzed in the same way,and the count rates of XTE J1752�223 were normallized by
the Crab unit (1.30, 1.25, and 0.32 counts cm�2 s�1 in the 2–4,4–10, and 10–20 keV range). The thus-obtained 1-day aver-aged light curve of XTE J1752�223 is shown in figure 2. GSCscans were performed approximately 10 times per day. A datagap from December 7th to 23th was due to a solar avoid-ance limitation (the current solar protection is set at above 4ıfrom the Sun).
The X-ray light curve shows the following notable features.There are two initial plateau phases that lasted for � 25 d and�40 d, respectively, and the spectral hardness between them isslightly different: the second phase (Phase D in figure 2) hasa softer spectrum than the first one (Phase B). The source couldnot be observed during phase D by any other X-ray instru-ments, except for RXTE / ASM and Swift / BAT due to the Sunconstraints. The time scales of rising phases A and C wereabout 5 d and 15 d, respectively. Another notable feature isan anti-correlated behavior around the peak. The 2–4 keV fluxrapidly increased after 2010 January 20 (MJD: 55216), whilefluxes in the other two bands and the Swift / BAT 15–50 keV
LE
TT
ER
LE
TT
ER
LE
TT
ER
LE
TT
ER
LE
TT
ER
LE
TT
ER
LE
TT
ER
LE
TT
ER
LE
TT
ER

L30 S. Nakahira et al. [Vol. 62,
Fig. 3. Hardness–intensity diagram during the outburst of XTEJ1752�223. Data points during the six phases (A to H) are shownby the different symbols; 6 hr of integrations were used in Phase E,F, and G, while one-day integrations were used for the other phases.The spectral evolution generally moves in the direction shown by thearrows. Filled diamonds show the data when increased radio emissions,presumably jets, were detected on 2010 January 21.
flux decreased (Phase E for � 9 d). The anti-correlationbetween the soft and hard bands indicates a spectral transi-tion. This fact means that it took a very long time of � 90 dfor the source to complete the transition after the onset of anoutburst. The 2–20 keV flux reached a peak on 2010 January 23(MJD: 55219) at about the 430 mCrab level, and then gradu-ally decreased (Phase F). The emissions during Phase F weredominated by the soft bands (<4 keV) (see also the lower panelof figure 1). Around March 28 (MJD: 55283), hard X-raysand the hardness ratio again increased (Phase G and H). Theoutburst had continued at the time of writing this paper (theend of 2010 May), and the current duration for the outburst isabout 210 d.
Figure 3 shows a hardness–intensity diagram for thecurrently on-going outburst in XTE J1752�223. Because ofthe anti-correlated behavior between the soft and hard X-raysduring Phases E and G, the data points track the Q-shapedcurve, i.e., hysteresis behavior, as seen in other BHCs (Homan& Belloni 2005). The two plateau phases B and D corre-spond to the LHS, while the softer phase F corresponds withthe HSS. Thus, the state transition from the LHS to the HSScan be clearly identified with the MAXI / GSC data alone.A color–color diagram is also shown in figure 4. A line isplotted for a power-law spectral model with a photon index (Γ)ranging from 1.0 to 5.0 modified by the absorption (equivalenthydrogen column density NH = 0.72 � 1022 cm�2; Munoz-Darias et al. 2010). Note that the current GSC energy responsegives systematic uncertainties of about 0.5 � 1022 cm�2 and0.1 in NH and Γ, respectively. As the outburst proceeds, the Γcontinuously varies from � 1.5 to � 5.0. The spectral shapesduring Phases B + D and F is approximated by a power-lawwith photon indices of 1.5–2.0 and above 3.5, respectively.These estimated photon indices are roughly consistent withtypical values found from BHCs in the LHS (Phase B + D)and the HSS (Phase F). The power-law index in Phase E
Fig. 4. Color–color diagram during the outburst of XTE J1752�223.The same symbols are used in figure 3. The dashed line represents thespectral shapes of an absorbed power-law with a photon index rangingfrom 1.0 to 5.0. The open triangles correspond to photon indices from1.0 to 5.0 (0.5 step), from upper-right to lower-left.
shows an intermediate value (2.0–3.0) between those seen inLHS and HSS. An RXTE-pointed observation carried out on2010 January 19 (MJD: 55215) during Phase E shows that thesource was at least in the IMS (Shaposhnikov 2010). Detailedspectral parameters and their evolution in this outburst willbe reported in a forthcoming paper (K. Yamaoka et al. 2010,in preparation).
3. Discussions
We have presented the first results on the black-holecandidate XTE J1752�223 in the current outburst from theMAXI / GSC on ISS. Judging from the light curve and spec-tral hardness, we have found that the source was initially inthe LHS with two long plateau phases (B and D). After a longstay (� 90 d) in the LHS, it exhibited a spectral transition viathe IMS (Phase E) into the HSS at around 2010 January 22(Phase F). The source came back to the LHS at around 2010April 3 (Phase H), and the source flux is gradually decliningtoward the quiescent state.
It should be noted that a relatively high level of radio emis-sion was detected by the Australia Telescope Compact Array(ATCA) on 2010 January 21 (Brocksopp et al. 2010a), justcorresponding to the beginning of the spectral transition fromthe LHS to the HSS. The GSC spectrum on this date is roughlyrepresented by a power-law with a photon index of 2.5–3.0 (seefigure 4), suggesting that the source was probably in the IMS.Later, two separate radio sources were identified with high-resolution imaging by the European VLBI Network (e-EVN)(Brocksopp et al. 2010b). If we interpret it as being plasmaejection, it is consistent with the scenario that large-scale jetsare produced in association with the spectral transition fromthe LHS to the HSS. Another important result is that the lumi-nosities during the transition from the HSS to the LHS, andfrom the LHS to the HSS were not the same: the hard-to-soft

No. 5] MAXI/GSC Observations of XTE J1752�223 L31
transition occurred at a 2–20 keV flux higher by a factor ofabout 7 than that at the soft-to-hard transition. Such hysteresisbehavior was first noticed for GS 1124�68 and GX 339�4(Miyamoto et al. 1995), and has been well established formany BHCs. This means that the spectral transition is notcontrolled by the mass-accretion rate alone, but depends onits history. Most of the BHCs show a rapid flux rise withina few days, which causes a near-instantaneous spectral transi-tion (Gierlinski & Newton 2006), and then their fluxes decaywith an e-folding time of several ten days into quiescence(some BHCs show a secondary flare). It is known that the spec-tral state begins with the initial LHS, and then evolves throughthe VHS / IMS, HSS, and LHS during an outburst. However,about 8 BHCs, such as XTE J1118+480 and GRO J0422+32,remained in the LHS throughout their previous outbursts(Brocksopp et al. 2001). The very long duration of theinitial LHS in XTE J1752�223 and the two long plateauphases are rather uncommon for the BHC outbursts. Meyer-Hofmeister (Meyer-Hofmeister 2004) points out that systemswith short orbital periods, like XTE J1118+480 (4.1 hr) andGRO J0422+32 (5.1 hr), tend to have low peak luminositiesin their outbursts (and hence do not show state transition)because smaller accretion disks have less accumulated matter.The long LHS observed in XTE J1752�223 might be relatedto a short orbital period. From our observations, however,XTE J1752�223 also resembles GX 339�4, which remainedin the LHS for a long period before a transition into the HSS(McClintock & Remillard 2006). GX 339�4 has a relativelylong orbital period (1.7 d) among BHCs categorized in low-mass X-ray binaries, indicating a larger accretion-disk size. Inthis case, the unusually long duration of the LHS before thestate transition would result from a gradual change in the accre-tion rate. It is still unclear what causes the slow increase ofthe accretion rate, in contrast to other X-ray novae. Therefore,determining the orbital period of XTE J1752�223 should beimportant to clarify the nature of the long LHS period.
Let us explain the overall picture of the light curve of theXTE J1752�223 outburst. We never assume the generallyaccepted disk-truncation scenario in the LHS, though someother scenarios have been proposed for the LHS, e.g., Liu et al.2007, where the innermost radius of the disk (Rin) is basicallydetermined by the balance between the accretion rate and thegas evaporation rate (Meyer et al. 2000; Liu et al. 2002; Doneet al. 2007). In this scenario, the LHS is the state where theaccretion disk is truncated at a larger radius than the InnermostStable Circular Orbit (ISCO = 3 Schwarzschild radii for a non-rotating BH), due to a low accretion rate. As the accretion rateincreases (then begins in an outer part of the accretion disk),Rin decreases. When the radius decreases, the corona aroundthe disk cools down via efficient inverse Compton scattering ofthe soft disk photons, and exhibits softer X-ray spectra. Thus,the two phases in the LHS (B and D) can be interpreted witha slightly higher accretion rate in Phase D than that in Phase B.
Furthermore, when the accretion rate eventually exceeds a crit-ical rate required for the state transition, the gas evaporationwill not be strong enough to truncate the disk. Thus, Rin
reaches the ISCO, and intense thermal radiation from the accre-tion disk, i.e., an ultra-soft component, appears in soft X-rays(Phase F in the HSS). The disk truncation scenario does notpredict any time evolution of Rin during the HSS. As can beseen in the light curve with a very smooth decay during theHSS, the local accretion rate smoothly decreases with time.When it falls below the critical rate again, the source comesback to the LHS (Phase H).
The significant increase mainly in the 2–4 keV band suggeststhat the disk innermost temperature (kTin) is relatively low.Preliminary fits of the MAXI / GSC data with the disk black-body model (Mitsuda et al. 1984) during Phase F revealed thatkTin was 0.4–0.7 keV, including a systematic uncertainty of0.1 keV. The Swift / XRT observation taken on 2010 February 4also showed that the blackbody temperature is about 0.5 keV(Curran et al. 2010). This temperature is lower than those ofother BHCs, such as GRO J1655�40 and XTE J1550�564,whose kTin in the HSS exceeds 1 keV (Gierlinski & Done2004). The variation of kTin is determined by how much theaccretion rate exceeds the critical rate, and hence a low kTin
indicates that the accretion rate in the HSS is just above thecritical rate. It is known that the spectral transition from theLHS to the HSS will occur at around 10%–20% Eddingtonluminosity, but with large uncertainties (Wu et al. 2010).The kTin for the Schwarzschild BH can be estimated to be�1.2 keV (M=10 Mˇ)�1=4(�=1.0)1=4(h=1.7) (e.g., Makishimaet al. 2000), where h is the spectral hardening factor (Shimura& Takahara 1995), � is the Eddington ratio (L=LE), and Mis the mass of the central object. Assuming that the maximumkTin is 0.6–0.7 keV and � is 0.1–0.2, the black-hole mass canbe roughly estimated at 8.6–32 Mˇ. The GSC flux in the2–10 keV range at the outburst peak (2010 January 23) was9.7 � 10�9 erg cm�2 s�1 with a � 20% absolute flux uncer-tainty. Assuming that (1) the 2–10 keV flux is 21%–28% of thebolometric flux based on the disk blackbody model, and that(2) the Eddington luminosity is 1.5 � 1038 (M=Mˇ) erg s�1,the distance to the source can be estimated as being 5–10 kpc.
The authors are indebted to many other members of theMAXI team and the ISS / MAXI operation team for theirefforts during the data acquisition and the daily MAXI oper-ation. This research was partially supported by the Ministryof Education, Culture, Sports, Science and Technology(MEXT), Grant-in-Aid No. 19047001, 20041008, 20540230,20244015, 21340043, 21740140, 22740120, and Global-COE from MEXT “The Next Generation of Physics, Spunfrom Universality and Emergence” and “Nanoscience andQuantum Physics”. One of the authors (K. Y.) is grateful toDr. T. Kawaguchi and Dr. P. Gandhi for valuable discussions.The authors also acknowledge the Swift / BAT team for makingthe hard X-ray transient monitor results publicly available.1
1 hhttp://heasarc.gsfc.nasa.gov/docs/swift/results/transients/i.
LE
TT
ER
LE
TT
ER
LE
TT
ER
LE
TT
ER
LE
TT
ER
LE
TT
ER
LE
TT
ER
LE
TT
ER
LE
TT
ER

L32 S. Nakahira et al.
References
Brocksopp, C., Corbel, S., Tzioumis, T., & Fender, R. 2009, Astron.Telegram, 2278
Brocksopp, C., Corbel, Tzioumis, T., Fender, R., & Coriat, M. 2010a,Astron. Telegram, 2400
Brocksopp, C., Jonker, P. G., Fender, R. P., Groot, P. J.,van der Klis, M., & Tingay, S. J. 2001, MNRAS, 323, 517
Brocksopp, C., Yang, J., Corbel, S., Zunis, T., & Fender, R. 2010b,Astron. Telegram, 2438
Curran, P. A., Evans, P. A., Still, M., Brocksopp, C., & Done, C. 2010,Astron. Telegram, 2424
Done, C., Gierlinski, M., & Kubota, A. 2007, A&AR, 15, 1Esin, A. A., McClintock, J. E., & Narayan, R. 1997, ApJ, 489, 865Fender, R. 2006, in Compact Stellar X-ray Sources, ed.
W. H. G. Lewin, & M. van der Klis (Cambridge: Cambridge Univ.Press), 381
Gierlinski, M., & Done, C. 2004, MNRAS, 347, 885Gierlinski, M., & Newton, J. 2006, MNRAS, 370, 837Homan, J., & Belloni, T. 2005, Ap&SS, 300, 107Liu, B. F., Mineshige, S., Meyer, F., Meyer-Hofmeister, E.,
Kawaguchi, T. 2002, ApJ, 575, 117Liu, B. F., Taam, R. E., Meyer-Hofmeister, E., & Meyer, F. 2007, ApJ,
671, 695Makishima, K., et al. 2000, ApJ, 535, 632Markoff, S., Falcke, H., & Fender, R. 2001, A&A, 372, L25Markwardt, C. B., et al. 2009a, Astron. Telegram, 2258Markwardt, C. B., Barthelmy, S. D., Evans, P. A., & Swank, J. H.
2009b, Astron. Telegram, 2261Matsuoka, M., et al. 2009, PASJ, 61, 999
Matsuoka M., et al. 2010, in AIP Conf. Proc., 1248, X-ray Astronomy2009, ed. A. Comastri et al. (New York: AIP), 531
McClintock, J. E., & Remillard, R. A. 2006, in Compact Stellar X-raySources, ed. W. H. G. Lerwin & M. van der Klis (Cambridge:Cambridge Univ. Press), 157
Meyer, F., Liu, B. F., & Meyer-Hofmeister, E. 2000, A&A, 354, L67Meyer-Hofmeister, E. 2004, A&A, 423, 321Mitsuda, K., et al. 1984, PASJ, 36, 741Miyamoto, S., Kitamoto, S., Hayashida, K., & Egoshi, W. 1995, ApJ,
442, L13Munoz-Darias, T., Motta, S., Pawar, D., Belloni, T. M., Campana, S.,
& Bhattacharya, D. 2010, MNRAS, 404, L94Nakahira, S., et al. 2009, Astron. Telegram, 2259Negoro, H., et al. 2010, Astron. Telegram, 2396Patruno, A., et al. 2010, Astron. Telegram, 2407Shaposhnikov, N. 2010, Astron. Telegram, 2391Shaposhnikov, N., Markwardt, C. B., & Swank, J. H. 2009, Astron.
Telegram, 2269Shimura, T., & Takahara, F. 1995, ApJ, 445, 780Torres, M. A. P., Jonker, P. G., Steeghs, D., Yan, H., Huang, J., &
Soderberg, A. M. 2009a, Astron. Telegram, 2263Torres, M. A. P., Steeghs, D., Jonker, P. G., Thompson, I., &
Soderberg, A. M. 2009b, Astron. Telegram, 2268Ueno, S., et al. 2010, in Proc. The Extreme sky: Sampling the
Universe above 10 keV, (Torieste: SISSA) PoS (extremesky2009)011
Wu, X. Y., Yu, W., Yan, Z., Sun, L., & Li, T. P. 2010, A&A, 512, 32Yuan, F., Cui, W., & Narayan, R. 2005, ApJ, 620, 905


