MAX-DOAS measurements of NO2, HCHO and CHOCHO at a rural ...
19
Atmos. Chem. Phys., 13, 2133–2151, 2013 www.atmos-chem-phys.net/13/2133/2013/ doi:10.5194/acp-13-2133-2013 © Author(s) 2013. CC Attribution 3.0 License. Atmospheric Chemistry and Physics Open Access MAX-DOAS measurements of NO 2 , HCHO and CHOCHO at a rural site in Southern China X. Li 1,2 , T. Brauers 2 , A. Hofzumahaus 2 , K. Lu 1,2 , Y. P. Li 1,2 , M. Shao 1 , T. Wagner 3 , and A. Wahner 2 1 College of Environmental Sciences and Engineering, Peking University, Beijing, China 2 Institute for Energy- and Climate Research (IEK-8), Forschungszentrum J¨ ulich, J ¨ ulich, Germany 3 Max-Planck-Institut for Chemistry, Mainz, Germany Correspondence to: T. Brauers ([email protected]) Received: 12 January 2012 – Published in Atmos. Chem. Phys. Discuss.: 3 February 2012 Revised: 4 February 2013 – Accepted: 14 February 2013 – Published: 25 February 2013 Abstract. We performed MAX-DOAS measurements during the PRIDE-PRD2006 campaign in the Pearl River Delta re- gion (PRD), China, for 4 weeks in July 2006 at a site lo- cated 60 km north of Guangzhou. The vertical distributions of NO 2 , HCHO, and CHOCHO were independently retrieved by an automated iteration method. The NO 2 mixing ratios measured by MAX-DOAS showed reasonable agreement with the simultaneous, ground based in-situ data. The tro- pospheric NO 2 vertical column densities (VCDs) observed by OMI on board EOS-Aura satellite were higher than with those by MAX-DOAS. The 3-D chemical transport model CMAQ overestimated the NO 2 VCDs as well as the surface concentrations by about 65 %. From this observation, a re- duction of NO x emission strength in CMAQ seems to be nec- essary in order to well reproduce the NO 2 observations. The average mixing ratios of HCHO and CHOCHO were 7 ppb and 0.4 ppb, respectively, higher than in other rural or semiru- ral environments. The high ratio of 0.062 between CHOCHO and HCHO corresponds to the high VOCs reactivity and high HO x turnover rate consistent with other observations during the campaign. 1 Introduction Multi-axis differential optical absorption spectroscopy (MAX-DOAS) is an effective remote sensing method for measuring tropospheric trace gases such as SO 2 , HCHO, NO 2 , CHOCHO (Irie et al., 2011; Wagner et al., 2011, and references therein). MAX-DOAS uses scattered sunlight at different elevation angles α (i.e. the angle between horizon and the pointing direction of the telescope). The slant column density (SCD), which is the concentration of a species inte- grated along the paths where the registered photons traveled, can be derived from a DOAS fit. Despite the simplicity of the experimental setup, the conversion from measured SCDs to trace gas concentrations or profiles is a demanding task. As illustrated in Table 1, along with the numerous MAX-DOAS applications in the past decades, different methodologies for deriving the trace gas concentrations have been developed. The geometric approach, which is based on the assumption that the last scattering of a photon happens above the ab- sorber layer, was used for estimating the trace gas concentra- tions in remote areas (Leser et al., 2003). However, for MAX- DOAS observations in the UV or at high aerosol loads the single scattering assumption is not valid. Under these condi- tions, radiative transfer models (RTMs) are required to derive trace gas profiles from measured SCDs. The different RTMs (see Table 1) calculate SCDs for trace gases on the basis of trace gas profiles as input to the model. In order to optimize the model input an inversion method is needed. This can ei- ther be optimal estimation (Rodgers, 2000) or an iteration procedure as presented by Pikelnaya et al. (2007). Both al- gorithms consist of two steps, i.e. first the aerosol extinction profile is retrieved from the measured oxygen dimer (O 4 ) absorptions, then the trace gas profile is retrieved from the measured trace gas absorptions taking the aerosol extinction profile into account. Given that routine MAX-DOAS mea- surements often generate large data sets, an automated in- version method (e.g., Irie et al., 2011) is highly preferable. Inherently, only 2–3 independent pieces of profile informa- tion can be retrieved from the MAX-DOAS measurements. Published by Copernicus Publications on behalf of the European Geosciences Union.
Transcript of MAX-DOAS measurements of NO2, HCHO and CHOCHO at a rural ...

Atmos. Chem. Phys., 13, 2133–2151, 2013www.atmos-chem-phys.net/13/2133/2013/doi:10.5194/acp-13-2133-2013© Author(s) 2013. CC Attribution 3.0 License.
EGU Journal Logos (RGB)
Advances in Geosciences
Open A
ccess
Natural Hazards and Earth System
Sciences
Open A
ccess
Annales Geophysicae
Open A
ccessNonlinear Processes
in Geophysics
Open A
ccess
Atmospheric Chemistry
and PhysicsO
pen Access
Atmospheric Chemistry
and Physics
Open A
ccess
Discussions
Atmospheric Measurement
Techniques
Open A
ccess
Atmospheric Measurement
Techniques
Open A
ccess
Discussions
Biogeosciences
Open A
ccess
Open A
ccess
BiogeosciencesDiscussions
Climate of the Past
Open A
ccess
Open A
ccess
Climate of the Past
Discussions
Earth System Dynamics
Open A
ccess
Open A
ccess
Earth System Dynamics
Discussions
GeoscientificInstrumentation
Methods andData Systems
Open A
ccess
GeoscientificInstrumentation
Methods andData Systems
Open A
ccess
Discussions
GeoscientificModel Development
Open A
ccess
Open A
ccess
GeoscientificModel Development
Discussions
Hydrology and Earth System
Sciences
Open A
ccess
Hydrology and Earth System
Sciences
Open A
ccess
Discussions
Ocean Science
Open A
ccess
Open A
ccess
Ocean ScienceDiscussions
Solid Earth
Open A
ccess
Open A
ccess
Solid EarthDiscussions
The Cryosphere
Open A
ccess
Open A
ccess
The CryosphereDiscussions
Natural Hazards and Earth System
Sciences
Open A
ccess
Discussions
MAX-DOAS measurements of NO2, HCHO and CHOCHO ata rural site in Southern China
X. Li 1,2, T. Brauers2, A. Hofzumahaus2, K. Lu 1,2, Y. P. Li1,2, M. Shao1, T. Wagner3, and A. Wahner2
1College of Environmental Sciences and Engineering, Peking University, Beijing, China2Institute for Energy- and Climate Research (IEK-8), Forschungszentrum Julich, Julich, Germany3Max-Planck-Institut for Chemistry, Mainz, Germany
Correspondence to:T. Brauers ([email protected])
Received: 12 January 2012 – Published in Atmos. Chem. Phys. Discuss.: 3 February 2012Revised: 4 February 2013 – Accepted: 14 February 2013 – Published: 25 February 2013
Abstract. We performed MAX-DOAS measurements duringthe PRIDE-PRD2006 campaign in the Pearl River Delta re-gion (PRD), China, for 4 weeks in July 2006 at a site lo-cated 60 km north of Guangzhou. The vertical distributionsof NO2, HCHO, and CHOCHO were independently retrievedby an automated iteration method. The NO2 mixing ratiosmeasured by MAX-DOAS showed reasonable agreementwith the simultaneous, ground based in-situ data. The tro-pospheric NO2 vertical column densities (VCDs) observedby OMI on board EOS-Aura satellite were higher than withthose by MAX-DOAS. The 3-D chemical transport modelCMAQ overestimated the NO2 VCDs as well as the surfaceconcentrations by about 65 %. From this observation, a re-duction of NOx emission strength in CMAQ seems to be nec-essary in order to well reproduce the NO2 observations. Theaverage mixing ratios of HCHO and CHOCHO were 7 ppband 0.4 ppb, respectively, higher than in other rural or semiru-ral environments. The high ratio of 0.062 between CHOCHOand HCHO corresponds to the high VOCs reactivity and highHOx turnover rate consistent with other observations duringthe campaign.
1 Introduction
Multi-axis differential optical absorption spectroscopy(MAX-DOAS) is an effective remote sensing method formeasuring tropospheric trace gases such as SO2, HCHO,NO2, CHOCHO (Irie et al., 2011; Wagner et al., 2011, andreferences therein). MAX-DOAS uses scattered sunlight atdifferent elevation anglesα (i.e. the angle between horizon
and the pointing direction of the telescope). The slant columndensity (SCD), which is the concentration of a species inte-grated along the paths where the registered photons traveled,can be derived from a DOAS fit. Despite the simplicity of theexperimental setup, the conversion from measured SCDs totrace gas concentrations or profiles is a demanding task. Asillustrated in Table1, along with the numerous MAX-DOASapplications in the past decades, different methodologies forderiving the trace gas concentrations have been developed.The geometric approach, which is based on the assumptionthat the last scattering of a photon happens above the ab-sorber layer, was used for estimating the trace gas concentra-tions in remote areas (Leser et al., 2003). However, for MAX-DOAS observations in the UV or at high aerosol loads thesingle scattering assumption is not valid. Under these condi-tions, radiative transfer models (RTMs) are required to derivetrace gas profiles from measured SCDs. The different RTMs(see Table1) calculate SCDs for trace gases on the basis oftrace gas profiles as input to the model. In order to optimizethe model input an inversion method is needed. This can ei-ther be optimal estimation (Rodgers, 2000) or an iterationprocedure as presented byPikelnaya et al.(2007). Both al-gorithms consist of two steps, i.e. first the aerosol extinctionprofile is retrieved from the measured oxygen dimer (O4)absorptions, then the trace gas profile is retrieved from themeasured trace gas absorptions taking the aerosol extinctionprofile into account. Given that routine MAX-DOAS mea-surements often generate large data sets, an automated in-version method (e.g.,Irie et al., 2011) is highly preferable.Inherently, only 2–3 independent pieces of profile informa-tion can be retrieved from the MAX-DOAS measurements.
Published by Copernicus Publications on behalf of the European Geosciences Union.
2134 X. Li et al.: MAX-DOAS trace gases measurements in China
Table 1.Overview of MAX-DOAS trace gas measurements.
Location Period #a Species RTM Methodology Ref.
Alert, Canada Apr–May 2000 6 BrO – Geometric approach 1Atlantic Ocean Oct 2000 6 NO2, BrO – Geometric approach 2Montserrat island May 2002 10 SO2, BrO – Geometric approach 3Ny-Alesund Svalbard Jul 2002 5 NO2 SCIATRAN Predefined trace gas profile 4
+RTM calculationPo-valley, Italy Sep 2003 5 HCHO SCIATRAN Manual iteration method 5Cambridge & Gulf of Maine, USA Jul–Aug 2004 5 NO2, HCHO, CHOCHO TRACY Manual iteration method 6Reunion Island Aug 2004–Jun 2005 5 BrO DISORT Predefined profiles+OEMb 7Mount Tai, China Jun 2006 5 HCHO, NO2 MCARaTS Parametrized profile+OEM 8Cabauw, Netherlands Jun–Jul 2009 6 SO2, HCHO, NO2, CHOCHO MCARaTS Parametrized profile+OEM 9Po-valley, Italy Sep 2003 5 HCHO, NO2 McArtim Parametrized profile+LMA c 10Pearl River Delta, China Jul 2006 7 NO2, HCHO, CHOCHO McArtim Parametrized profile+LMA 11
a Number of elevation angles,b Optimal Estimation Method,c Levenberg-Marquardt Algorithm1 Honninger and Platt(2002), 2 Leser et al.(2003), 3 Bobrowski et al.(2003) 4 Wittrock et al.(2004), 5 Heckel et al.(2005), 6 Pikelnaya et al.(2007); Sinreich et al.(2007), 7 Theys et al.(2007), 8 Inomata et al.(2008); Irie et al.(2008), 9 Irie et al.(2011), 10 Wagner et al.(2011), 11 this work.
Therefore, during the inversion process, either a-priori infor-mation on the profile needs to be provided or a profile pa-rameterization needs to be applied based on assumptions onthe profile shape. Recent studies have compared the MAX-DOAS measured trace gas (e.g. NO2, HCHO) concentrationsin the boundary layer to those obtained by in-situ techniques.In general, the differences were within 30 % (Pikelnaya et al.,2007; Inomata et al., 2008; Irie et al., 2011; Wagner et al.,2011). In addition, MAX-DOAS can serve as a tool to val-idate satellite-borne trace gas observations. The differencesbetween MAX-DOAS and satellite measured NO2 tropo-spheric vertical column densities were found to be 10–50 %for selected regions (Irie et al., 2008; Brinksma et al., 2008).
With the fast economic growth, the air quality has beenof increasing concern in the Pearl River Delta (PRD) re-gion in Southern China. In the last years, PRD was iden-tified by satellite measurements as one of the “hot-spots”of NO2, HCHO, and CHOCHO (Richter et al., 2005; Wit-trock et al., 2006; Vrekoussis et al., 2009). The observed highNO2 levels reflect the prevailing anthropogenic emissionsources, e.g. vehicles and industrial sources. Since HCHOand CHOCHO are mainly produced through the oxidationof volatile organic compounds (VOCs), their high concentra-tion levels indicate the large photochemical turnover in thePRD atmosphere. However, only a few ground-based HCHOand CHOCHO measurements were reported for this region.During the PRIDE-PRD2006 field campaign, we performedone month of continuous MAX-DOAS observations for O4,NO2, HCHO, and CHOCHO. An automated aerosol retrievalmethod using O4 absorption was developed, and the retrievedaerosol extinction agreed well with the total aerosol scatter-ing measured by a nephelometer (Li et al., 2010). Here, wepresent the retrieval method and results for NO2, HCHO, andCHOCHO concentrations. These results are discussed withrespect to simultaneously measured in-situ data, satellite ob-servations, and chemical transport model simulations.
2 Experimental
2.1 Field campaign and measurement site
The PRIDE-PRD2006 field campaign took place in July2006 in the Pearl River Delta (PRD) region in SouthernChina within the framework of the “Program of RegionalIntegrated Experiments of Air Quality over the Pearl RiverDelta” (PRIDE-PRD2006). The campaign focused on pho-tochemistry and the formation of secondary pollutants likeozone and particles (Zhang et al., 2012). The MAX-DOASmeasurements were conducted at one of the campaign su-persites Back Garden (BG) located 23.50◦N and 113.03◦ E.The BG site is approximately 60 km NW of downtownGuangzhou. It is located next to a water reservoir and is sur-rounded by farmland and small forests. During the campaign,the local traffic was quite limited. However, road works,building constructions, and biomass and cable burning wereoccasionally observed in the surrounding areas. The biomassand cable burning events were intense and prevailing in theperiod between 23 July and 25 July leading to high concen-trations of aerosols and trace gases (Garland et al., 2008;Lou et al., 2010). The entire campaign was characterizedby tropical weather conditions with high temperatures (28–36◦C) and high humidities (60–95 % RH). Extended rain-fall occurred in periods influenced by typhoons Bilis (15–18 July) and Kaemi (26–29 July). The wind speed at BGsite was usually low (less than 2 m s−1) in most of the time,which is a typical situation for inland areas in PRD duringsummer time (Fan et al., 2011). Such meteorological condi-tions favor the formation and accumulation of air pollution.High OH radical concentrations with noontime peak valuesof (1.5–2.6)×107 cm−3 as well as high OH reactivitieskOHwith values between 20 s−1 and 120 s−1 were observed atthe BG site during the campaign (Lou et al., 2010; Lu et al.,2012). These observations indicate a strong photochemicalprocessing compared to those in other places in the world.
Atmos. Chem. Phys., 13, 2133–2151, 2013 www.atmos-chem-phys.net/13/2133/2013/
X. Li et al.: MAX-DOAS trace gases measurements in China 2135
A comprehensive suite of instruments was simultaneouslyoperated at the BG supersite for the characterization of tracegases (Hua et al., 2008; Hofzumahaus et al., 2009; Lou et al.,2010; Lu et al., 2012; Li et al., 2011) and aerosols (Garlandet al., 2008; Li et al., 2010; Yue et al., 2010; Xiao et al.,2011) in the local atmosphere. Measurements of NOx, O3,SO2, H2O2, CO, CH4, C3-C12 VOCs, CH3OOH, HCHO,CHOCHO, aerosol physical and chemical properties, andphotolysis frequencies were performed on top of a hotelbuilding (10 m a.g.l.) which was exclusively used by the mea-surement team. OH, HO2, HONO, and OH reactivities weremeasured on top of a two stacked sea containers locatedabout 200 m away from the hotel building. Detailed infor-mation with respect to the instrumentations, the accuracy andprecision of the measurements can be found inHofzumahauset al.(2009), Yue et al.(2010), andLi et al. (2011).
2.2 MAX-DOAS
Our MAX-DOAS measurements were conducted by a com-mercial Mini-MAX-DOAS instrument (Fa. Hoffmann,Rauenberg, Germany). Since the instrument setup was de-scribed in detail byLi et al. (2010), only a brief outlinefollows. The Mini-MAX-DOAS instrument was installed ontop of the hotel building, pointing East. It uses a miniaturecrossed Czerny-Turner spectrometer unit USB2000 (OceanOptics Inc.) for spectrum recording. The spectrometer cov-ers the spectral range of 292 nm to 443 nm with a spectralresolution of≈0.7 nm full width at half maximum (FWHM).The scattered sunlight was collected and focused by a quartzlens and was led into the spectrometer unit by a quartz fiberbundle. A step motor was used for adjusting the viewing di-rection to a desired elevation angleα, i.e. 90◦, 30◦, 20◦, 15◦,10◦, 5◦, and 3◦. During daytime, one measurement cycle con-sisted of the sequential recording of the scattered sunlightspectrum at the seven elevation angles and took 10–15 min.For each spectrum, a constant signal level (i.e. 80 % of thesaturation of the detector) was achieved by adjusting the in-tegration time. During night, the instrument was set to recorddark current and offset spectra. A fully automated program(MiniMax, Udo Friess, University of Heidelberg) was em-ployed for the MAX-DOAS measurements.
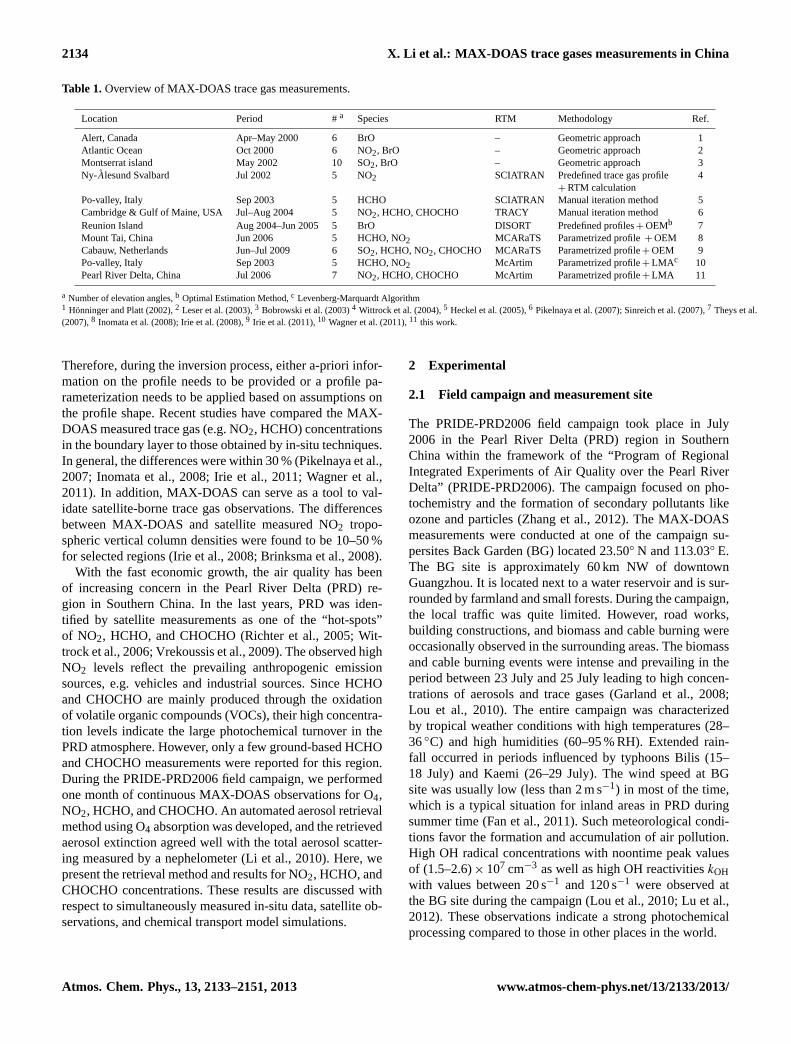
The differential slant column density (DSCD) is definedas the difference of the slant column density (SCD) betweenα 6=90◦ and α = 90◦ (c.f. Wagner et al., 2011). DSCDs ofNO2, HCHO, and CHOCHO were determined by DOAS fitin the wavelength range where they have prominent absorp-tions. Figure1 illustrates an example of the DOAS fit for thespectrum recorded on 19 July 2006 at 10:59, at a solar zenithangle of 23◦ and an elevation angle of 3◦. For each measure-ment cycle, the corresponding zenith spectrum (α = 90◦) wastaken as Fraunhofer reference spectrum (FRS) for the off-axis elevation angles (i.e.α 6=90◦). This largely eliminatesthe stratospheric contributions to the DSCDs. The Ring spec-trum was calculated from each measured spectrum (Busse-
Fig. 1. Example of DOAS fit results for(a) HCHO, (b) NO2, and(c) CHOCHO. The evaluated spectrum was recorded on 19 July2006 at 10:59 LT, atα=3◦. Red line represents the fitted referencespectrum. Black line is the fit residual plus the absorption of the tar-get species. Detailed settings of the DOAS fit are listed in Table S1in the Supplement.
mer, 1993). For the fit of the absorbing trace gases, we usedhigh resolution absorption cross sections which were con-volved with the wavelength dependent instrument’s slit func-tion to match the resolution of the instrument (except for theO4 spectrum which was interpolated). These references in-clude HCHO (Meller and Moortgat, 2000), BrO (Wilmouthet al., 1999), CHOCHO (Volkamer et al., 2005), H2O (Roth-man et al., 2005), NO2 (Voigt et al., 2002), O3 at 280 K(Voigt et al., 2001), and O4 (Greenblatt et al., 1990) witha manual adjustments of wavelength axis (R. Sinreich, per-sonal communication, 2007). In addition, the solar I0-effect(Platt et al., 1997) was corrected for NO2 and O3 refer-ence spectra with slant column density of 1.5×1017 cm−2
and 1.5×1020 cm−2, respectively. The wavelength calibra-tion and the wavelength dependent instrument’s slit functionwere calculated from a fit of the measured Fraunhofer refer-ence spectra to a high resolution Fraunhofer spectrum (Ku-rucz et al., 1984). It should be noted that in the first versionof our manuscript (Li et al., 2012) we used a constant slit
www.atmos-chem-phys.net/13/2133/2013/ Atmos. Chem. Phys., 13, 2133–2151, 2013

2136 X. Li et al.: MAX-DOAS trace gases measurements in China
Table 2. Parameter settings of RTM calculations for NO2, HCHO,and CHOCHO DSCDs.
Parameter ValueNO2 HCHO CHOCHO
Wavelength 435 nm 339 nm 440 nmSurface albedo 7 %Single scattering albedo (SSA) 0.85Asymmetry factor (g) 0.68Aerosol profile from O4 DSCDs at 360 nma
O3 profile USSAb filled with 40 ppb from 0–1 kmT andP profiles USSANO2 profile 0–15 km: from NO2 DSCDs at 435 nm
> 15 km: USSA
a seeLi et al. (2010)b US Standard atmosphere
function to calculate the references which led to different val-ues for all trace gases.
The conversion from measured DSCDs to troposphericvertical column density (VCD) is usually done by the differ-ential air mass factor (DAMF). The air mass factor (AMF)can be regarded as the path enhancement of SCD comparedto VCD. DAMF is defined as the the difference of air massfactor (AMF) betweenα 6=90◦ andα = 90◦. For photons re-ceived by the MAX-DOAS telescope, if their last scatter-ing event happens above the trace gas layer, the AMF forthe zenith and the off-axis view can be estimated as 1 and1/sinα, respectively. Thus, the trace gas tropospheric VCDcan be written as
VCDgeo=DSCDα
DAMFα
=DSCDα
(1/sinα)−1(1)
whereα is the elevation angle of the telescope. This methodis called “geometric approach”. For photons received by thetelescope at higher elevation angles, the probability of theirlast scattering event occurring above the trace gas layer isincreased. Thus we calculated VCDgeo for NO2, HCHO, andCHOCHO from the corresponding DSCDs at the highest off-zenith elevation angle, i.e.α = 30◦.
Compared to the simple geometric approach, the radiativetransfer modeling of DSCDs is a demanding task. In thisstudy, the DSCDs calculations were performed by McAr-tim, which is a backward Monte-Carlo RTM with the treat-ment of multiple scattering in a fully spherical geometry(Deutschmann et al., 2011). For each trace gas (NO2, HCHO,and CHOCHO), its vertical distribution was retrieved by it-eratively adjusting the profile until the measured DSCDsbest fit with the modeled DSCDs. The parameter settings ofMcArtim are listed in Table2. FollowingLi et al. (2010), weused a two-layer setup for the trace gas distribution in thetroposphere (0–15 km height). The trace gas concentrations(unit: cm−3) were assumed to be homogeneous in a layernear the ground surface (called mixing layer, ML), while theconcentrations in the layer aloft (i.e. the free troposphere) de-crease exponentially with height. This type of trace gas dis-
tribution was frequently observed in polluted regions (e.g.,Fried et al., 2003; Junkermann, 2009; Klippel et al., 2011).The concentration profilec(z) can be described with a lim-ited set of parameters
c(z)=
{VCD ·F/H z ≤H
β ·exp(−z/ξ) z > H(2)
wherez is the height above ground, VCD denotes the tracegas tropospheric vertical column density of the respectivetrace gas,F is the fraction of the VCDrtm residing in theML, andH is the height of ML.β is the normalization factorandξ is the scaling height for the trace gas in the free tro-posphere. We performed test runs of the retrieval and foundthat the results were not sensitive toξ under the conditionsencountered here since most of the trace gas was present inthe mixing layer. Thusξ was set to a constant value of 5 km.The normβ is calculated from the integral ofc(z) over theentire troposphere VCD=
∫ 15 km0 km c(z)dz leading to
β =(1−F) ·VCD
ξ(exp(−H/ξ)−exp(−15 km/ξ))(3)
With the input given above, the McArtim program calculatesthe set of trace gas DSCDs (Rα) at the six elevation angles ofthe measurements. In order to achieve the best estimates forF , H , VCDrtm (subscript rtm refers to the use of the RTM,in contrast to the geometric approach) we minimized
χ2(VCDrtm,F,H)=
30◦∑α=3◦
(Mα −Rα(VCDrtm,F,H)
σ(Mα)
)2
(4)
whereMα represents the measured DSCDs. The weights arepresented by the statistical error (precision) of the measureddata,σ(Mα). In order to reduce the atmospheric variations aswell as measurement noise of a single observation, the profileretrieval was applied to measured DSCDs averaged over onehour. The minimization procedure was conducted automati-cally using an implementation of the Levenberg-Marquardtalgorithm (mpfit1, realized in IDL).
Since the PRD region is characterized by wide spreademission sources, most of the trace gases reside in the MLand the trace gas concentrations in the ML are much higherthan those in the layer aloft. Therefore, the modeled DSCDsare not sensitive to change ofξ (see above), and values ofF are close to 1. The three parameter (VCDrtm, F , andH )retrieval yieldedF > 0.95 for almost all cloud-free periods.In addition, the statistical error of the retrievedF was largeassociated with a cross-correlation betweenF and H . In-creasingH or decreasingF have the same effect on themodeled DSCDs. In order to overcome this issue, we finallyfixed the values ofF to 1; only VCD andH were retrieved.This approach resulted in a “box shape” profile. The trace
1C. B. Markwardt, mpfit – Robust non-linear least squares curvefitting, http://cow.physics.wisc.edu/∼craigm/idl/fitting.html.
Atmos. Chem. Phys., 13, 2133–2151, 2013 www.atmos-chem-phys.net/13/2133/2013/
X. Li et al.: MAX-DOAS trace gases measurements in China 2137
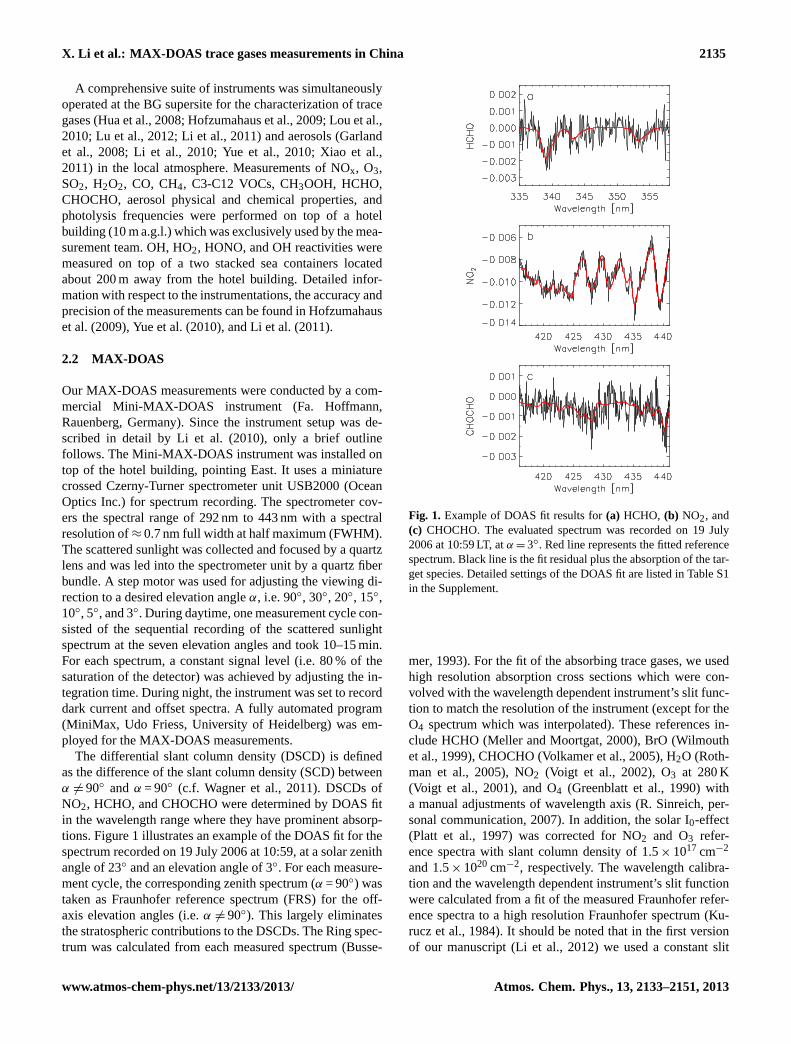
Fig. 2.Flow diagram of MAX-DOAS trace gas vertical distributionretrieval.
gas concentrationsc0 are universal in the box and equal toVCDrtm/H . c0 can then be compared to ground-based mea-surements which were done at the BG site.
Figure2 depicts the flow diagram of the trace gas verti-cal distribution retrieval procedure. In order to well simulatethe aerosol scattering effects by RTM, aerosol vertical dis-tributions were retrieved beforehand from O4 DSCDs in theway as described byLi et al. (2010). The derived aerosol ex-tinction profiles were used as input to the trace gas verticaldistribution retrieval. The retrieval of NO2 vertical distribu-tion was performed as the second step. Given the influence ofNO2 absorption on the HCHO and CHOCHO DSCDs calcu-lation (Table3), the retrieved NO2 vertical distribution wasused as RTM input during the vertical distribution retrievalfor HCHO and CHOCHO. HCHO and CHOCHO verticaldistributions were retrieved independently.
The errors of the retrieved trace gas vertical distributionconsist of statistical errors which arise mainly from the un-certainty of the DSCDs, and systematic errors which origi-nate from the uncertainty of the RTM input parameters andof the DSCD simulation. The statistical errors were derivedfrom the mpfit procedure. Within RTM intercomparison ac-tivities (Hendrick et al., 2006; Wagner et al., 2007) the un-certainty of DSCD calculations by McArtim were found tobe less than 10 %. The sensitivities of the modeled DCSDswith respect to RTM input parameters are listed in Table3.The surface albedo, the field of view of the telescope (FOV),and the surface O3 and NO2 have minor influences on themodeled DSCDs. The major uncertainty sources to the mod-eled DSCDs are the aerosol properties, namely the singlescattering albedo (SSA), the asymmetry factor (g, under theHenyey-Greenstein approximation), and the aerosol opticaldepth (AOD). While the increase of SSA andg lead to a si-multaneous increase of modeled DSCDs at all elevation an-gles, the increase of AOD results in a decrease of modeledDSCDs. It was found that 30 % change of modeled DSCDs
results in≈25 % change of the retrieved VCDrtm and c0.During the campaign, the systematic errors of the measuredSSA and AOD were 10 % and 30 %, respectively, and the un-certainty ofg was 10 % (Garland et al., 2008; Li et al., 2010).Therefore, we conclude that the total systematic error of theretrieved VCDrtm andc0 are around 35 %.
2.3 In-situ NO2 measurement
In-situ NO2 concentrations were measured by a commercialinstrument (Takegawa et al., 2006). The inlet of the sam-pling line was located on top of the hotel building. NO2 inthe sampled air was converted to NO in a photolytical reac-tor (Droplet Measurement Technologies, Model BLC) withan conversion efficiency of 30 %. The NO was then detectedby NO-O3 chemiluminescence (Thermo Electron, Model42CTL). The 1 min detection limit for NO2 was 170 ppt, andthe corresponding accuracy was 13 %.
2.4 Numerical simulation of NO2
Model3-CMAQ version 4.5.1 was employed to simulate theNO2 concentrations during the period of the campaign. De-tails of the model configuration are described byWanget al.(2010). The CMAQ model uses SAPRC99 as chemicalmechanism, and is driven by MM5 for meteorology field andSMOKE for source emissions. The time step of the modelwas set to 1 h. There are three nested domains in the modelsystem with grid spacing of 36 km, 12 km, and 4 km. Allgrids have 13 layers vertically extending from the surfaceto an altitude of 17 km above the ground, with seven lay-ers below 1 km and the first layer thickness of 18 m. Whilethe TRACE-P anthropogenic emission inventory was usedfor the 36 km domain, the emission inventories used for the12 km domain and the 4 km domain were updated accordingto recent studies in PRD region (Zheng et al., 2009). Mo-bile sources and power generation point sources contributeabout 47 % and 39 %, respectively, to the total NOx emis-sions in PRD while mobile sources, evaporation losses ofsolvents and petroleum, and biogenic sources are the threelargest contributors to VOC emissions, accounting for 38 %,24 %, and 23 %, respectively. Spatially, both NOx and VOCemissions are concentrated over the inland urban areas ofGuangzhou, Foshan, and Dongguan; the coastal areas ofDongguan and Shenzhen; and the urban core of Hong Kong.
3 Results
The MAX-DOAS instrument was operated for the campaignperiod from 3 July to 25 July 2006. However, as already dis-cussed byLi et al. (2010), only 9 virtually cloud-free dayswere suitable for aerosol and trace gas vertical distributionretrieval. Measured DSCDs of NO2, HCHO, and CHOCHOon these 9 days are displayed in Fig. S1 in the Supplement.
www.atmos-chem-phys.net/13/2133/2013/ Atmos. Chem. Phys., 13, 2133–2151, 2013
2138 X. Li et al.: MAX-DOAS trace gases measurements in China
Table 3.Sensitivities of the RTM inputs on the calculated NO2, HCHO, and CHOCHO DSCDs.
Surface FOV SSA g AOD NO2 O3albedo (≤1 km) (≤1 km)
1 Param. +15 % +0.1◦ +10 % +15 % ×3 ×10 ×101 DSCDsNO2 +2.4 % +0.4 % +7.6 % +9.3 % −47.7 % – −0.04 %HCHO +1.8 % +0.5 % +6.8 % +9.1 % −49.5 % −8.3 % −0.04 %CHOCHO +2.1 % +0.3 % +7.6 % +10.9 % −49.3 % −10.1 % −0.01 %
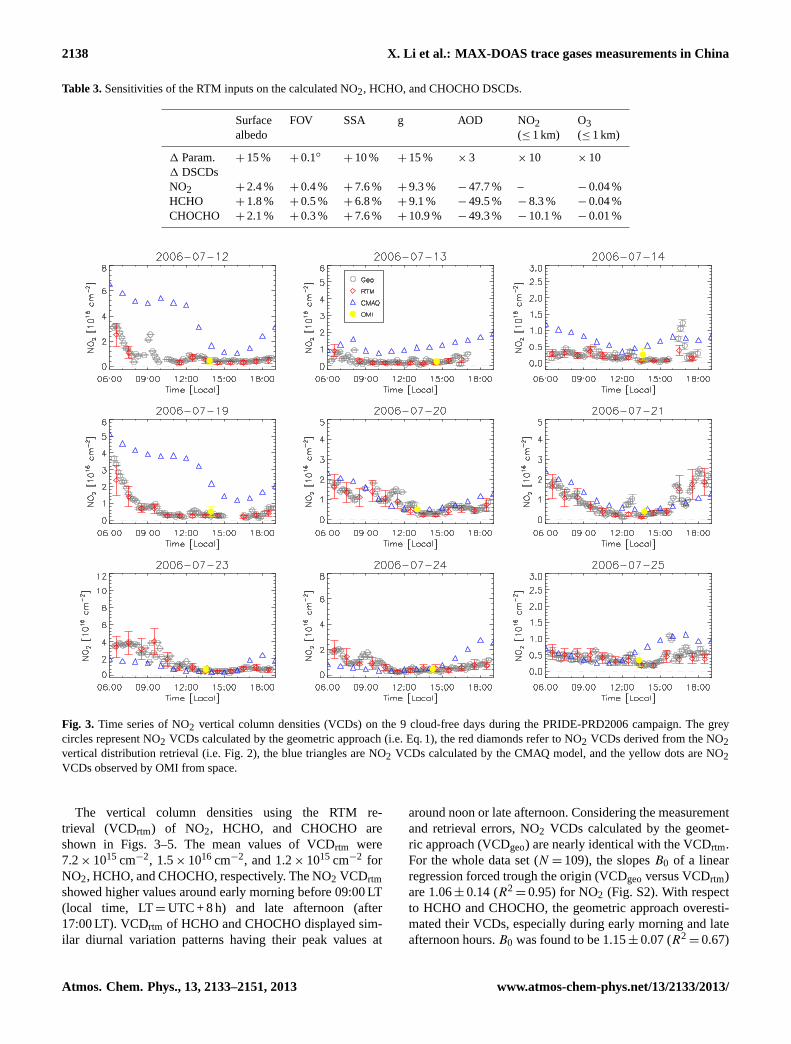
Fig. 3. Time series of NO2 vertical column densities (VCDs) on the 9 cloud-free days during the PRIDE-PRD2006 campaign. The greycircles represent NO2 VCDs calculated by the geometric approach (i.e. Eq.1), the red diamonds refer to NO2 VCDs derived from the NO2vertical distribution retrieval (i.e. Fig.2), the blue triangles are NO2 VCDs calculated by the CMAQ model, and the yellow dots are NO2VCDs observed by OMI from space.
The vertical column densities using the RTM re-trieval (VCDrtm) of NO2, HCHO, and CHOCHO areshown in Figs.3–5. The mean values of VCDrtm were7.2×1015 cm−2, 1.5×1016 cm−2, and 1.2×1015 cm−2 forNO2, HCHO, and CHOCHO, respectively. The NO2 VCDrtmshowed higher values around early morning before 09:00 LT(local time, LT=UTC + 8 h) and late afternoon (after17:00 LT). VCDrtm of HCHO and CHOCHO displayed sim-ilar diurnal variation patterns having their peak values at
around noon or late afternoon. Considering the measurementand retrieval errors, NO2 VCDs calculated by the geomet-ric approach (VCDgeo) are nearly identical with the VCDrtm.For the whole data set (N =109), the slopesB0 of a linearregression forced trough the origin (VCDgeoversus VCDrtm)are 1.06±0.14 (R2
=0.95) for NO2 (Fig. S2). With respectto HCHO and CHOCHO, the geometric approach overesti-mated their VCDs, especially during early morning and lateafternoon hours.B0 was found to be 1.15±0.07 (R2
=0.67)
Atmos. Chem. Phys., 13, 2133–2151, 2013 www.atmos-chem-phys.net/13/2133/2013/

X. Li et al.: MAX-DOAS trace gases measurements in China 2139
Fig. 4. Time series of HCHO vertical column densities (VCDs) on the 9 cloud-free days during the PRIDE-PRD2006 campaign. The greycircles represent HCHO VCDs calculated by the geometric approach (i.e. Eq.1), and the red diamonds refer to HCHO VCDs derived fromthe HCHO vertical distribution retrieval (i.e. Fig.2).
for HCHO (Fig. S3), and 1.15±0.08 (R2=0.40) for
CHOCHO (Fig. S4), respectively.The retrieved mixing layer heightsH of the three trace
gases are shown together with theH of aerosols (Li et al.,2010) in Fig. 6. HNO2, HHCHO, HCHOCHO, and Haerosolshowed similar diurnal variation patterns. In general,H wasincreasing after sunrise and started decreasing before sunset.Values ofHNO2 were lower than those ofHHCHO, HCHOCHO,andHaerosol. In early morning hours, whenHNO2 was below400 m,HHCHO, HCHOCHO, andHaerosolwere in the range of400 m to 1 km. WhileHCHOCHO increased dramatically dur-ing the day and reached peak values of 2–4 km in the after-noon, peak values ofHNO2 andHHCHO were usually below2 km.
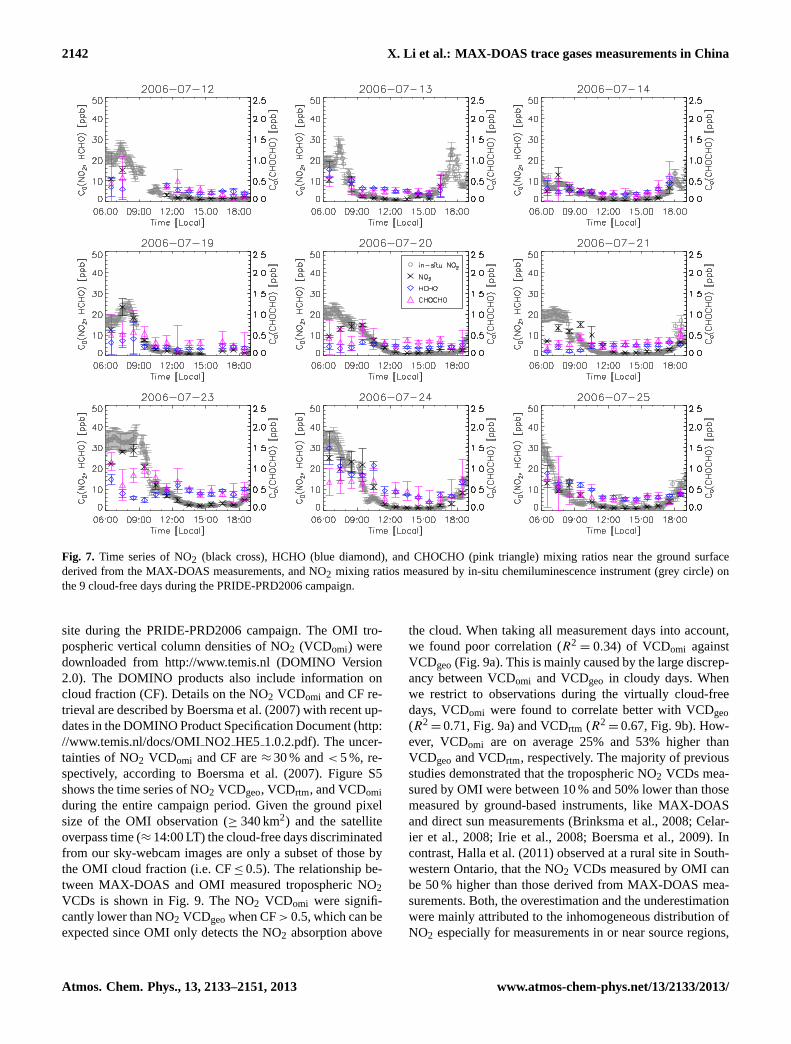
The trace gas mixing ratios (in ppb) at ground level canbe calculated asm0= VCD/H×M0 with M0 being the con-version factor from cm−3 to ppb. Figure7 shows the timeseries of the derived NO2, HCHO, and CHOCHO mixing ra-tios. The average daytime mixing ratios of NO2, HCHO, andCHOCHO were 6.3 ppb, 7.0 ppb, and 0.4 ppb, respectively.
During the days 23 July–25 July when intense biomass andelectric cable burning events occurred in the previous nightin the surrounding areas, high levels of HCHO (≈20 ppb)and CHOCHO (≈0.8 ppb) were found in the early morninghours. In the same time periods, NO2 mixing ratios up to40 ppb were observed by both MAX-DOAS and in-situ tech-niques. The mixing ratio of NO2 shows clear diurnal vari-ation having its maxima in the early morning hours in alldays. In contrast, the diurnal variations of the mixing ratiosof HCHO and CHOCHO are less prominent. In most days,higher values of the mixing ratios of HCHO and CHOCHOwere observed in morning hours. However, there are days(i.e. 20, 21, and 23 July) in which a slight increase of theCHOCHO mixing ratio was identified around noon. Whilethe mixing ratio of NO2 varied in a similar way as its VCDsduring the day, the variation of the HCHO and HCHO mixingratio were to some extent opposite to their VCDs.
www.atmos-chem-phys.net/13/2133/2013/ Atmos. Chem. Phys., 13, 2133–2151, 2013
2140 X. Li et al.: MAX-DOAS trace gases measurements in China
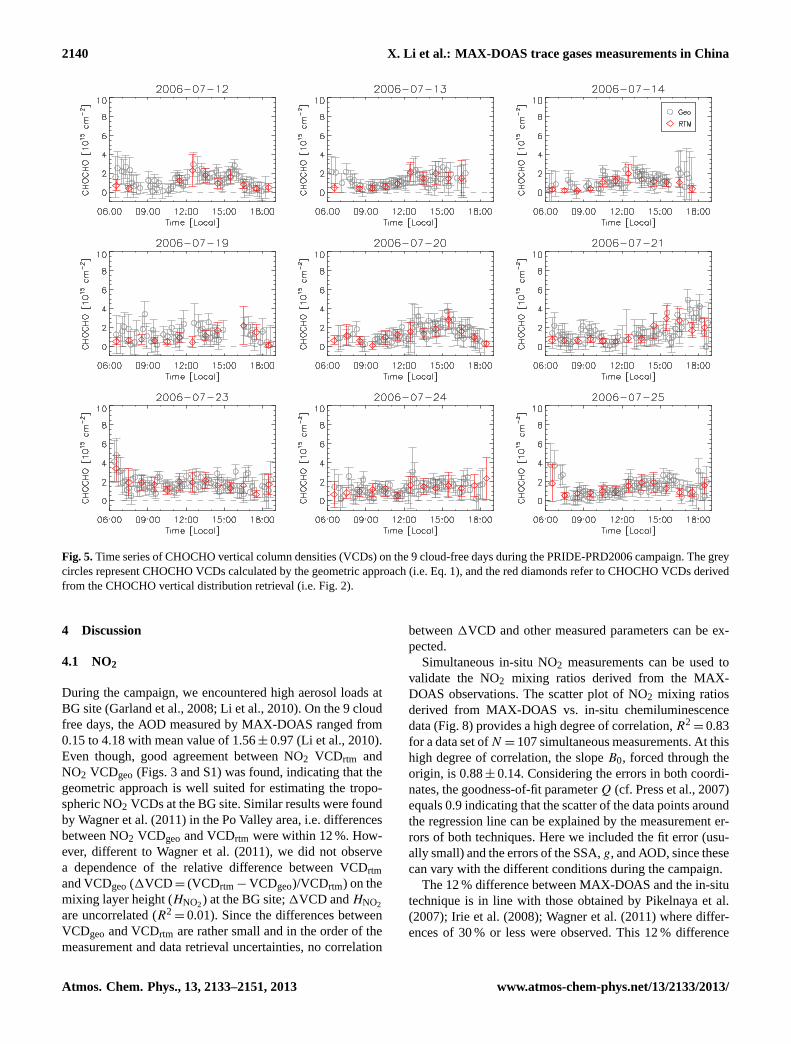
Fig. 5.Time series of CHOCHO vertical column densities (VCDs) on the 9 cloud-free days during the PRIDE-PRD2006 campaign. The greycircles represent CHOCHO VCDs calculated by the geometric approach (i.e. Eq.1), and the red diamonds refer to CHOCHO VCDs derivedfrom the CHOCHO vertical distribution retrieval (i.e. Fig.2).
4 Discussion
4.1 NO2
During the campaign, we encountered high aerosol loads atBG site (Garland et al., 2008; Li et al., 2010). On the 9 cloudfree days, the AOD measured by MAX-DOAS ranged from0.15 to 4.18 with mean value of 1.56±0.97 (Li et al., 2010).Even though, good agreement between NO2 VCDrtm andNO2 VCDgeo (Figs.3 and S1) was found, indicating that thegeometric approach is well suited for estimating the tropo-spheric NO2 VCDs at the BG site. Similar results were foundby Wagner et al.(2011) in the Po Valley area, i.e. differencesbetween NO2 VCDgeo and VCDrtm were within 12 %. How-ever, different toWagner et al.(2011), we did not observea dependence of the relative difference between VCDrtmand VCDgeo(1VCD= (VCDrtm−VCDgeo)/VCDrtm) on themixing layer height (HNO2) at the BG site;1VCD andHNO2
are uncorrelated (R2=0.01). Since the differences between
VCDgeo and VCDrtm are rather small and in the order of themeasurement and data retrieval uncertainties, no correlation
between1VCD and other measured parameters can be ex-pected.
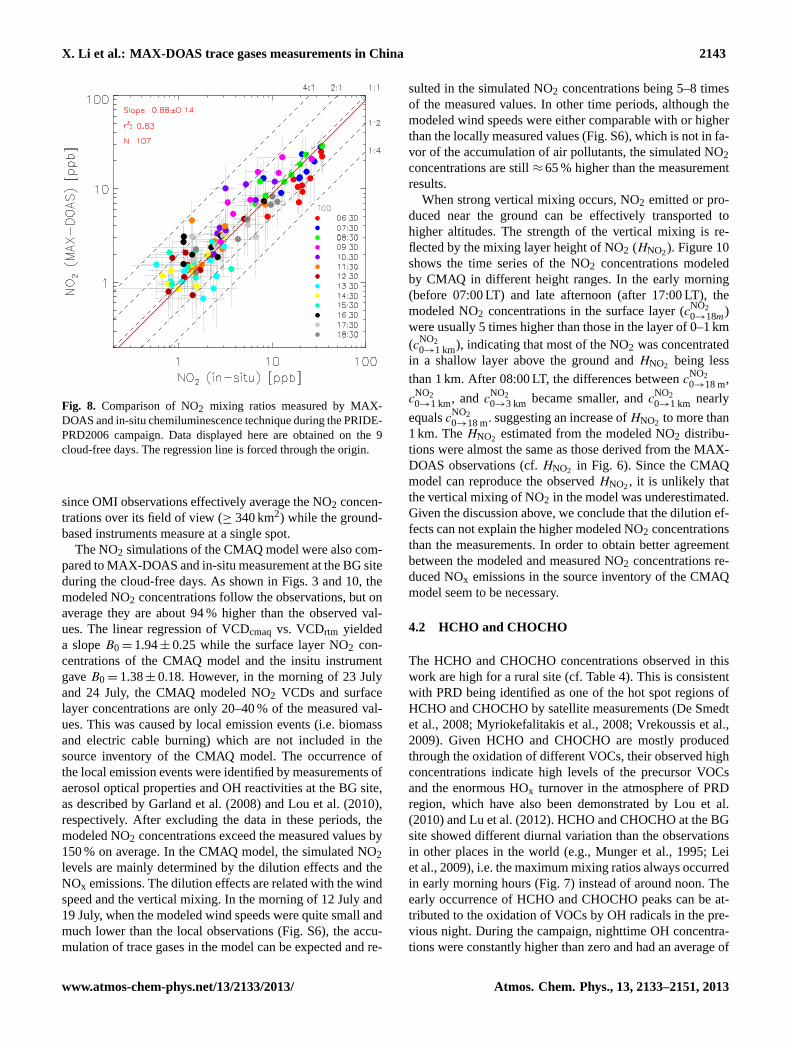
Simultaneous in-situ NO2 measurements can be used tovalidate the NO2 mixing ratios derived from the MAX-DOAS observations. The scatter plot of NO2 mixing ratiosderived from MAX-DOAS vs. in-situ chemiluminescencedata (Fig.8) provides a high degree of correlation,R2
=0.83for a data set ofN =107 simultaneous measurements. At thishigh degree of correlation, the slopeB0, forced through theorigin, is 0.88±0.14. Considering the errors in both coordi-nates, the goodness-of-fit parameterQ (cf. Press et al., 2007)equals 0.9 indicating that the scatter of the data points aroundthe regression line can be explained by the measurement er-rors of both techniques. Here we included the fit error (usu-ally small) and the errors of the SSA,g, and AOD, since thesecan vary with the different conditions during the campaign.
The 12 % difference between MAX-DOAS and the in-situtechnique is in line with those obtained byPikelnaya et al.(2007); Irie et al.(2008); Wagner et al.(2011) where differ-ences of 30 % or less were observed. This 12 % difference
Atmos. Chem. Phys., 13, 2133–2151, 2013 www.atmos-chem-phys.net/13/2133/2013/

X. Li et al.: MAX-DOAS trace gases measurements in China 2141
Fig. 6. Time series of mixing layer heights of NO2, HCHO, CHOCHO and aerosol extinction (cf.Li et al., 2010) on the 9 cloud-free daysduring the PRIDE-PRD2006 campaign.
can be caused by two reasons, i.e. the inhomogeneous dis-tribution of NO2, and the uncertainty of parameters used inthe RTM calculation. During the campaign, the NOx emis-sion usually occurred in the second half of the night or in theearly morning. However, the relative difference of NO2 mix-ing ratios between the two techniques (i.e.1VCD) correlatesneither with the time of the day (R2
=0), nor with the NO2layer height (R2
=0.01), nor the wind speed (R2=0.04),
suggesting the emission or transport effects, which can re-sult in the imhomogenity of NO2 distribution, have minorinfluence on the intercomparison results in this study. As dis-cussed in Sect. 2.2, the aerosol properties, namely SSA,g,and AOD, are the major contributors to the systematic er-ror of the MAX-DOAS NO2 retrieval. In the RTM calcula-tion, SSA was fixed to the measured average value 0.85 andwe assumedg to be constant at 0.68. However, due to thechange of aerosol compositions and size distributions, thevalues of SSA andg change. Using the RTM we performeda number of sensitivity studies showing that an increase ofSSA andg lead to higher values of modeled NO2 DSCDsand higher retrieved NO2 mixing ratios. Although the AOD
and the aerosol vertical distribution used in the RTM calcula-tion were derived from the MAX-DOAS observations, theyare sensitive to the values of SSA andg (Li et al., 2010).During the campaign, the uncertainty of SSA,g, and AODwere 10 %, 10 %, and 30 %, respectively, which can lead toan uncertainty of≈25 % for the retrieved NO2 mixing ra-tios. In addition, the uncertainty of the RTM DSCDs simula-tion contributes another 10 % systematic error and the accu-racy of the in-situ NO2 measurements was 13 %. Therefore,the 12 % difference between the NO2 mixing ratios observedby MAX-DOAS and by the in-situ technique are within therange provided by the systematic errors and the error of theslope.
The ground-based MAX-DOAS observations can also beused as an effective way for the validation of trace gas VCDsderived from satellite measurements, since both methods arebased on the DOAS technique but differ in the viewing direc-tions (i.e. one looking up to the sky, the other looking down tothe earth). Here, we compared the tropospheric NO2 VCDsmeasured by MAX-DOAS and by OMI (Ozone MonitoringInstrument on board NASA’s EOS-Aura satellite) for the BG
www.atmos-chem-phys.net/13/2133/2013/ Atmos. Chem. Phys., 13, 2133–2151, 2013
2142 X. Li et al.: MAX-DOAS trace gases measurements in China
Fig. 7. Time series of NO2 (black cross), HCHO (blue diamond), and CHOCHO (pink triangle) mixing ratios near the ground surfacederived from the MAX-DOAS measurements, and NO2 mixing ratios measured by in-situ chemiluminescence instrument (grey circle) onthe 9 cloud-free days during the PRIDE-PRD2006 campaign.
site during the PRIDE-PRD2006 campaign. The OMI tro-pospheric vertical column densities of NO2 (VCDomi) weredownloaded fromhttp://www.temis.nl(DOMINO Version2.0). The DOMINO products also include information oncloud fraction (CF). Details on the NO2 VCDomi and CF re-trieval are described byBoersma et al.(2007) with recent up-dates in the DOMINO Product Specification Document (http://www.temis.nl/docs/OMINO2 HE5 1.0.2.pdf). The uncer-tainties of NO2 VCDomi and CF are≈30 % and< 5 %, re-spectively, according toBoersma et al.(2007). Figure S5shows the time series of NO2 VCDgeo, VCDrtm, and VCDomiduring the entire campaign period. Given the ground pixelsize of the OMI observation (≥ 340 km2) and the satelliteoverpass time (≈14:00 LT) the cloud-free days discriminatedfrom our sky-webcam images are only a subset of those bythe OMI cloud fraction (i.e. CF≤0.5). The relationship be-tween MAX-DOAS and OMI measured tropospheric NO2VCDs is shown in Fig.9. The NO2 VCDomi were signifi-cantly lower than NO2 VCDgeowhen CF> 0.5, which can beexpected since OMI only detects the NO2 absorption above
the cloud. When taking all measurement days into account,we found poor correlation (R2
= 0.34) of VCDomi againstVCDgeo(Fig.9a). This is mainly caused by the large discrep-ancy between VCDomi and VCDgeo in cloudy days. Whenwe restrict to observations during the virtually cloud-freedays, VCDomi were found to correlate better with VCDgeo(R2=0.71, Fig. 9a) and VCDrtm (R2
=0.67, Fig.9b). How-ever, VCDomi are on average 25% and 53% higher thanVCDgeo and VCDrtm, respectively. The majority of previousstudies demonstrated that the tropospheric NO2 VCDs mea-sured by OMI were between 10 % and 50% lower than thosemeasured by ground-based instruments, like MAX-DOASand direct sun measurements (Brinksma et al., 2008; Celar-ier et al., 2008; Irie et al., 2008; Boersma et al., 2009). Incontrast,Halla et al.(2011) observed at a rural site in South-western Ontario, that the NO2 VCDs measured by OMI canbe 50 % higher than those derived from MAX-DOAS mea-surements. Both, the overestimation and the underestimationwere mainly attributed to the inhomogeneous distribution ofNO2 especially for measurements in or near source regions,
Atmos. Chem. Phys., 13, 2133–2151, 2013 www.atmos-chem-phys.net/13/2133/2013/
X. Li et al.: MAX-DOAS trace gases measurements in China 2143
Fig. 8. Comparison of NO2 mixing ratios measured by MAX-DOAS and in-situ chemiluminescence technique during the PRIDE-PRD2006 campaign. Data displayed here are obtained on the 9cloud-free days. The regression line is forced through the origin.
since OMI observations effectively average the NO2 concen-trations over its field of view (≥ 340 km2) while the ground-based instruments measure at a single spot.
The NO2 simulations of the CMAQ model were also com-pared to MAX-DOAS and in-situ measurement at the BG siteduring the cloud-free days. As shown in Figs.3 and10, themodeled NO2 concentrations follow the observations, but onaverage they are about 94 % higher than the observed val-ues. The linear regression of VCDcmaq vs. VCDrtm yieldeda slopeB0=1.94±0.25 while the surface layer NO2 con-centrations of the CMAQ model and the insitu instrumentgaveB0=1.38±0.18. However, in the morning of 23 Julyand 24 July, the CMAQ modeled NO2 VCDs and surfacelayer concentrations are only 20–40 % of the measured val-ues. This was caused by local emission events (i.e. biomassand electric cable burning) which are not included in thesource inventory of the CMAQ model. The occurrence ofthe local emission events were identified by measurements ofaerosol optical properties and OH reactivities at the BG site,as described byGarland et al.(2008) andLou et al.(2010),respectively. After excluding the data in these periods, themodeled NO2 concentrations exceed the measured values by150 % on average. In the CMAQ model, the simulated NO2levels are mainly determined by the dilution effects and theNOx emissions. The dilution effects are related with the windspeed and the vertical mixing. In the morning of 12 July and19 July, when the modeled wind speeds were quite small andmuch lower than the local observations (Fig. S6), the accu-mulation of trace gases in the model can be expected and re-
sulted in the simulated NO2 concentrations being 5–8 timesof the measured values. In other time periods, although themodeled wind speeds were either comparable with or higherthan the locally measured values (Fig. S6), which is not in fa-vor of the accumulation of air pollutants, the simulated NO2concentrations are still≈65 % higher than the measurementresults.
When strong vertical mixing occurs, NO2 emitted or pro-duced near the ground can be effectively transported tohigher altitudes. The strength of the vertical mixing is re-flected by the mixing layer height of NO2 (HNO2). Figure10shows the time series of the NO2 concentrations modeledby CMAQ in different height ranges. In the early morning(before 07:00 LT) and late afternoon (after 17:00 LT), themodeled NO2 concentrations in the surface layer (c
NO20→18m)
were usually 5 times higher than those in the layer of 0–1 km(cNO2
0→1 km), indicating that most of the NO2 was concentratedin a shallow layer above the ground andHNO2 being less
than 1 km. After 08:00 LT, the differences betweencNO20→18 m,
cNO20→1 km, andc
NO20→3 km became smaller, andcNO2
0→1 km nearly
equalscNO20→18 m. suggesting an increase ofHNO2 to more than
1 km. TheHNO2 estimated from the modeled NO2 distribu-tions were almost the same as those derived from the MAX-DOAS observations (cf.HNO2 in Fig. 6). Since the CMAQmodel can reproduce the observedHNO2, it is unlikely thatthe vertical mixing of NO2 in the model was underestimated.Given the discussion above, we conclude that the dilution ef-fects can not explain the higher modeled NO2 concentrationsthan the measurements. In order to obtain better agreementbetween the modeled and measured NO2 concentrations re-duced NOx emissions in the source inventory of the CMAQmodel seem to be necessary.
4.2 HCHO and CHOCHO
The HCHO and CHOCHO concentrations observed in thiswork are high for a rural site (cf. Table4). This is consistentwith PRD being identified as one of the hot spot regions ofHCHO and CHOCHO by satellite measurements (De Smedtet al., 2008; Myriokefalitakis et al., 2008; Vrekoussis et al.,2009). Given HCHO and CHOCHO are mostly producedthrough the oxidation of different VOCs, their observed highconcentrations indicate high levels of the precursor VOCsand the enormous HOx turnover in the atmosphere of PRDregion, which have also been demonstrated byLou et al.(2010) andLu et al.(2012). HCHO and CHOCHO at the BGsite showed different diurnal variation than the observationsin other places in the world (e.g.,Munger et al., 1995; Leiet al., 2009), i.e. the maximum mixing ratios always occurredin early morning hours (Fig.7) instead of around noon. Theearly occurrence of HCHO and CHOCHO peaks can be at-tributed to the oxidation of VOCs by OH radicals in the pre-vious night. During the campaign, nighttime OH concentra-tions were constantly higher than zero and had an average of
www.atmos-chem-phys.net/13/2133/2013/ Atmos. Chem. Phys., 13, 2133–2151, 2013

2144 X. Li et al.: MAX-DOAS trace gases measurements in China
Fig. 9. Comparison of tropospheric NO2 VCDs derived from MAX-DOAS and OMI observations during the PRIDE-PRD2006 campaign.The x-axis in(a) and(b) corresponds to the NO2 VCDs derived from the geometric approach and the NO2 vertical distribution retrieval,respectively. The dots represent data obtained on the 9 cloud-free days. The regression and correlation results for the dots and triangles areshown in red and grey texts, respectively. The regression lines are forced through the origin.
Table 4.Overview of campaign average values of HCHO and CHOCHO mixing ratios (unit: ppb) andRGF in different environments in theworld. Results shown here are in conditions that simultaneous HCHO and CHOCHO measurements are available.
Location Site Period HCHO CHOCHO RGF Reference
Caribbean Sea and Sargasso Sea Marine Autumn, Spring 0.4 0.08 0.200Zhou and Mopper(1990)Metter, Georgia, USA Rural Summer 3.6 0.02 0.006Lee et al.(1995)Pinnacles, Virginia, USA Rural Autumn 0.98 0.04 0.045Munger et al.(1995)San Nicolas, USA Rural Autumn 0.8 0.1 0.132Grosjean et al.(1996)Nashvile, USA Rural Summer 4.2 0.07 0.017Lee et al.(1998)Giesta, Portugal Rural Summer 6.14 1.54 0.251Borrego et al.(2000)Pabstthum, Germany Rural Summer 2.58 0.03 0.012Moortgat et al.(2002)Anadia, Portugal Rural Summer 1.8 0.08 0.044Cerqueira et al.(2003)Goldlauter, Germany Rural Autumn 0.75 0.04 0.058Muller et al.(2006)Montelibretti, Italy Rural Summer 5.10 0.55 0.107Possanzini et al.(2007)
Autumn 3.38 0.22 0.064Sierra Nevada, USA Rural Autumn 6.88 0.03 0.004Choi et al.(2010); Huisman et al.(2011)Cabauw, Netherlands Rural Summer 2.5 0.08 0.036Irie et al.(2011)Sao Paulo, Barzil Urban Summer 10.4 0.7 0.092Grosjean et al.(1990)Los Angeles, USA Urban Summer 5.3 0.8 0.137Grosjean et al.(1996)
Urban Autumn 1.0 0.3 0.300 Kawamura et al.(2000)Las Vegas, USA Urban Summer 0.26 0.21 0.808Jing et al.(2001)
Winter 0.79 0.14 0.177Hongkong, China Urban – 11.3 1.5 0.122Ho and Yu(2002)Elizabeth, New Jersey, USA Urban Spring 5.29 0.72 0.136Liu et al. (2006)
Summer 3.86 0.71 0.183Autumn 4.67 0.51 0.109Winter 5.67 0.45 0.079
Mexico City, Mexico Urban Spring 12.5 0.45 0.036Lei et al.(2009)Back Garden, China Rural Summer 7.0 0.4 0.062 This work
≈1×106 cm−3 (Lu et al., 2012), while the average OH re-activities were 30–50 s−1 at night. Therefore, nighttime pro-duction of HCHO and CHOCHO is possible under these con-ditions. In the absence of photolysis, HCHO and CHOCHO
can easily accumulate. Moreover, the high HCHO concen-trations in the early morning of 24, 25 July could also orig-inate from direct emissions of the local combustion events.After sunrise, due to the increase of photolysis frequencies
Atmos. Chem. Phys., 13, 2133–2151, 2013 www.atmos-chem-phys.net/13/2133/2013/

X. Li et al.: MAX-DOAS trace gases measurements in China 2145
Fig. 10.Time series of NO2 concentrations measured by MAX-DOAS (full pink diamond) and in-situ chemiluminescence instrument (opengrey circle), and simulated by the CMAQ model on the 9 cloud-free days during the PRIDE-PRD2006 campaign. The “ground” (open redtriangle), “1 km” (blue triangle), and “3 km” (open green triangle) represent the average NO2 concentrations calculated by the CMAQ modelin the layer of 0–18 m, 0–1 km, and 0–3 km, respectively.
and the mixing layer height, HCHO and CHOCHO mixingratios started to decrease and became stable in the afternoon.
The mixing layer heights of CHOCHO (HCHOCHO) arehigher than those of NO2 and HCHO especially in the af-ternoon (Fig.6). Different trace gases have different mixingheights were also observed byWagner et al.(2011) in sum-mer time in Po Valley. The vertical distribution of a trace gasis determined by its production and destruction processes.During the campaign, the lifetimes of HCHO and CHOCHOaround noon due to reaction with OH and photolysis werecalculated to be≈1.4 h and≈1.2 h, respectively, based onthe observed OH concentration of≈1.4×107 cm−3 and themeasured photolysis frequency of≈6×10⁻⁵ s−1 for HCHOand ≈9×10⁻⁵ s−1 for CHOCHO. The lifetime of NO2,which is mainly defined by the OH+NO2 reaction dur-ing daytime, was around 30 min. Due to the short lifetimeof NO2, lower HNO2 than HCHOCHO can be expected. Al-though the lifetime of HCHO and CHOCHO were compa-rable, the production pathways of HCHO and CHOCHO can
be different. First, compared to CHOCHO, HCHO has possi-bly primary sources. A continuous surface source of HCHOcan result in the detected HCHO layer much lower than theCHOCHO layer. However, at the BG site there was no ev-idence that direct emission of HCHO was occurring duringdaytime. Second, our recent model studies suggest that thedegradation of isoprene was the major pathway producingHCHO and CHOCHO in the afternoon at the BG site; itscontribution to the HCHO and CHOCHO production wasaround 50 %. While the other half of HCHO production wascaused by the oxidation of alkenes, degradation of aromat-ics accounted for the other half of CHOCHO production(Li et al., 2013). For isoprene oxidation we found from ourmodel study that most HCHO was formed as the first genera-tion product whereas CHOCHO was mostly produced in thethird and forth generation of the isoprene oxidation. At theBG site, the noontime OH concentration of 1.4×107 cm−3
resulted in a lifetime of isoprene of around 10 min. This isshorter than the typical mixing time in the boundary layer of
www.atmos-chem-phys.net/13/2133/2013/ Atmos. Chem. Phys., 13, 2133–2151, 2013

2146 X. Li et al.: MAX-DOAS trace gases measurements in China
Fig. 11.Diurnal variation of CHOCHO/HCHO ratio (RGF) on the9 cloud-free days during the PRIDE-PRD2006 campaign. The dotsare values calculated from individually measuredm0 (pannela) andVCDrtm (pannelb). Solid lines refer to the average values of theindividual points.
≈15 min (c.f.Stull, 1988). When isoprene is degraded theHCHO production occurs earlier, i.e. at lower altitudes, thanthe CHOCHO production. Moreover, due to the faster reac-tion rate with OH, the lifetimes of isoprene and alkenes areshorter than those of aromatics, which can result in differ-ent vertical distribution between different NMHCs. Accord-ing to the CMAQ model simulation, aromatics were mixed tohigher altitudes (up to 4 km) than isoprene and alkenes at BGsite, especially around noon (Fig. S7). Since aromatics arethe other group of CHOCHO precursor of besides isoprene,production of CHOCHO at higher altitudes can be expected.
Both species, CHOCHO and HCHO, are mainly producedthrough hydrocarbon oxidation. The ratio of CHOCHO toHCHO (RGF) was used in a number of studies to identify thesources of VOCs since CHOCHO and HCHO have differ-ent precursors or different formation pathways (e.g.,Vrek-oussis et al., 2010). Figure11 shows the diurnal variation ofthe CHOCHO to HCHO ratio (RGF) in the 9 cloud-free days.RGF calculated from the mixing ratio near the ground surface(RGF,m0) have similar average value as that from VCDrtm(RGF,m0=0.062±0.027,RGF,rtm=0.088±0.049). In gen-eral, bothRGF,m0 andRGF,rtm do not show prominent diur-nal variations. However, in the early morning of 24 and 25July, when strong combustion events existed in surroundingareas,RGF were significantly lower than in other periods. Inaddition, the geometric approach for HCHO and CHOCHOshowed deviations from retrieval using the radiative transfer(Figs. S3 and S4). It also tends to overestimated the HCHOand CHOCHO VCDs. Therefore, the correlation between
RGF,geo (i.e. RGF calculated from VCDgeo) and RGF,rtm isonly modest (R2
=0.39).RGF depends on many factors including primary emis-
sions, compositions and concentrations of precursor VOCs,and OH concentrations.RGF higher than 0.5 were found bySchauer et al.(2001) in biomass burning emissions, whilstRGF were in the range of 0.02–0.09 in vehicle exhausts(Schauer et al., 1999, 2002). Since different types of VOCs(i.e. alkanes, alkenes, aromatics, oxygenated VOCs) havedifferent yields of HCHO and CHOCHO, values ofRGFcan be different when the VOCs compositions change. Ta-ble 4 lists RGF obtained in different environments aroundthe world. In general,RGF in rural areas are below 0.1,whilst values higher than 0.1 exist in urban areas. Besidesthe lower concentrations of ambient VOCs, most rural ar-eas are strongly influenced by biogenic VOC emissions,e.g. isoprene, terpenes, and 2-methyl-3-butene-2-ol (MBO)(Lee et al., 1995; Munger et al., 1995; Huisman et al.,2011). Compared to anthropogenic VOCs (e.g. aromatics),the CHOCHO yield from isoprene or terpenes oxidations aremuch lower (Fu et al., 2008). Therefore, increase ofRGF canbe expected when the VOCs composition is changing fromisoprene dominated to aromatics dominated. For example,Giesta, Portugal is located in a rural area, however, the stronginfluence of anthropogenic emissions from industries in sur-rounding areas cause high levels of HCHO, CHOCHO, andRGF. On the other hand, given primary emission (e.g. traf-fic) can account for a large fraction of ambient HCHO butbarely contributes to CHOCHO (Grosjean et al., 1990; Leiet al., 2009), the prevailing anthropogenic sources can alsocause a decrease ofRGF. This is the case that lowRGF wasobserved in urban areas like like Sao Paulo, Brazil and Mex-ico City, Mexico. It was also found that, for the same mea-surement site (i.e. Montelibretti, Italy, Las Vegas, USA, andElizabeth, USA),RGF obtained in summer are higher than inother seasons (Jing et al., 2001; Liu et al., 2006; Possanziniet al., 2007). This is because summer time is usually accom-panied by high solar radiation, temperature, and humidity,which are in favor of the photochemical reactions produc-ing HCHO, CHOCHO, and other secondary products.RGFobtained at the BG site are higher than the values in most ru-ral areas but close to those in urban conditions. As describedby Lu et al.(2012), during the PRIDE-PRD2006 campaign,the detected air masses were mixtures of anthropogenic andbiogenic emissions. Additionally, the observed high OH andkOH level indicate the fast ongoing photochemistry which hasrarely been reported for other places in the world. However,in the relationship betweenRGF and other measured parame-ters (e.g. NOx, O3, VOCs, OH,kOH, OH× kOH), no correla-tions were found. This is probably due toRGF is determinedby the combination of several factors (e.g. the concentrationand composition of precursors, the OH level, the photolysisfrequencies, etc), which is difficult to be reflected by a singleparameter.
Atmos. Chem. Phys., 13, 2133–2151, 2013 www.atmos-chem-phys.net/13/2133/2013/
X. Li et al.: MAX-DOAS trace gases measurements in China 2147
The spatial distribution ofRGF and its implication on VOCsource types have been investigated byVrekoussis et al.(2010) using satellite measurements. Their observedRGF of≈0.04 for Southern Asia is lower than the values obtained atthe BG site. This difference can be explained by the differ-ent spatial resolution between the satellite and local measure-ments.Vrekoussis et al.(2010) suggest thatRGF in the rangeof 0.04–0.06 can represent regions where biogenic emissionsare the dominant primary VOC sources, while values lowerthan 0.04 indicate elevated anthropogenic VOC emissions.However, referring to Table4, their suggestion seems onlyconsistent with the observations for rural areas. The majorargument ofRGF < 0.04 representing regions influenced byanthropogenic emissions is, the primary HCHO from anthro-pogenic sources can cause a decrease ofRGF (Vrekoussiset al., 2010). As discussed above, this is indeed the case forMexico City, Mexico, but might not always be true for areaswhere the primary HCHO concentration is low but anthro-pogenic VOCs (e.g. aromatics) are at high level. Accordingto Table4, RGF in urban areas are in general higher than 0.04by a factor of 2. To solve the difference between the conclu-sion ofVrekoussis et al.(2010) and this study, more simulta-neous HCHO and CHOCHO measurements at different loca-tions and seasons are needed. Furthermore, it is necessary toapply the photochemical modeling of HCHO and CHOCHOin terms of VOC compositions.
5 Summary and conclusion
During the PRIDE-PRD2006 campaign in Southern Chinain July 2006, we performed MAX-DOAS measurements forNO2, HCHO, and CHOCHO at a rural site 60 km NW ofdowntown Guangzhou. Under the assumption of a “box pro-file” setup for the three trace gases, their tropospheric verticalcolumn densities, mixing layer heights, and mixing ratios atthe ground have been retrieved by an automated algorithm.
– The simple geometric approach is able to provide goodestimates of the NO2 tropospheric VCDs even under therelatively high aerosol loads (AOD = 1.56±0.97) en-countered here.
– Tropospheric NO2 VCDs observed by OMI were foundto be 50% higher than by our ground-based MAX-DOAS measurements, which can be due to the inhomo-geneous NO2 distribution in PRD.
– A comparison to the 3-D chemical transport modelCMAQ showed a high degree of correlation for NO2VCDs and NO2 ground level concentrations but themodel overestimates the measured values indicatinga need for a reduction of the NOx emission strength inthe source inventory.
– The HCHO and CHOCHO concentrations and their ra-tiosRGF were higher than expected from previous stud-
ies. This can be attributed to the high photochemicalturnover in the PRD region.
– Different from satellite observations, our ground-basedmeasurements indicate thatRGF are lower than 0.1 inrural areas but increase with higher anthropogenic emis-sions.
Based on these findings, simultaneous measurements ofHCHO and CHOCHO and their precursors as well as photo-chemical modeling are necessary in order to obtain a clearerpicture on the influence of anthropogenic and biogenic emis-sions onRGF. We also showed in this case study for NO2 thatMAX-DOAS can serve as an useful tool for 3-d CTM eval-uation and for satellite validation even under specific condi-tions here. The automated MAX-DOAS retrieval of VCDsand mixing layer heights are a first step towards using MAX-DOAS product for data assimilation forecast models.
Supplementary material related to this article isavailable online at:http://www.atmos-chem-phys.net/13/2133/2013/acp-13-2133-2013-supplement.pdf.
Acknowledgements.The authors like to thank Roman Sinreich,Udo Frieß, and Ulrich Platt (Heidelberg) for the lending of theMini-MAX DOAS instrument, the MiniMax software, and fruitfuldiscussions. The technical help and support at the field site fromthe PRIDE-PRD2006 campaign team, especially Rolf Haseler(Julich), Min Hu, Limin Zeng, and Yuanhang Zhang (Beijing)are gratefully acknowledged. We thank all participants of thedistributed computing of the RTM. We acknowledge the free useof tropospheric NO2 column data from the OMI sensor fromwww.temis.nl. This work was supported by the China NationalBasic Research and Development Program 2002CB410801, andthe National High Technology Research and Development Programof China (863 Program) 2006AA06A301.
The service charges for this open access publicationhave been covered by a Research Centre of theHelmholtz Association.
Edited by: S. C. Liu
References
Bobrowski, N., Honninger, G., Galle, B., and Platt, U.: Detection ofbromine monoxide in a volcanic plume, Nature, 423, 273–276,doi:10.1038/nature01625, 2003.
Boersma, K. F., Eskes, H. J., Veefkind, J. P., Brinksma, E. J.,van der A, R. J., Sneep, M., van den Oord, G. H. J., Levelt, P. F.,Stammes, P., Gleason, J. F., and Bucsela, E. J.: Near-real timeretrieval of tropospheric NO2 from OMI, Atmos. Chem. Phys.,7, 2103–2118,doi:10.5194/acp-7-2103-2007, 2007.
Boersma, K. F., Jacob, D. J., Trainic, M., Rudich, Y., DeSmedt, I.,Dirksen, R., and Eskes, H. J.: Validation of urban NO2 concen-trations and their diurnal and seasonal variations observed from
www.atmos-chem-phys.net/13/2133/2013/ Atmos. Chem. Phys., 13, 2133–2151, 2013
2148 X. Li et al.: MAX-DOAS trace gases measurements in China
the SCIAMACHY and OMI sensors using in situ surface mea-surements in Israeli cities, Atmos. Chem. Phys., 9, 3867–3879,doi:10.5194/acp-9-3867-2009, 2009.
Borrego, C., Gomes, P., Barros, N., and Miranda, A. I.: Impor-tance of handling organic atmospheric pollutants for assessingair quality, J. Chromatogr. A, 889, 271–279,doi:10.1016/S0021-9673(00)00230-2, 2000.
Brinksma, E. J., Pinardi, G., Volten, H., Braak, R., Richter, A.,Schohardt, A., van Roozendael, M., Fayt, C., Hermans, C., Dirk-sen, R. J., Vlemmix, T., Berkhout, A. J. C., Swart, D. P. J., Oet-jen, H., Wittrock, F., Wagner, T., Ibrahim, O. W., de Leeuw, G.,Moerman, M., Curier, R. L., Celarier, E. A., Cede, A.,Knap, W. H., Veefkind, J. P., Eskes, H. J., Allaart, M., Rothe, R.,Piters, A. J. M., and Levelt, P. F.: The 2005 and 2006 DAN-DELIONS NO2 and aerosol intercomparison campaigns, J. Geo-phys. Res., 113, D16S46,doi:10.1029/2007JD008808, 2008.
Bussemer, M.: Der Ring-Effekt: Ursachen und Einfluß auf die spek-troskopische Messung stratosphaischer Spurenstoffe, Diplomathesis, Universitat Heidelberg, Heidelberg, Germany, 1993.
Celarier, E. A., Brinksma, E. J., Gleason, J. F., Veefkind, J. P.,Cede, A., Herman, J. R., Ionov, D., Goutail, F., Pommereau, J.-P., Lambert, J.-C., van Roozendael, M., Pinardi, G., Wittrock, F.,Schonhardt, A., Richter, A., Ibrahim, O. W., Wagner, T., Bo-jkov, B., Mount, G., Spinei, E., Chen, C. M., Pongetti, T. J.,Sander, S. P., Bucsela, E. J., Wenig, M. O., Swart, D. P. J.,Volten, H., Kroon, M., and Levelt, P. F.: Validation of OzoneMonitoring Instrument nitrogen dioxide columns, J. Geophys.Res., 113, D15S15,doi:10.1029/2007JD008908, 2008.
Cerqueira, M. A., Pio, C. A., Gomes, P. A., Matos, J. S.,and Nunes, T. V.: Volatile organic compounds in rural atmo-spheres of Central Portugal, Sci. Total Environ., 313, 49–60,doi:10.1016/S0048-9697(03)00250-X, 2003.
Choi, W., Faloona, I. C., Bouvier-Brown, N. C., McKay, M., Gold-stein, A. H., Mao, J., Brune, W. H., LaFranchi, B. W., Co-hen, R. C., Wolfe, G. M., Thornton, J. A., Sonnenfroh, D. M.,and Millet, D. B.: Observations of elevated formaldehyde overa forest canopy suggest missing sources from rapid oxidationof arboreal hydrocarbons, Atmos. Chem. Phys., 10, 8761–8781,doi:10.5194/acp-10-8761-2010, 2010.
De Smedt, I., Muller, J.-F., Stavrakou, T., van der A, R., Es-kes, H., and Van Roozendael, M.: Twelve years of global ob-servations of formaldehyde in the troposphere using GOMEand SCIAMACHY sensors, Atmos. Chem. Phys., 8, 4947–4963,doi:10.5194/acp-8-4947-2008, 2008.
Deutschmann, T., Beirle, S., Frieß, U., Grzegorski, M., Kern, C.,Kritten, L., Platt, U., Prados-Roman, C., Pukite, J., Wagner, T.,Werner, B., and Pfeilsticker, K.: The Monte Carlo atmosphericradiative transfer model McArtim: introduction and validation ofJacobians and 3D features, J. Quant. Spectrosc. Ra., 112, 1119–1137,doi:10.1016/j.jqsrt.2010.12.009, 2011.
Fan, S. J., Fan, Q., Yu, W., Luo, X. Y., Wang, B. M., Song, L. L.,and Leong, K. L.: Atmospheric boundary layer characteristicsover the Pearl River Delta, China, during the summer of 2006:measurement and model results, Atmos. Chem. Phys., 11, 6297–6310,doi:10.5194/acp-11-6297-2011, 2011.
Fried, A., Crawford, J., Olson, J., Walega, J., Potter, W., Wert, B.,Jordan, C., Anderson, B., Shetter, R., Lefer, B., Blake, D.,Blake, N., Meinardi, S., Heikes, B., O’Sullivan, D., Snow, J.,Fuelberg, H., Kiley, C. M., Sandholm, S., Tan, D., Sachse, G.,
Singh, H., Faloona, I., Harward, C. N., and Carmichael, G. R.:Airborne tunable diode laser measurements of formaldehyde dur-ing TRACE-P: distributions and box model comparisons, J. Geo-phys. Res., 108, 8798,doi:10.1029/2003jd003451, 2003.
Fu, T.-M., Jacob, D. J., Wittrock, F., Burrows, J. P., Vrekous-sis, M., and Henze, D. K.: Global budgets of atmosphericglyoxal and methylglyoxal, and implications for formation ofsecondary organic aerosols, J. Geophys. Res., 113, D15303,doi:10.1029/2007JD009505, 2008.
Garland, R. M., Yang, H., Schmid, O., Rose, D., Nowak, A.,Achtert, P., Wiedensohler, A., Takegawa, N., Kita, K.,Miyazaki, Y., Kondo, Y., Hu, M., Shao, M., Zeng, L. M.,Zhang, Y. H., Andreae, M. O., and Poschl, U.: Aerosol opticalproperties in a rural environment near the mega-city Guangzhou,China: implications for regional air pollution, radiative forc-ing and remote sensing, Atmos. Chem. Phys., 8, 5161–5186,doi:10.5194/acp-8-5161-2008, 2008.
Greenblatt, G. D., Orlando, J. J., Burkholder, J. B., and Rav-ishankara, A. R.: Absorption measurements of oxygen be-tween 330 and 1140 nm, J. Geophys. Res., 95, 18577–18582,doi:10.1029/JD095iD11p18577, 1990.
Grosjean, D., Miguel, A. H., and Tavares, T. M.: Urban air pollutionin Brazil: acetaldehyde and other carbonyls, Atmos. Environ. B-Urb., 24, 101–106,doi:10.1016/0957-1272(90)90015-M, 1990.
Grosjean, E., Grosjean, D., Fraser, M. P., and Cass, G. R.: Airquality model evaluation data for organics. 2. C1-C14 car-bonyls in Los Angeles air, Environ. Sci. Technol., 30, 2687,doi:10.1021/es950758w, 1996.
Halla, J. D., Wagner, T., Beirle, S., Brook, J. R., Hayden, K. L.,O’Brien, J. M., Ng, A., Majonis, D., Wenig, M. O., andMcLaren, R.: Determination of tropospheric vertical columnsof NO2 and aerosol optical properties in a rural setting us-ing MAX-DOAS, Atmos. Chem. Phys., 11, 12475–12498,doi:10.5194/acp-11-12475-2011, 2011.
Heckel, A., Richter, A., Tarsu, T., Wittrock, F., Hak, C., Pundt, I.,Junkermann, W., and Burrows, J. P.: MAX-DOAS measurementsof formaldehyde in the Po-Valley, Atmos. Chem. Phys., 5, 909–918,doi:10.5194/acp-5-909-2005, 2005.
Hendrick, F., Van Roozendael, M., Kylling, A., Petritoli, A.,Rozanov, A., Sanghavi, S., Schofield, R., von Friedeburg, C.,Wagner, T., Wittrock, F., Fonteyn, D., and De Maziere, M.: In-tercomparison exercise between different radiative transfer mod-els used for the interpretation of ground-based zenith-sky andmulti-axis DOAS observations, Atmos. Chem. Phys., 6, 93–108,doi:10.5194/acp-6-93-2006, 2006.
Ho, S. S. H. and Yu, J. Z.: Feasibility of collection and analysis ofairborne carbonyls by on-sorbent derivatization and thermal des-orption, Anal. Chem., 74, 1232–1240,doi:10.1021/ac015708q,2002.
Hofzumahaus, A., Rohrer, F., Lu, K., Bohn, B., Brauers, T.,Chang, C.-C., Fuchs, H., Holland, F., Kita, K., Kondo, Y., Li, X.,Lou, S., Shao, M., Zeng, L., Wahner, A., and Zhang, Y.: Ampli-fied trace gas removal in the troposphere, Science, 324, 1702–1704,doi:10.1126/science.1164566, 2009.
Honninger, G. and Platt, U.: Observations of BrO and its verti-cal distribution during surface ozone depletion at Alert, Atmos.Environ., 36, 2481–2489,doi:10.1016/S1352-2310(02)00104-8,2002.
Atmos. Chem. Phys., 13, 2133–2151, 2013 www.atmos-chem-phys.net/13/2133/2013/
X. Li et al.: MAX-DOAS trace gases measurements in China 2149
Hua, W., Chen, Z. M., Jie, C. Y., Kondo, Y., Hofzumahaus, A.,Takegawa, N., Chang, C. C., Lu, K. D., Miyazaki, Y., Kita, K.,Wang, H. L., Zhang, Y. H., and Hu, M.: Atmospheric hydrogenperoxide and organic hydroperoxides during PRIDE-PRD’06,China: their concentration, formation mechanism and contribu-tion to secondary aerosols, Atmos. Chem. Phys., 8, 6755–6773,doi:10.5194/acp-8-6755-2008, 2008.
Huisman, A. J., Hottle, J. R., Galloway, M. M., DiGangi, J. P.,Coens, K. L., Choi, W., Faloona, I. C., Gilman, J. B.,Kuster, W. C., de Gouw, J., Bouvier-Brown, N. C., Gold-stein, A. H., LaFranchi, B. W., Cohen, R. C., Wolfe, G. M.,Thornton, J. A., Docherty, K. S., Farmer, D. K., Cubison, M. J.,Jimenez, J. L., Mao, J., Brune, W. H., and Keutsch, F. N.: Pho-tochemical modeling of glyoxal at a rural site: observations andanalysis from BEARPEX 2007, Atmos. Chem. Phys., 11, 8883–8897,doi:10.5194/acp-11-8883-2011, 2011.
Inomata, S., Tanimoto, H., Kameyama, S., Tsunogai, U., Irie, H.,Kanaya, Y., and Wang, Z.: Technical Note: Determination offormaldehyde mixing ratios in air with PTR-MS: laboratory ex-periments and field measurements, Atmos. Chem. Phys., 8, 273–284,doi:10.5194/acp-8-273-2008, 2008.
Irie, H., Kanaya, Y., Akimoto, H., Tanimoto, H., Wang, Z., Glea-son, J. F., and Bucsela, E. J.: Validation of OMI troposphericNO2 column data using MAX-DOAS measurements deep in-side the North China Plain in June 2006: Mount Tai Experiment2006, Atmos. Chem. Phys., 8, 6577–6586,doi:10.5194/acp-8-6577-2008, 2008.
Irie, H., Takashima, H., Kanaya, Y., Boersma, K. F., Gast, L., Wit-trock, F., Brunner, D., Zhou, Y., and Van Roozendael, M.: Eight-component retrievals from ground-based MAX-DOAS observa-tions, Atmos. Meas. Tech., 4, 1027–1044,doi:10.5194/amt-4-1027-2011, 2011.
Jing, L. H., Steinberg, S. M., and Johnson, B. J.: Aldehyde andmonocyclic aromatic hydrocarbon mixing ratios at an urban sitein Las Vegas, Nevada, J. Air Waste Manage., 51, 1359–1366,2001.
Junkermann, W.: On the distribution of formaldehyde in the west-ern Po-Valley, Italy, during FORMAT 2002/2003, Atmos. Chem.Phys., 9, 9187–9196,doi:10.5194/acp-9-9187-2009, 2009.
Kawamura, K., Steinberg, S., and Kaplan, I. R.: Homologous seriesof C1–C10 monocarboxylic acids and C1–C6 carbonyls in LosAngeles air and motor vehicle exhausts, Atmos. Environ., 34,4175–4191, 2000.
Klippel, T., Fischer, H., Bozem, H., Lawrence, M. G., Butler, T.,Jockel, P., Tost, H., Martinez, M., Harder, H., Regelin, E.,Sander, R., Schiller, C. L., Stickler, A., and Lelieveld, J.: Dis-tribution of hydrogen peroxide and formaldehyde over CentralEurope during the HOOVER project, Atmos. Chem. Phys., 11,4391–4410,doi:10.5194/acp-11-4391-2011, 2011.
Kurucz, R. L., Furenlid, I., J., and Testerman, L.: Solar Flux Atlasfrom 296 to 1300 nm, Technical report, National Solar Observa-tory, 1984.
Lee, Y.-N., Zhou, X., and Hallock, K.: Atmospheric carbonyl com-pounds at a rural Southeastern United States site, J. Geophys.Res., 100, 25933–25944,doi:10.1029/95jd02605, 1995.
Lee, Y. N., Zhou, X., Kleinman, L. I., Nunnermacker, L. J.,Springston, S. R., Daum, P. H., Newman, L., Keigley, W. G.,Holdren, M. W., Spicer, C. W., Young, V., Fu, B., Parrish, D. D.,Holloway, J., Williams, J., Roberts, J. M., Ryerson, T. B., and
Fehsenfeld, F. C.: Atmospheric chemistry and distribution offormaldehyde and several multioxygenated carbonyl compoundsduring the 1995 Nashville/Middle Tennessee Ozone Study,J. Geophys. Res., 103, 22449–22462,doi:10.1029/98jd01251,1998.
Lei, W., Zavala, M., de Foy, B., Volkamer, R., Molina, M. J., andMolina, L. T.: Impact of primary formaldehyde on air pollutionin the Mexico City Metropolitan Area, Atmos. Chem. Phys., 9,2607–2618,doi:10.5194/acp-9-2607-2009, 2009.
Leser, H., Honninger, G., and Platt, U.: MAX-DOAS measurementsof BrO and NO2 in the marine boundary layer, Geophys. Res.Lett., 30, 1537,doi:10.1029/2002gl015811, 2003.
Li, X., Brauers, T., Shao, M., Garland, R. M., Wagner, T.,Deutschmann, T., and Wahner, A.: MAX-DOAS measurementsin southern China: retrieval of aerosol extinctions and validationusing ground-based in-situ data, Atmos. Chem. Phys., 10, 2079–2089,doi:10.5194/acp-10-2079-2010, 2010.
Li, X., Brauers, T., Haseler, R., Bohn, B., Hofzumahaus, A., Hol-land, F., Lu, K. D., Rohrer, F., Hu, M., Zeng, L. M., Zhang, Y. H.,Garland, R., Su, H., Nowak, A., Takegawa, N., Shao, M., andWahner, A.: Exploring the atmospheric chemistry of nitrous acid(HONO) at a rural site in Southern China, Atmos. Chem. Phys.Discuss., 11, 27591–27635,doi:10.5194/acpd-11-27591-2011,2011.
Li, X., Brauers, T., Hofzumahaus, A., Lu, K., Li, Y. P., Shao,M., Wagner, T., and Wahner, A.: MAX-DOAS measurements ofNO2, HCHO and CHOCHO at a rural site in Southern China, At-mos. Chem. Phys. Discuss., 12, 3983–4029,doi:10.5194/acpd-12-3983-2012, 2012.
Li, X., Brauers, T., Rohrer, F., Shao, M., Lu, K., Bohn, B., Fuchs, H.,Hofzumahaus, A., Holland, F., Hu, M., Lou, S., Nowak, A.,Takegawa, N., Zeng, L. M., Zhang, Y. H., and Wahner, A.: Mod-eling of HCHO and CHOCHO at a rural site in southern Chinaduring PRIDE-PRD2006 campaign, Atmos. Chem. Phys. Dis-cuss., under preparation, 2013.
Liu, W., Zhang, J., Kwon, J., Weisel, C., Turpin, B., Zhang, L.,Korn, L., Morandi, M., Stock, T., and Colome, S.: Concentra-tions and source characteristics of airborne carbonyl compoundsmeasured outside urban residences, J. Air Waste Manage., 56,1196–1204, 2006.
Lou, S., Holland, F., Rohrer, F., Lu, K., Bohn, B., Brauers, T.,Chang, C. C., Fuchs, H., Haseler, R., Kita, K., Kondo, Y.,Li, X., Shao, M., Zeng, L., Wahner, A., Zhang, Y., Wang, W.,and Hofzumahaus, A.: Atmospheric OH reactivities in thePearl River Delta – China in summer 2006: measurementand model results, Atmos. Chem. Phys., 10, 11243–11260,doi:10.5194/acp-10-11243-2010, 2010.
Lu, K. D., Rohrer, F., Holland, F., Fuchs, H., Bohn, B., Brauers, T.,Chang, C. C., Haseler, R., Hu, M., Kita, K., Kondo, Y., Li, X.,Lou, S. R., Nehr, S., Shao, M., Zeng, L. M., Wahner, A., Zhang,Y. H., and Hofzumahaus, A.: Observation and modelling of OHand HO2 concentrations in the Pearl River Delta 2006: a missingOH source in a VOC rich atmosphere, Atmos. Chem. Phys., 12,1541–1569,doi:10.5194/acp-12-1541-2012, 2012.
Meller, R. and Moortgat, G. K.: Temperature dependence of the ab-sorption cross sections of formaldehyde between 223 and 323 Kin the wavelength range 225–375 nm, J. Geophys. Res., 105,7089–7101,doi:10.1029/1999jd901074, 2000.
www.atmos-chem-phys.net/13/2133/2013/ Atmos. Chem. Phys., 13, 2133–2151, 2013
2150 X. Li et al.: MAX-DOAS trace gases measurements in China
Moortgat, G. K., Grossmann, D., Boddenberg, A., Dallmann, G.,Ligon, A. P., Turner, W. V., Gab, S., Slemr, F., Wieprecht, W.,Acker, K., Kibler, M., Schlomski, S., and Bachmann, K.: Hydro-gen peroxide, organic peroxides and higher carbonyl compoundsdetermined during the BERLIOZ campaign, J. Atmos. Chem.,42, 443–463,doi:10.1023/A:1015743013107, 2002.
Muller, K., Haferkorn, S., Grabmer, W., Wisthaler, A., Hansel, A.,Kreuzwieser, J., Cojocariu, C., Rennenberg, H., and Her-rmann, H.: Biogenic carbonyl compounds within and abovea coniferous forest in Germany, Atmos. Environ., 40, 81–91,doi:10.1016/j.atmosenv.2005.10.070, 2006.
Munger, J. W., Jacob, D. J., Daube, B. C., Horowitz, L. W.,Keene, W. C., and Heikes, B. G.: Formaldehyde, glyoxal,and methylglyoxal in air and cloudwater at a rural mountainsite in Central Virginia, J. Geophys. Res., 100, 9325–9333,doi:10.1029/95JD00508, 1995.
Myriokefalitakis, S., Vrekoussis, M., Tsigaridis, K., Wittrock, F.,Richter, A., Bruhl, C., Volkamer, R., Burrows, J. P., and Kanaki-dou, M.: The influence of natural and anthropogenic secondarysources on the glyoxal global distribution, Atmos. Chem. Phys.,8, 4965–4981,doi:10.5194/acp-8-4965-2008, 2008.
Pikelnaya, O., Hurlock, S. C., Trick, S., and Stutz, J.: Intercom-parison of multiaxis and long-path differential optical absorp-tion spectroscopy measurements in the marine boundary layer,J. Geophys. Res., 112, D10S01,doi:10.1029/2006jd007727,2007.
Platt, U., Marquard, L., Wagner, T., and Perner, D.: Correctionsfor zenith scattered light DOAS, Geophys. Res. Lett., 24, 1759–1762,doi:10.1029/97gl01693, 1997.
Possanzini, M., Tagliacozzo, G., and Cecinato, A.: Ambient levelsand sources of lower carbonyls at Montelibretti, Rome (Italy),Water Air Soil Poll., 183, 447–454,doi:10.1007/s11270-007-9393-1, 2007.
Press, W. H., Teukolsky, S. A., Vetterling, W. T., and Flannery, B. P.(Eds.): Modeling of data, chap. 15, in: Numerical Recipes –The Art of Scientific Computing, 3rd edn., Cambridge Univer-sity Press, The Edinburgh Building, Cambridge CB2 8RU, UK,773–815, 2007.
Richter, A., Burrows, J. P., Nusz, H., Granier, C., and Niemeier, U.:Increase in tropospheric nitrogen dioxide over China observedfrom space, Nature, 437, 129–132,doi:10.1038/nature04092,2005.
Rodgers, C. D.: Inverse Methods for Atmospheric Sounding: The-ory and Practice, vol. 2 of Atmospheric, Oceanic and PlanetaryPhysics, World Scientific, Hackensack, NJ, USA, 2000.
Rothman, L. S., Jacquemart, D., Barbe, A., Chris Benner, D.,Birk, M., Brown, L. R., Carleer, M. R., Chackerian, J. C.,Chance, K., Coudert, L. H., Dana, V., Devi, V. M., Flaud, J. M.,Gamache, R. R., Goldman, A., Hartmann, J. M., Jucks, K. W.,Maki, A. G., Mandin, J. Y., Massie, S. T., Orphal, J., Perrin, A.,Rinsland, C. P., Smith, M. A. H., Tennyson, J., Tolchenov, R. N.,Toth, R. A., Vander Auwera, J., Varanasi, P., and Wagner, G.:The HITRAN 2004 molecular spectroscopic database, J. Quant.Spectrosc. Ra., 96, 139–204,doi:10.1016/j.jqsrt.2004.10.008,2005.
Schauer, J. J., Kleeman, M. J., Cass, G. R., and Simoneit, B. R. T.:Measurement of emissions from air pollution sources. 2.C1 through C30 organic compounds from medium dutydiesel trucks, Environ. Sci. Technol., 33, 1578–1587,
doi:10.1021/es980081n, 1999.Schauer, J. J., Kleeman, M. J., Cass, G. R., and Simoneit, B. R. T.:
Measurement of Emissions from Air Pollution Sources. 3. C1–C29 organic compounds from fireplace combustion of wood,Environ. Sci. Technol., 35, 1716–1728,doi:10.1021/es001331e,2001.
Schauer, J. J., Kleeman, M. J., Cass, G. R., and Simoneit, B. R. T.:Measurement of emissions from air pollution sources. 5. C1–C32 organic compounds from gasoline-powered motor vehicles,Environ. Sci. Technol., 36, 1169–1180,doi:10.1021/es0108077,2002.
Sinreich, R., Volkamer, R., Filsinger, F., Frieß, U., Kern, C.,Platt, U., Sebastian, O., and Wagner, T.: MAX-DOAS detectionof glyoxal during ICARTT 2004, Atmos. Chem. Phys., 7, 1293–130,doi:10.5194/acp-7-1293-2007, 2007.
Stull, R. B.: An introduction to boundary layer meteorology, Atmo-spheric and Oceanographic Sciences Library, Kluwer AcademicPublishers, Dordrecht, The Netherlands, 450–451, 1988.
Takegawa, N., Miyakawa, T., Kondo, Y., Jimenez, J. L., Zhang, Q.,Worsnop, D. R., and Fukuda, M.: Seasonal and diurnal variationsof submicron organic aerosol in Tokyo observed using the Aero-dyne aerosol mass spectrometer, J. Geophys. Res., 111, D11206,doi:10.1029/2005jd006515, 2006.
Theys, N., Van Roozendael, M., Hendrick, F., Fayt, C., Hermans, C.,Baray, J.-L., Goutail, F., Pommereau, J.-P., and De Maziare, M.:Retrieval of stratospheric and tropospheric BrO columns frommulti-axis DOAS measurements at Reunion Island (21◦ S,56◦ E), Atmos. Chem. Phys., 7, 4733–4749,doi:10.5194/acp-7-4733-2007, 2007.
Voigt, S., Orphal, J., Bogumil, K., and Burrows, J. P.: The tem-perature dependence (203–293 K) of the absorption cross sec-tions of O3 in the 230–850 nm region measured by Fourier-transform spectroscopy, J. Photoch. Photobio. A, 143, 1–9,doi:10.1016/s1010-6030(01)00480-4, 2001.
Voigt, S., Orphal, J., and Burrows, J. P.: The temperature andpressure dependence of the absorption cross-sections of NO2in the 250–800 nm region measured by Fourier-transform spec-troscopy, J. Photoch. Photobio. A, 149, 1–7,doi:10.1016/s1010-6030(01)00650-5, 2002.
Volkamer, R., Spietz, P., Burrows, J., and Platt, U.: High-resolution absorption cross-section of glyoxal in the UV-visand IR spectral ranges, J. Photoch. Photobio. A, 172, 35–46,doi:10.1016/j.jphotochem.2004.11.011, 2005.
Vrekoussis, M., Wittrock, F., Richter, A., and Burrows, J. P.: Tem-poral and spatial variability of glyoxal as observed from space,Atmos. Chem. Phys., 9, 4485–4504,doi:10.5194/acp-9-4485-2009, 2009.
Vrekoussis, M., Wittrock, F., Richter, A., and Burrows, J. P.:GOME-2 observations of oxygenated VOCs: what can we learnfrom the ratio glyoxal to formaldehyde on a global scale?,Atmos. Chem. Phys., 10, 10145–10160,doi:10.5194/acp-10-10145-2010, 2010.
Wagner, T., Burrows, J. P., Deutschmann, T., Dix, B., von Friede-burg, C., Frieß, U., Hendrick, F., Heue, K.-P., Irie, H.,Iwabuchi, H., Kanaya, Y., Keller, J., McLinden, C. A., Oetjen, H.,Palazzi, E., Petritoli, A., Platt, U., Postylyakov, O., Pukite, J.,Richter, A., van Roozendael, M., Rozanov, A., Rozanov, V., Sin-reich, R., Sanghavi, S., and Wittrock, F.: Comparison of box-air-mass-factors and radiances for Multiple-Axis Differential Opti-
Atmos. Chem. Phys., 13, 2133–2151, 2013 www.atmos-chem-phys.net/13/2133/2013/

X. Li et al.: MAX-DOAS trace gases measurements in China 2151
cal Absorption Spectroscopy (MAX-DOAS) geometries calcu-lated from different UV/visible radiative transfer models, At-mos. Chem. Phys., 7, 1809–1833,doi:10.5194/acp-7-1809-2007,2007.
Wagner, T., Beirle, S., Brauers, T., Deutschmann, T., Frieß, U.,Hak, C., Halla, J. D., Heue, K. P., Junkermann, W., Li, X.,Platt, U., and Pundt-Gruber, I.: Inversion of tropospheric profilesof aerosol extinction and HCHO and NO2 mixing ratios fromMAX-DOAS observations in Milano during the summer of 2003and comparison with independent data sets, Atmos. Meas. Tech.,4, 2685–2715,doi:10.5194/amt-4-2685-2011, 2011.
Wang, X., Zhang, Y., Hu, Y., Zhou, W., Lu, K., Zhong, L., Zeng, L.,Shao, M., Hu, M., and Russell, A. G.: Process analysis and sen-sitivity study of regional ozone formation over the Pearl RiverDelta, China, during the PRIDE-PRD2004 campaign using theCommunity Multiscale Air Quality modeling system, Atmos.Chem. Phys., 10, 4423–4437,doi:10.5194/acp-10-4423-2010,2010.
Wilmouth, D. M., Hanisco, T. F., Donahue, N. M., and Ander-son, J. G.: Fourier transform ultraviolet spectroscopy of theA 253/2← X 253/2 transition of BrO, J. Phys. Chem. A, 103,8935–8945,doi:10.1021/jp991651o, 1999.
Wittrock, F., Oetjen, H., Richter, A., Fietkau, S., Medeke, T.,Rozanov, A., and Burrows, J. P.: MAX-DOAS measurementsof atmospheric trace gases in Ny-Alesund – Radiative transferstudies and their application, Atmos. Chem. Phys., 4, 955–966,doi:10.5194/acp-4-955-2004, 2004.
Wittrock, F., Richter, A., Oetjen, H., Burrows, J. P., Kanakidou, M.,Myriokefalitakis, S., Volkamer, R., Beirle, S., Platt, U., andWagner, T.: Simultaneous global observations of glyoxal andformaldehyde from space, Geophys. Res. Lett., 33, L16804,doi:10.1029/2006gl026310, 2006.
Xiao, R., Takegawa, N., Zheng, M., Kondo, Y., Miyazaki, Y.,Miyakawa, T., Hu, M., Shao, M., Zeng, L., Gong, Y., Lu, K.,Deng, Z., Zhao, Y., and Zhang, Y. H.: Characterization andsource apportionment of submicron aerosol with aerosol massspectrometer during the PRIDE-PRD 2006 campaign, Atmos.Chem. Phys., 11, 6911–6929,doi:10.5194/acp-11-6911-2011,2011.
Yue, D. L., Hu, M., Wu, Z. J., Guo, S., Wen, M. T., Nowak, A.,Wehner, B., Wiedensohler, A., Takegawa, N., Kondo, Y.,Wang, X. S., Li, Y. P., Zeng, L. M., and Zhang, Y. H.: Variationof particle number size distributions and chemical compositionsat the urban and downwind regional sites in the Pearl River Deltaduring summertime pollution episodes, Atmos. Chem. Phys., 10,9431–9439,doi:10.5194/acp-10-9431-2010, 2010.
Zhang, Y. H., Hu, M., Shao, M., Brauers, T., Chang, C. C.,Hofzumahaus, A., Holland, F., Li, X., Lu, K., Kita, K., Kondo,Y., Nowak, A., Poschl, U., Rohrer, F., Zeng, L., Wiedensohler,A., and Wahner, A.: Continuous efforts to investigate regionalair pollution in the Pearl River Delta, China: PRIDE-PRD2006campaign, Atmos. Chem. Phys. Discuss., in preparation, 2012.
Zheng, J., Zhang, L., Che, W., Zheng, Z., and Yin, S.:A highly resolved temporal and spatial air pollutant emis-sion inventory for the Pearl River Delta region, China andits uncertainty assessment, Atmos. Environ., 43, 5112–5122,doi:10.1016/j.atmosenv.2009.04.060, 2009.
Zhou, X. and Mopper, K.: Apparent partition coefficients of 15carbonyl compounds between air and seawater and between airand freshwater; implications for air-sea exchange, Environ. Sci.Technol., 24, 1864–1869,doi:10.1021/es00082a013, 1990.
www.atmos-chem-phys.net/13/2133/2013/ Atmos. Chem. Phys., 13, 2133–2151, 2013