Mar´ıa C. Ferguson-Amores, Manuel Garc´ıa-Rodr´ıguez and ...

Revista Brasileira de Geofısica (2007) 25(4): 363-387© 2007 Sociedade Brasileira de GeofısicaISSN 0102-261Xwww.scielo.br/rbg
OCEANOGRAPHIC CHARACTERISTICS OF BAIA DE TODOS OS SANTOS, BRAZIL
Mauro Cirano1 and Guilherme Camargo Lessa2
Recebido em 18 novembro, 2006 / Aceito em 9 outubro, 2007Received on November 18, 2006 / Accepted on October 9, 2007
ABSTRACT. Based on a vast set of in situ data, a first comprehensive overview of the oceanographic characteristics of Baıa de Todos os Santos (BTS) is provided.
BTS is the second largest coastal bay in Brazil (maximum area of 1223 km2 and average depth of 9.8 m), and is located in the northeast Brazil, in the vicinity of Salvador
city. The circulation inside the bay is mostly tidally driven and does not vary significantly throughout the year. On the other hand, the wet (winter) and dry (summer)
seasons does alter significantly the distribution of water properties inside the BTS. During summer, the waters inside the bay have oceanic characteristics, with Tropical
Water (TW) penetrating along the whole region, except for the mouth of Rio Paraguacu. The water temperature inside the bay is higher than in the coastal zone, and
variations can be up to 3◦C, reaching a maximum of nearly 30◦C. During winter, with the increase of freshwater inflow, salinity variations of about 4 are observed between
the innermost stations inside BTS and the adjacent coastal region. Salinity values inside the bay can be as low as 32.3, inhibiting the penetration of TW into the BTS,
which is totally occupied by a locally formed Coastal Water (CW). An evaluation of the flushing time is also provided and shows that during summer, a 60-fold increase
can be observed compared to winter (38 days). While the circulation does not vary seasonally inside the bay, the associated inner shelf is characterized by two different
scenarios. During summer, the upwelling favorable easterlies drive a southwestward flow, while during winter the more frequent occurrence of cold fronts (southerly
winds) tend to reverse the circulation.
Keywords: Baıa de Todos os Santos, circulation, tides, water masses.
RESUMO. Com base em um amplo conjunto de dados in situ, este artigo apresenta uma primeira caracterizacao oceanografica da Baıa de Todos os Santos. A BTS e
a segunda maior baıa costeira do Brasil (area maxima de 1223 km2 e profundidade media de 9,8 m), e esta localizada na regiao nordeste do Brasil, nas proximidades
da cidade de Salvador. A circulacao no interior da baıa e predominantemente forcada pelas mares e nao varia significantemente ao longo do ano. Por outro lado, as
estacoes chuvosa (inverno) e seca (verao) geram uma alteracao significativa nas propriedades das aguas no interior da BTS. Durante o verao, as aguas dentro da baıa
tem caracterısticas oceanicas, com a Agua Tropical (AT) penetrando ao longo de toda a regiao, com excecao da desembocadura do Rio Paraguacu. A temperatura da
agua dentro da baıa e maior do que a da regiao costeira adjacente, e estas variacoes podem ser de ate 3◦C, atingindo um maximo de 30◦C. Durante o inverno, com o
aumento do aporte de agua doce, variacoes de salinidade de cerca de 4 podem ser observadas entre a parte mais interna da BTS e a regiao costeira adjacente. Valores
de salinidade dentro da baıa podem chegar ate 32,3, inibindo a penetracao da AT dentro da BTS, que fica totalmente ocupada por uma agua costeira formada localmente.
Uma avaliacao do tempo de descarga tambem e feita e mostra que durante o verao, o tempo de descarga pode sofrer um aumento de 60% daquele observado durante
o inverno (38 dias). Apesar da circulacao nao variar sazonalmente no interior da baıa, observa-se que a plataforma interna associada e caracterizada por dois cenarios.
Durante o verao, os ventos de leste, que proporcionam ressurgencia, atuam para gerar correntes para sudoeste, enquanto que durante o inverno, a maior ocorrencia de
frentes frias (ventos de sul), tende a reverter o padrao de circulacao.
Palavras-chave: Baıa de Todos os Santos, circulacao, mares, massas de agua.
1Centro de Pesquisas em Geofısica e Geologia (CPGG), Universidade Federal da Bahia (UFBA), Instituto de Fısica, Departamento de Fısica da Terra e do Meio Ambiente,
Campus Ondina, 40170-280 Salvador, BA, Brazil. Phone: (71) 3283-8612; Fax: (71) 3283-8501 – E-mail: [email protected] de Pesquisas em Geofısica e Geologia (CPGG), Universidade Federal da Bahia (UFBA), Instituto de Geociencias, Departamento de Sedimentologia, Campus
Ondina, 40170-280 Salvador, BA, Brazil. Phone: (71) 3283-8611; Fax: (71) 3283-8501 – E-mail: [email protected]

364 OCEANOGRAPHIC CHARACTERISTICS OF BAIA DE TODOS OS SANTOS, BRAZIL
INTRODUCTION
Like most of the southern hemisphere coastlines, the Braziliancoastline has undergone a 3 m emergence in the last 6000 ye-ars (Angulo et al., 2006), and as a result the large majority of itscoastal-plain estuaries that have been filled up became river del-tas. Large estuaries that still survive are generally tectonic coastalbays that have apparently undergone varying degrees of subsi-dence and today fringe some of the most important cities and har-bor the most important ports in the country. The largest bays inBrazil are: Baıa de Sao Marcos (BSM – 2025 km2) in the stateof Maranhao, Baıa de Todos os Santos (BTS – 1233 km2) in theState of Bahia and Baıa de Paranagua (BP – 612 km2) in the stateof Parana. The well known Baıa de Guanabara (BG) in the state ofRio de Janeiro is relatively small, with an area of 384 km2.
BTS is located in the vicinity of the third major metropolitanarea in Brazil, the city of Salvador (population of 2.7 million ac-cording to IBGE, 2006), and the largest petrochemical complexof the southern hemisphere (Camacari Petrochemical Center).Due to its economic importance, the bay houses two commo-dities ports (Aratu and Salvador), with a total annual flow of31.4 × 106 tons (ANTAQ, 2005), which represent nearly 5% ofthe total annual flow in Brazilian ports. In addition, there are alsothree outfalls in the continental shelf located northeast of the bay(two for chemical substances and one for sewage). The sewageoutfall is the closest to the bay entrance and was built to have amaximum discharge of 8.3 m3 s-1 (CRA, 2001). Several offshoreoil and gas fields are also prospected within 100 km from the bayentrance and are presented in ANP (2007).
Except for BG (Kjerfve et al., 1997), a comprehensive over-view of the oceanographic characteristics of large Brazilian baysand their surrounding coastal zone is not yet found in the scientificliterature. For instance, the relevant publications for BTS are res-tricted to studies regarding data analysis (Wolgemuth et al., 1981;Lessa et al., 2001) and modeling of water circulation (Montenegroet al., 1999). The bay and the neighboring open coastal areas infront of Salvador have been the focus of continuous environmen-tal monitoring programs. However, the results are unfortunatelykept as technical reports with restricted circulation.
The most important and complete monitoring program for theBTS was the Projeto Bahia Azul. It was a massive project fun-ded by the State Government from 1998 to 2001 to assess thewater quality of the BTS. The project made use of 33 moored ins-truments to sample the water velocity, temperature, salinity and the
pressure field for more than 15 continuous days and over two sea-sons1 (summer and winter). Synoptic hydrographic cruises werealso performed inside BTS to evaluate the distribution of proper-ties in the water column and during spring and neap tidal cycles.
The main goal of this article is to produce an oceanographiccharacterization of the area over its seasonal variation, providingan important source of background information on the water dy-namics for the various marine scientists who work in the BTS. Italso intends to pose some scientific questions related to dynami-cal aspects of the circulation, which will be better answered by theresults of numerical modeling experiments to be presented by theauthors in a future work.
STUDY AREA
The BTS is centered on latitude 12◦50’S and longitude 38◦38’W,with an approximate maximum width (west-east axis) and length(north-south axis) of 32 km and 50 km, respectively. The geolo-gic framework of the BTS has been determined, to a high extend,by tectonism (Cupertino & Bueno, 2005). The bay is bounded inthe east and the west by Cretaceous fault lines (Falha de Marago-gipe and Falha de Salvador) associated with an aborted rift valleythat gave rise to the Reconcavo Basin (Fig. 1). Although the ma-jor fault systems were established in the Cretaceous, reactivationevents occurred in the Tertiary and Quaternary, as indicated byKing (1956), Tricart & da Silva (1968), Martin et al. (1986) andBittencourt et al. (1999). The geomorphology of the bay is pri-marily dictated by tectonic alignments, but deep drainage chan-nels ramify inside the bay following an old drainage network goingtowards Rio Paraguacu, Rio Subae and Baıa de Aratu (Fig. 2). Thedeepest areas inside the bay, reaching depths of 70 m, are associ-ated with the paleo-valley of Rio Paraguacu, which is segmented(see the 20 m isobath in Figure 2) due to sediment accumulationin front of Canal do Paraguacu and Canal de Itaparica. Significantaccumulation of sediment is also observed in the ebb-tidal deltasfronting both entrances of the bay (Canal de Salvador and Canalde Itaparica).
Eleven textural facies were mapped by Dias (2004) (Fig. 3).Siliciclastic sand occurs at the bay entrance channels, along thewestern bay margin and close to the river mouths. The bay-mouthsand is of marine origin, while that inside Itaparica channel andalong the western bay margin is originated from the erosion ofsandstone deposits. Carbonate sand encircles the two centralislands of Mare and Frades. Mud occurs predominantly in the
1The tropical humid climate, as it will be discussed later in more details, is divided in a dry and a wet season. For BTS, the summer months are part of the dry season,while the winter months are part of the wet season.
Revista Brasileira de Geofısica, Vol. 25(4), 2007

MAURO CIRANO and GUILHERME CAMARGO LESSA 365
Figure 1 – Satellite image of Baıa de Todos os Santos (BTS) along with the location of important landmarks and drainage channels. Fault lines thatcontrol the bay’s geomorphology are oriented SW-NE.
northern half of the bay affected by the drainage of fine grainedsedimentary rocks. Gravel is often observed in the fluvial delta ofRio Paraguacu and along Canal do Paraguacu, where it is likelyassociated with the exposure of lowstand fluvial deposits. Lessaet al. (2000) interpreted the sand deposits at the bay entrance as atransgressive, siliciclastic marine sand facies, and those aroundthe island as a transgressive carbonate marine sand facies. Themuddy sediments in the northern half of the bay would be rela-ted to a transgressive bay sand-mud facies and to a regressivebay-mud facies.
The maximum bay area (at an equinoctial spring tide) and itswet perimeter (based on a planimetry estimative using Landsatimages with a spatial resolution of 15 m) correspond to 1223 km2
and 1175 km, respectively. These numbers can be increased by86 km2 and 291 km, respectively, if the 91 islands internal to the
BTS are taken into account. Overall the bay is shallow with anarea-weighted depth of 9.8 m. Approximately 94% of the bayarea lay above depths of 25 m. The intertidal area is 327 km2
(or 27% of the maximum bay area), where 152 km2 are occu-pied by mangroves, 160 km2 by non-vegetated flats (with variedsediment textures) and 15 km2 by non-vegetated supratidal flats.The bay volume during maximum spring tides is approximately12 × 109 m3, whereas the volume below the hydrographic datum(0 m DHN2 or MLLW) is 8.9 × 10⁹ m3. This gives a maximumspring-tidal prism of about 3.1 × 10⁹ m3.
Climate and the hydrological cycleThe climate at the entrance of the bay is tropical humid, with anannual mean temperature, precipitation and evaporation of25.3◦C, 2086 mm and 1002 mm, respectively (Fig. 4) (INMET,
2Diretoria de Hidrografia e Navegacao (DHN) is the Brazilian Hydrographic Authority.
Brazilian Journal of Geophysics, Vol. 25(4), 2007

366 OCEANOGRAPHIC CHARACTERISTICS OF BAIA DE TODOS OS SANTOS, BRAZIL
Figure 2 – Bottom topography of BTS and the location of the current meter moorings (stations 1 to 7 and 10 to 17), the ADCPs (stations 8 and 9), themeteorological stations and the tidal gauges (stations 18, 19 and 20 (at the same location of station 1)) for the winter season. The measurements duringsummertime were performed at the same locations, except for the station 21, which was not included. The brown areas represent the intertidal regions.The depth intervals are differentiated with colors according to the legend.
1992). A precipitation gradient of about 15 mm km-1 occurswestward across the bay, between Salvador and the upper rea-ches of Rio Paraguacu, where the mean annual precipitation is1200 mm. One hundred kilometers inland from the bay mouth,the climate is semi-arid, with average annual evaporation and pre-cipitation rates of 1243 mm and 909 mm, respectively (CEPLAB,1979).
Considering an area-weighted precipitation rate, the year-averaged volume of rain falling directly into the bay is 2.42 ×10⁹ m3. If the evaporation gradient across the bay is taken intoaccount, an average volume of 0.92 × 10⁹ m3 is lost annuallyto the atmosphere (considering the area within the 0 m DHNcontour). This volume must be added to the potential evapo-transpiration rate from the mangroves, estimated according to the
Thornthwaite method (Thornthwaite, 1948) as 1412 mm year-1.Assuming that the real evapotranspiration in a mangrove forestequals the potential, a volume of 0.21 × 10⁹ m3 is also lost tothe atmosphere. Hence, the atmospheric-water that enters the bayis about 1.29 × 10⁹ m3, which represents a year-average dis-charge of approximately 41 m3 s-1.
The monthly distribution of rainfall over the bay is out of phasewith that in the interior. In the former, precipitation is mainly con-centrated during the fall and in the beginning of the winter (March-July), when 60% of the total precipitation occurs (Fig. 4). On theother hand, the wet season in the mainland takes place betweenNovember and February. This pattern of distribution causes dif-ferent inputs of freshwater inflow into the bay due to the loca-tion of the three large catchment areas, as well as the 91 small
Revista Brasileira de Geofısica, Vol. 25(4), 2007

MAURO CIRANO and GUILHERME CAMARGO LESSA 367
Figure 3 – Distribution of surface sediment facies inside the BTS (after Dias, 2004).
peripheral catchments (Lima & Lessa, 2002). The catchmentof Rio Paraguacu, with an area of 56,300 km2, drains mainlandrivers and provides the main point-source discharge with maximain December and January. Between 1949 and 1986, when Pedrado Cavalo Dam (located 15 km upstream from Baıa de Iguape –Figure 1) was not yet built, the mean river discharge was 90.5 m3
s-1 (Genz, 2006), or 73% of the total fluvial input. After 1986,flow regulation implemented by the dam significantly altered thedischarge pattern into the bay (Lima & Lessa, 2002; Genz, 2006).Based on the reservoir operational guidelines, an average dailydischarge of 10 m3 s-1 (in reality 60 m3 s-1 in 4 hours) is re-leased during the dry season (March-October). In the wet sea-son (November-February), depending on the water level insidethe reservoir (SRH, 1996), the discharge can reach a maximumof 1700 m3 s-1. Between 1987 and 2003, the average year riverdischarge dropped to 64.3 m3 s-1 (Genz, 2006). Maximum meandaily discharges have varied significantly along the years during
this period, between 57 m3 s-1 (in September) and 1740 m3 s-1
(in January). However, a single extraordinary flood event inDecember 1998 caused the maximum averaged daily dischargeto reach 5726 m3 s-1.
0
50
100
150
200
250
300
350
400
J F M A M J J A S O N D
month
pre
cip
itati
on
(m
m/m
on
th)
23
23,5
24
24,5
25
25,5
26
26,5
27
tem
pera
ture
(oC
)
Figure 4 – Monthly mean precipitation and air temperature based on 30 yearsaverages for Salvador (1961-1990).
Brazilian Journal of Geophysics, Vol. 25(4), 2007

368 OCEANOGRAPHIC CHARACTERISTICS OF BAIA DE TODOS OS SANTOS, BRAZIL
The other two main catchments, Rio Jaguaripe (2200 km2)and Rio Subae (600 km2) (Fig. 1) are coastal, and have their dis-charge maxima around June, with mean monthly discharges of28 m3 s-1 and 9 m3 s-1, respectively. These values are about th-ree times larger than their discharge minima values of 13 m3 s-1
and 3 m3 s-1 in the summer. The other 91 peripheral catchments(total area of 1713 km2) have their average flow rate assessed as34 m3 s-1 (CRA, 2000). The annual variation of the monthly ave-raged discharge of the peripheral catchments was assessed viathe variation of the average monthly precipitation relative to theannual mean. A discharge maximum of 67 m3 s-1 should occurin May, and a minimum of 19 m3 s-1 should occur in January.
0
50
100
150
200
250
300
350
J F M A M J J A S O N D
month
dis
ch
arg
e (
m3 s
-1)
PE Inflow
Total Inflow (pos-dam)
Total Inflow (pre-dam)
Figure 5 – Monthly mean distribution of the freshwater inflow into BTS. Thefreshwater inflow is the sum of precipitation-evaporation (PE) and fluvial dischar-ges and is presented for two distinct periods, prior (light gray) and after (darkgray) the construction of Pedra do Cavalo dam. The PE alone, for comparisonpurposes, is presented in black.
The overall freshwater balance for the BTS, including bothatmospheric-water and fluvial discharges, is presented in Fi-gure 5. It is observed that the higher freshwater inflow rates(more than 250 m3 s-1) occurred between February and May priorto the damming of Rio Paraguacu. For the pre-dam period, theminimum inflow rates occurred in September, with 68 m3 s-1,while the year average discharge was 199 m3 s-1. With the com-pletion of Rio Paraguacu dam, summer discharges were reducedand the higher monthly averages (more than 200 m3 s-1) nowoccur in April and May as well as in November and December.The minimum month-average inflow in September has been re-duced to 55 m3 s-1 while the year average discharge shrank 19%,reaching a value of 162 m3 s-1. The actual maximum monthlyaverage freshwater discharge into the bay (277 m3 s-1) accountsfor less than 0.4% of the equinoctial spring tidal prism.
METHODOLOGY
The data set used in this paper is mainly derived from theProjeto Bahia Azul. The data was collected in two differentperiods, during the summer (dry) season, between January 12and 28, 1999 and during the winter (wet) season, between May22 and June 6, 1999. For both periods, data was obtainedby: (i) moored oceanographic stations distributed over the BTSand associated coastal region sampling water temperature, sa-linity, pressure and velocity fields continuously in 17 stations;(ii) meteorological stations measuring wind speed and direction in4 locations in and outside the bay; (iii) hydrographic surveys sam-pling water properties over one complete tidal cycle (13 hours),during spring and neap tides, in 12 stations distributed in andoutside the bay. Figure 2 shows the location of all the instruments(station 21 was included in the winter campaign). The mooredoceanographic stations had either one or two instruments in themoored line. In the former, the instrument was located at mid-water depth while in the latter the instruments were positionednear the surface and close to the bottom (generally 15% and 85%of the water total depth, respectively). The configuration descri-bed here does not apply for stations 8 and 9, where ADCP’s weremoored.
The velocity field was measured with three different types ofcurrent meters: (i) 16 Aanderaa RCM-7 and one RCM-8 ; (ii)10 InterOcean S4 and (iii) 2 300 kHz RDI WorkHorse ADCP’s.The ADCP’s were deployed at the bottom and set up to resolvedepth-cells of 2 m, scanning at 2 Hz and recording a 3 minutesaverage current every 15 minutes. The same set up was used withthe InterOcean S4’s, but the RCM’s recorded the average currentevery 5 minutes.
The pressure field, converted to elevation, was sampled with3 high-resolution SeaBird SBE 26 and 5 high-resolution (0.4 cm)pressure sensors installed in some of the InterOcean S4 (seeFig. 2). S4 data was obtained at 2 Hz and averaged values wererecorded at 15 minutes intervals. A similar configuration was ap-plied to the SBE’s, except that the data was read at a frequency of4 Hz. It is anticipated that such set up reduced tidal ranges bycutting both high and low water levels.
In order to extend the tidal elevation coverage inside the bay,three other sets of tide gauge data (Cachoeira, Naje and Aratu inFig. 2) were obtained from the Oceanographic Data Base coordi-nated by DHN. Data from Naje and Cachoeira were recorded si-multaneously for 15 days in July 1976, whereas a 30 days longdata set from Baıa de Aratu was collected in May 1988. Mechani-cal tide gauges were used in all three stations, allowing for 1 hour
Revista Brasileira de Geofısica, Vol. 25(4), 2007

MAURO CIRANO and GUILHERME CAMARGO LESSA 369
reading intervals. In addition, a one-year long time series of ti-dal elevation (also derived from one-hour reading intervals of ti-dal charts), obtained from Salvador Harbor in 1960 was includedin the data set in order to provide a better characterization of themagnitude of sub-tidal sea level oscillations inside the bay.
Harmonic analyses were performed for both sea level and ve-locity records in order to quantity the influence of tidal circulation.The methodology adopted was based on Franco (1988).
The hydrographic surveys were performed with 4 SBE19 SeaCat CTD’s, lowered into the water 3 minutes prior to the beginningof measurements. The recording frequency was 2 Hz.
In order to characterize possible seasonal variations inthe atmospheric circulation pattern, wind data was sampled atevery 15 minutes in 3 different locations (4 for the winter) du-ring the 2 seasonal sampling periods. The positions of theseweather stations, named Itaparica, Ilha dos Frades, Mar Grandeand Amaralina (wintertime only) are shown in Figure 2. Thewind speed (U ) was converted to wind stress (τ ) using theformulation τ = ραCD|U |U (Trenberth et al., 1989), whereρα = 1.2 kg m-3 is the air density and CD is the drag coeffici-ent, which is a function ofU .
OCEANOGRAPHIC CHARACTERISTICS
The wind field
Table 1 presents the mean and the standard deviation wind stressfor summer and winter. During summer, the prevailing easterliesgenerated mean stress values between -0.022 Pa and -0.039 Pa,with standard deviation values comparable to the mean. Duringthe winter, southerly winds were more frequent due to the arri-val of cold fronts. The mean values for the prevailing north-southcomponent during winter varied from 0.014 Pa to 0.029 Pa withstandard deviations higher than the mean. The Servain climato-logy (Servain et al., 1996) for the Tropical Atlantic was also usedto verify whether the observed values were representative of a nor-mal seasonal pattern or not. It is observed that although there is agood agreement in terms of direction, the estimates for the prevai-ling component turned out to be 10% to 20% smaller. However,the observed values were comparable to the climatological fieldspresented by Castro & Miranda (1998), based on the Samuels andCox GFDL Global Oceanographic Data Set Atlas.
Tides
Tides in the BTS are characteristically semi-diurnal (Tables 2 and3), with Form number varying between 0.06 in the most internalpart of the bay to 0.11 in the adjacent oceanic region. The astro-
nomical tides explained at least 97.5% (station 15) of the variancein the elevation signal, and more conspicuously in the winter.
Tidal ranges increase up bay by a factor of 1.5. M2 amplitudegrows from 0.67 m in the ocean (stations 13 and 14) to 0.89 min the center of the bay (station 5), 0.93 m in the bay’s northerncove and Canal de Itaparica (stations 20 and 17) and 1.06 m atBaıa de Iguape (station 18) as indicated in Figure 6a. Inside RioParaguacu, M2 amplitude is reduced to 1.00 m in Naje and to0.99 m in Cachoeira, the most inland gauging station. Maximumspring tide ranges in January 1999 underwent an amplification of1.1 m inside the bay (Fig. 7), from 1.86 m in the ocean (station13) to 2.94 m in Baıa de Iguape (station 18), the location of thelargest tide range.
M2 phase angles among the stations were inconsistent due todifferent lengths of the time series, different time of data samplingand differences in time and elevation resolution between mecha-nical tide gauges and electronic pressure sensors. For instance,M2 phase angle derived from a year-long time series in Salva-dor differs in 9◦ from that calculated at station 19 (during sum-mer and winter periods), located in the opposite side of Canalde Salvador. Considering the stations presented in Tables 2 and3 as reference, the integration of M2 phase angle within the bay(Figure 6b) shows that the phase grows from 102◦ in the oceanto 106◦ in the center of the bay (station 5) to 110◦ at the mouthof Rio Subae. Towards Rio Paraguacu, phase angle reaches 114◦at Baıa de Iguape and a maximum of 134◦ at Cachoeira.Along Canal de Itaparica, the phase grows up to 114◦ at station 17showing that a tidal convergence point exists in the proximities ofstation 17.
Along with amplification, the tidal wave undergoes gradualdistortion with rising tides increasingly longer (Fig. 7). Thispattern of tidal asymmetry occurs everywhere inside the BTSbut along Rio Paraguacu. The average asymmetry (given as theratio between the rising time and the falling time) grows from1.03 at station 19 (Canal de Salvador) to 1.23 at station 18 (Baıade Iguape), where the falling tide can be as short as 5 hours. Asa result, the high-tide time lag (in relation to the ocean) growsfrom 30 minutes at station 5 to 45 minutes at station 20 and up to1.25 hours at station 18. Time lags at low tide are thereforesmaller, being 30 minutes at stations 5 and 20 and 45 minutesat station 18.
Tidal asymmetry up Rio Paraguacu changes its pattern froma longer rising to a longer ebbing tide. Lessa et al. (2000) ascri-bed this phenomena to friction effect caused by the shallow fluvialdelta that progrades into Baıa de Iguape. Very low tide levels du-ring spring tides significantly reduce the overall channel depth
Brazilian Journal of Geophysics, Vol. 25(4), 2007

370 OCEANOGRAPHIC CHARACTERISTICS OF BAIA DE TODOS OS SANTOS, BRAZIL
Table 1 – Values of wind stress (mean ± standard deviation) estimated from wind speed data obtained from the weatherstations located within the BTS during the seasonal sampling periods (see Figure 1 for the location of the weather stations).The monthly mean values from the Servain Climatology (related to the closest location available at 13◦S and 39◦W and overthe years of 1964 to 1988) are also presented for comparison purposes. Unit is Pa.
SiteSummer
DateWind stress (Pa)
Prevailing directionE-W N-SIlha dos Frades 06/01/99 – 26/01/99 –0.039 ± 0.035 0.016 ± 0.031 ESE
Itaparica 06/01/99 – 16/01/99 –0.038 ± 0.029 0.011 ± 0.016 ESEMar Grande 06/01/99 – 10/01/99 –0.022 ± 0.018 0.003 ± 0.015 E
Servain Climatology January –0.046 –0.013 ENEWinter
Amaralina 24/05/99 – 10/06/99 0.003 ± 0.017 0.029 ± 0.030 SIlha dos Frades 22/05/99 – 02/06/99 0.004 ± 0.009 0.014 ± 0.024 SSW
Itaparica 23/05/99 – 01/06/99 0.009 ± 0.016 0.014 ± 0.018 SSWMar Grande 24/05/99 – 10/06/99 –0.002 ± 0.009 0.025 ± 0.026 S
Servain Climatology June –0.054 0.035 ESE
Table 2 – Summary of tidal harmonics (for the 7 most important constituents) during the summer sampling period. Am-plitude is H (cm), phase lag of equilibrium tide at Greenwich is G (◦) and tidal Form number (F) is given by the ratioF = (K1 + O1)/(M2 + S2).
SiteQ1 O1 K1 N2 M2 S2 M4
Form NumberH/G H/G H/G H/G H/G H/G H/GS5 2.9/099 6.4/137 3.7/236 9.9/089 89.3/101 31.3/121 2.0/358 0.08
S11 1.6/148 6.1/112 3.9/208 10.0/107 68.6/087 24.1/097 – 0.11S13 2.1/090 6.7/116 3.5/205 10.5/089 67.0/090 24.9/103 1.2/136 0.11S14 2.2/101 6.3/119 3.2/198 11.1/089 67.0/090 24.2/104 0.0/136 0.10S15 3.4/090 7.5/138 3.8/210 10.1/098 92.7/100 31.7/118 7.1/343 0.09S18 3.0/112 6.7/137 4.0/224 11.4/100 106.0/109 37.9/129 9.6/285 0.07S19 2.4/100 6.9/126 3.5/210 10.1/097 81.2/101 29.1/118 2.0/234 0.09S20 2.7/102 7.3/131 4.1/219 10.6/098 93.3/104 33.5/123 3.7/279 0.09
Table 3 – Same as Table 2, but for the winter sampling period.
SiteQ1 O1 K1 N2 M2 S2 M4
Form NumberH/G H/G H/G H/G H/G H/G H/GW12 1.1/121 5.6/125 3.5/200 9.6/098 66.9/103 28.1/114 0.8/143 0.10W13 1.4/095 5.9/115 3.6/197 9.6/095 66.5/102 27.4/116 1.2/162 0.10W14 0.1/058 4.7/124 3.6/195 10.0/094 66.4/102 27.0/115 1.3/170 0.09W15 0.5/086 4.2/122 3.5/197 13.0/101 90.3/109 38.3/123 4.3/007 0.06W17 0.7/089 5.3/118 4.1/200 14.3.103 93.0/118 39.4/134 5.7/290 0.07W18 0.8/072 5.6/116 3.5/197 15.5/095 104.4/110 45.4/128 8.6/293 0.06W19 1.0/094 5.6/116 3.7/197 11.5/092 79.7/102 33.9/117 1.8/242 0.08W20 1.1/094 5.5/114 3.4/200 13.3/092 91.2/106 39.5/122 3.5/287 0.07
Revista Brasileira de Geofısica, Vol. 25(4), 2007

MAURO CIRANO and GUILHERME CAMARGO LESSA 371
a
bFigure 6 – Cotidal lines of a) amplitude (top panel) and b) phase (bottom panel) showing a progressive amplification and delay of M2component into the bay. Units are cm for amplitude and degrees for phase.
Brazilian Journal of Geophysics, Vol. 25(4), 2007

372 OCEANOGRAPHIC CHARACTERISTICS OF BAIA DE TODOS OS SANTOS, BRAZIL
Figure 7 – Simultaneous tidal records in 5 stations located between the ocean and Baıa de Iguape (station 18), showing thetidal wave amplification and distortion inside the BTS. See Figure 2 for the station locations.
across the delta enhancing friction and retarding the ebb flow. Asa result, rising spring tides can be as short as 5 hours and timelags between Cachoeira and Baıa de Iguape are 1 hour at high tideand 3 hours at low tide. Tables 2 and 3 show the growth of M4 asa result of increasing the tidal asymmetry.
The analysis of the year-long time series from Salvador showsmaximum tidal ranges of 2.7 m during an equinoctial-spring tide.The use of a low-pass filter with a cut-off of 72 h revealed about 27long-period waves up to 20 cm in height with an average periodof 12 days. This period is coincident to a 13 days-cycle highligh-ted by the spectrum analysis of the tide series. These waves weresuperimposed to a longer period oscillation of 9-10 months withamplitude of 7 cm. The highest and lowest mean sea levels werefound to occur during May and October, respectively.
Sub-inertial oscillations during the summer and winter sam-pling periods had heights of 10 and 17 cm respectively (Fig. 8a,b).The degree of coupling between the shelf and bay oscillationswas higher during the winter (with more frequent southerly winds)when at least two waves up to 18 cm in height and a period of 5-6days could be observed both along the shelf and inside the bay. Inthe summer (easterlies prevailing winds) the mean sea level trendin the shelf (two oscillations) is matched by the trend observed inthe eastern half of the bay (station 19). It becomes, however, quitedifferent from the pattern observed in the most inland stations(18 and 20) where an almost continuously rising trend existed.
At Baıa de Iguape (station 18) the oscillation (4 cm in height)between January 23 and 26 was apparently caused by a riverflood that began on the 23rd and reached a discharge peak of1512 m3 s-1 on January 25, 1999.
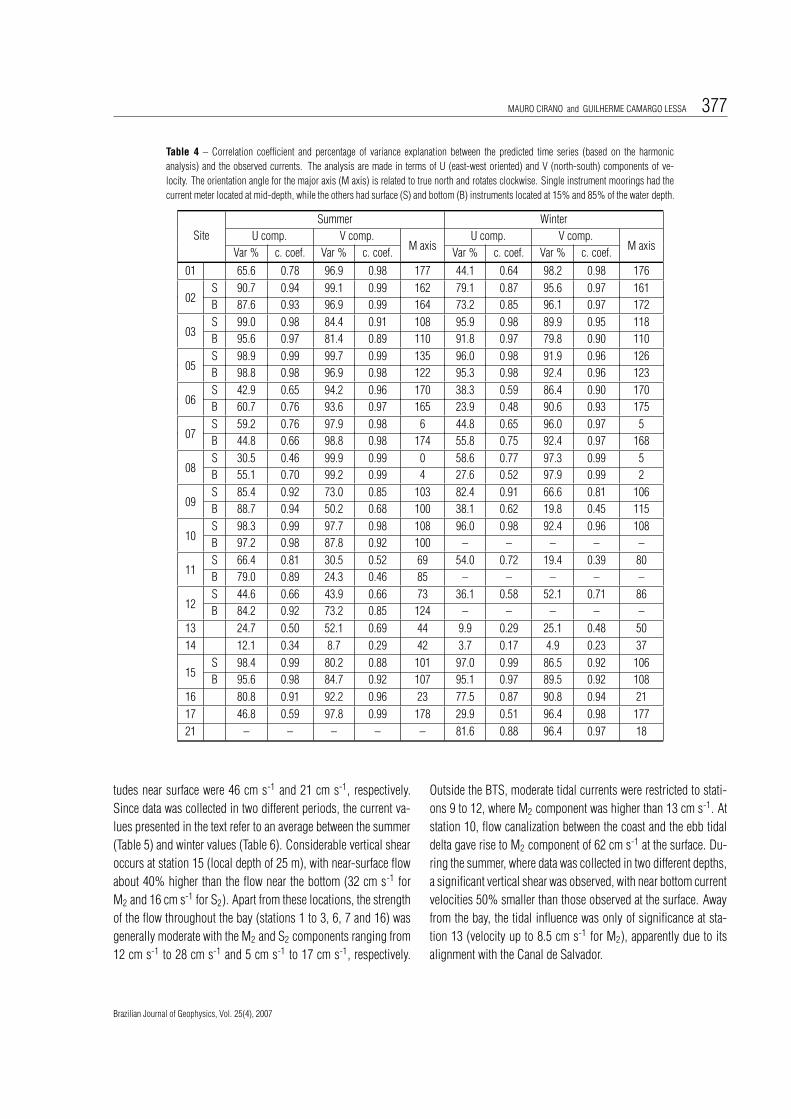
Tidal currents
The currents inside the BTS (stations 1-8 and 15-21) are clearlytide driven. The correlation coefficient and the variance explana-tion between the predicted and observed currents, for the com-ponent closer to the orientation of the main axis, are above 0.90and 86%, respectively (Table 4). These numbers decrease as afunction of the increasing distance from the bay mouth, reachingvalues as low as of 0.23 and 4.9% at station 14 during winter.Figure 9 and Figure 10 show the current time series at stations17 (inside Canal de Itaparica), 13 and 14 (both outside BTS) forsummer and winter, respectively. The tidal signal at station 17 isobscured at station 13 (in line with Canal de Salvador) and beco-mes indiscernible at station 14, mainly in the winter.
Harmonic analysis of the current field inside the BTS (Tables5 and 6) shows vector Form numbers smaller than 0.19, whichcharacterize the tidal currents as semi-diurnal (Pond & Pickard,1983). For some stations outside the BTS, such as station 13, thetidal currents are mixed with semi-diurnal predominance, resul-ting in inequalities between the currents during the highs and lows
Revista Brasileira de Geofısica, Vol. 25(4), 2007

MAURO CIRANO and GUILHERME CAMARGO LESSA 373
Figure 8 – Time series of the sub-inertial elevation variation for some stations in and outside the bay during a) summer and b) winter.
for each day. At station 14, the tidal currents are still mixed, buthere they have diurnal predominance, with vector Form numbersclose to 2.4 (the magnitude of the O1 and K1 tidal ellipses are verysmall and of order of few cm s-1 only). M2 and S2 tidal ellipsesin both seasons are shown in Figure 11. In general, the ellipsesare oriented along the main channels of the bay and eccentricitytends to be small. For the locations where the water column wassampled in two depths, the orientation of the ellipses did not varymore than a few degrees. Apart from station 15 (located at Canal
de Madre de Deus in Figure 2), vertical shear was not significant.Maximum current velocities occur at the two entrances of the
bay, Canal de Salvador (station 8) and Canal de Itaparica (station17), where the M2 component close to the surface had magnitu-des of 65 cm s-1 and 51 cm s-1, respectively. The S2 componenthad values of 28 cm s-1 and 24 cm s-1 for these same locations.Other regions of relatively intense flow were the center of the bay(station 5), with magnitudes of 35 cm s-1 for M2 and 17 cm s-1
for S2, and the channel at station 15, where M2 and S2 magni-
Brazilian Journal of Geophysics, Vol. 25(4), 2007

374 OCEANOGRAPHIC CHARACTERISTICS OF BAIA DE TODOS OS SANTOS, BRAZIL
Figure 9 – Time series of the current vectors at stations 13 (top), 14 (middle) and 17 (bottom) during the summer and according to the location map presentedin Figure 2. The vectors are related to the true north.
Figure 10 – Same as Figure 9, but for the winter.
Revista Brasileira de Geofısica, Vol. 25(4), 2007

MAURO CIRANO and GUILHERME CAMARGO LESSA 375
Figure 11 – Harmonic current ellipses for (a) M2 and (b) S2 components during summer. All the ellipses are drawn to the same scale.
Brazilian Journal of Geophysics, Vol. 25(4), 2007

376 OCEANOGRAPHIC CHARACTERISTICS OF BAIA DE TODOS OS SANTOS, BRAZIL
Figure 11 (continued) – Figures (c) and (d) are the same as in (a) and (b), but for the winter. Solid lines indicateeither a single current meter or the near surface current meter, while dashed lines represent the near bottom instruments.All the ellipses are drawn to the same scale.
Revista Brasileira de Geofısica, Vol. 25(4), 2007
MAURO CIRANO and GUILHERME CAMARGO LESSA 377
Table 4 – Correlation coefficient and percentage of variance explanation between the predicted time series (based on the harmonicanalysis) and the observed currents. The analysis are made in terms of U (east-west oriented) and V (north-south) components of ve-locity. The orientation angle for the major axis (M axis) is related to true north and rotates clockwise. Single instrument moorings had thecurrent meter located at mid-depth, while the others had surface (S) and bottom (B) instruments located at 15% and 85% of the water depth.
SiteSummer Winter
U comp. V comp.M axis
U comp. V comp.M axisVar % c. coef. Var % c. coef. Var % c. coef. Var % c. coef.
01 65.6 0.78 96.9 0.98 177 44.1 0.64 98.2 0.98 176
02S 90.7 0.94 99.1 0.99 162 79.1 0.87 95.6 0.97 161B 87.6 0.93 96.9 0.99 164 73.2 0.85 96.1 0.97 172
03S 99.0 0.98 84.4 0.91 108 95.9 0.98 89.9 0.95 118B 95.6 0.97 81.4 0.89 110 91.8 0.97 79.8 0.90 110
05S 98.9 0.99 99.7 0.99 135 96.0 0.98 91.9 0.96 126B 98.8 0.98 96.9 0.98 122 95.3 0.98 92.4 0.96 123
06S 42.9 0.65 94.2 0.96 170 38.3 0.59 86.4 0.90 170B 60.7 0.76 93.6 0.97 165 23.9 0.48 90.6 0.93 175
07S 59.2 0.76 97.9 0.98 6 44.8 0.65 96.0 0.97 5B 44.8 0.66 98.8 0.98 174 55.8 0.75 92.4 0.97 168
08S 30.5 0.46 99.9 0.99 0 58.6 0.77 97.3 0.99 5B 55.1 0.70 99.2 0.99 4 27.6 0.52 97.9 0.99 2
09S 85.4 0.92 73.0 0.85 103 82.4 0.91 66.6 0.81 106B 88.7 0.94 50.2 0.68 100 38.1 0.62 19.8 0.45 115
10S 98.3 0.99 97.7 0.98 108 96.0 0.98 92.4 0.96 108B 97.2 0.98 87.8 0.92 100 – – – – –
11S 66.4 0.81 30.5 0.52 69 54.0 0.72 19.4 0.39 80B 79.0 0.89 24.3 0.46 85 – – – – –
12S 44.6 0.66 43.9 0.66 73 36.1 0.58 52.1 0.71 86B 84.2 0.92 73.2 0.85 124 – – – – –
13 24.7 0.50 52.1 0.69 44 9.9 0.29 25.1 0.48 5014 12.1 0.34 8.7 0.29 42 3.7 0.17 4.9 0.23 37
15S 98.4 0.99 80.2 0.88 101 97.0 0.99 86.5 0.92 106B 95.6 0.98 84.7 0.92 107 95.1 0.97 89.5 0.92 108
16 80.8 0.91 92.2 0.96 23 77.5 0.87 90.8 0.94 2117 46.8 0.59 97.8 0.99 178 29.9 0.51 96.4 0.98 17721 – – – – – 81.6 0.88 96.4 0.97 18
tudes near surface were 46 cm s-1 and 21 cm s-1, respectively.Since data was collected in two different periods, the current va-lues presented in the text refer to an average between the summer(Table 5) and winter values (Table 6). Considerable vertical shearoccurs at station 15 (local depth of 25 m), with near-surface flowabout 40% higher than the flow near the bottom (32 cm s-1 forM2 and 16 cm s-1 for S2). Apart from these locations, the strengthof the flow throughout the bay (stations 1 to 3, 6, 7 and 16) wasgenerally moderate with the M2 and S2 components ranging from12 cm s-1 to 28 cm s-1 and 5 cm s-1 to 17 cm s-1, respectively.
Outside the BTS, moderate tidal currents were restricted to stati-ons 9 to 12, where M2 component was higher than 13 cm s-1. Atstation 10, flow canalization between the coast and the ebb tidaldelta gave rise to M2 component of 62 cm s-1 at the surface. Du-ring the summer, where data was collected in two different depths,a significant vertical shear was observed, with near bottom currentvelocities 50% smaller than those observed at the surface. Awayfrom the bay, the tidal influence was only of significance at sta-tion 13 (velocity up to 8.5 cm s-1 for M2), apparently due to itsalignment with the Canal de Salvador.
Brazilian Journal of Geophysics, Vol. 25(4), 2007

378 OCEANOGRAPHIC CHARACTERISTICS OF BAIA DE TODOS OS SANTOS, BRAZIL
Table 5 – Summary of the harmonic analysis (O1, K1, M2, S2 components) for the velocity field during the summer sampling period. M and mare the amplitude (cm s-1) of the major and minor axes, respectively, G is the Greenwich phase and θ is the direction of the major axis (relativeto true north and clockwise). The last column is the associated vector Form number given by the ratio F = (K1 + O1)/(M2 + S2).
SiteO1 K1 M2 S2
Form NumberM/m ◦G/◦θ M/m ◦G/◦θ M/m ◦G/◦θ M/m ◦G/◦θ
S1 2.0/0.3 074/358 1.8/0.3 284/133 21.5/4.9 031/355 6.9/3.4 254/198 0.13
S2S 1.8/0.8 236/126 2.1/1.0 275/133 24.4/0.0 029/342 10.4/1.3 031/342 0.11
B 2.4/1.3 217/132 2.4/0.6 292/127 20.2/3.2 018/345 6.7/1.6 026/348 0.18
S3S 1.1/0.5 066/097 0.6/0.1 197/103 22.6/0.7 208/292 10.1/0.8 224/278 0.05
B 1.6/1.2 246/306 0.7/0.1 055/290 20.9/0.8 181/291 12.0/0.2 232/291 0.07
S5S 3.4/0.4 070/351 2.2/0.8 113/354 37.2/0.0 045/313 14.7/1.8 064/316 0.11
B 2.3/0.5 197/109 3.2/0.1 312/115 35.5/2.1 023/301 17.3/0.3 046/305 0.10
S6S 1.8/0.8 225/213 0.4/0.2 036/265 12.7/0.9 021/345 5.0/0.6 217/182 0.12
B 1.7/0.5 310/064 2.1/1.1 006/057 14.2/1.0 011/352 5.6/2.1 205/127 0.19
S7S 1.8/0.0 090/200 0.9/0.3 321/008 26.5/0.1 039/187 14.8/0.1 236/005 0.06
B 1.5/0.1 035/156 1.2/0.1 219/199 24.9/0.7 038/173 11.6/0.2 062/177 0.07
S8S 4.0/0.7 225/204 2.2/0.5 326/181 67.0/2.1 033/000 28.3/1.3 047/359 0.06
B 3.0/0.4 061/321 1.4/0.2 168/315 46.4/1.8 208/184 20.0/0.8 049/006 0.07
S9S 3.3/0.3 340/246 1.8/0.2 001/260 24.1/4.3 215/107 11.7/1.5 206/100 0.14
B 1.4/0.9 210/093 1.0/0.5 038/081 19.5/0.8 197/100 7.5/0.8 201/106 0.09
S10S 1.7/0.1 323/280 0.6/0.0 255/145 58.8/2.8 186/108 21.6/0.6 008/289 0.03
B 2.5/0.4 342/282 0.8/0.1 279/106 32.5/1.8 357/279 16.0/1.0 010/285 0.07
S11S 2.8/0.8 140/033 2.5/0.7 302/257 15.9/1.7 219/084 10.2/1.2 226/068 0.20
B 2.3/1.1 171/123 0.8/0.4 198/281 13.4/2.9 209/084 6.1/0.4 209/095 0.16
S12S 1.7/0.7 049/229 1.8/0.3 038/295 14.9/4.2 194/125 5.8/2.0 213/115 0.17
B 2.0/0.5 025/337 1.8/0.3 188/306 14.8/1.0 206/123 6.9/0.4 207/127 0.17
S13 3.6/0.2 322/094 2.1/0.3 007/096 8.5/2.6 006/030 3.2/0.1 211/200 0.49
S14 3.6/0.4 217/046 2.7/0.0 257/043 1.5/0.1 031/258 1.1/0.7 251/221 2.44
S15S 0.6/0.2 360/160 0.9/0.2 250/152 43.6/0.1 027/280 17.7/0.9 206/104 0.03
B 0.5/0.1 025/012 0.4/0.2 143/278 31.5/0.5 205/108 13.7/1.2 203/105 0.02
S16 0.8/0.2 352/035 0.6/0.1 253/182 16.1/0.8 206/203 6.7/0.1 207/201 0.06
S17 0.8/0.2 258/032 1.0/0.1 190/177 55.5/0.6 303/358 22.9/0.9 297/357 0.02
The tidal wave behaved as a standing wave throughout thebay. A departure from a standing wave propagation was observedat station 7, at the entrance of Canal de Itaparica, where two velo-city peaks occurred during the rising tides (except at neaps). Thesecond, and strongest, velocity peak was ascribed to the inun-dation of relatively high intertidal areas along Canal de Itaparica.As observed by Lessa (2000) in macrotidal estuaries, the inunda-tion of large intertidal areas late in the rising tide causes a sharpincrease of the tidal prism and flow acceleration.
In accordance with the pattern of tidal elevation asymmetry,predicted tidal currents were clearly ebb orientated in most of thestations, exceptions being stations 2, 16, 15 and 21, where stron-ger currents were flood orientated. The ratio between maximumebb to maximum flood currents at stations 17, 7, 5, and 8 variedbetween 1.09 (station 5 in the winter, vebb = 50 cm s-1) and 1.43(station 17 in the summer, vebb = 110 cm s-1). At the bay mouth(station 8), maximum ebb-currents (114 cm s-1) were up to 1.33times higher than maximum flood currents.
Revista Brasileira de Geofısica, Vol. 25(4), 2007

MAURO CIRANO and GUILHERME CAMARGO LESSA 379
Table 6 – Same as Table 5, but for the winter sampling period.
SiteO1 K1 M2 S2
Form NumberM/m ◦G/◦θ M/m ◦G/◦θ M/m ◦G/◦θ M/m ◦G/◦θ
W1 1.0/0.2 124/050 1.2/0.5 113/061 21.6/4.4 032/356 10.6/1.5 045/354 0.07
W2S 1.5/0.1 059/018 1.1/0.7 015/174 22.6/0.9 035/340 10.8/0.0 045/343 0.08B 1.3/0.2 238/210 1.0/0.4 120/076 22.5/5.9 028/350 11.1/2.9 031/352 0.07
W3S 1.4/0.2 356/114 0.5/0.0 276/312 27.7/2.5 218/296 14.3/0.7 212/302 0.05B 0.6/0.1 032/093 1.2/0.4 229/278 23.0/0.1 009/110 12.2/0.1 036/110 0.05
W5S 1.8/0.7 204/162 1.5/0.3 173/279 32.5/3.3 225/124 17.2/0.1 240/128 0.07B 1.2/0.2 250/307 0.4/0.3 035/064 36.5/4.1 017/304 18.6/0.6 038/300 0.03
W6S 1.6/0.3 218/146 0.7/0.0 303/167 11.7/2.4 037/348 6.7/0.5 033/346 0.13B 1.4/0.1 009/245 1.6/0.0 328/240 15.3/2.4 176/172 5.9/1.3 012/339 0.14
W7S 1.6/0.1 202/010 1.5/0.2 279/360 27.2/1.1 226/003 17.0/0.5 238/007 0.07B 1.1/0.3 179/350 1.3/0.0 270/006 23.5/0.1 037/171 15.7/0.6 239/347 0.06
W8S 2.0/0.6 256/193 2.0/0.0 302/225 62.6/2.2 032/005 27.7/1.3 046/005 0.04B 4.1/0.6 020/008 1.8/0.5 038/046 68.4/4.9 038/001 32.9/1.0 051/003 0.06
W9S 2.5/0.4 333/284 1.8/0.4 185/251 26.8/3.0 205/109 11.1/1.2 213/108 0.11B 4.6/1.9 009/246 8.2/1.6 308/091 28.3/4.3 205/122 11.1/0.2 034/307 0.32
W10 S 5.5/0.3 327/286 2.2/0.3 137/287 66.0/1.1 187/107 25.7/0.2 193/110 0.08W11 S 3.5/0.9 169/088 2.4/0.1 002/087 15.3/3.8 215/094 7.3/0.0 214/088 0.26W12 S 2.8/1.1 360/286 0.8/0.4 145/234 15.9/1.6 022/321 6.6/0.6 206/129 0.16W13 1.5/0.7 080/017 1.7/0.4 121/108 6.2/0.7 208/154 5.1/2.9 356/033 0.28W14 3.0/0.1 230/189 1.2/0.2 047/208 1.2/0.1 276/182 0.6/0.2 036/332 2.37
W15S 1.4/0.3 150/128 1.2/0.1 091/286 48.6/0.8 211/105 23.9/0.1 031/286 0.04B 1.1/0.4 287/260 0.5/0.2 128/300 32.3/2.3 209/109 17.9/1.4 220/106 0.03
W16 0.4/0.1 159/107 0.9/0.3 173/026 18.2/0.7 209/200 9.5/0.3 219/201 0.05W17 0.9/0.2 212/350 1.2/0.1 343/360 46.7/0.2 132/178 25.6/0.5 128/176 0.03W21 1.0/0.8 357/330 1.2/0.3 107/052 23.2/1.1 206/200 10.4/0.4 224/197 0.07
Residual circulation
The residual circulation inside the bay over a 15 day period is pre-sented in Figure 12 and shows a similar pattern for both summerand winter periods. As a result of the dominance of the tidal for-cing, the velocities did not exceed 5 cm s-1 (a parcel moving withthis speed would advect substances as far as 65 km over this pe-riod). At the northern part of BTS, significant flow occurred only atCanal de Madre de Deus (station 15), where both current metersregistered northwest currents of order of 5 cm s-1 and at Baıa deAratu (station 3), where the residual flow was towards the bay atboth depths. Residual velocities found at stations 16 and 2, insidethe channels leading to Baıa de Aratu and Ilha de Madre de Deus,also registered northward bound residual flows.
The residual circulation at station 5 is characterized by near-surface currents opposing the direction of the near-bottom cur-rents, both in the summer and winter. The flow was directed down-
bay close to the surface and up-bay near the bottom, with velo-cities of order of 5 cm s-1. This suggests a permanent pattern inthis area that is likely related to gravitational circulation. A sligh-tly similar pattern was observed at station 8 in the summer, withnear-surface and near-bed currents offset by about 120◦.
South bound residual currents were recorded by all currentmeters at stations 7 and 17, inside the Canal de Itaparica, withvelocities up to 6 cm s-1 at station 17. These residual vectorssuggest that a possible anti-clockwise residual flow could existaround Ilha de Itaparica.
In the inner shelf, the residual circulation is clearly seasonaland the winds may be ascribed to as an important mechanism fordriving the currents. Exceptions are the channel areas between themainland and the ebb-tide delta at station 10 where strong resi-dual currents flowed towards the bay in both seasons (15 cm s-1
in summer and 10 cm s-1 in winter), and station 13, where the
Brazilian Journal of Geophysics, Vol. 25(4), 2007

380 OCEANOGRAPHIC CHARACTERISTICS OF BAIA DE TODOS OS SANTOS, BRAZIL
Figure 12 – Residual velocities during (a) summer and (b) winter. Tick line vectors represent either a single currentmeter or the near surface current meter, whereas the narrow line vectors represent the near bottom instrument. Vectorscales of 5 cm s-1 and 10 cm s-1 are drawn at the upper right part of the panels.
Revista Brasileira de Geofısica, Vol. 25(4), 2007

MAURO CIRANO and GUILHERME CAMARGO LESSA 381
flow was persistently directed to the northeast. In this later case,however, the velocity varied significantly between seasons, beingmore intense during winter.
For the other locations, a change in the predominant winddirection, from easterlies during summer to southerlies duringwinter (Table 1), forced a change in the residual current direc-tion. These changes are ascribed to the more frequent arrival ofcold fronts in winter (e.g., Chaves, 1999; Amorim, 2005). Near-bottom currents in the summer period were weaker than those nearthe surface at stations 10 to 12, indicating a significant velocityshear in the water column (those near-surface currents were above15 cm s-1 and more than three times larger than the near-bottomcurrents). The onshore flow close to the bottom at these locati-ons and the strong near surface flow towards southwest may bean indication of an upwelling favorable system during this sea-son. At station 14, the mid-depth current also agreed with thissummertime southwestward circulation showing a magnitude of7 cm s-1. The lack of near-bottom current estimates at stations 11and 12 during winter prevented any comparison with the summer-time observations.
Water properties
In the summer (Tables 7 and 8), the largest difference in themean surface temperature (3◦C) occurred during the spring tide,between the warmest surface waters of the most inland point (sta-tion 1, T = 29.9◦C) and the relatively colder surface waters at theocean stations (stations 9 to 12, 26.9◦ < T < 27.3◦C). Along thewater column, mean temperature differences were less than 1◦Cfor most stations inside the bay, but reached 1.7◦C outside thebay at station 12 (Table 7). Temperature standard deviations forall stations were also of order of few decimals of a degree.
Mean salinity in the shelf was always above 37, with negligi-ble vertical gradients. The bay was dominated by oceanic waterwith mean salinities higher than 36.4 and very little vertical va-riation. The only exception was station 4 (in front of the Canaldo Rio Paraguacu), which presented a surface mean salinity of35.6. Very high salinities were found at station 3, inside Baıa deAratu (see Figure 2), where relatively high evaporation rate mayoccur, as suggested by the mean temperatures being higher thanthe surrounding stations.
In the winter period (Tables 9 and 10), the temperature wasquite homogeneous in the water column and differentiated littleamong the stations in and outside the bay. The maximum diffe-rence in the mean surface temperature was 0.7◦C (Table 9) andthe largest vertical difference was 0.3◦C at station 12. On the
other hand, the horizontal variation of the surface mean salinityvaried up to 4.2 (Table 10) between the inland most station andthe ocean. This is clearly related to the higher winter precipitationrates along the coast. Vertical salinity gradients were also morepronounced, with differences of more than 1 between surface andbottom in various stations inside the bay.
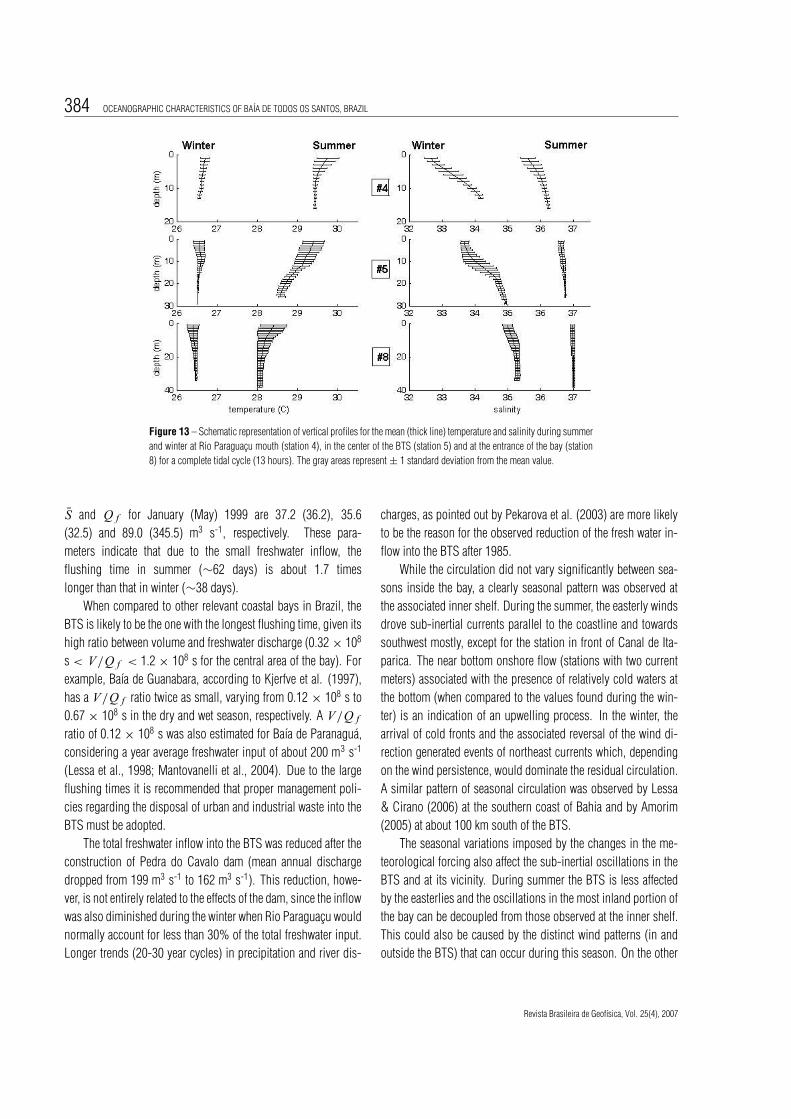
Figure 13 shows the vertical and horizontal salinity and tem-perature variations (mean ± one standard deviation) along a linethrough the center of the bay connecting stations 4, 5 and 8. Itshows gradual changes along this line and different spatial trendsbetween these fields. Whereas the temperature increased up-bayboth in the summer and the winter, salinity decreased. Moreo-ver, larger horizontal and vertical variations occurred during sum-mer for temperature and during winter for salinity. If one standarddeviation is considered, maximum temperature and salinity va-riations between any point in water column at stations 8 and 4can be 2◦C (summer) and 3◦C (winter), respectively. Seasonally,maximum salinity variation in the water column was about 2.2 atstation 8, 3.2 at station 5 and 3.9 at station 4. For these respec-tive stations, maximum seasonal temperature variation was closeto 2.4◦C, 3.2◦C and 3.6◦C.
SUMMARY AND DISCUSSION
Based on the available data analyzed, the hydrodynamics of thestudy region was clearly separated in two different systems, theBTS itself and the connected inner shelf. Different seasonal scena-rios regarding water properties and circulation patterns were alsoobserved. Inside the BTS, the circulation was mostly tide driventhroughout the year, but water properties did change noticeablybetween summer and winter.
During the summer (dry season), the water inside the bay wasconsiderably warmer than the oceanic waters in the adjacent con-tinental shelf, and horizontal temperature variations between thetwo regions could be as large as 3◦C. The surface temperaturecould be as high as 30◦C at the northernmost part of the BTS.Horizontal salinity variations in the dry season were not pronoun-ced and surface waters below 36 were only found at the mouthof Rio Paraguacu (mean of 35.6). A still largely sediment-infilledbay, along with small precipitation rates within a semi-arid cat-chment area corresponding to 95% of the total, allows for highwater salinities to be observed in the eastern half of the bay. Thewaters on the inner shelf had surface salinity above 37. Accordingto Emilson (1961), the water mass in the BTS (and along the as-sociated shelf) during the summer could be classified as TropicalWater – TW (temperatures above 20◦C and salinities above 36).
Brazilian Journal of Geophysics, Vol. 25(4), 2007

382 OCEANOGRAPHIC CHARACTERISTICS OF BAIA DE TODOS OS SANTOS, BRAZIL
Table 7 – Mean temperature and salinity and ± 1 standard deviation for the stations where water propertieswere collected during a complete tidal cycle (neap situation) for the summer sampling period. The waterdepths are surface and bottom (local depth is between parenthesis).
SiteTemperature (◦C) Salinity
Surface Bottom Surface Bottom
S1 29.9 ± 0.22 29.6 ± 0.09 (6 m) 36.6 ± 0.04 36.6 ± 0.03 (6 m)S2 29.7 ± 0.29 29.1 ± 0.16 (13 m) 36.8 ± 0.04 36.9 ± 0.06 (13 m)S3 30.0 ± 0.36 29.6 ± 0.04 (26 m) 37.1 ± 0.03 37.2 ± 0.05 (26 m)S4 29.8 ± 0.28 29.4 ± 0.03 (16 m) 35.6 ± 0.22 36.2 ± 0.04 (16 m)S5 29.4 ± 0.27 28.6 ± 0.10 (26 m) 36.6 ± 0.08 36.8 ± 0.01 (26 m)S6 29.2 ± 0.23 28.5 ± 0.03 (22 m) 36.9 ± 0.01 36.8 ± 0.02 (22 m)S7 29.2 ± 0.26 28.8 ± 0.09 (31 m) 36.7 ± 0.01 36.7 ± 0.01 (31 m)S8 28.4 ± 0.32 28.1 ± 0.07 (38 m) 37.0 ± 0.07 37.0 ± 0.03 (38 m)S9 27.7 ± 0.14 27.2 ± 0.25 (28 m) 37.0 ± 0.04 37.2 ± 0.01 (28 m)
S10 27.8 ± 0.20 27.3 ± 0.21 (18 m) 37.1 ± 0.03 37.2 ± 0.02 (18 m)S11 28.0 ± 0.35 27.0 ± 0.19 (28 m) 37.2 ± 0.06 37.2 ± 0.03 (28 m)S12 27.9 ± 0.27 26.2 ± 0.14 (34 m) 37.2 ± 0.01 37.2 ± 0.01 (34 m)
Table 8 – As in Table 7, but during a spring tidal cycle.
SiteTemperature (◦C) Salinity
Surface Bottom Surface Bottom
S1 29.9 ± 0.44 29.6 ± 0.21 (6 m) 36.4 ± 0.03 36.4 ± 0.03 (6 m)S2 29.4 ± 0.24 28.8 ± 0.07 (14 m) 36.8 ± 0.09 36.8 ± 0.08 (14 m)S3 29.3 ± 0.23 29.1 ± 0.09 (30 m) 37.0 ± 0.01 37.0 ± 0.03 (30 m)S4 29.7 ± 0.26 29.2 ± 0.24 (18 m) 35.6 ± 0.21 36.2 ± 0.16 (18 m)S5 29.1 ± 0.31 28.5 ± 0.14 (29 m) 36.4 ± 0.13 36.7 ± 0.06 (29 m)S6 28.9 ± 0.22 28.3 ± 0.07 (23 m) 36.8 ± 0.04 36.8 ± 0.01 (23 m)S7 28.9 ± 0.26 28.7 ± 0.04 (30 m) 36.6 ± 0.03 36.6 ± 0.03 (30 m)S8 28.0 ± 0.42 27.7 ± 0.09 (38 m) 36.9 ± 0.09 37.0 ± 0.06 (38 m)S9 26.9 ± 0.26 26.2 ± 0.33 (25 m) 37.1 ± 0.07 37.2 ± 0.03 (25 m)
S10 27.1 ± 0.21 26.5 ± 0.31 (19 m) 37.1 ± 0.05 37.2 ± 0.05 (19 m)S11 27.0 ± 0.32 25.9 ± 0.06 (29 m) 37.2 ± 0.02 37.3 ± 0.01 (29 m)S12 27.3 ± 0.26 26.0 ± 0.24 (31 m) 37.2 ± 0.02 37.2 ± 0.02 (31 m)
During winter (wet season), the horizontal temperature varia-tion between the ocean and the bay was reduced to less than 1◦C(surface mean temperatures varying from 26.5◦C to 27.1◦C). Onthe other hand, the horizontal salinity difference increased, withvalues as large as 4. For the northernmost part of the BTS, thesurface mean salinity could be as low as 32.3, while values above36 were found at the inner shelf. This less salty and relatively coldwaters found inside the BTS gave rise to a so called coastal watermass (CW), that inhibited the penetration of TW into the bay. ThisCW was observed in the inner shelf (stations 9, 10, 11 and 12)
with thickness varying from 5 to 10 m.The seasonal formation of CW appears to be entirely rela-
ted to the discharge of the smallest catchments areas around thebay (as well as direct precipitation), since the discharge from RioParaguacu reaches its lowest value between May and July. Theaverage monthly discharges from Rio Paraguacu in January andMay 1999 were 9.9 m3 s-1 and 11.3 m3 s-1, respectively. Extremedischarges from Rio Paraguacu are, however, likely to affect thesalinity structure as far as station 4. Genz et al. (2006) monitored asimulated 8-day flood event with water being released by Pedra do
Revista Brasileira de Geofısica, Vol. 25(4), 2007

MAURO CIRANO and GUILHERME CAMARGO LESSA 383
Table 9 – As in Table 7, but during the winter sampling period.
SiteTemperature (◦C) Salinity
Surface Bottom Surface BottomW1 26.8 ± 0.21 26.7 ± 0.08 (7 m) 32.7 ± 0.22 33.0 ± 0.16 (7 m)W2 26.7 ± 0.18 26.6 ± 0.04 (11 m) 33.7 ± 0.15 34.5 ± 0.26 (11 m)W3 27.1 ± 0.24 26.9 ± 0.06 (30 m) 33.4 ± 0.22 34.1 ± 0.12 (30 m)W4 26.7 ± 0.12 26.6 ± 0.04 (13 m) 32.7 ± 0.20 34.2 ± 0.07 (13 m)W5 26.6 ± 0.14 26.5 ± 0.00 (29 m) 33.7 ± 0.12 34.9 ± 0.03 (29 m)W6 26.7 ± 0.10 26.6 ± 0.00 (23 m) 34.3 ± 0.02 34.9 ± 0.03 (23 m)W7 26.6 ± 0.14 26.5 ± 0.01 (26 m) 33.2 ± 0.48 34.6 ± 0.04 (26 m)W8 26.4 ± 0.14 26.5 ± 0.02 (34 m) 35.0 ± 0.15 35.3 ± 0.07 (34 m)W9 26.6 ± 0.15 26.5 ± 0.02 (30 m) 35.8 ± 0.08 36.6 ± 0.02 (30 m)
W10 26.5 ± 0.11 26.5 ± 0.01 (19 m) 35.7 ± 0.15 36.2 ± 0.46 (19 m)W11 26.6 ± 0.17 26.5 ± 0.03 (30 m) 35.7 ± 0.10 36.7 ± 0.04 (30 m)W12 26.5 ± 0.18 26.6 ± 0.08 (33 m) 35.8 ± 0.13 36.8 ± 0.10 (33 m)
Table 10 – As in Table 8, but during the winter sampling period.
SiteTemperature (◦C) Salinity
Surface Bottom Surface BottomW1 27.0 ± 0.35 26.6 ± 0.06 (7 m) 32.3 ± 0.36 33.5 ± 0.30 (7 m)W2 26.7 ± 0.12 26.6 ± 0.04 (12 m) 33.7 ± 0.28 34.4 ± 0.31 (12 m)W3 26.9 ± 0.23 26.8 ± 0.06 (30 m) 32.4 ± 0.54 34.2 ± 0.11 (30 m)W4 27.1 ± 0.32 26.7 ± 0.10 (12 m) 33.1 ± 0.21 33.9 ± 0.23 (12 m)W5 26.7 ± 0.20 26.6 ± 0.01 (29 m) 33.3 ± 0.52 34.7 ± 0.16 (29 m)W6 26.6 ± 0.12 26.5 ± 0.02 (24 m) 34.2 ± 0.08 34.8 ± 0.09 (24 m)W7 26.7 ± 0.12 26.6 ± 0.07 (12 m) 34.2 ± 0.11 34.3 ± 0.07 (12 m)W8 26.5 ± 0.12 26.5 ± 0.05 (37 m) 35.1 ± 0.34 35.7 ± 0.30 (37 m)W9 26.8 ± 0.27 26.8 ± 0.07 (40 m) 36.3 ± 0.14 37.0 ± 0.06 (40 m)
W10 26.7 ± 0.13 26.6 ± 0.05 (18 m) 36.1 ± 0.22 36.6 ± 0.08 (18 m)W11 26.7 ± 0.28 26.8 ± 0.03 (29 m) 36.4 ± 0.14 36.9 ± 0.01 (29 m)W12 26.7 ± 0.25 27.0 ± 0.04 (39 m) 36.5 ± 0.15 37.1 ± 0.03 (39 m)
Cavalo dam, with a maximum discharge of 1534 m3 s-1 (15 timesthe pre-dam average discharge). The maximum discharge coinci-ded with high water spring (3.3 m tide range in Baıa de Iguape) andcaused a surge of 0.5 m close to the river mouth inside the Baıade Iguape. This surge was imperceptible at the gauging station inSao Roque (see location in Figure 1). The salinity field, however,was influenced along the whole extent of Canal do Paraguacu. Awell-mixed water column (vertical salinity variation of 0.3), withsurface value of 32.4 at the end of the channel, became partiallymixed (vertical variations of 5.2), with surface salinity of 27.2. Inscenarios like this, the Baıa de Iguape and secondarily the Canaldo Paraguacu, act as a buffer region against the Rio Paraguacufloods. Short-lived river floods are almost completely damped
inside the bay. Surface salinity gradients, reaching up to 8 psukm-1 during a flood event, were found inside the Baıa de Iguape(Genz et al., 2006).
An estimate of the flushing time for the innermost stationwhere CTD profiles were performed (stations 1 and 4 in Fig. 2)was done analytically based on the conservation of salt and vo-lume (Miranda et al., 2002) and according to the equation
T f = [(S0 − S)/S0](V/Q f ).
S0 and S represent salinity at the oceanic and innermost sta-tions, respectively. V is the volume of the bay associatedwith the flushing process, which is equal to 1.1 × 10¹⁰ m3
and Q f is the freshwater discharge. Typical values for S0,
Brazilian Journal of Geophysics, Vol. 25(4), 2007
384 OCEANOGRAPHIC CHARACTERISTICS OF BAIA DE TODOS OS SANTOS, BRAZIL
Figure 13 – Schematic representation of vertical profiles for the mean (thick line) temperature and salinity during summerand winter at Rio Paraguacu mouth (station 4), in the center of the BTS (station 5) and at the entrance of the bay (station8) for a complete tidal cycle (13 hours). The gray areas represent ± 1 standard deviation from the mean value.
S and Q f for January (May) 1999 are 37.2 (36.2), 35.6(32.5) and 89.0 (345.5) m3 s-1, respectively. These para-meters indicate that due to the small freshwater inflow, theflushing time in summer (∼62 days) is about 1.7 timeslonger than that in winter (∼38 days).
When compared to other relevant coastal bays in Brazil, theBTS is likely to be the one with the longest flushing time, given itshigh ratio between volume and freshwater discharge (0.32 × 10⁸
s < V/Q f < 1.2 × 10⁸ s for the central area of the bay). Forexample, Baıa de Guanabara, according to Kjerfve et al. (1997),has a V/Q f ratio twice as small, varying from 0.12 × 10⁸ s to0.67 × 108 s in the dry and wet season, respectively. A V/Q fratio of 0.12 × 10⁸ s was also estimated for Baıa de Paranagua,considering a year average freshwater input of about 200 m3 s-1
(Lessa et al., 1998; Mantovanelli et al., 2004). Due to the largeflushing times it is recommended that proper management poli-cies regarding the disposal of urban and industrial waste into theBTS must be adopted.
The total freshwater inflow into the BTS was reduced after theconstruction of Pedra do Cavalo dam (mean annual dischargedropped from 199 m3 s-1 to 162 m3 s-1). This reduction, howe-ver, is not entirely related to the effects of the dam, since the inflowwas also diminished during the winter when Rio Paraguacu wouldnormally account for less than 30% of the total freshwater input.Longer trends (20-30 year cycles) in precipitation and river dis-
charges, as pointed out by Pekarova et al. (2003) are more likelyto be the reason for the observed reduction of the fresh water in-flow into the BTS after 1985.
While the circulation did not vary significantly between sea-sons inside the bay, a clearly seasonal pattern was observed atthe associated inner shelf. During the summer, the easterly windsdrove sub-inertial currents parallel to the coastline and towardssouthwest mostly, except for the station in front of Canal de Ita-parica. The near bottom onshore flow (stations with two currentmeters) associated with the presence of relatively cold waters atthe bottom (when compared to the values found during the win-ter) is an indication of an upwelling process. In the winter, thearrival of cold fronts and the associated reversal of the wind di-rection generated events of northeast currents which, dependingon the wind persistence, would dominate the residual circulation.A similar pattern of seasonal circulation was observed by Lessa& Cirano (2006) at the southern coast of Bahia and by Amorim(2005) at about 100 km south of the BTS.
The seasonal variations imposed by the changes in the me-teorological forcing also affect the sub-inertial oscillations in theBTS and at its vicinity. During summer the BTS is less affectedby the easterlies and the oscillations in the most inland portion ofthe bay can be decoupled from those observed at the inner shelf.This could also be caused by the distinct wind patterns (in andoutside the BTS) that can occur during this season. On the other
Revista Brasileira de Geofısica, Vol. 25(4), 2007

MAURO CIRANO and GUILHERME CAMARGO LESSA 385
hand, during winter the more frequent arrival of cold fronts andthe longer fetch created in the presence of southerly winds giverise to a strong coupling between the sub-inertial oscillations forthe waters inside the BTS and those at the inner shelf.
Due to the orientation of the residual current vectors inside thebay, one would feel tempted to suggest that an anticlockwise cir-culation is normally established inside the BTS where water mo-ves northward towards station 15 and returns via Canal de Itapa-rica. However, the spatial density of the current meters deployedinside the bay is far too small, and it is very likely that the resi-dual vectors indicate segments of eddies of much smaller scale.These eddies are normally generated by the interaction of the flowwith complex bathymetry and the coastal contours of a water body.Kjerfve et al. (1992) understand that residual circulation gyresarise due to lateral circulation, which in turn are a manifestationof the variability of the current magnitude and direction over shortdistances. This lateral variability is explained by the presence ofprevailing ebb and flood channels within the same cross-section,as demonstrated by Kjerfve & Proehl (1979). Some current me-ters inside the bay might have been deployed in predominantlyflood or ebb channels, either enhancing the expected tidal currentasymmetry (station 8) or reversing it (station 21). Therefore, thedegree of ebb or flood dominance among the stations is highly de-pendable on their location. For instance, strong ebb dominance atstation 8 is apparently counterbalanced by flood dominance at thewestern side of Canal de Salvador, where a small flood-tidal deltain front of Mar Grande (see Figure 2 for location) is clearly map-ped in the depth charts. The overall stronger ebb-tidal currentsare in agreement with the pattern of asymmetry of the tidal wave.Ebb-directed bed-load net sediment transport is thus expected inmost areas of the bay, especially those close to large intertidalareas. This direction of net-sediment transport is corroborated bythe presence of extensive ebb-tidal deltas in front of Canal de Sal-vador (Banco de Santo Antonio) and Canal de Itaparica. Also, anebb-tidal delta internal to the bay, in front of Canal do Paraguacu,is also an indication of bed-load flushing.
Given the vast amount of data available, the main goal of thispaper was to provide a general characterization of oceanographicaspects of the BTS and adjacent areas and identify how these as-pects vary during the dry (summer) and the wet (winter) season.Although the circulation driving forces have been described here,several questions remain and need to be elucidated before a satis-factory understanding of the different spatial and temporal scalesinvolved in the physical oceanography of the bay can be achieved.The authors are aware that in this study the region was reasonablywell covered in space, but not in time. The temporal coverage (15
days for each season) is far too short for a good description of theseasonality. The results already obtained in this work will be usedto plan a more comprehensive observational programs focusingon the study of mass and volume transports for the most impor-tant pathways within the bay, as well as the seasonal variation ofthe water properties within the BTS and its interaction with thecoastal zone. A 3D circulation numerical model is already beingimplemented to help addressing these questions.
ACKNOWLEDGEMENTS
This work was supported by the projects MARBOBA – CTPE-TRO/CNPq (grant number 502356/2003-0) and SACODE – CT-PETRO/CNPq (grant number 550469/2005-2). Further supportwas also provided by a Brazilian scientific network called REDE05/01 – PETRORISCO, funded by CTPETRO/FINEP/CNPq. Gui-lherme C. Lessa was supported by a CNPq research grant. Weare thankful to the Environmental Department of the State Govern-ment of Bahia (Centro de Recursos Ambientais) for providing allthe data sets related to Projeto Bahia Azul. We also thank the twoanonymous referees for their thoughtful comments and the tech-nician Rafael Cabral Carvalho for helping with some figures.
REFERENCES
AMORIM FN. 2005. Caracterizacao oceanografica da Baıa de Camamue adjacencias e mapeamento das areas de sensibilidade a derrames deoleo. M.Sc. Thesis, Curso de Pos-Graduacao em Geologia da Universi-dade Federal da Bahia. 163 pp.
ANGULO RJ, LESSA GC & SOUZA MC. 2006. A critical review of mid- toLate-Holocene sea-level fluctuations on the eastern Brazilian coastline.Quaternary Sci. Rev., 25(5-6): 486–506.
ANP. Agencia Nacional do Petroleo, Gas Natural e Biocombustıveis.2007. Available at: < http:// www.brazil-rounds.gov.br/ geral/ mapas/JEQ CAL.pdf>. Access on: November 10, 2007.
ANTAQ. Agencia Nacional de Transportes Aquaviarios. 2005. AnuarioEstatıstico Portuario – 2005. Available at: < http:// www.antaq.gov.br/NovositeAntaq/ estatisticasanuario.asp>. Access on: November 9,2007.
BITTENCOURT ACDP, DOMINGUEZ JML & USSAMI N. 1999. Flexureas a tectonic control on the large scale geomorphic characteristics of theeastern Brazil coastal zone. J. Coast. Res., 15(2): 505–519.
CASTRO BM & MIRANDA LB. 1998. Physical oceanography of the wes-tern Atlantic continental shelf located between 4◦N and 34◦S. In: ROBIN-SON AR & BRINK KH (Ed.). The Sea, John Wiley & Sons, Inc., New York,11: 209–251.
Brazilian Journal of Geophysics, Vol. 25(4), 2007

386 OCEANOGRAPHIC CHARACTERISTICS OF BAIA DE TODOS OS SANTOS, BRAZIL
CEPLAB. 1979. Bacias Hidrograficas do Estado da Bahia. Centro de Pla-nejamento da Bahia, Series Recursos Naturais, Salvador, Bahia, 215 pp.
CHAVES RR. 1999. Variabilidade da precipitacao na regiao Sul do Nor-deste e sua associacao com padroes atmosfericos. M.Sc. Thesis, Insti-tuto Nacional de Pesquisas Espaciais. 159 pp.
CRA. Centro de Recursos Ambientais. 2000. Saneamento ambiental daBaıa de Todos os Santos. Modelamento e avaliacao ambiental. Desen-volvimento de modelos computacionais de circulacao hidrodinamica, detransporte de contaminantes e de qualidade de agua da BTS, e elaboracaodo seu diagnostico. Relatorio dos estudos basicos. Technical Report RT-257-03-GR-002-RF, 248 pp., Centro de Recursos Ambientais, Salvador,Bahia, Brazil.
CRA. Centro de Recursos Ambientais. 2001. Saneamento ambiental daBaıa de Todos os Santos. Modelamento e avaliacao ambiental. Desen-volvimento de modelos computacionais de circulacao hidrodinamica, detransporte de contaminantes e de qualidade da agua da BTS. Prognosticodos efeitos do Programa Bahia Azul com relacao a balneabilidade daspraias. Technical Report RT-257-05-MA-003-RF, 262 pp., Centro de Re-cursos Ambientais, Salvador, Bahia, Brazil.
CUPERTINO JA & BUENO GV. 2005. Arquitetura das sequencias estra-tigraficas desenvolvidas na fase de lago profundo no Rifte do Reconcavo.Bol. Geoc. Petrobras, 13(2): 245–267.
DIAS K. 2004. Reavaliacao da distribuicao espacial das facies texturaisdo leito da Baıa de Todos os Santos, Undergraduate Thesis, Curso deGraduacao em Geologia da Universidade Federal da Bahia. 50 pp.
EMILSON I. 1961. The shelf and coastal waters off Southern Brazil, Bolm.Inst. Oceanogr., Sao Paulo, 17: 101–112.
FRANCO AS. 1988. Tides: Fundamentals, Analysis and Prediction, SaoPaulo, Fundacao Centro Tecnologico de Hidraulica, 249 pp.
GENZ F. 2006. Avaliacao dos efeitos da Barragem de Pedra do Cavalosobre a circulacao estuarina do Rio Paraguacu e Baıa de Iguape. Tese deDoutoramento, Programa de Pos-Graduacao em Geologia, UniversidadeFederal da Bahia, 266 p.
GENZ F, LESSA GC & CIRANO M. 2006. The Impact of an Extreme Floodupon the Mixing Zone of the Todos os Santos Bay, Northeastern Brazil.J. Coast. Res., 39: 707–712.
IBGE. Instituto Brasileiro de Geografia e Estatıstica. 2006. Estima-tivas Populacionais para os municıpios brasileiros em 01/07/2006.Available at: < http:// www.ibge.gov.br/ home/ estatistica/ populacao/estimativa2006/default.shtm >. Access on: November 9, 2007.
INMET. Instituto Nacional de Meteorologia. 1992. Normais Clima-tologicas – 1961 a 1990. Ministerio da Agricultura, Pecuaria e Abas-tecimento. 155 pp.
KING LC. 1956. Geomorfologia da Regiao Oriental do Brasil. Rev. Bras.Geogr., 2: 37–72.
KJERFVE B & PROEHL JA. 1979. Velocity variability in a cross-sectionof a well-mixed estuary, J. Mar. Res., 37(3): 409–418.
KJERFVE B, SEIM HE, BLUMBERG AF & WRIGHT LD. 1992. Model-ling of the Residual Circulation in Broken Bay and the lower HawkesburyRiver, NSW, Aust. J. Mar. Freshw. Res., 43: 1339–1357.
KJERFVE B, RIBEIRO CHA, DIAS GTM, FILIPPO AM & QUARESMA VS.1997. Oceanographic characteristics of an impacted coastal bay: Baıa deGuanabara, Rio de Janeiro, Brazil. Cont. Shelf Res., 17(13): 1609–1643.
LESSA GC. 2000. Morphodynamic controls on tides and tidal currentsin two macrotidal shallow estuaries, NE Australia. J. Coast. Res., 16(4):976–989.
LESSA GC, MEYERS S & MARONE E. 1998. Holocene Stratigraphy inthe Paranagua Bay estuary, southern Brazil, J. Sediment. Res., 68(6):1060–1076.
LESSA GC, BITTENCOURT ACSP, BRICHTA A & DOMINGUEZ JML.2000. A reevaluation of the late quaternary sedimentation in Todos osSantos Bay (BA), Brazil. An. Acad. Bras. Cienc., 72(4): 573–590.
LESSA GC, DOMINGUEZ JML, BITTENCOURT ACSP & BRICHTA A.2001. The tides and tidal circulation of Todos os Santos Bay, north-east Brazil: a general characterization. An. Acad. Bras. Cienc., 73(2):245–261.
LESSA GC & CIRANO M. 2006. On the Circulation of a Coastal Chan-nel within the Abrolhos Coral-Reef System -Southern Bahia (17◦40’S),Brazil, J. Coast. Res., 39: 450–453.
LIMA GMP & LESSA GC. 2002. The freshwater discharge in Todos osSantos Bay and its significance to the general water circulation. RevistaPesquisas. Porto Alegre (RS), 28: 85–98.
MANTOVANELLI A, MARONE E, DA SILVA ET, LAUTERT LF, KLINGEN-FUSS MS, PRATA VP, NOERNBERG MA, KNOPPERS BA & ANGULO RJ.2004. Combined tidal velocity and duration asymmetries as a determi-nant of water transport and residual flow in Paranagua Bay estuary. Estuar.Coast. Shelf Sci., 59(4): 523–537.
MARTIN L, BITTENCOURT ACSP, FLEXOR JM, SUGUIO K & DOMIN-GUEZ JML. 1986. Neotectonic movements on a passive continental mar-gin: Salvador region, Brazil. Neotectonics, 1: 87–103.
MIRANDA LB, CASTRO BM & KJERFVE B. 2002. Princıpios de Oce-anografia Fısica de Estuarios, Editora da Universidade de Sao Paulo,Sao Paulo, 414 pp.
MONTENEGRO AM, FONSECA CA & CAMPOS EJD. 1999. Implemen-tacao do modelo oceanico da Universidade de Princeton para o estudoda circulacao e dispersao de materiais na Baıa de Todos os Santos, PUC,Ci. Biol. e do Meio Amb., 2: 10–18.
PEKAROVA P, MIKLANEK P & PEKAR J. 2003. Spatial and temporalrunoff oscillation analysis of the main rivers of the world during the19th-20th centuries. J. Hydrol., 274(1-4): 62–79.
Revista Brasileira de Geofısica, Vol. 25(4), 2007

MAURO CIRANO and GUILHERME CAMARGO LESSA 387
POND S & PICKARD GL. 1983. Introductory Dynamical Oceanography.2nd ed. Butterworth-Heinemann. 329 pp.
SERVAIN J, STRICHERZ JN & LEGLER DM. 1996. TOGA pseudo-stressatlas 1985-1994, volume 1: Tropical Atlantic. Centre ORSTOM, Plou-zane, France, 158 pp.
SRH. Superintendencia de Recursos Hıdricos. 1996. Plano Diretor deRecursos Hıdricos – Bacia do Medio e Baixo Paraguacu, Salvador, Bahia.195 pp.
THORNTHWAITE CW. 1948. An approach toward a rational classificationof climate. Geogr. Rev., 38(1): 55–94.
TRENBERTH KE, OLSON JC & LARGE WG. 1989. A Global OceanWind Stress Climatology Based on ECMWF Analyses. Technical ReportNCAR/TN-338+STR, National Center for Atmospheric Research, Boulder,Colorado, 98 pp.
TRICART J & DA SILVA TC. 1968. Estudos de Geomorfologia da Bahia eSergipe, Fund. Desenv. da Ciencia na Bahia, Salvador, 167 pp.
WOLGEMUTH KM, BURNETT WC & MOURA PL. 1981. Oceanographyand suspended material in Todos os Santos Bay, Rev. Bras. Geoc., 11:172–178.
NOTES ABOUT THE AUTHORS
Mauro Cirano is an oceanographer (FURG/1991) with a Msc in Physical Oceanography from Instituto Oceanografico da Universidade de Sao Paulo (IOUSP/1995)and a PhD in the same area from the University of New South Wales (UNSW), Sydney, Australia (2000). He has been working as an Associate Professor since 2004at the Universidade Federal da Bahia (UFBA). His research interest is the oceanic circulation, based on data analysis and numerical modeling, area where he hasconducting many research projects for the last 15 years, focused on the meso and large-scale aspects.
Guilherme Camargo Lessa has a Geography degree from the Universidade Federal de Minas Gerais (1985) and a Masters in Geography from the UniversidadeFederal do Rio de Janeiro (1990). He obtained his PhD in Marine Sciences at the University of Sydney (Australia) in 1994. He has worked as a Post-Doc at theUniversidade Federal do Parana and Universidade Federal da Bahia, which he joined as an Associate Professor in 1997. His research interests cover marine sedimento-logy, coastal and estuarine circulation and coastal (barrier-estuarine) geological evolution.
Brazilian Journal of Geophysics, Vol. 25(4), 2007