Mauro Campos, Ester Sakae and Rossen Hazarbassanov Federal University of São Paulo Brazil
14
Mauro Campos, Ester Sakae and Rossen Hazarbassanov Federal University of São Paulo Brazil
-
Upload
adam-williamson -
Category
Documents
-
view
28 -
download
0
description
Effects of Epithelium and Corneal Density in Vision and Ocular Biomechanical Properties : Imaging Analysis. Mauro Campos, Ester Sakae and Rossen Hazarbassanov Federal University of São Paulo Brazil. - PowerPoint PPT Presentation
Transcript of Mauro Campos, Ester Sakae and Rossen Hazarbassanov Federal University of São Paulo Brazil

Mauro Campos, Ester Sakae and Rossen Hazarbassanov
Federal University of São PauloBrazil

None of the authors have any financial interest in the methods and products included here.

BackgroundBiomechanic properties of the cornea have been
studied with increasing interest in the present time (1)
Corneal hysteresis (CH) is a function of the corneal viscous damping properties. It reflects the capacity of the corneal tissue to absorb and release energy (2)
Corneal pathologies such as Fuchs, keratoconus and Lasik may decrease CH values (3)
Scheimpflug images of the eye allow quantification of structural density (4)

Purpose and Study Design
To correlate biomechanical properties, corneal density and vision in a model of corneal opacity
Prospective consecutive interventional case series

MethodsPatients with recalcitrant corneal opacities after epidemic
keratoconjunctivitis that failed to respond to medical therapy
All eyes underwent phototherapeutic keratectomy with 0.002% mitomycin C to improve corneal transparency and surface irregularities
Pre and postoperative evaluation included visual acuity measurements, slit lamp exam and Goldmann tonometry, corneal biomechanical indexes (CH, corneal resistance factor – CRF, corneal compensated ocular pressure –IOPCC and Goldmann calculated ocular pressure – IOPG as produced by ORA (Reichert Instruments) and Scheimpflug quantification of corneal density and central corneal thickness - CCT (Pentacan, Oculus)
MethodsPreoperative evaluation of a representative patient and details of densitometry
Data from rotational scheimpflug camera was evaluated at 0, 45, 90 and 135 degrees
Linear density was given placing the cursor over a single point
Area density was performed using standardized rectangular area with the size distributed equally on the visual axis

MethodsTrans epithelium PTK set to a mean of 68 microns based on opacities depth followed by 0.002% mitomycin application (details previously published, reference 5)
Preoperative Postoperative
Statistical Methods
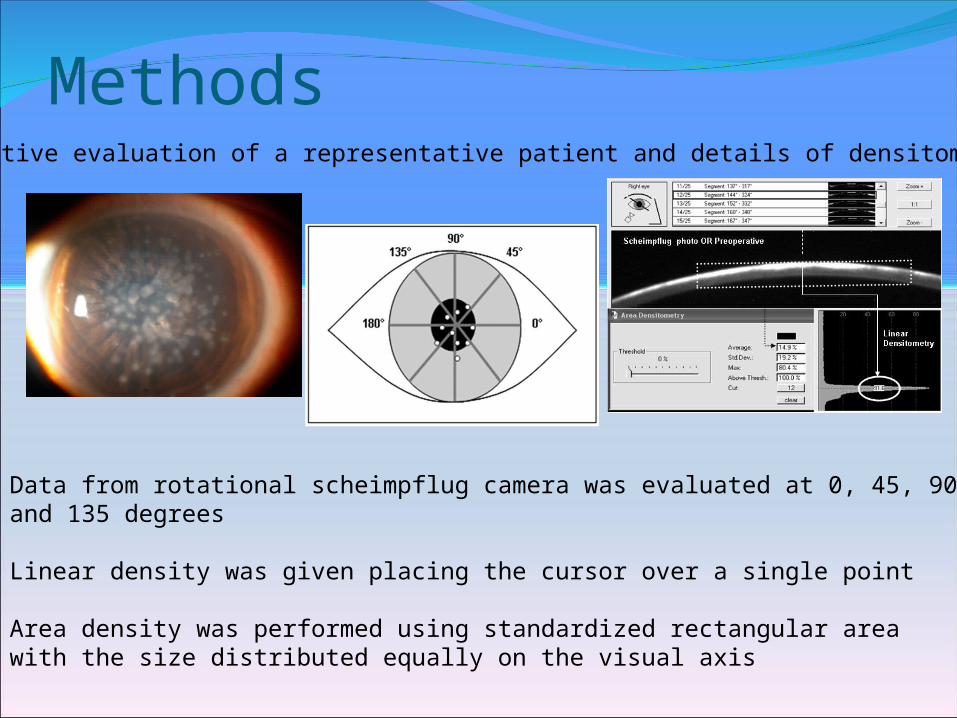
Box plot representation of BSCVA, corneal biomechanical indexes (CH, CRF, IOPG and IOPCC), corneal density and corneal thickness (CCT)
Pearson linear correlation between BSCVA and density, CH and density and CH and CCT.
Student t-test for the comparisions of pre and postoperative values (BSCVA, CH, CRF, IOPG and IOPCC and CCT)
SPSS (SPSS Inc, version 15) software for data analysis
LogMAR units were used for vision analysis

Results Thirty-one eyes from 23 patients included Mean follow-up was 10.2±3.2 months100% followed for 3 months87% followed for 6 months74% followed for 12 months
Results, visual acuity
Mesopic Contrast Sensitivity
0,0
0,2
0,4
0,6
0,8
1,0
1,2
1,4
1,6
1,8
1,5 3 6 12 18
Cycle/degree
Lo
g M
ea
n V
alu
e
Pre-op
Post-op 1M
Post-op 3M
Post-op 6M
For illustration only, six months data, contrast sensitivity included
UCVA
46,7%
81,5%
40,0%
18,5%13,3%
0,0%0%
20%
40%
60%
80%
100%
PREOP PO 6M
Time
Per
cen
tag
e o
f p
atie
nts
y
20/20 - 20/40
20/50 - 20/80
> 20/80
BSCVA
0,0% 0,0%
13,8%20,7%
65,5%
0,0% 0,0%4,2%
16,7%
79,2%
0%
20%
40%
60%
80%
100%
Lost 2 or >lines
Lost 1 line No change Gain 1 line Gain 2 or >lines
Time
Per
cen
tag
e o
f p
atie
nts
PO 3M PO 6M

Preop Last visit Preop Last visit Preop Last visit Preop Last visit
BSCVA logmar 0.35 0.094 0.40 0.100 0 0.0 1 0.4
Densitometry
AREA 9.20 6.57 8.37 6.40 6.7 5 15.2 9.6
LINEAR 67.30 50.94 68.70 44 37.5 22.1 96 95.5
Histeresis mmHg
IOPG 13.08 10.96 12.65 11.8 7.5 3.2 20.2 15.8
IOPCC 15.17 13.89 15.15 14.8 8.3 6 25.3 15.8
CH 9.22 8.7 9.2 8.5 5.1 6.2 14 12.5
CRF 8.69 7.6 8.85 7.4 5.2 3.8 11.7 11.1
CCT μm 491.2 461.4 483 456 408 376 568 555
Table 1: Summary of all variables before and after PTK. .
Mean value Medium Minimum value Maximum value

Results
Linear and area density decreased significantly after treatment
Better correlation between BSCVA and area density after PTK compared with linear density
Results
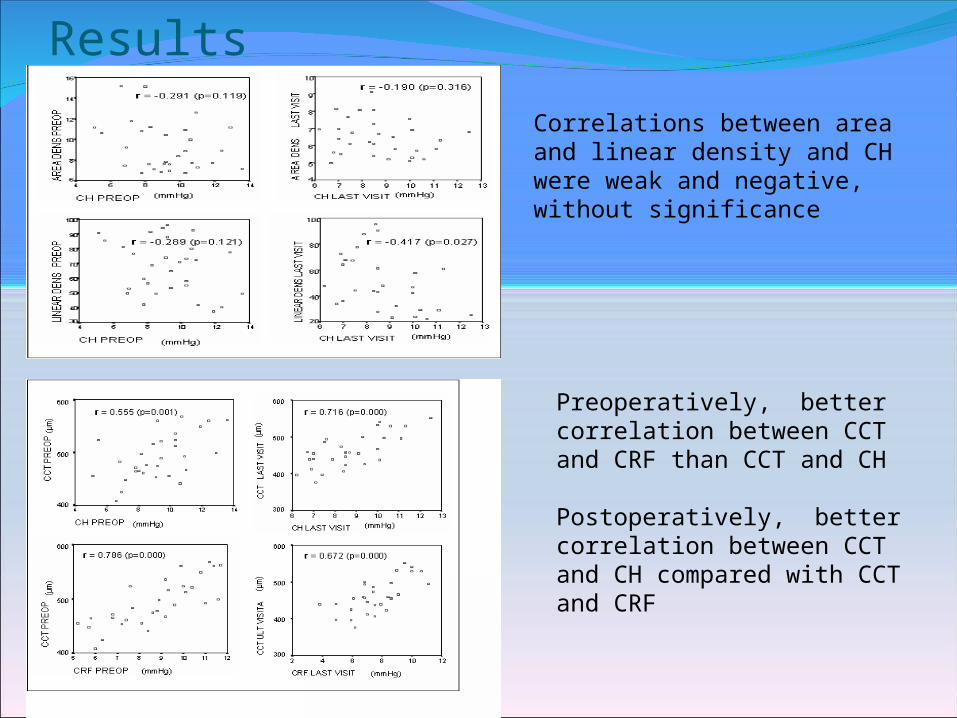
Correlations between area and linear density and CH were weak and negative, without significance
Preoperatively, better correlation between CCT and CRF than CCT and CH
Postoperatively, better correlation between CCT and CH compared with CCT and CRF

Conclusions and selected references
According with the data presented here, as corneal density decreases, BSCVA increases
Increased corneal density decreases correlation among biomechanical indexes and other variables such as CCT
1. Kotecha A et al. IOVS 2006;47(12):5337-472. Liu J et al,. JCRS 2005;31(1):146-553. Luce DA. JCRS 2005:31(1):156-624. Dobbs RE et al. Ophthalmology 1987;94(7):881-905. Sakae, E et al. AJO 2011;151(1):35-43


![Chess Endgame Training [Bernd Rossen, 2003]](https://static.fdocuments.net/doc/165x107/55cf9919550346d0339b8e98/chess-endgame-training-bernd-rossen-2003.jpg)