Matthew R. Reynolds, M.D., M.Sc. On Behalf of the PARTNER Investigators Lifetime Cost Effectiveness...
30
Matthew R. Reynolds, M.D., M.Sc. On Behalf of the PARTNER Investigators Lifetime Cost Effectiveness of Transcatheter Aortic Valve Replacement Compared with Standard Care Among Inoperable Patients with Severe Aortic Stenosis: Results from the PARTNER Trial (Cohort B) Harvard Clinical Research Institute Boston VA Healthcare System Harvard Medical School Boston, MA Health Economics and Technology Assessment Research Group Saint Luke’s Mid America Heart Institute Kansas City, MO
-
date post
20-Dec-2015 -
Category
Documents
-
view
223 -
download
4
Transcript of Matthew R. Reynolds, M.D., M.Sc. On Behalf of the PARTNER Investigators Lifetime Cost Effectiveness...
Matthew R. Reynolds, M.D., M.Sc.On Behalf of the PARTNER Investigators
Lifetime Cost Effectiveness of Transcatheter Aortic Valve Replacement Compared with Standard Care Among Inoperable Patients with Severe Aortic Stenosis: Results from the PARTNER Trial (Cohort B)
Harvard Clinical Research InstituteBoston VA Healthcare System Harvard Medical SchoolBoston, MA
Health Economics and Technology Assessment Research GroupSaint Luke’s Mid America Heart InstituteKansas City, MO

The PARTNER Trial was funded by a research grant from Edwards Lifesciences, Inc.
Disclosures

PARTNER Trial: Cohort B
Symptomatic Severe Aortic StenosisSymptomatic Severe Aortic Stenosis
ASSESSMENT: High-Risk AVR Candidate3,105 Total Patients Screened
ASSESSMENT: High-Risk AVR Candidate3,105 Total Patients Screened
StandardTherapy
(Usually BAV)
StandardTherapy
(Usually BAV)
ASSESSMENT: Transfemoral Access
ASSESSMENT: Transfemoral Access
Not In StudyNot In Study
TAVRTrans-
femoral
TAVRTrans-
femoral
Primary Endpoint: All-Cause Mortality Co-Primary Endpoint: Composite of All-Cause
Mortality and Repeat Hospitalization (Superiority)
Primary Endpoint: All-Cause Mortality Co-Primary Endpoint: Composite of All-Cause
Mortality and Repeat Hospitalization (Superiority)
1:1 Randomization1:1 Randomization
VS
Total = 1,057 patients
2 Parallel Trials: Individually Powered
N = 699 N = 358Cohort A:High RiskCohort A:High Risk
Cohort B:InoperableCohort B:Inoperable
YesYes
TA, transapical; TF, transfemoral; BAV, balloon aortic valvuloplasty.
YesYes NoNo
NoNo
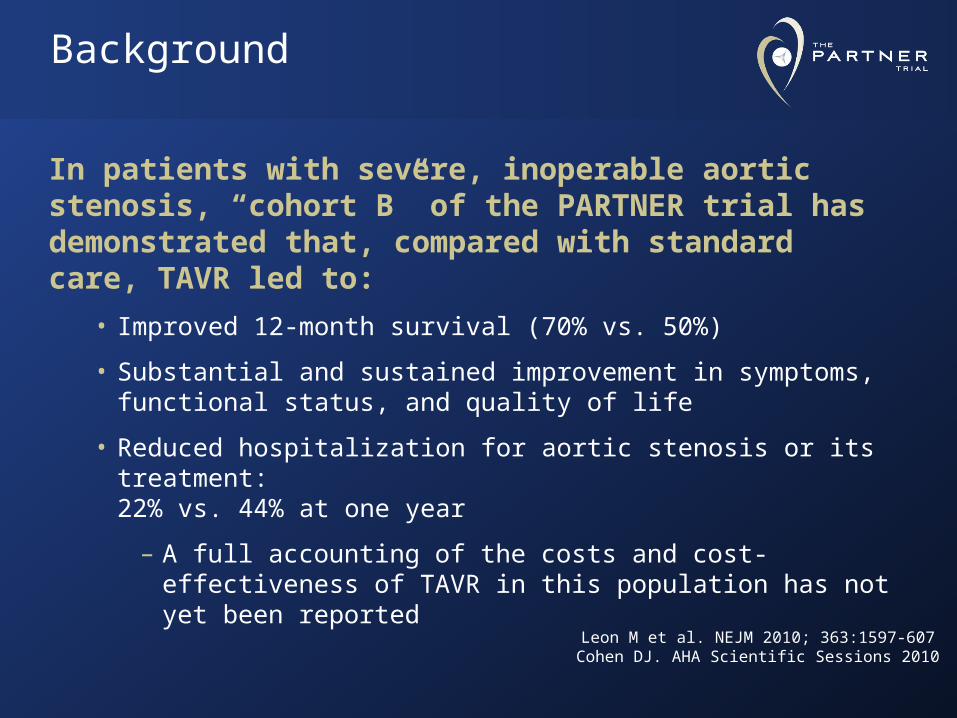
In patients with severe, inoperable aortic stenosis, “cohort B” of the PARTNER trial has demonstrated that, compared with standard care, TAVR led to:
• Improved 12-month survival (70% vs. 50%)
• Substantial and sustained improvement in symptoms, functional status, and quality of life
• Reduced hospitalization for aortic stenosis or its treatment: 22% vs. 44% at one year
– A full accounting of the costs and cost-effectiveness of TAVR in this population has not yet been reported
Background
Leon M et al. NEJM 2010; 363:1597-607Cohen DJ. AHA Scientific Sessions 2010
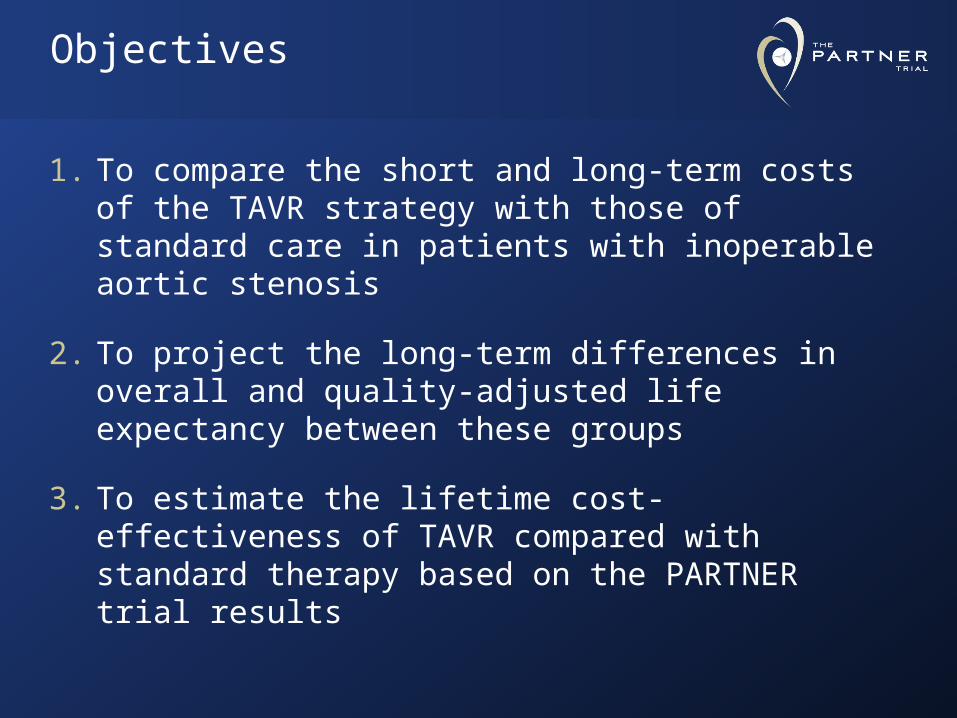
1. To compare the short and long-term costs of the TAVR strategy with those of standard care in patients with inoperable aortic stenosis
2. To project the long-term differences in overall and quality-adjusted life expectancy between these groups
3. To estimate the lifetime cost-effectiveness of TAVR compared with standard therapy based on the PARTNER trial results
Objectives
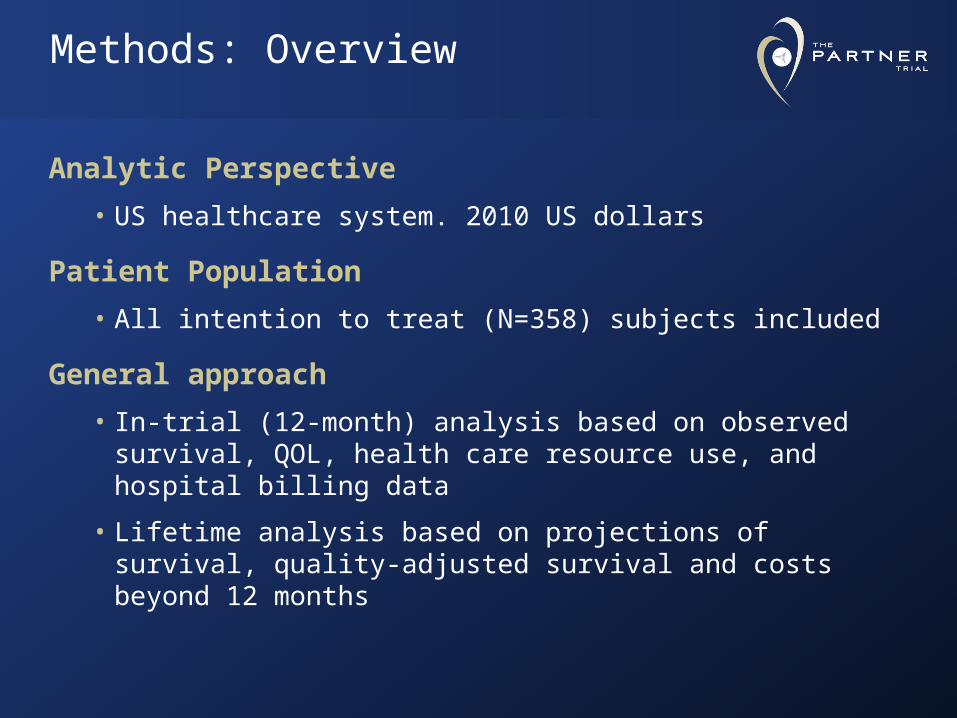
Analytic Perspective
• US healthcare system. 2010 US dollars
Patient Population
• All intention to treat (N=358) subjects included
General approach
• In-trial (12-month) analysis based on observed survival, QOL, health care resource use, and hospital billing data
• Lifetime analysis based on projections of survival, quality-adjusted survival and costs beyond 12 months
Methods: Overview
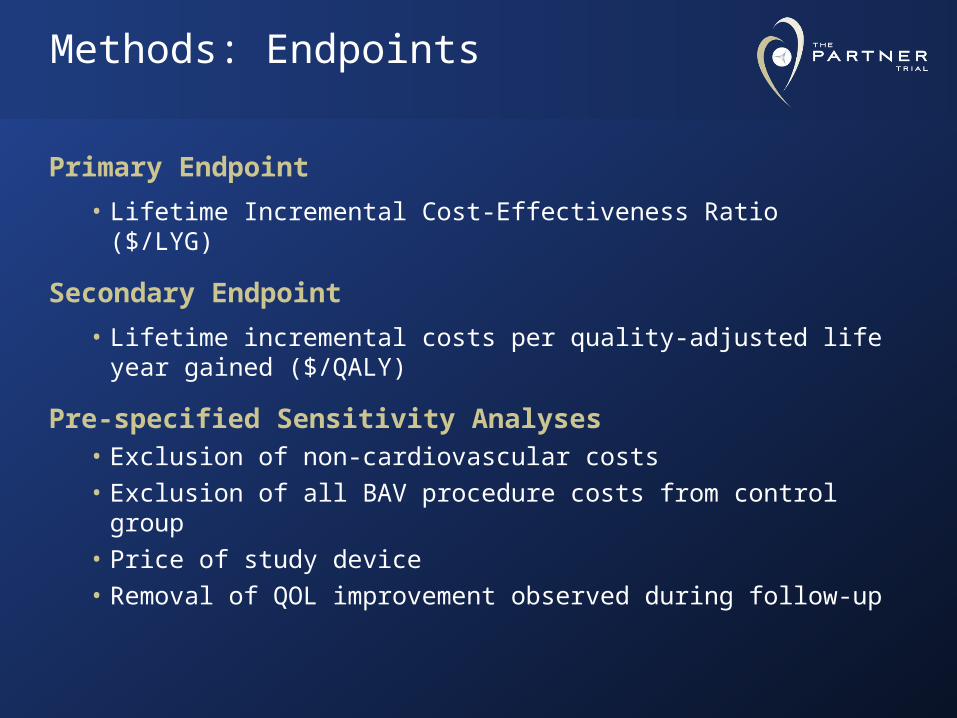
Primary Endpoint
• Lifetime Incremental Cost-Effectiveness Ratio ($/LYG)
Secondary Endpoint
• Lifetime incremental costs per quality-adjusted life year gained ($/QALY)
Pre-specified Sensitivity Analyses• Exclusion of non-cardiovascular costs
• Exclusion of all BAV procedure costs from control group
• Price of study device
• Removal of QOL improvement observed during follow-up
Methods: Endpoints
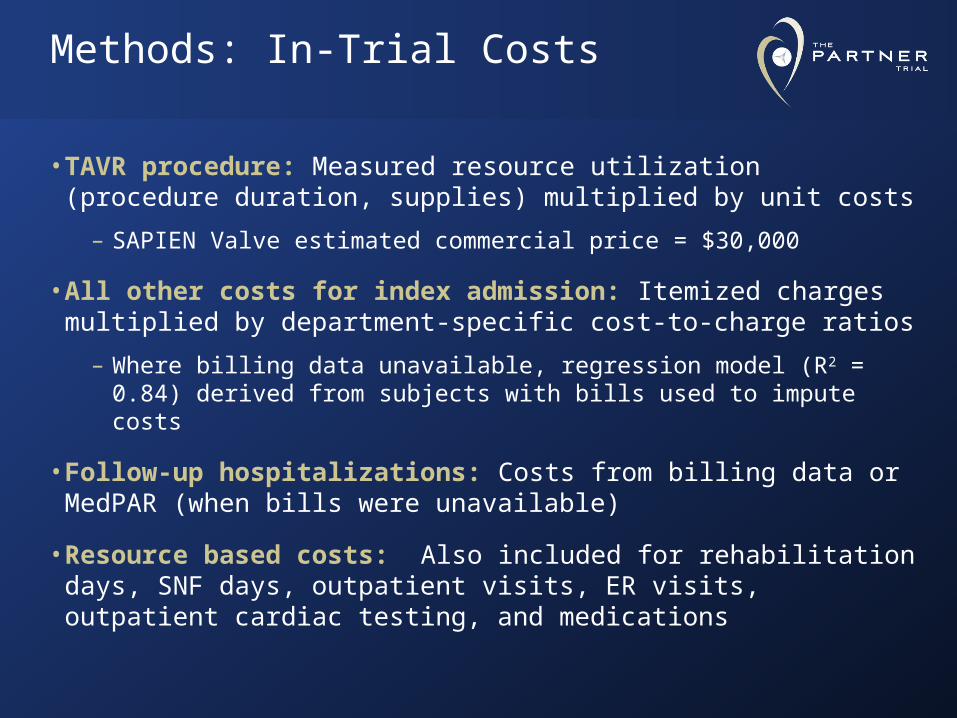
• TAVR procedure: Measured resource utilization (procedure duration, supplies) multiplied by unit costs
– SAPIEN Valve estimated commercial price = $30,000
• All other costs for index admission: Itemized charges multiplied by department-specific cost-to-charge ratios
– Where billing data unavailable, regression model (R2 = 0.84) derived from subjects with bills used to impute costs
• Follow-up hospitalizations: Costs from billing data or MedPAR (when bills were unavailable)
• Resource based costs: Also included for rehabilitation days, SNF days, outpatient visits, ER visits, outpatient cardiac testing, and medications
Methods: In-Trial Costs

• Parametric survival models fit to trial data used to extrapolate patient-level life expectancy beyond the observed follow-up period
• EQ-5D utilities measured at baseline, 1, 6 and 12 months and used to convert life-years to QALYs
• Calculated costs from the last 6 months for surviving patients used to project future costs beyond 12 months
• All future costs, life years, and QALYs discounted at 3% consistent with current guidelines
Methods: Lifetime Analysis
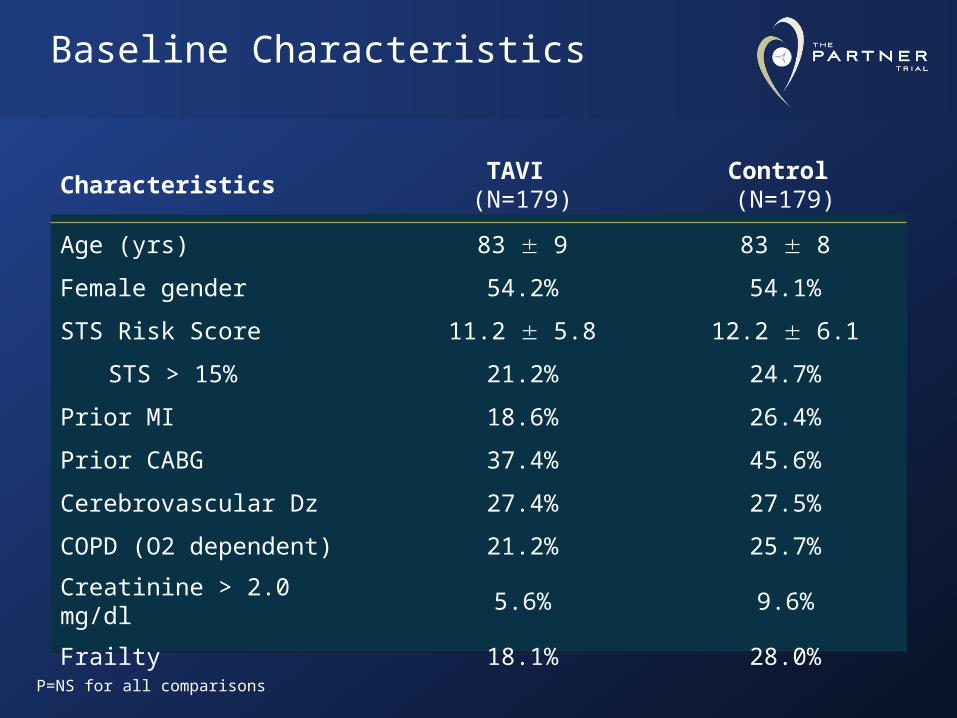
Baseline Characteristics
Characteristics TAVI
(N=179)Control (N=179)
Age (yrs) 83 9 83 8
Female gender 54.2% 54.1%
STS Risk Score 11.2 5.8 12.2 6.1
STS > 15% 21.2% 24.7%
Prior MI 18.6% 26.4%
Prior CABG 37.4% 45.6%
Cerebrovascular Dz 27.4% 27.5%
COPD (O2 dependent) 21.2% 25.7%
Creatinine > 2.0 mg/dl 5.6% 9.6%
Frailty 18.1% 28.0%
P=NS for all comparisons
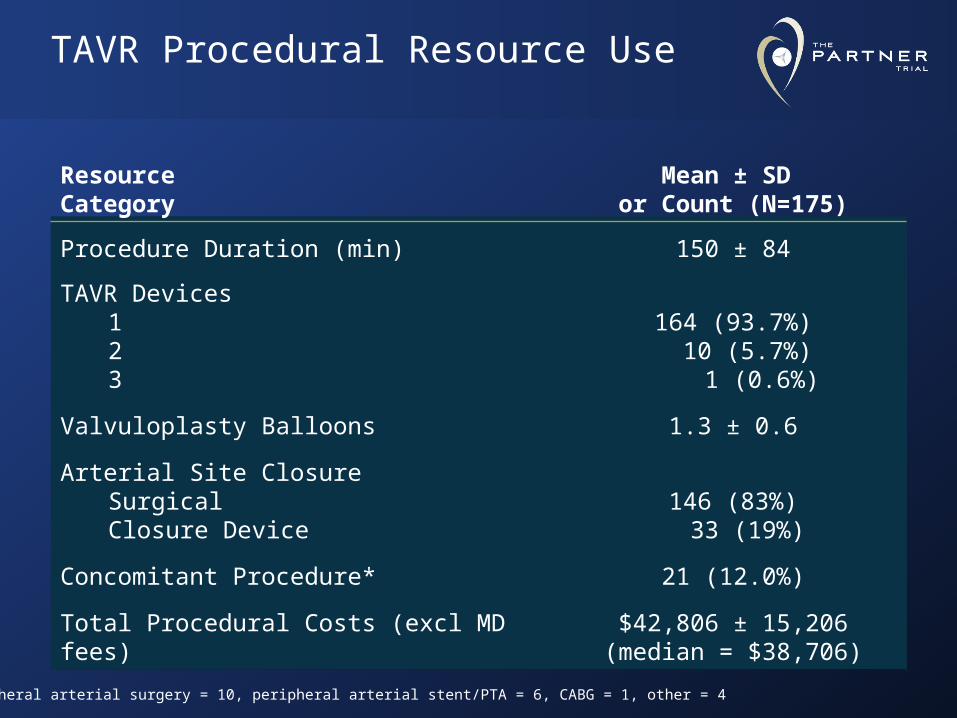
TAVR Procedural Resource Use
Resource Category
Mean ± SD or Count (N=175)
Procedure Duration (min) 150 ± 84
TAVR Devices123
164 (93.7%) 10 (5.7%) 1 (0.6%)
Valvuloplasty Balloons 1.3 ± 0.6
Arterial Site ClosureSurgicalClosure Device
146 (83%) 33 (19%)
Concomitant Procedure* 21 (12.0%)
Total Procedural Costs (excl MD fees)$42,806 ± 15,206
(median = $38,706)
*peripheral arterial surgery = 10, peripheral arterial stent/PTA = 6, CABG = 1, other = 4
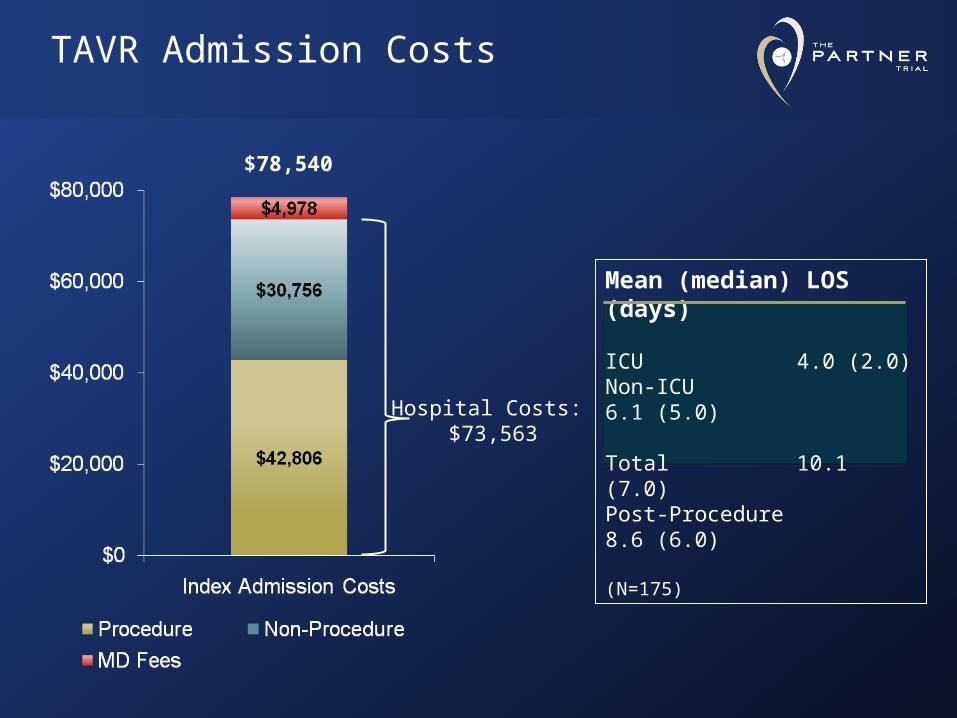
TAVR Admission Costs
Mean (median) LOS (days)
ICU 4.0 (2.0)Non-ICU 6.1 (5.0) Total 10.1 (7.0)Post-Procedure 8.6 (6.0)
(N=175)
$78,540
Hospital Costs: $73,563

12-Month Follow-up Resource Utilization
*Not including index TAVR admission
TAVR Group* (N=179)
Control Group (N=179) P-value
Hospitalizations 1.02 2.15 <0.001
Cardiovascular 0.50 1.70 <0.001
Non-cardiovascular 0.51 0.45 0.43
Rehab Days 4.6 3.9 0.75
SNF Days 14.5 8.0 0.21
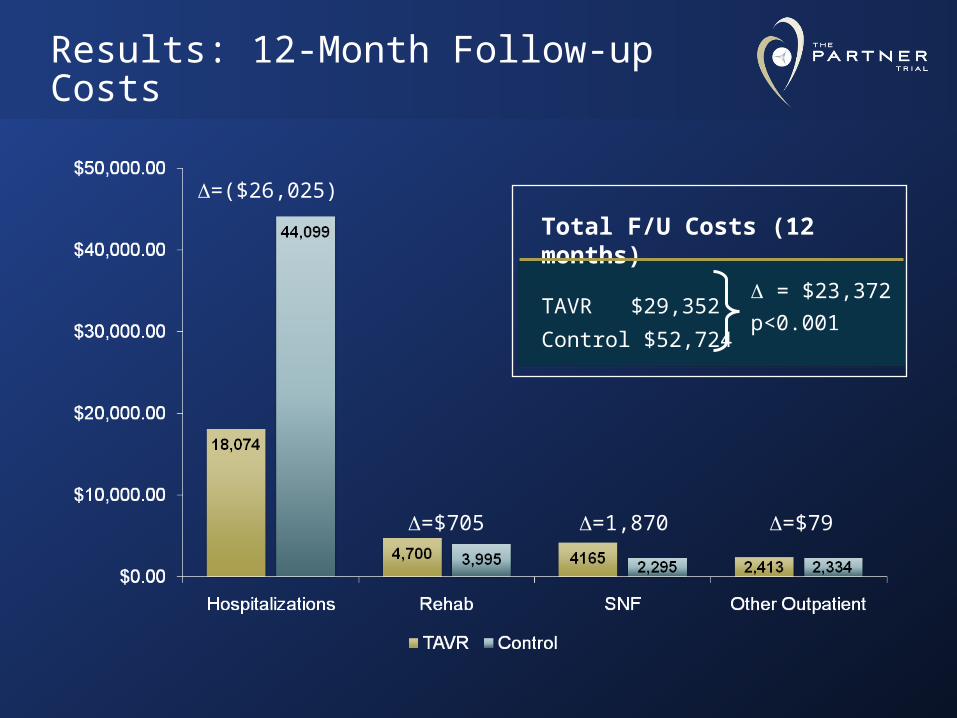
Results: 12-Month Follow-up Costs
=($26,025)
=$705 =1,870 =$79
Total F/U Costs (12 months)
TAVR $29,352
Control $52,724
= $23,372
p<0.001

Results: Observed Survival
TAVR
Control
Difference in In-Trial Life Expectancy= 0.49 years
Based on data available as of 28SEP2010
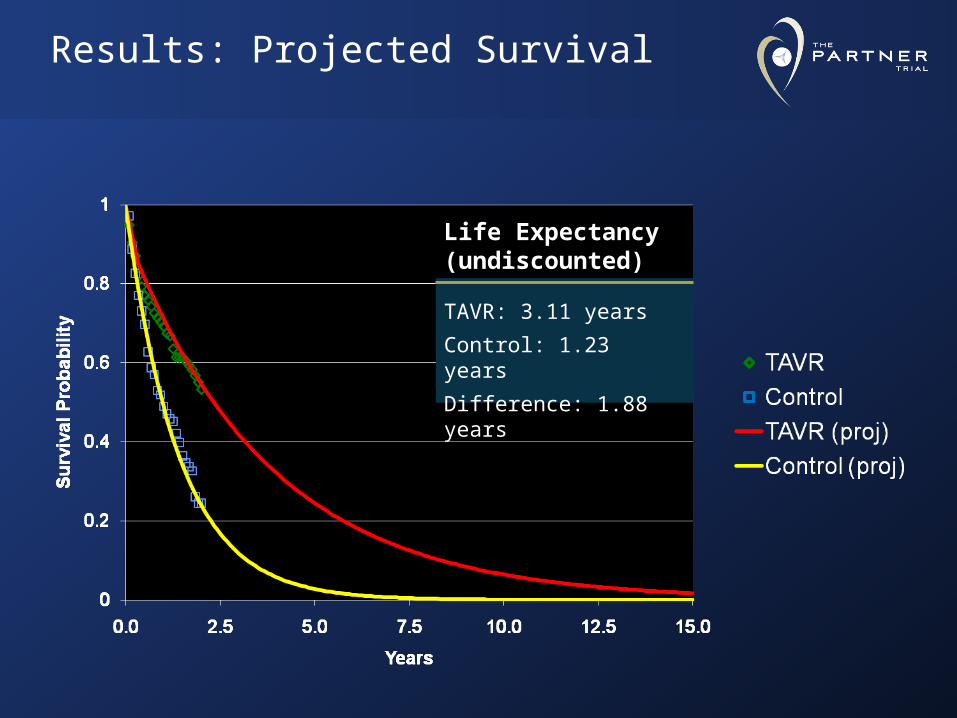
Results: Projected Survival
Life Expectancy (undiscounted)
TAVR: 3.11 years
Control: 1.23 years
Difference: 1.88 years

$50,000 per LY$50,000 per LY
Cost = $79,837 LE = 1.59 years
ICER = $50,212/LYG
Cost = $79,837 LE = 1.59 years
ICER = $50,212/LYG
$100,000 per LY$100,000 per LY
Cost-Effectiveness of TAVR vs. Control Lifetime Results

Cost-Effectiveness of TAVR vs. Control Lifetime Results
47%
95%95%
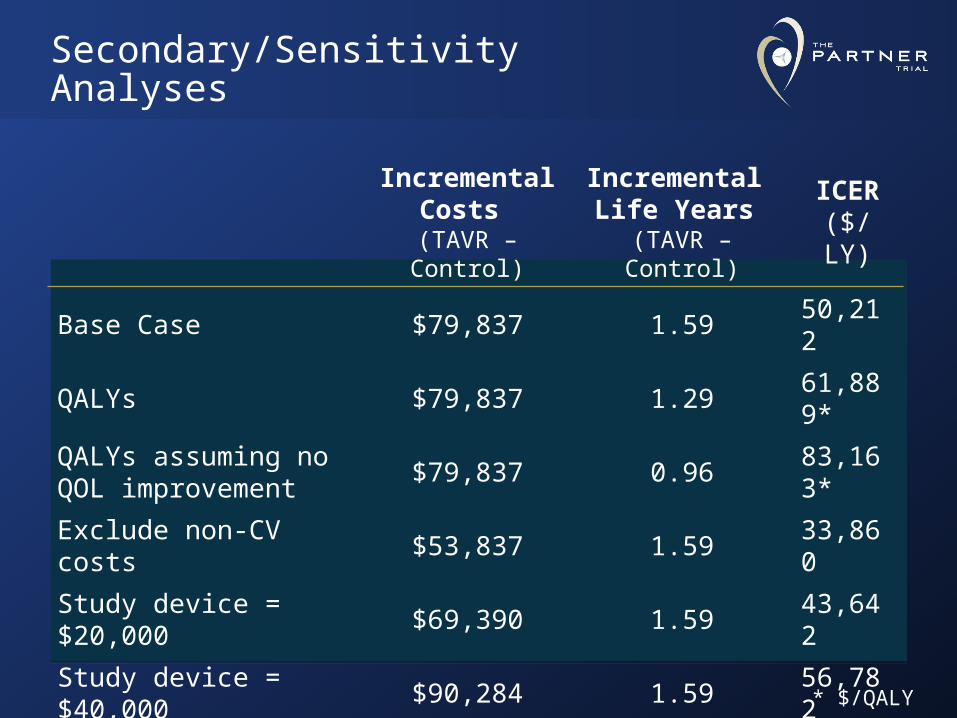
Secondary/Sensitivity Analyses
Incremental Costs
(TAVR – Control)
Incremental Life Years
(TAVR – Control)
ICER($/LY)
Base Case $79,837 1.59 50,212
QALYs $79,837 1.29 61,889*
QALYs assuming no QOL improvement
$79,837 0.96 83,163*
Exclude non-CV costs $53,837 1.59 33,860
Study device = $20,000 $69,390 1.59 43,642
Study device = $40,000 $90,284 1.59 56,782
Exclude BAV costs $82,623 1.59 51,964
* $/QALY
• Still early experience for TAVR device and procedure; care may become more efficient in future
• Care of control group patients in trial may have differed from care of similar pts in community practice
• Lifetime analysis, particularly cost projections beyond the trial period, associated with some uncertainty
• Uniquely old and high-risk patient population; results cannot be extrapolated to other groups
Limitations
• TAVR was associated with index admission costs of ~$78,000, including estimated physician fees
• Although follow-up costs were ~$23,000/pt lower with TAVR vs. standard care (mainly due to reduced CV hospitalizations), overall 1-year costs remained substantially higher with TAVR
• Based on observed data from PARTNER, we project that TAVR will result in an increased life expectancy of ~1.9 years compared with standard care and an iCER of $50,200 per life-year gained
• Results were minimally impacted by major sensitivity analyses
Summary of Findings

For patients with severe aortic stenosis who
are unsuitable for surgical AVR, TAVR
significantly increases life expectancy at an
incremental cost per life year gained well
within accepted values for commonly used
cardiovascular technologies
Conclusions
HCRI EQOL Research– Joshua Walczak, M.S.
– Patricia White-Davis
MAHI Health Economics– Yang Lei, M.S.
– Kaijun Wang, Ph.D.
– Kate Vilain, M.P.H.
– Elizabeth Magnuson, Sc.D.
– David J. Cohen, M.D. M.Sc.
Edwards Lifesciences– William Anderson, Ph.D.
– Rebecca Schwarz, Ph.D.
– Jodi Akin, M.S.
– Ann Thompson, B.S.N, M.B.A.
PARTNER Trial Steering Committee, Investigators, Study Coordinators, and Patients
Acknowledgements


Published Cost Effectiveness Estimates

TAVR Procedure Costs
$46,238
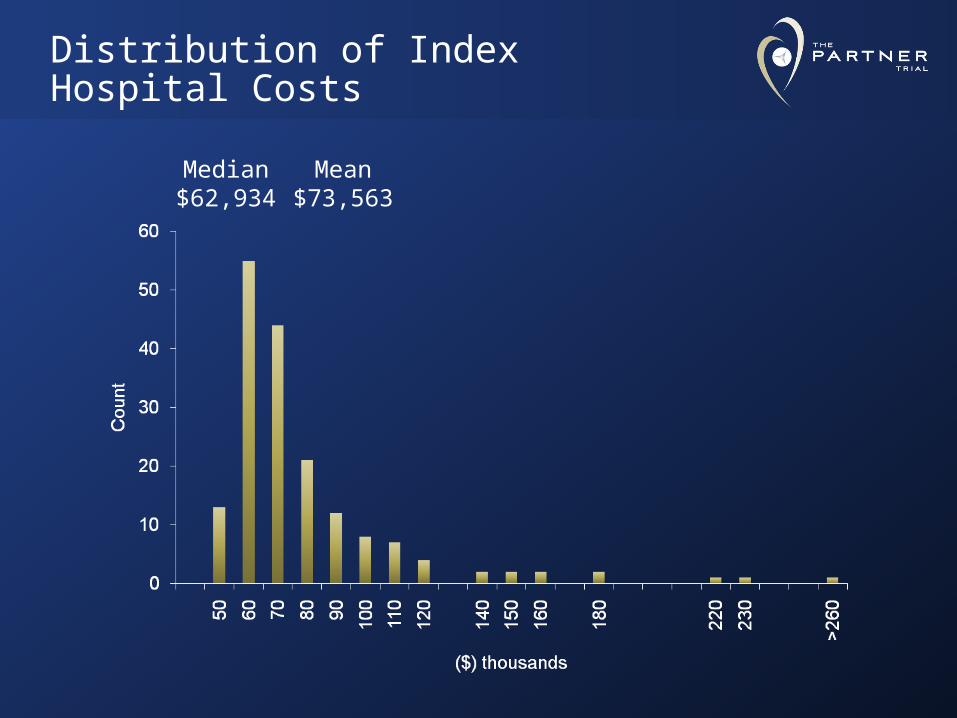
Distribution of Index Hospital Costs
Median$62,934
Mean$73,563

12-Month Resource Utilization*
*Not including index TAVR admission or “index” BAV admissions
TAVR Group (N=179)
Control Group (N=179) P-value
Hospitalizations 1.02 1.53 <0.001
Cardiovascular 0.50 1.08 <0.001
Non-cardiovascular 0.51 0.45 0.43
Rehab Days 4.6 3.9 0.75
SNF Days 14.5 8 0.21

P=0.005 P=0.025 P=0.004
EQ-5D Utility Scores

Threshold$50K (%)
Threshold$100K (%)
Base Case – 3% discount 47 100
Base Case – 0% discount 81 100
Base Case – 5% discount 27 100
QALYs 3 100
QALYs assume no QOL benefit 0 92
Exclude non-CV costs 100 100
Device $20,000 89 100
Device $40,000 9 100
Exclude BAV costs 34 100
Probability of CE