
Matrix mechanical plasticity regulates cancer cell...
13
ARTICLE Matrix mechanical plasticity regulates cancer cell migration through confining microenvironments Katrina M. Wisdom 1 , Kolade Adebowale 2 , Julie Chang 3 , Joanna Y. Lee 1 , Sungmin Nam 1 , Rajiv Desai 4 , Ninna Struck Rossen 5 , Marjan Rafat 5 , Robert B. West 6 , Louis Hodgson 7 & Ovijit Chaudhuri 1 Studies of cancer cell migration have found two modes: one that is protease-independent, requiring micron-sized pores or channels for cells to squeeze through, and one that is pro- tease-dependent, relevant for confining nanoporous matrices such as basement membranes (BMs). However, many extracellular matrices exhibit viscoelasticity and mechanical plasti- city, irreversibly deforming in response to force, so that pore size may be malleable. Here we report the impact of matrix plasticity on migration. We develop nanoporous and BM ligand- presenting interpenetrating network (IPN) hydrogels in which plasticity could be modulated independent of stiffness. Strikingly, cells in high plasticity IPNs carry out protease- independent migration through the IPNs. Mechanistically, cells in high plasticity IPNs extend invadopodia protrusions to mechanically and plastically open up micron-sized chan- nels and then migrate through them. These findings uncover a new mode of protease- independent migration, in which cells can migrate through confining matrix if it exhibits sufficient mechanical plasticity. DOI: 10.1038/s41467-018-06641-z OPEN 1 Department of Mechanical Engineering, Stanford University, Stanford, CA 94305, USA. 2 Department of Chemical Engineering, Stanford University, Stanford, CA 94305, USA. 3 Department of Bioengineering, Stanford University, Stanford, CA 94305, USA. 4 School of Engineering and Applied Sciences, Harvard University, Cambridge, MA 02138, USA. 5 Department of Radiation Oncology, Stanford University, Stanford, CA 94305, USA. 6 Department of Clinical Pathology, Stanford University, Stanford, CA 94305, USA. 7 Department of Anatomy and Structural Biology, Gruss-Lipper Biophotonics Center, Albert Einstein College of Medicine, Bronx, NY 10461, USA. Correspondence and requests for materials should be addressed to O.C. (email: [email protected]) NATURE COMMUNICATIONS | (2018)9:4144 | DOI: 10.1038/s41467-018-06641-z | www.nature.com/naturecommunications 1 1234567890():,;
Transcript of Matrix mechanical plasticity regulates cancer cell...

ARTICLE
Matrix mechanical plasticity regulates cancer cellmigration through confining microenvironmentsKatrina M. Wisdom 1, Kolade Adebowale 2, Julie Chang3, Joanna Y. Lee 1, Sungmin Nam1, Rajiv Desai4,
Ninna Struck Rossen5, Marjan Rafat 5, Robert B. West6, Louis Hodgson 7 & Ovijit Chaudhuri 1
Studies of cancer cell migration have found two modes: one that is protease-independent,
requiring micron-sized pores or channels for cells to squeeze through, and one that is pro-
tease-dependent, relevant for confining nanoporous matrices such as basement membranes
(BMs). However, many extracellular matrices exhibit viscoelasticity and mechanical plasti-
city, irreversibly deforming in response to force, so that pore size may be malleable. Here we
report the impact of matrix plasticity on migration. We develop nanoporous and BM ligand-
presenting interpenetrating network (IPN) hydrogels in which plasticity could be modulated
independent of stiffness. Strikingly, cells in high plasticity IPNs carry out protease-
independent migration through the IPNs. Mechanistically, cells in high plasticity IPNs
extend invadopodia protrusions to mechanically and plastically open up micron-sized chan-
nels and then migrate through them. These findings uncover a new mode of protease-
independent migration, in which cells can migrate through confining matrix if it exhibits
sufficient mechanical plasticity.
DOI: 10.1038/s41467-018-06641-z OPEN
1 Department of Mechanical Engineering, Stanford University, Stanford, CA 94305, USA. 2Department of Chemical Engineering, Stanford University,Stanford, CA 94305, USA. 3 Department of Bioengineering, Stanford University, Stanford, CA 94305, USA. 4 School of Engineering and Applied Sciences,Harvard University, Cambridge, MA 02138, USA. 5Department of Radiation Oncology, Stanford University, Stanford, CA 94305, USA. 6 Department ofClinical Pathology, Stanford University, Stanford, CA 94305, USA. 7Department of Anatomy and Structural Biology, Gruss-Lipper Biophotonics Center, AlbertEinstein College of Medicine, Bronx, NY 10461, USA. Correspondence and requests for materials should be addressed toO.C. (email: [email protected])
NATURE COMMUNICATIONS | (2018) 9:4144 | DOI: 10.1038/s41467-018-06641-z | www.nature.com/naturecommunications 1
1234
5678
90():,;

Carcinoma progression and metastasis require that cancercells traverse basement membranes (BMs): first throughthe BM separating epithelial and stromal tissue, and then
across the BM lining blood vessels (Fig. 1a)1,2. Invadopodia arethe actin-rich, invasive protrusions that enable cancer cells toinvade the BM, and they are thought to do so by secreting pro-teases to degrade the BM3,4. Recent studies suggest that withoutmatrix degradation, nanometer-scale pores of BM would physi-cally limit invasion, as cells are unable to squeeze through elasticor rigid pores smaller than roughly 3–5 μm in diameter5–11.However, pore size may be malleable—particularly in tumor tis-sue. While it has been long appreciated that tumor tissue is up toan order of magnitude stiffer than normal tissue12, noninvasiveclinical imaging has also revealed breast tumor tissue to be moreviscous, or liquid-like, than normal tissue13. The elevated visc-osity of tumor tissue is thought to arise in part from abnormaltissue cross-linking that accompanies breast cancerprogression13,14. Because matrix plasticity can be related to
matrix viscosity, matrix architecture in the tumor micro-environment may also exhibit elevated mechanical plasticity,enabling cell-generated forces to induce permanent micro-structural rearrangements in the matrix. This raises the possibilitythat cells can carry out invasion into, and migration through,confining matrices using cell-generated forces to dilate pores ifthose matrices are sufficiently plastic.
Here we assess the role of matrix plasticity in mediatinginvasion and migration of confined cancer cells. We develop IPNhydrogels, which are nanoporous, present BM ligands to cells,and enable mechanical plasticity to be modulated independent ofstiffness. Cells in high plasticity (HP) IPNs carry out protease-independent migration through the IPNs, while cells in lowplasticity (LP) IPNs mostly do not migrate. Cells in HP IPNs firstutilize invadopodia protrusions to mechanically and plasticallyopen up channels, and then generate protrusive forces at theleading edge to migrate through them. Together, these findingsestablish that cells can migrate through confining matrices such
a
Alginate molecular weight + Ca2++
Low plasticity High plasticityMedium plasticity
Basementmembrane matrix
Ionicallycrosslinkedalginate network
Molecularweight differences
Invasion out of primary tumor
ExtravasationMammary
duct
Blood vesselintravasation
Mammarystroma
Basement membrane
Invading cancer cell
Invadopodium
Time
Str
ain
Creep Recovery
Total
Elastic
Viscoelastic
Permanentplastic/malleable
b
d e f g
h
c
i
0.00
0.05
0.10
0.15
Loss
tang
ent
LP MP HP
####****
******
10 12 15
Plasticity: 100 Pa creep
0 5000 10,0000.0
0.5
1.0
Time (s)
Nor
mal
ized
str
ain
100 Pa 0 Pa
LP IPN
HP IPN
MP IPN
j k
Before indentations After indentations
Human mammary tumor sample
l
Perm. deformationTotal indentation
Human Mouse0
20
40
60
Inde
ntat
ion
plas
ticity
(%
)
Mammary tumor tissue
0.0 0.5 1.0
0
20
40
Indentation depth (mm)
For
ce (
mN
)
1st 2nd
0
Inde
ntat
ion
Hours 1 2 3 4
Human mammary tumor indentation
0.05 0.100
10
20
30
40
Loss tangent
Per
man
ent s
trai
n (%
)
LP
HPMP
20 30 400.0
0.5
1.0
Nominal AuNPsize (nm)
Par
titio
n co
effic
ient
MPLP
HP
Particle diffusionm
0
10
20
30
4050
100
Per
man
ent s
trai
n (%
)
LP MP HP Sillyputty
PA
******
****####
3 6 7
HP IPN
LMW
Alg
rBM
col-1
0
20
40
60
80
100
Per
man
ent s
trai
n (%
)
Plasticity: 10 Pa creep
ns
****
****
3 3 3 3
0
1
2
3
4
You
ng's
mod
ulus
(kP
a)
LP MP HP
10 12 15
ns
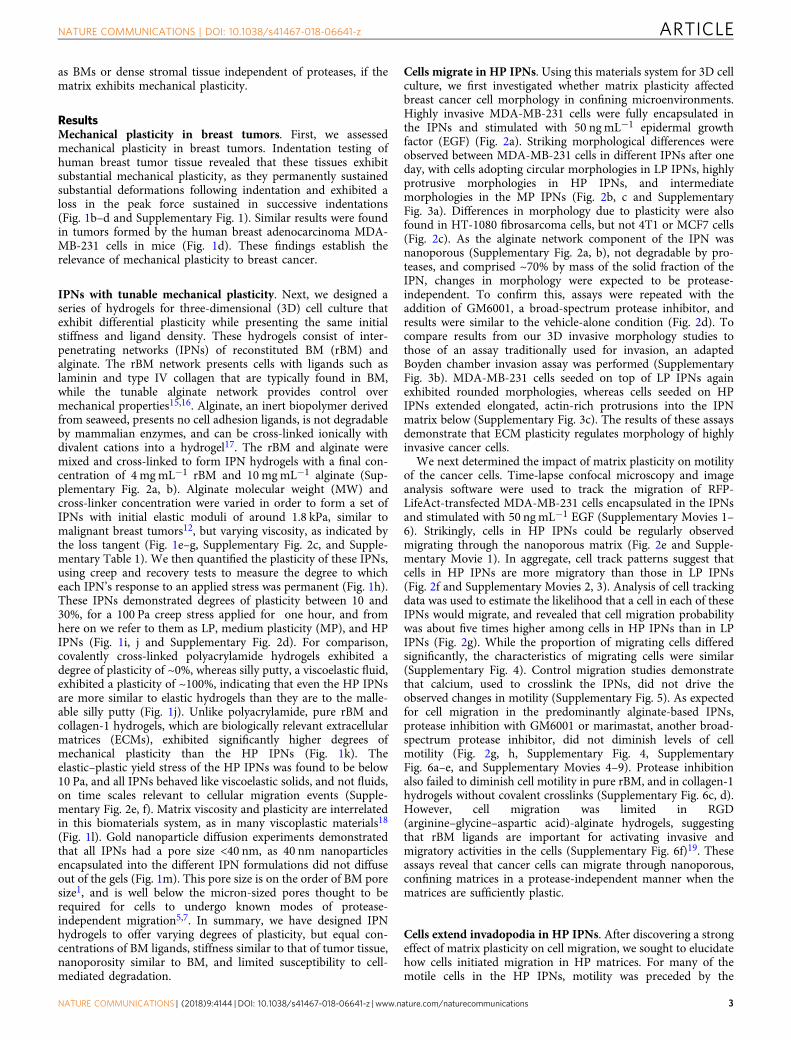
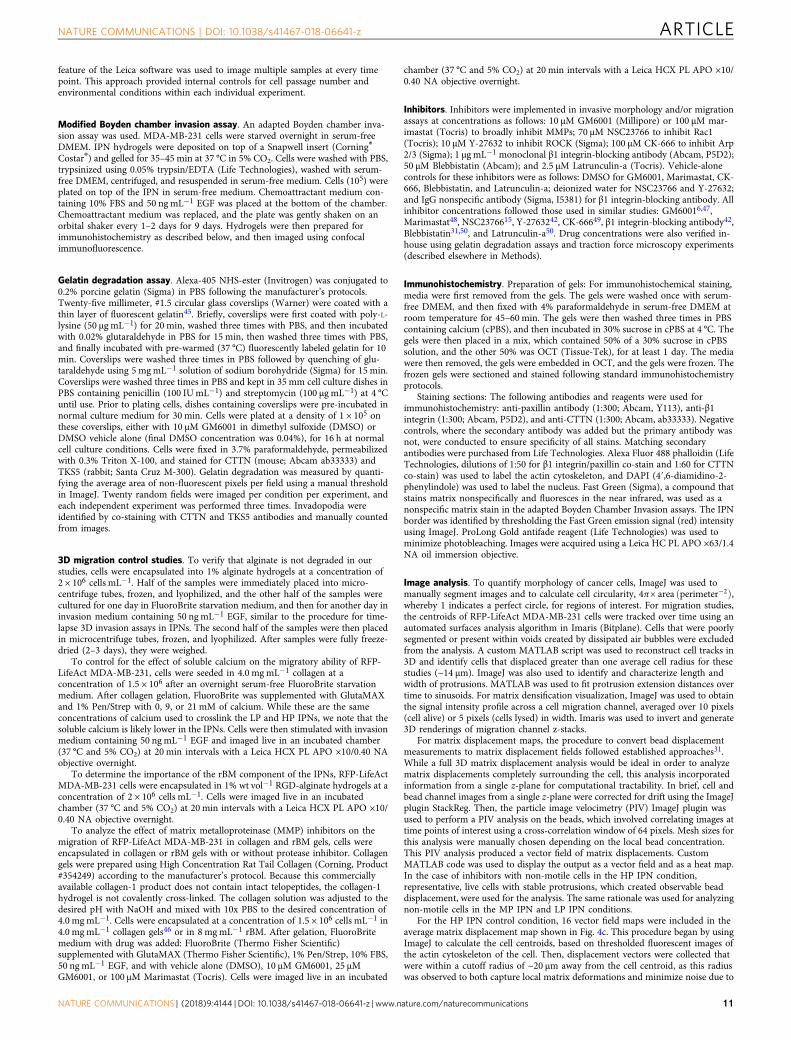
Fig. 1 Mechanical plasticity of interpenetrating networks of alginate and reconstituted basement membrane matrix (IPNs) can be independently tuned.a Schematic depicting invasion of basement membranes (green) during invasion and metastasis. b Schematic depicting the indentation tests performed onhuman mammary tumor tissue, and the corresponding force vs. indentation depth curves (green arrow—permanently retained indentation; red arrow—drop in peak force during second indentation; dotted line—25% of initial peak force). Subplot shows indentation test profile. c Before and after images of anindented mammary tumor sample. Indentation region outlined by dotted circle, and discolored tissue regions indicated by black arrows. Scale bar is 1 mm.d Indentation plasticity measurements of human tumor (two specimens from a tumor sample) and mouse tumor specimens (one sample each from fourseparate mice). e Schematic of approach to tuning matrix plasticity in IPNs of alginate (blue) and reconstituted basement membrane (rBM) matrix (green).f, g Young’s moduli (f) and loss tangent (g) of the different IPN formulations. The differences in loss tangent indicated are significantly different (**P < 0.01,****P < 0.0001, ANOVA; ns not significant), as is the increasing loss tangent across this series of IPNs (####P < 0.0001, Spearman’s rank correlation).h Schematic depicting the elastic, viscoelastic, and plastic (permanent) portions of a material response in a creep and recovery test. i Representative creepand recovery tests of IPNs. j Permanent strain of IPNs, polyacrylamide gels (PA), and silly putty from creep and recovery tests. Statistically significantdifferences are indicated (**P < 0.01, ****P < 0.0001, ANOVA), plasticity across the IPNs (####P < 0.0001, Spearman’s rank correlation). k Permanentstrain of HP IPN, alginate hydrogel, rBM matrix, and col-1 gels from creep–recovery tests. Statistically significant differences compared to HP IPN areindicated (****P < 0.0001, ANOVA). In f–k, bars indicate means and error bars indicate 95% confidence interval of the indicated biological replicates.l Permanent strain and loss tangent are correlated in the IPNs (R2= 0.7953). m Partition coefficients for PEGylated gold nanoparticles of the indicated sizeencapsulated in IPNs for 4 days
ARTICLE NATURE COMMUNICATIONS | DOI: 10.1038/s41467-018-06641-z
2 NATURE COMMUNICATIONS | (2018) 9:4144 | DOI: 10.1038/s41467-018-06641-z | www.nature.com/naturecommunications
as BMs or dense stromal tissue independent of proteases, if thematrix exhibits mechanical plasticity.
ResultsMechanical plasticity in breast tumors. First, we assessedmechanical plasticity in breast tumors. Indentation testing ofhuman breast tumor tissue revealed that these tissues exhibitsubstantial mechanical plasticity, as they permanently sustainedsubstantial deformations following indentation and exhibited aloss in the peak force sustained in successive indentations(Fig. 1b–d and Supplementary Fig. 1). Similar results were foundin tumors formed by the human breast adenocarcinoma MDA-MB-231 cells in mice (Fig. 1d). These findings establish therelevance of mechanical plasticity to breast cancer.
IPNs with tunable mechanical plasticity. Next, we designed aseries of hydrogels for three-dimensional (3D) cell culture thatexhibit differential plasticity while presenting the same initialstiffness and ligand density. These hydrogels consist of inter-penetrating networks (IPNs) of reconstituted BM (rBM) andalginate. The rBM network presents cells with ligands such aslaminin and type IV collagen that are typically found in BM,while the tunable alginate network provides control overmechanical properties15,16. Alginate, an inert biopolymer derivedfrom seaweed, presents no cell adhesion ligands, is not degradableby mammalian enzymes, and can be cross-linked ionically withdivalent cations into a hydrogel17. The rBM and alginate weremixed and cross-linked to form IPN hydrogels with a final con-centration of 4 mgmL−1 rBM and 10 mgmL−1 alginate (Sup-plementary Fig. 2a, b). Alginate molecular weight (MW) andcross-linker concentration were varied in order to form a set ofIPNs with initial elastic moduli of around 1.8 kPa, similar tomalignant breast tumors12, but varying viscosity, as indicated bythe loss tangent (Fig. 1e–g, Supplementary Fig. 2c, and Supple-mentary Table 1). We then quantified the plasticity of these IPNs,using creep and recovery tests to measure the degree to whicheach IPN’s response to an applied stress was permanent (Fig. 1h).These IPNs demonstrated degrees of plasticity between 10 and30%, for a 100 Pa creep stress applied for one hour, and fromhere on we refer to them as LP, medium plasticity (MP), and HPIPNs (Fig. 1i, j and Supplementary Fig. 2d). For comparison,covalently cross-linked polyacrylamide hydrogels exhibited adegree of plasticity of ~0%, whereas silly putty, a viscoelastic fluid,exhibited a plasticity of ~100%, indicating that even the HP IPNsare more similar to elastic hydrogels than they are to the malle-able silly putty (Fig. 1j). Unlike polyacrylamide, pure rBM andcollagen-1 hydrogels, which are biologically relevant extracellularmatrices (ECMs), exhibited significantly higher degrees ofmechanical plasticity than the HP IPNs (Fig. 1k). Theelastic–plastic yield stress of the HP IPNs was found to be below10 Pa, and all IPNs behaved like viscoelastic solids, and not fluids,on time scales relevant to cellular migration events (Supple-mentary Fig. 2e, f). Matrix viscosity and plasticity are interrelatedin this biomaterials system, as in many viscoplastic materials18
(Fig. 1l). Gold nanoparticle diffusion experiments demonstratedthat all IPNs had a pore size <40 nm, as 40 nm nanoparticlesencapsulated into the different IPN formulations did not diffuseout of the gels (Fig. 1m). This pore size is on the order of BM poresize1, and is well below the micron-sized pores thought to berequired for cells to undergo known modes of protease-independent migration5,7. In summary, we have designed IPNhydrogels to offer varying degrees of plasticity, but equal con-centrations of BM ligands, stiffness similar to that of tumor tissue,nanoporosity similar to BM, and limited susceptibility to cell-mediated degradation.
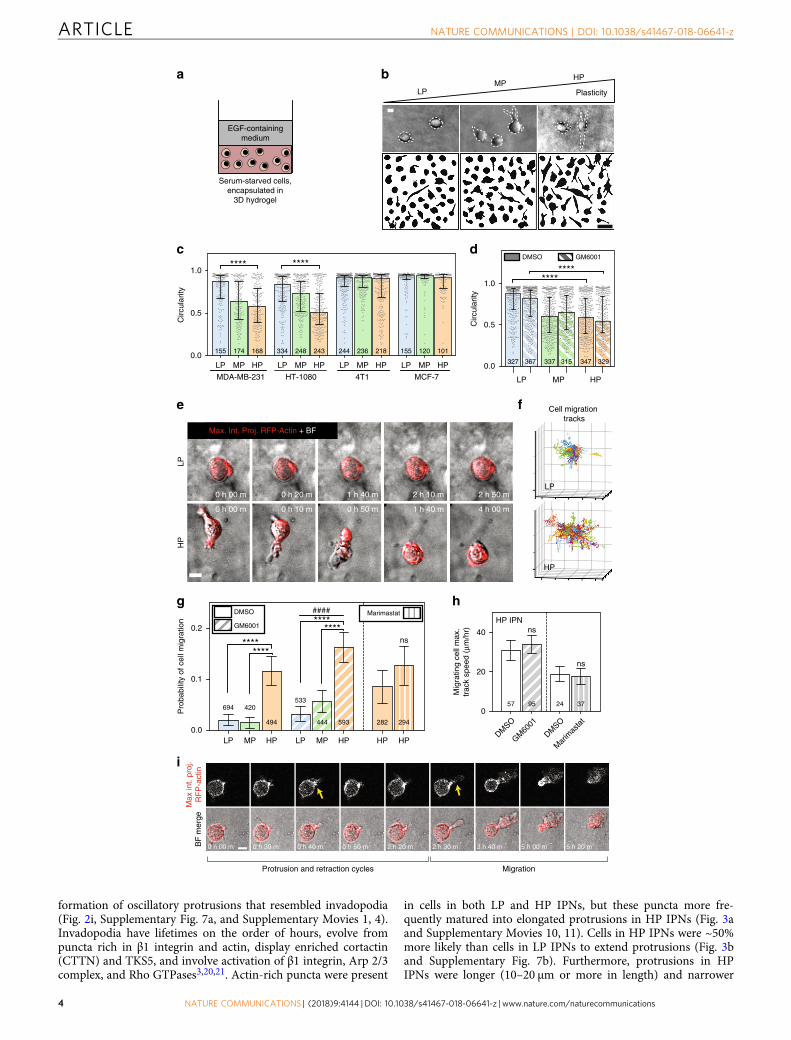
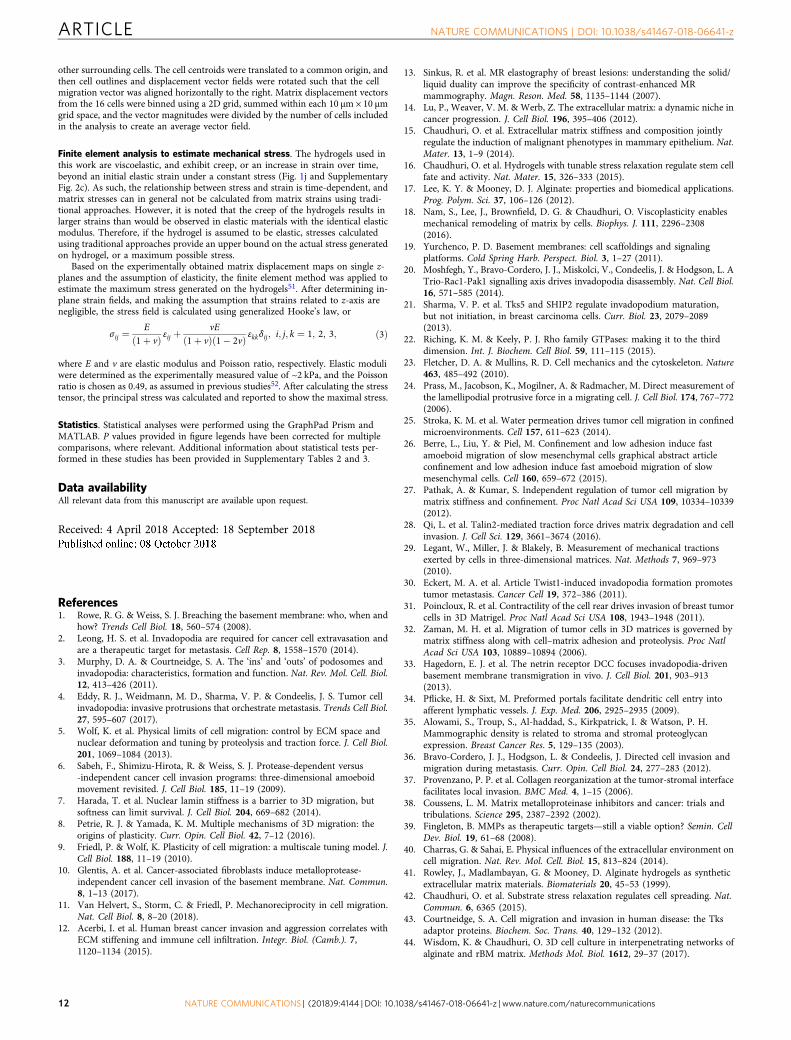
Cells migrate in HP IPNs. Using this materials system for 3D cellculture, we first investigated whether matrix plasticity affectedbreast cancer cell morphology in confining microenvironments.Highly invasive MDA-MB-231 cells were fully encapsulated inthe IPNs and stimulated with 50 ngmL−1 epidermal growthfactor (EGF) (Fig. 2a). Striking morphological differences wereobserved between MDA-MB-231 cells in different IPNs after oneday, with cells adopting circular morphologies in LP IPNs, highlyprotrusive morphologies in HP IPNs, and intermediatemorphologies in the MP IPNs (Fig. 2b, c and SupplementaryFig. 3a). Differences in morphology due to plasticity were alsofound in HT-1080 fibrosarcoma cells, but not 4T1 or MCF7 cells(Fig. 2c). As the alginate network component of the IPN wasnanoporous (Supplementary Fig. 2a, b), not degradable by pro-teases, and comprised ~70% by mass of the solid fraction of theIPN, changes in morphology were expected to be protease-independent. To confirm this, assays were repeated with theaddition of GM6001, a broad-spectrum protease inhibitor, andresults were similar to the vehicle-alone condition (Fig. 2d). Tocompare results from our 3D invasive morphology studies tothose of an assay traditionally used for invasion, an adaptedBoyden chamber invasion assay was performed (SupplementaryFig. 3b). MDA-MB-231 cells seeded on top of LP IPNs againexhibited rounded morphologies, whereas cells seeded on HPIPNs extended elongated, actin-rich protrusions into the IPNmatrix below (Supplementary Fig. 3c). The results of these assaysdemonstrate that ECM plasticity regulates morphology of highlyinvasive cancer cells.
We next determined the impact of matrix plasticity on motilityof the cancer cells. Time-lapse confocal microscopy and imageanalysis software were used to track the migration of RFP-LifeAct-transfected MDA-MB-231 cells encapsulated in the IPNsand stimulated with 50 ng mL−1 EGF (Supplementary Movies 1–6). Strikingly, cells in HP IPNs could be regularly observedmigrating through the nanoporous matrix (Fig. 2e and Supple-mentary Movie 1). In aggregate, cell track patterns suggest thatcells in HP IPNs are more migratory than those in LP IPNs(Fig. 2f and Supplementary Movies 2, 3). Analysis of cell trackingdata was used to estimate the likelihood that a cell in each of theseIPNs would migrate, and revealed that cell migration probabilitywas about five times higher among cells in HP IPNs than in LPIPNs (Fig. 2g). While the proportion of migrating cells differedsignificantly, the characteristics of migrating cells were similar(Supplementary Fig. 4). Control migration studies demonstratethat calcium, used to crosslink the IPNs, did not drive theobserved changes in motility (Supplementary Fig. 5). As expectedfor cell migration in the predominantly alginate-based IPNs,protease inhibition with GM6001 or marimastat, another broad-spectrum protease inhibitor, did not diminish levels of cellmotility (Fig. 2g, h, Supplementary Fig. 4, SupplementaryFig. 6a–e, and Supplementary Movies 4–9). Protease inhibitionalso failed to diminish cell motility in pure rBM, and in collagen-1hydrogels without covalent crosslinks (Supplementary Fig. 6c, d).However, cell migration was limited in RGD(arginine–glycine–aspartic acid)-alginate hydrogels, suggestingthat rBM ligands are important for activating invasive andmigratory activities in the cells (Supplementary Fig. 6f)19. Theseassays reveal that cancer cells can migrate through nanoporous,confining matrices in a protease-independent manner when thematrices are sufficiently plastic.
Cells extend invadopodia in HP IPNs. After discovering a strongeffect of matrix plasticity on cell migration, we sought to elucidatehow cells initiated migration in HP matrices. For many of themotile cells in the HP IPNs, motility was preceded by the
NATURE COMMUNICATIONS | DOI: 10.1038/s41467-018-06641-z ARTICLE
NATURE COMMUNICATIONS | (2018) 9:4144 | DOI: 10.1038/s41467-018-06641-z | www.nature.com/naturecommunications 3
formation of oscillatory protrusions that resembled invadopodia(Fig. 2i, Supplementary Fig. 7a, and Supplementary Movies 1, 4).Invadopodia have lifetimes on the order of hours, evolve frompuncta rich in β1 integrin and actin, display enriched cortactin(CTTN) and TKS5, and involve activation of β1 integrin, Arp 2/3complex, and Rho GTPases3,20,21. Actin-rich puncta were present
in cells in both LP and HP IPNs, but these puncta more fre-quently matured into elongated protrusions in HP IPNs (Fig. 3aand Supplementary Movies 10, 11). Cells in HP IPNs were ~50%more likely than cells in LP IPNs to extend protrusions (Fig. 3band Supplementary Fig. 7b). Furthermore, protrusions in HPIPNs were longer (10–20 μm or more in length) and narrower
a bLP
MPHP
Plasticity
Serum-starved cells,encapsulated in
3D hydrogel
EGF-containingmedium
c
e
d
g
f
LP
0 h 00 m
0 h 00 m
0 h 10 m 0 h 50 m 1 h 40 m 4 h 00 m
0 h 20 m 1 h 40 m 2 h 10 m 2 h 50 m
Max. Int. Proj. RFP-Actin + BF
HP
0 h 00 m 0 h 30 m 0 h 40 m 0 h 50 m 2 h 20 m 2 h 30 m 3 h 40 m 5 h 00 m 5 h 20 m
Protrusion and retraction cycles Migration
Max
int.
proj
.R
FP
-act
inB
F m
erge
h
0.0
0.5
1.0
Circ
ular
ity
LP HPMP LP HPMP LP HPMPLP HPMP
MDA-MB-231 MCF-74T1HT-1080
********
155 174 168 334 248 243 244 236 218 155 120 101
0.0
0.5
1.0
LP HP
Circ
ular
ity
MP
DMSO GM6001
********
327 367 337 315 347 329
LP
HP
i
Cell migration tracks
0
20
40
Mig
ratin
g ce
ll m
ax.
trac
k sp
eed
(μm
/hr)
HP IPN
57 95
DMSO
Mar
imas
tat
GM60
01
DMSO
3724
0.0
0.1
0.2
Pro
babi
lity
of c
ell m
igra
tion
****
****####DMSO
GM6001
LP MP HP LP MP HP
694 420
494
533
444 593
HP HP
294282
Marimastat
****
**** ns
ns
ns
ARTICLE NATURE COMMUNICATIONS | DOI: 10.1038/s41467-018-06641-z
4 NATURE COMMUNICATIONS | (2018) 9:4144 | DOI: 10.1038/s41467-018-06641-z | www.nature.com/naturecommunications
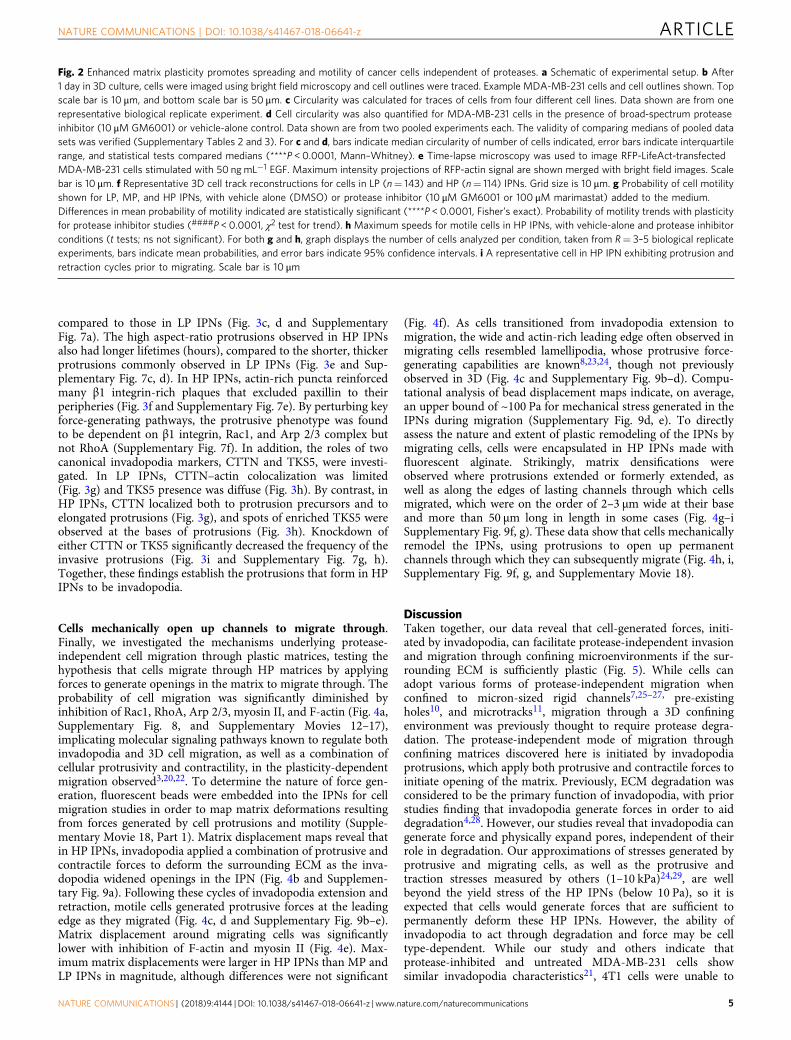
compared to those in LP IPNs (Fig. 3c, d and SupplementaryFig. 7a). The high aspect-ratio protrusions observed in HP IPNsalso had longer lifetimes (hours), compared to the shorter, thickerprotrusions commonly observed in LP IPNs (Fig. 3e and Sup-plementary Fig. 7c, d). In HP IPNs, actin-rich puncta reinforcedmany β1 integrin-rich plaques that excluded paxillin to theirperipheries (Fig. 3f and Supplementary Fig. 7e). By perturbing keyforce-generating pathways, the protrusive phenotype was foundto be dependent on β1 integrin, Rac1, and Arp 2/3 complex butnot RhoA (Supplementary Fig. 7f). In addition, the roles of twocanonical invadopodia markers, CTTN and TKS5, were investi-gated. In LP IPNs, CTTN–actin colocalization was limited(Fig. 3g) and TKS5 presence was diffuse (Fig. 3h). By contrast, inHP IPNs, CTTN localized both to protrusion precursors and toelongated protrusions (Fig. 3g), and spots of enriched TKS5 wereobserved at the bases of protrusions (Fig. 3h). Knockdown ofeither CTTN or TKS5 significantly decreased the frequency of theinvasive protrusions (Fig. 3i and Supplementary Fig. 7g, h).Together, these findings establish the protrusions that form in HPIPNs to be invadopodia.
Cells mechanically open up channels to migrate through.Finally, we investigated the mechanisms underlying protease-independent cell migration through plastic matrices, testing thehypothesis that cells migrate through HP matrices by applyingforces to generate openings in the matrix to migrate through. Theprobability of cell migration was significantly diminished byinhibition of Rac1, RhoA, Arp 2/3, myosin II, and F-actin (Fig. 4a,Supplementary Fig. 8, and Supplementary Movies 12–17),implicating molecular signaling pathways known to regulate bothinvadopodia and 3D cell migration, as well as a combination ofcellular protrusivity and contractility, in the plasticity-dependentmigration observed3,20,22. To determine the nature of force gen-eration, fluorescent beads were embedded into the IPNs for cellmigration studies in order to map matrix deformations resultingfrom forces generated by cell protrusions and motility (Supple-mentary Movie 18, Part 1). Matrix displacement maps reveal thatin HP IPNs, invadopodia applied a combination of protrusive andcontractile forces to deform the surrounding ECM as the inva-dopodia widened openings in the IPN (Fig. 4b and Supplemen-tary Fig. 9a). Following these cycles of invadopodia extension andretraction, motile cells generated protrusive forces at the leadingedge as they migrated (Fig. 4c, d and Supplementary Fig. 9b–e).Matrix displacement around migrating cells was significantlylower with inhibition of F-actin and myosin II (Fig. 4e). Max-imum matrix displacements were larger in HP IPNs than MP andLP IPNs in magnitude, although differences were not significant
(Fig. 4f). As cells transitioned from invadopodia extension tomigration, the wide and actin-rich leading edge often observed inmigrating cells resembled lamellipodia, whose protrusive force-generating capabilities are known8,23,24, though not previouslyobserved in 3D (Fig. 4c and Supplementary Fig. 9b–d). Compu-tational analysis of bead displacement maps indicate, on average,an upper bound of ~100 Pa for mechanical stress generated in theIPNs during migration (Supplementary Fig. 9d, e). To directlyassess the nature and extent of plastic remodeling of the IPNs bymigrating cells, cells were encapsulated in HP IPNs made withfluorescent alginate. Strikingly, matrix densifications wereobserved where protrusions extended or formerly extended, aswell as along the edges of lasting channels through which cellsmigrated, which were on the order of 2–3 μm wide at their baseand more than 50 μm long in length in some cases (Fig. 4g–iSupplementary Fig. 9f, g). These data show that cells mechanicallyremodel the IPNs, using protrusions to open up permanentchannels through which they can subsequently migrate (Fig. 4h, i,Supplementary Fig. 9f, g, and Supplementary Movie 18).
DiscussionTaken together, our data reveal that cell-generated forces, initi-ated by invadopodia, can facilitate protease-independent invasionand migration through confining microenvironments if the sur-rounding ECM is sufficiently plastic (Fig. 5). While cells canadopt various forms of protease-independent migration whenconfined to micron-sized rigid channels7,25–27, pre-existingholes10, and microtracks11, migration through a 3D confiningenvironment was previously thought to require protease degra-dation. The protease-independent mode of migration throughconfining matrices discovered here is initiated by invadopodiaprotrusions, which apply both protrusive and contractile forces toinitiate opening of the matrix. Previously, ECM degradation wasconsidered to be the primary function of invadopodia, with priorstudies finding that invadopodia generate forces in order to aiddegradation4,28. However, our studies reveal that invadopodia cangenerate force and physically expand pores, independent of theirrole in degradation. Our approximations of stresses generated byprotrusive and migrating cells, as well as the protrusive andtraction stresses measured by others (1–10 kPa)24,29, are wellbeyond the yield stress of the HP IPNs (below 10 Pa), so it isexpected that cells would generate forces that are sufficient topermanently deform these HP IPNs. However, the ability ofinvadopodia to act through degradation and force may be celltype-dependent. While our study and others indicate thatprotease-inhibited and untreated MDA-MB-231 cells showsimilar invadopodia characteristics21, 4T1 cells were unable to
Fig. 2 Enhanced matrix plasticity promotes spreading and motility of cancer cells independent of proteases. a Schematic of experimental setup. b After1 day in 3D culture, cells were imaged using bright field microscopy and cell outlines were traced. Example MDA-MB-231 cells and cell outlines shown. Topscale bar is 10 μm, and bottom scale bar is 50 μm. c Circularity was calculated for traces of cells from four different cell lines. Data shown are from onerepresentative biological replicate experiment. d Cell circularity was also quantified for MDA-MB-231 cells in the presence of broad-spectrum proteaseinhibitor (10 μM GM6001) or vehicle-alone control. Data shown are from two pooled experiments each. The validity of comparing medians of pooled datasets was verified (Supplementary Tables 2 and 3). For c and d, bars indicate median circularity of number of cells indicated, error bars indicate interquartilerange, and statistical tests compared medians (****P < 0.0001, Mann–Whitney). e Time-lapse microscopy was used to image RFP-LifeAct-transfectedMDA-MB-231 cells stimulated with 50 ngmL−1 EGF. Maximum intensity projections of RFP-actin signal are shown merged with bright field images. Scalebar is 10 μm. f Representative 3D cell track reconstructions for cells in LP (n= 143) and HP (n= 114) IPNs. Grid size is 10 μm. g Probability of cell motilityshown for LP, MP, and HP IPNs, with vehicle alone (DMSO) or protease inhibitor (10 μM GM6001 or 100 μM marimastat) added to the medium.Differences in mean probability of motility indicated are statistically significant (****P < 0.0001, Fisher’s exact). Probability of motility trends with plasticityfor protease inhibitor studies (####P < 0.0001, χ2 test for trend). h Maximum speeds for motile cells in HP IPNs, with vehicle-alone and protease inhibitorconditions (t tests; ns not significant). For both g and h, graph displays the number of cells analyzed per condition, taken from R= 3–5 biological replicateexperiments, bars indicate mean probabilities, and error bars indicate 95% confidence intervals. i A representative cell in HP IPN exhibiting protrusion andretraction cycles prior to migrating. Scale bar is 10 μm
NATURE COMMUNICATIONS | DOI: 10.1038/s41467-018-06641-z ARTICLE
NATURE COMMUNICATIONS | (2018) 9:4144 | DOI: 10.1038/s41467-018-06641-z | www.nature.com/naturecommunications 5
form protrusions in the HP IPNs, even though they are known toform invadopodia that robustly degrade matrix30. The oscillatorynature of the protrusions in HP IPNs, which typically lengthenedand widened leading up to cell migration, suggests that thesestructures widen pores in stages. This observation underlies theimportance of the matrix being plastic enough to accumulate and
sustain deformations over time. To this point, the finding that cellmorphologies in HP and MP IPNs are similarly protrusive but thelikelihood of cell migration in these matrices is significantly dif-ferent suggests a threshold matrix plasticity required for channelsformed by invadopodia to stay open wide enough to enable cellmigration. Cells migrated after invadopodia protrusions formed
a
b c
g
d
Pro
trus
ion
exte
nsio
n (μ
m)
0 100 200 3000
10
20
0
10
20
HP protrusion
Model fits LP protrusion
Time (mins.) Protrusion extension (μm)
0 20 400
0.1
0.2
0.3 LP, n = 75
HP, n = 111
Fra
ctio
n
Protrusion width (μm)0 10
0
0.1
0.2
0.3 LP, n = 75
HP, n = 111
Fra
ctio
n
HP
0 h 00 m 0 h 15 m 0 h 20 m 0 h 25 m 0 h 30 m 1 h 10 m 1 h 15 m
0 h 00 m 0 h 15 m 0 h 50 m 1 h 05 m 1 h 20 m 1 h 35 m 2 h 25 m
LP
RFP-LifeActBFMerge
Phalloidin Cortactin Merge+DAPI
MP
LPH
P
h i
e
f
siCTRL
siCTTN
siTKS5
0.0
0.2
0.4
0.6
0.8
1.0
Pro
babi
lity
of c
ell
exte
ndin
g pr
otus
ion(
s)
* ****
HP IPN
182 225 130
0.0
0.5
1.0
Pro
babi
lity
of c
ell
exte
ndin
g pr
otru
sion
(s)
LP MP HP LP MP HP
DMSO GM6001
320 175 268 245 204 256
**** ****#### ####
HP
Phalloidin β1 Integrin Paxillin
LP
MIP+DAPI
TKS5-EGFP RFP-Actin Merge
HP
LP
ARTICLE NATURE COMMUNICATIONS | DOI: 10.1038/s41467-018-06641-z
6 NATURE COMMUNICATIONS | (2018) 9:4144 | DOI: 10.1038/s41467-018-06641-z | www.nature.com/naturecommunications
channels on the order of several microns wide, consistent with thepreviously established idea that a stiff nucleus can only squeeze toa size of several microns via Rho-mediated actomyosin con-tractility, and therefore the nucleus impedes cell migration untilsuch a size opening becomes available5,7. Indeed, Rho-mediatedactomyosin contractility was required for migration but notprotrusivity. Though the number of cells that migrated was highlydependent on matrix plasticity, the few cells that did migratein LP or MP IPNs migrated distances similar to those in HPIPNs, and at speeds consistent with 3D cancer cell invasionin other material systems, which report speeds ranging from2–40 μmh−1 5,20,31,32. These data are consistent with the expla-nation that what dictates the speed and distance is the length ofthe channel formed by the invadopodial protrusion. Under thisexplanation, the cells do not migrate until a channel of a sufficientwidth and distance is formed, and then, once such a channel isformed, migrate the length of that channel. The observation thatcell morphology and migration likelihood depend on β1 integrinand Arp 2/3, but migration speed and distance do not, suggeststhat channel formation and migration through the channel maybe decoupled mechanistically. The observation that invadopodiaare utilized in both protease-dependent migration and thisplasticity-mediated mode of protease-independent migrationcould indicate that these modes represent two extremes ofmesenchymal migration. Altogether, these data demonstrate apreviously unreported mode of protease-independent cellmigration through nanoporous matrices that is mediated bymatrix plasticity.
There is strong indication for the in vivo relevance of this newmode of migration. While the mode of migration described herehas not directly been identified in vivo, previous work finding thatinvadopodia can physically displace BM during development inCaenorhabditis elegans33 could be explained by the BM exhibitingplasticity. Direct evidence for this mode of migration in mousemodels is currently missing, as it is challenging to unambiguouslyassess the independent contributions of proteases vs. mechanicalplasticity in mouse models of BM invasion by primary tumors.However, the elevated viscosity of breast tumor tissue that hasbeen observed clinically13, the aberrant cross-linking and matrixarchitectures associated with tumor progression14, and our datarevealing substantial mechanical plasticity of human and mousetumor tissue all point toward the likelihood of both the BM andstromal matrix exhibiting some degree of mechanical plasticityduring breast cancer. As the plasticity levels required for migra-tion are relatively low, with the HP IPNs exhibiting a degree ofplasticity of only 30% in response to a creep stress of 100 Paapplied for 1 h, these findings support the strong likelihood thatplasticity-mediated migration is relevant to breast cancer invasionand migration.
Though our study focused on breast cancer cells, this newmode of invasion and migration could be broadly relevant to andsynergistically act with other modes of migration. This modecould be harnessed by other cells that cross BM during physio-logical processes, such as immune cells34, or aided by other cellsthat infiltrate the tumor microenvironment, such as cancer-associated fibroblasts14,33. Indeed, a recent study found thatcancer-associated fibroblasts can dilate pre-existing gaps in theBM to facilitate carcinoma cells crossing the BM10. Further, thismode of migration may be utilized by cells to migrate throughother confining microenvironments, such as the col-1-rich stro-mal matrix in breast tissue, where collagen density often increasesduring breast cancer progression11,35. In vivo, cells may utilize acombination of degradation and force generation on BM andstromal matrix to synergistically enable robust invasion of con-fining microenvironments, and then transition to a faster ame-boid mode of protease-independent migration as they migrateinto microenvironments with larger pore sizes, enabled by alignedcollagen networks and fiber bundling36,37.
The evidence that HP ECM enables breast cancer cell invasionindependent of proteases in vitro may provide new insight intopoor outcomes of protease inhibition clinical trials. Clinical trialshave generally concluded that broad-spectrum protease inhibitorsemployed therapeutically cause substantial off-target effects andprovide little to no survival benefit to cancer patients38,39. Ourdata support the investigation of pharmacological interventionsthat simultaneously perturb both protease-dependent andprotease-independent invasion processes. For example, it is pos-sible that the combination of a protease inhibitor with an inhi-bitor of a force-generating pathway or protein, such as RhoA,Rac1, or Arp 2/3, may prove to be more effective than proteaseinhibition alone in blocking invasion. Overall, while mechan-obiological studies of invasion and migration to date have focusedon the impact of ECM stiffness and matrix architecture8,40, theseresults establish plasticity, a mechanical property distinct fromstiffness, as an important regulator of cancer cell invasion andmetastasis, adding to our evolving understanding of how cellsnegotiate confining 3D environments.
MethodsMechanical testing of human and MDA-MB-231 tumors. Human breast carci-noma specimens were obtained from the Stanford Tissue Bank. An InternationalReview Board waiver was obtained for these studies, as the specimens were excesstissue not collected for the current research, and were de-identified prior to use.Specimens were stored in serum-free RPMI at 4 °C prior to testing. All animalexperiments were done according to a protocol approved by the institutionalanimal care and use committee. Mammary tumors were induced in 8–10-week-oldNU/NU female mice (Charles River Laboratories). The mice were inoculated with1 × 106 MDA-MB-231 cells, suspended in 50 μL of phosphate-buffered saline(PBS), in the right inguinal mammary gland in proximity to the fourth nipple.
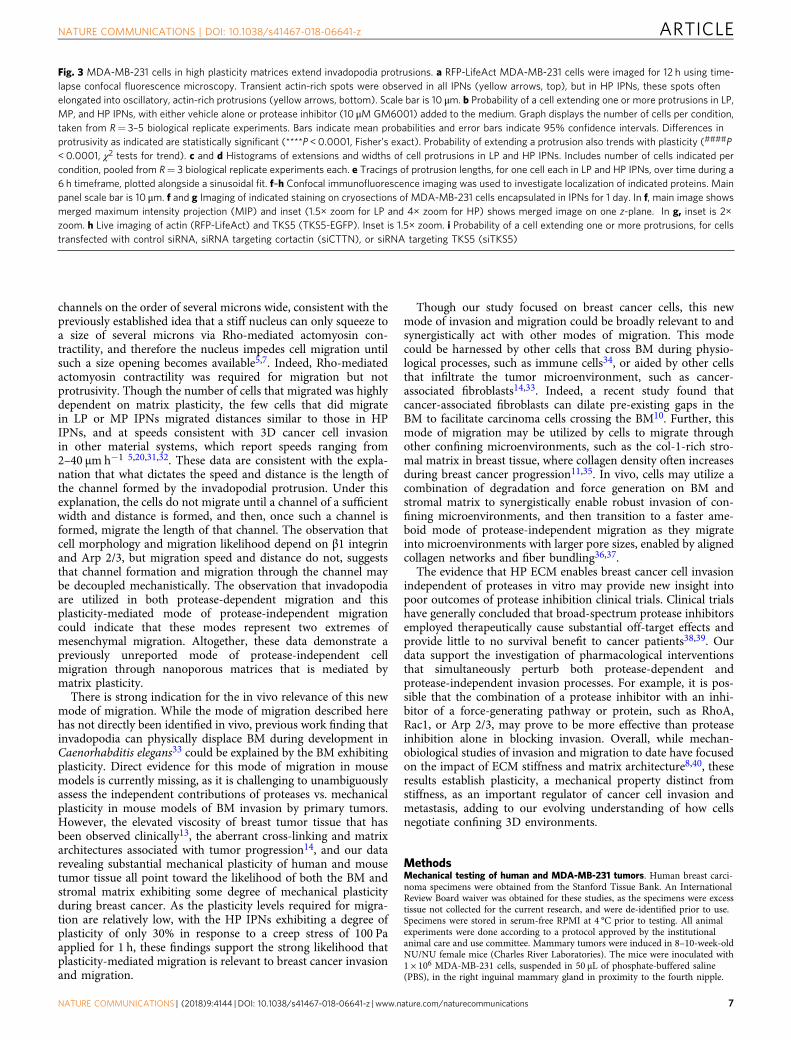
Fig. 3 MDA-MB-231 cells in high plasticity matrices extend invadopodia protrusions. a RFP-LifeAct MDA-MB-231 cells were imaged for 12 h using time-lapse confocal fluorescence microscopy. Transient actin-rich spots were observed in all IPNs (yellow arrows, top), but in HP IPNs, these spots oftenelongated into oscillatory, actin-rich protrusions (yellow arrows, bottom). Scale bar is 10 μm. b Probability of a cell extending one or more protrusions in LP,MP, and HP IPNs, with either vehicle alone or protease inhibitor (10 μM GM6001) added to the medium. Graph displays the number of cells per condition,taken from R= 3–5 biological replicate experiments. Bars indicate mean probabilities and error bars indicate 95% confidence intervals. Differences inprotrusivity as indicated are statistically significant (****P < 0.0001, Fisher’s exact). Probability of extending a protrusion also trends with plasticity (####P< 0.0001, χ2 tests for trend). c and d Histograms of extensions and widths of cell protrusions in LP and HP IPNs. Includes number of cells indicated percondition, pooled from R= 3 biological replicate experiments each. e Tracings of protrusion lengths, for one cell each in LP and HP IPNs, over time during a6 h timeframe, plotted alongside a sinusoidal fit. f–h Confocal immunofluorescence imaging was used to investigate localization of indicated proteins. Mainpanel scale bar is 10 μm. f and g Imaging of indicated staining on cryosections of MDA-MB-231 cells encapsulated in IPNs for 1 day. In f, main image showsmerged maximum intensity projection (MIP) and inset (1.5× zoom for LP and 4× zoom for HP) shows merged image on one z-plane. In g, inset is 2×zoom. h Live imaging of actin (RFP-LifeAct) and TKS5 (TKS5-EGFP). Inset is 1.5× zoom. i Probability of a cell extending one or more protrusions, for cellstransfected with control siRNA, siRNA targeting cortactin (siCTTN), or siRNA targeting TKS5 (siTKS5)
NATURE COMMUNICATIONS | DOI: 10.1038/s41467-018-06641-z ARTICLE
NATURE COMMUNICATIONS | (2018) 9:4144 | DOI: 10.1038/s41467-018-06641-z | www.nature.com/naturecommunications 7
After 21 days, tumors from four separate mice were resected and sectioned into2-mm-thick discs with a 6 mm diameter for mechanical testing.
Tissue mechanical plasticity testing was performed using an Instron 5848material testing system with a 1 N load cell (Futek). Tissue samples were cut into 6mm diameter plugs, submerged in serum-free RPMI medium, and then wereequilibrated to room temperature prior to testing. For mechanical testing,unconfined compression indentations of ~40% of the specimen thickness, at a
normalized strain rate of 0.5 mmmin−1, were applied while the plug wassubmerged in serum-free RPMI. For human tumor tissue testing, a 4 mm indenterwas used to apply repeated indentations that were held for 1 h and allowed torecover for 1 h. For MDA-MB-231 tumor tissue testing, a 1.5 mm indenter wasused to apply repeated indentations that were held for 1 h and allowed to recoverfor 2 h. Because the initial point of contact could be difficult to determine fromforce vs. indentation curves for the tissue plug, indentation depth at 25% of the
b
c
d
0 h 50 m0 h 00 m
Dis
plac
emen
t (μm
)
0.50.450.40.350.30.250.20.150.10.05
0 h 00 m
Dis
plac
emen
t (μm
)
21.81.61.41.210.80.60.40.2
0 h 30 m
e
Migration direction
Cell centroid
Average matrixdisplacement field
1 μm
Position (μm)
Pos
ition
(µm
)
–20 0 20 40
40
20
0
–20
–40
g
h i
fMIP RFP-actin MIP fluorescein
alginate MIP merge
Matrixdensification
HP MP LP0.0
0.5
1.0
1.5
2.0
2.5
Max
. dis
plac
emen
ts (
μm)
ns ns
Migrating or stationary cells
A
BRFP Actin + fluorescein alginate merge
HP IPN
IgG
mAB β1
Int
Wat
er
NSC2376
6
Y-276
32
DMSO
CK-666
Latru
nculi
n-a
Blebbis
tatin
0
1
2
3
4
Max
. dis
plac
emen
ts (
μm)
ns ns ns
******
Migrating or stationary cells
ns
a
IgG
β1 In
t Inh
ibdH
20
NSC2376
6
Y-276
32
DMSO
CK-666
DMSO
Blebbis
tatin
Latru
nculi
n-a
0.0
0.1
0.2
0.3
0.4
Pro
babi
lity
of c
ell m
igra
tion
******** ****ns
**** **327
224
185
206369
246 264282
210 172
0 5 10 150
20
40
60
Distance acrosschannel width (μm)
Inte
nsity
(a.
u.)
0
20
40
60
Inte
nsity
(a.
u.)
0 5 10 15
Distance across channel width (μm)
0 5 10 15 0 5 10 15
Cells alive After cell lysis and actin network depolymerization
2.2 μm 2.1 μm 2.3 μm 2.6 μm
A B A B A B A B
A
BA B
A
B
ARTICLE NATURE COMMUNICATIONS | DOI: 10.1038/s41467-018-06641-z
8 NATURE COMMUNICATIONS | (2018) 9:4144 | DOI: 10.1038/s41467-018-06641-z | www.nature.com/naturecommunications
initial peak force was used to evaluate the indentation plasticity betweenindentation cycles. Peak forces were also compared between successive indentationcycles.
Alginate preparation. Sodium alginate rich in guluronic acid blocks and with ahigh-MW (FMC Biopolymer, Protanal LF 20/40, High-MW, 280 kDa) was pre-pared41. High-MW was irradiated 3 or 8 Mrad (3 or 8 × 10⁶ rad) by a cobalt sourceto produce mid-MW (70 kDa) and low-MW (35 kDa) alginates16. Fluorescein-coupled alginate was prepared by coupling fluoresceinamine isomer (AcrosOrganics) to the alginates using carbodiimide chemistry at a concentration of37.74 μM. Alginate was dialyzed against deionized water for 3–4 days (MW cutoffof 3500 Da), treated with activated charcoal, sterile-filtered, lyophilized, and then
reconstituted in serum-free Dulbecco's modified Eagle's medium (DMEM) (LifeTechnologies).
For preparation of Low-MW RGD-alginate, oligopeptide GGGGRGDSP(Peptide 2.0) was coupled to the Low-MW (35 kDa) alginate using standardcarbodiimide chemistry42. In a typical reaction, 1 g of alginate was reconstituted at1% wt vol−1 in MES (2-(N-morpholino)ethanesulfonic acid) buffer (0.1 M MES,0.3 M NaCl, pH 6.5). For 1% wt vol−1 alginate IPNs containing 750 μM RGD, thefollowing procedure was used: 35.9 mg of sulfo-NHS (Thermo Fisher Scientific),63.47 mg of N-(3-dimethylaminopropyl)-N′-ethylcarbodiimide (Sigma) and 56.8mg of peptide were added, and then the reaction proceeded for 20 h beforequenching with hydroxylamine hydrochloride (Sigma). Alginate was thendialyzed, charcoal-treated, sterile-filtered, lyophilized, and reconstituted asdescribed above.
Tim
e
NEW MODE
Squeezing throughmicoscale pores
Physical widening of pores,mediated by matrix plasticity
Pore size
Proteasesrequired?
Cell > Pore > 3 μm Pore < 3 μm Pore < 3 μm
YesNo No
Mechanical force
Protease degradationSqueezing
ESTABLISHED MODES OF CONFINED MIGRATION
Matrix degradationby proteases
Invadopodia
Final protrusion
Mechanical force
Retraction
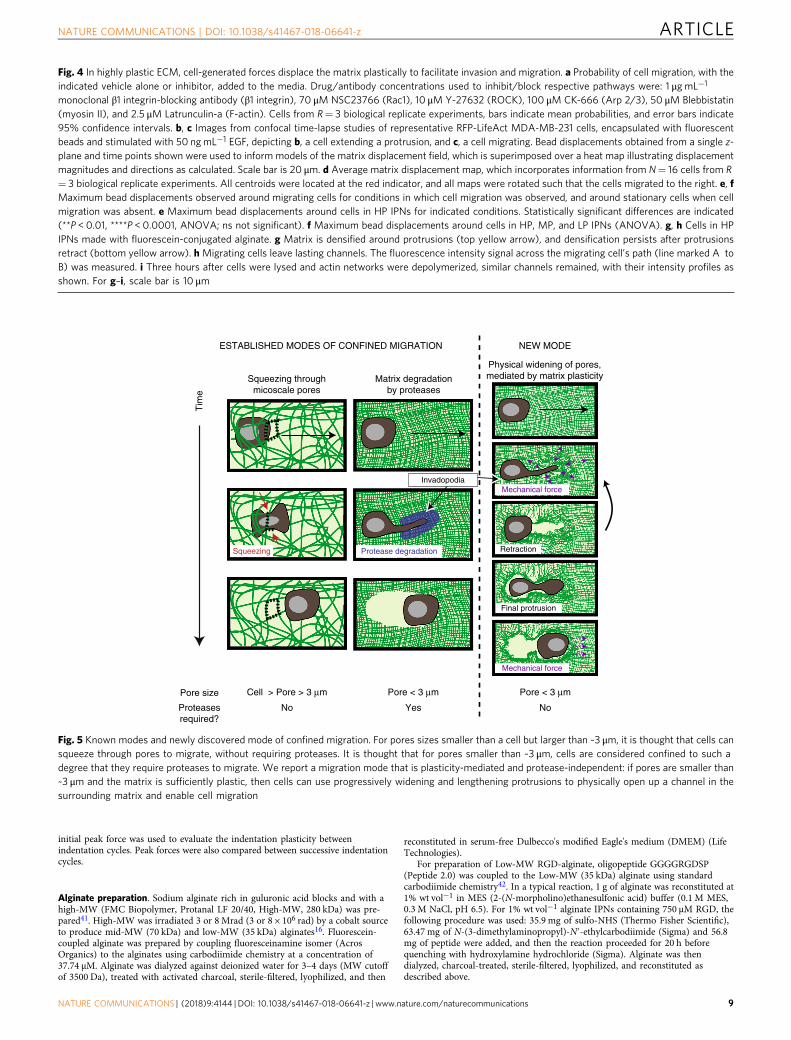
Fig. 5 Known modes and newly discovered mode of confined migration. For pores sizes smaller than a cell but larger than ~3 μm, it is thought that cells cansqueeze through pores to migrate, without requiring proteases. It is thought that for pores smaller than ~3 μm, cells are considered confined to such adegree that they require proteases to migrate. We report a migration mode that is plasticity-mediated and protease-independent: if pores are smaller than~3 μm and the matrix is sufficiently plastic, then cells can use progressively widening and lengthening protrusions to physically open up a channel in thesurrounding matrix and enable cell migration
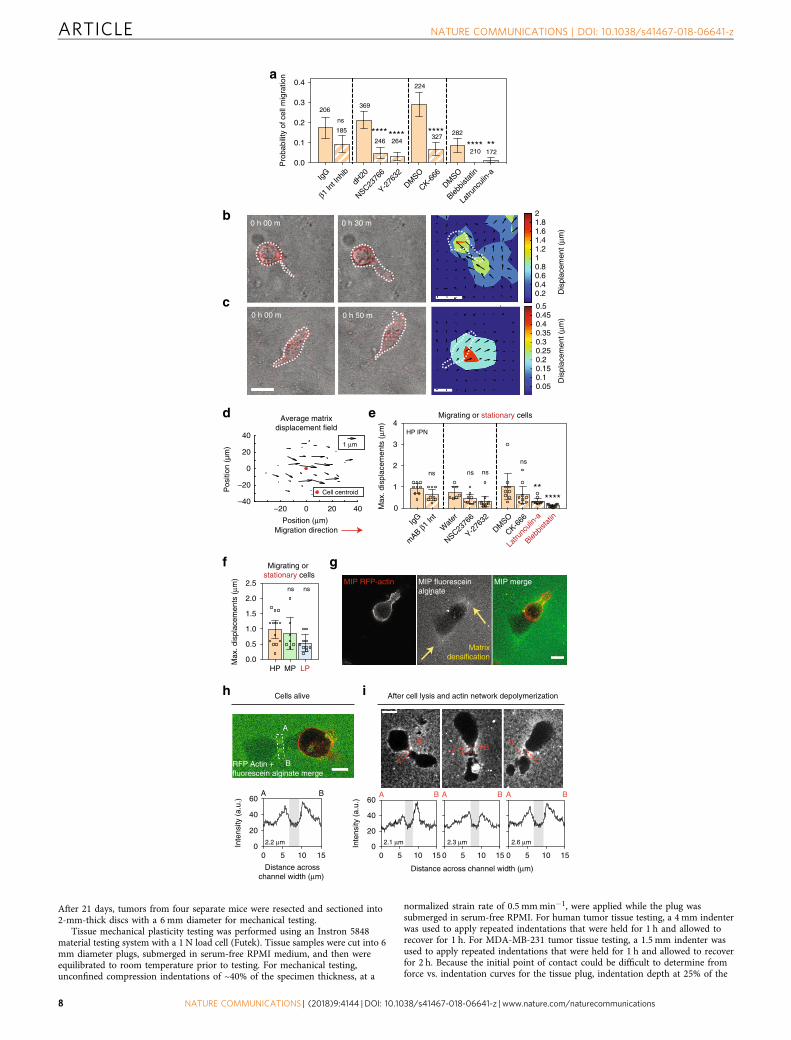
Fig. 4 In highly plastic ECM, cell-generated forces displace the matrix plastically to facilitate invasion and migration. a Probability of cell migration, with theindicated vehicle alone or inhibitor, added to the media. Drug/antibody concentrations used to inhibit/block respective pathways were: 1 μg mL−1
monoclonal β1 integrin-blocking antibody (β1 integrin), 70 μM NSC23766 (Rac1), 10 μM Y-27632 (ROCK), 100 μM CK-666 (Arp 2/3), 50 μM Blebbistatin(myosin II), and 2.5 μM Latrunculin-a (F-actin). Cells from R= 3 biological replicate experiments, bars indicate mean probabilities, and error bars indicate95% confidence intervals. b, c Images from confocal time-lapse studies of representative RFP-LifeAct MDA-MB-231 cells, encapsulated with fluorescentbeads and stimulated with 50 ngmL−1 EGF, depicting b, a cell extending a protrusion, and c, a cell migrating. Bead displacements obtained from a single z-plane and time points shown were used to inform models of the matrix displacement field, which is superimposed over a heat map illustrating displacementmagnitudes and directions as calculated. Scale bar is 20 μm. d Average matrix displacement map, which incorporates information from N= 16 cells from R= 3 biological replicate experiments. All centroids were located at the red indicator, and all maps were rotated such that the cells migrated to the right. e, fMaximum bead displacements observed around migrating cells for conditions in which cell migration was observed, and around stationary cells when cellmigration was absent. e Maximum bead displacements around cells in HP IPNs for indicated conditions. Statistically significant differences are indicated(**P < 0.01, ****P < 0.0001, ANOVA; ns not significant). f Maximum bead displacements around cells in HP, MP, and LP IPNs (ANOVA). g, h Cells in HPIPNs made with fluorescein-conjugated alginate. g Matrix is densified around protrusions (top yellow arrow), and densification persists after protrusionsretract (bottom yellow arrow). h Migrating cells leave lasting channels. The fluorescence intensity signal across the migrating cell’s path (line marked A toB) was measured. i Three hours after cells were lysed and actin networks were depolymerized, similar channels remained, with their intensity profiles asshown. For g–i, scale bar is 10 μm
NATURE COMMUNICATIONS | DOI: 10.1038/s41467-018-06641-z ARTICLE
NATURE COMMUNICATIONS | (2018) 9:4144 | DOI: 10.1038/s41467-018-06641-z | www.nature.com/naturecommunications 9
Mechanical characterization of IPNs. Rheology measurements were made withan AR2000EX stress-controlled rheometer (TA Instruments). IPNs, which weremade for mechanical testing, were deposited directly onto the bottom plate of therheometer immediately after mixing with cross-linker. A 25 mm flat plate was thenimmediately brought down, forming a 25 mm disk of gel. Mineral oil (Sigma) wasapplied to the edges of the gel disk to prevent dry-out. The mechanical propertieswere then measured over time until the storage modulus reached an equilibriumvalue. The storage and loss moduli at 1 rad s−1 and 1% strain, a frequency andamplitude which were both within linear regimes, were recorded periodically for atleast 2 h. Elastic moduli (i.e., Young’s moduli) were calculated assuming a Poisson’sratio of 0.5 using the equation:
E ¼ 2 1þ vð ÞG�; ð1Þ
where G* is the complex modulus found using the storage and loss moduli mea-sured, calculated using
G� ¼ ðG′2 þ G′′2Þ1=2: ð2Þ
For plasticity experiments, this time sweep was followed by a creep-recoverytest. This involved first applying a constant shear stress (10, 50, 100, or 150 Pa) for1 h, while strain was recorded as a function of time. Then, the sample was unloaded(0 Pa) and strain was recorded as a function of time as the sample recovered fromthe absence of load for 6400 s (1.7 h). This recovery time period was sufficient tominimize transient effects due to stress unloading, and was on the same time scaleas the periodic structures and migration events observed in this study. To establishthat the hydrogels behave as viscoelastic solids over time scales relevant to thesecellular behaviors, additional stress relaxation tests at low strain (5% strain) wereconducted.
Interpenetration characterization of IPNs. To confirm interpenetration of rBMand alginate networks, fluorescence microscopy of IPNs formed withfluoresceinamine-coupled alginate were performed. Gels were imaged 1 day afterformation, using a Leica SP8 confocal microscope and a Leica HC PL APO ×63/1.4NA oil immersion objective. ImageJ (US National Institutes of Health, Bethesda,MD, USA, https://imagej.nih.gov/ij/, 1997–2016) was used to measure the fluor-escence intensity of all pixels in 10 images of each of the three separate IPNs.Intensity values were then displayed as histograms. The single-peaked and narrowfluorescence intensity histograms indicate that the alginate is present in each pixel,and thus that the alginate and rBM networks are interpenetrating, within theresolution of images taken (~200 nm). Resolution was quantified using the Rayleigh
criterion, where resolution is estimated as λ 2 ´NAobj
� �−1.
Pore size estimation of IPNs. To determine the approximate pore size of the IPNhydrogels, gold nanospheres of various sizes pre-coated with 2 kDa PEG (Nano-Hybrids, Austin, TX, USA) were encapsulated into all IPN hydrogels15. Phenol red-free DMEM with 1% penicillin/streptomycin (Pen/Strep) was added on top of thehydrogels, and samples were incubated at 37 °C and 5% CO2. Samples were takenout of the incubator and gently shaken for 10 min every 1–2 days. After 4 days, thefinal supernatant volume was quantified, and the supernatant absorbance wasmeasured using a plate reader. The particle concentration was calculated using theabsorbance at the provided batch-specific wavelength of maximum absorbance.The relative diffusion of the particles out of the IPNs was estimated using thepartition coefficient. The partition coefficient was then quantified as the con-centration of particles in the supernatant divided by the concentration of particlesremaining in the hydrogel, which was approximated using both the concentrationof nanoparticles originally encapsulated and the concentration of nanoparticlesdetected in the supernatant post-diffusion. A partition coefficient of 1 indicatesequal concentration of nanoparticles in the hydrogel and the supernatant; a par-tition coefficient close to zero indicates that particles remain trapped in thehydrogel. The estimation of a pore size of <40 nm is consistent with a previousstudy, which estimated the pore size of a similar IPN formulation, though one witha lower concentration of alginate, to be ~30 nm by measuring the diffusion coef-ficient of molecules with a known MW15.
Cell culture. Human breast adenocarcinoma cells MDA-MB-231 (ATCC), invasiveductal carcinoma cells MCF7 (ATCC), and fibrosarcoma cells HT-1080 (ATCC)were cultured in high glucose DMEM (Hyclone) with 10% fetal bovine serum(FBS) (Hyclone) and 1% Pen/Strep (Life Technologies). Mouse metastatic breastcancer cells 4T1 (ATCC) were cultured in RPMI (Hyclone) with 10% FBS and 1%Pen/Strep. All cells were cultured at 37 °C in 5% CO2. MDA-MB-231 cells werestably transfected to express RFP-LifeAct using a Piggybac vector construct withGeneticin resistance (gift from A. Dunn). Cells were transfected with expressionconstructs using Lipofectamine (Invitrogen). Cells were analyzed after 24 h oftransfection. The MDA-MB-231 cells stably expressing RFP-LifeAct were selectedwith 800 μg mL−1 G418 and clones were expanded. RFP-LifeAct MDA-MB-231cells were transiently transfected to express TKS5-EGFP using Polyjet43 (SignaGenLaboratories). MDA-MB-231, MCF7, and HT-1080 cells were authenticated by theATCC and tested to be mycoplasma negative.
For CTTN and TKS5 (SH3PXD2A) knockdowns, MDA-MB-231 cells stablyexpressing LifeAct-RFP were transfected with 50 nM CTTN small interfering RNA(siRNA) SMARTpool (cat. #M-010508-00-0005; Dharmacon), SH3PXD2A siRNASMARTpool (cat. #M-006657-02-0005; Dharmacon), or ON-TARGETplus Non-Targeting Control Pool (cat. #D-001810-10-05; Dharmacon) using DharmaFECT 1Transfection Reagent (cat. #T-2001-01; Dharmacon). Seventy-two hours followingtransfection, cells were assayed for knockdown by Western blot and imaged forprotrusions. For Western blotting, MDA-MB-231::LifeAct-RFP/siRNA cells wereharvested and centrifuged at 500 × g for 5 min. Cell pellets were washed withserum-containing growth medium to neutralize trypsin and washed with PBS. Forsodium dodecyl sulfate-polyacrylamide gel electrophoresis of whole cell lysates,cells were lysed in Pierce RIPA buffer (cat. #89900; Thermo Fisher Scientific)supplemented with Protease Inhibitor Cocktail Tablets (cat. #11836170001; Roche)and PhosSTOP Phosphatase Inhibitor Cocktail Tablets (cat. #04906845001; Roche)according to the manufacturer’s instructions. Protein concentration wasdetermined using the Pierce BCA Protein Assay Kit (cat. #23227; Thermo FisherScientific). Laemmli sample buffer (cat. #1610747; Bio-Rad) was added to lysatesand samples boiled for 10 min before loading 25 µg protein in each lane of a4–15%, 15-well, gradient gel (cat. # 4561086; Bio-Rad). Proteins were transferred tonitrocellulose at 100 V for 45 min, blocked with 5% milk in TBS-T (137 mM NaCl,2.7 mM KCl, 19 mM Tris base, 0.1% Tween, pH 7.4), incubated overnight inprimary antibodies against CTTN (1:1000; cat. #ab33333; Abcam) and SH3PXD2A(1:200; cat. #sc-376211; Santa Cruz Biotechnology), and p38 (1:2000; cat. #sc-535;Santa Cruz Biotechnology) was used as a loading control. Blots were incubated inIRDye 680-conjugated or 800-conjugated secondary antibodies (Li-CORBiotechnology) for 1 h and visualized using with the Li-COR Odyssey imagingsystem (Li-COR Biotechnology). Quantitative analysis of western blots wasperformed using the Li-COR Odyssey software (LI-COR Biotechnology).
3D cell encapsulation in IPNs. For analysis of invasive morphology, all cancercells (MDA-MB-231, HT-1080, 4T1, and MCF7) were starved overnight in serum-free medium and encapsulated in IPNs. In brief, cells in flasks were starvedovernight prior to encapsulation15,44. They were then washed with PBS, trypsinizedusing 0.05% trypsin/EDTA, washed once, centrifuged, and resuspended in serum-free medium. The concentration of cells was determined using a Vi-Cell Coultercounter (Beckman Coulter). After Matrigel was mixed with alginate, cells wereadded into this polymer mixture and deposited into a cooled syringe. The solutionwas then vigorously mixed with a solution containing CaSO4 and deposited intowells of a chambered coverglass (LabTek). The final concentration of cells was0.5 × 106 cells mL−1 of IPN. The cell-laden hydrogels gelled in an incubator at 37 °C and 5% CO2 for 35–45 min, and then were stimulated with medium containing10% FBS and 50 ng mL−1 EGF. After one day, bright field microscopy was used tocapture cell morphologies.
For time-lapse studies using RFP-LifeAct MDA-MB-231 cells in IPNs, aprocedure similar to above was used. For migration studies, cells were encapsulatedin IPNs at a concentration of 2 × 10⁶ cells mL−1 of IPN. After IPN gelation,FluoroBrite starvation medium was added: FluoroBrite (Thermo Fisher Scientific)supplemented with GlutaMAX (Thermo Fisher Scientific) and 1% Pen/Strep, withvehicle alone or inhibitor. One day later, starvation medium was removed; 60 μL ofa 0.75% agarose (Sigma) hydrogel was added to each well to hold the IPN in place;and FluoroBrite invasion medium was added (FluoroBrite supplemented withGlutaMAX, 1% Pen/Strep, 15% FBS, 50 ng mL−1 EGF, and either vehicle orinhibitor). Cells were then imaged live in an incubated chamber (37 °C and 5%CO2) at 10 min (protease inhibitor studies) or 20 min (all other inhibitor studies)intervals with a Leica HCX PL APO ×10/0.40 NA objective overnight. For studiesimaging RFP-LifeAct MDA-MB-231 protrusion dynamics, a similar procedure wasfollowed, except for the following changes: the final concentration of RFP-LifeActcells was 1.5 × 10⁶ cells mL−1 of IPN; cells were fed with FluoroBrite invasionmedium (containing 10% FBS and 50 ng mL−1 EGF) immediately afterencapsulation; and cells were live imaged at 5 min intervals with a Leica HCFLUOTAR L ×25/0.95 water immersion objective. For time-lapse studies used todetermine matrix displacement fields, RFP-LifeAct MDA-MB-231 cells wereencapsulated with 0.2 μm fluorescent microspheres (Thermo Fisher Scientific) at adensity of 1.6 × 10¹² beads mL−1 31. For matrix visualization studies, RFP-LifeActMDA-MB-231 cells were encapsulated in IPNs formed using fluorescein-conjugated alginate, and imaged using a Leica HC PL APO ×63/1.4 NA oilimmersion objective. For matrix visualization studies after cell lysis, hydrogels wereadditionally incubated in medium containing 1% Triton X-100 and 50 μMcytochalasin D for 3 h prior to imaging the hydrogels.
For studies using cells transfected with TKS5-EGFP or siRNA studies (siCTTN,siTKS5, or siControl), a similar time-lapse procedure was followed. Cells wereexpanded for 1 day (TKS5-EGFP) or 2 days (siRNA studies) in complete growthmedium. Cells were then encapsulated in IPNs at a concentration 0.8 × 10⁶ cells mL−1 (TKS5-EGFP) or 2 × 10⁶ cells mL−1 (siRNA studies). Then, cells were starvedovernight in FluoroBrite starvation medium. Prior to imaging, starvation mediumwas removed; 60 μL of a 0.75% agarose (Sigma); and then FluoroBrite invasionmedium (FluoroBrite supplemented with GlutaMAX, 1% Pen/Strep, 15% FBS, and50 ng mL−1 EGF) was added to each well. Cells were live imaged in an incubatedchamber (37 °C and 5% CO2) with a Leica HCX PL APO ×10/0.40 CS objective.
We note that control conditions were included in each and every time-lapseexperiment alongside the relevant experimental conditions. The mark-and-find
ARTICLE NATURE COMMUNICATIONS | DOI: 10.1038/s41467-018-06641-z
10 NATURE COMMUNICATIONS | (2018) 9:4144 | DOI: 10.1038/s41467-018-06641-z | www.nature.com/naturecommunications
feature of the Leica software was used to image multiple samples at every timepoint. This approach provided internal controls for cell passage number andenvironmental conditions within each individual experiment.
Modified Boyden chamber invasion assay. An adapted Boyden chamber inva-sion assay was used. MDA-MB-231 cells were starved overnight in serum-freeDMEM. IPN hydrogels were deposited on top of a Snapwell insert (Corning®
Costar®) and gelled for 35–45 min at 37 °C in 5% CO2. Cells were washed with PBS,trypsinized using 0.05% trypsin/EDTA (Life Technologies), washed with serum-free DMEM, centrifuged, and resuspended in serum-free medium. Cells (105) wereplated on top of the IPN in serum-free medium. Chemoattractant medium con-taining 10% FBS and 50 ng mL−1 EGF was placed at the bottom of the chamber.Chemoattractant medium was replaced, and the plate was gently shaken on anorbital shaker every 1–2 days for 9 days. Hydrogels were then prepared forimmunohistochemistry as described below, and then imaged using confocalimmunofluorescence.
Gelatin degradation assay. Alexa-405 NHS-ester (Invitrogen) was conjugated to0.2% porcine gelatin (Sigma) in PBS following the manufacturer’s protocols.Twenty-five millimeter, #1.5 circular glass coverslips (Warner) were coated with athin layer of fluorescent gelatin45. Briefly, coverslips were first coated with poly-L-lysine (50 µg mL−1) for 20 min, washed three times with PBS, and then incubatedwith 0.02% glutaraldehyde in PBS for 15 min, then washed three times with PBS,and finally incubated with pre-warmed (37 °C) fluorescently labeled gelatin for 10min. Coverslips were washed three times in PBS followed by quenching of glu-taraldehyde using 5 mgmL−1 solution of sodium borohydride (Sigma) for 15 min.Coverslips were washed three times in PBS and kept in 35 mm cell culture dishes inPBS containing penicillin (100 IUmL−1) and streptomycin (100 µg mL−1) at 4 °Cuntil use. Prior to plating cells, dishes containing coverslips were pre-incubated innormal culture medium for 30 min. Cells were plated at a density of 1 × 10⁵ onthese coverslips, either with 10 µM GM6001 in dimethyl sulfoxide (DMSO) orDMSO vehicle alone (final DMSO concentration was 0.04%), for 16 h at normalcell culture conditions. Cells were fixed in 3.7% paraformaldehyde, permeabilizedwith 0.3% Triton X-100, and stained for CTTN (mouse; Abcam ab33333) andTKS5 (rabbit; Santa Cruz M-300). Gelatin degradation was measured by quanti-fying the average area of non-fluorescent pixels per field using a manual thresholdin ImageJ. Twenty random fields were imaged per condition per experiment, andeach independent experiment was performed three times. Invadopodia wereidentified by co-staining with CTTN and TKS5 antibodies and manually countedfrom images.
3D migration control studies. To verify that alginate is not degraded in ourstudies, cells were encapsulated into 1% alginate hydrogels at a concentration of2 × 106 cells mL−1. Half of the samples were immediately placed into micro-centrifuge tubes, frozen, and lyophilized, and the other half of the samples werecultured for one day in FluoroBrite starvation medium, and then for another day ininvasion medium containing 50 ng mL−1 EGF, similar to the procedure for time-lapse 3D invasion assays in IPNs. The second half of the samples were then placedin microcentrifuge tubes, frozen, and lyophilized. After samples were fully freeze-dried (2–3 days), they were weighed.
To control for the effect of soluble calcium on the migratory ability of RFP-LifeAct MDA-MB-231, cells were seeded in 4.0 mgmL−1 collagen at aconcentration of 1.5 × 10⁶ after an overnight serum-free FluoroBrite starvationmedium. After collagen gelation, FluoroBrite was supplemented with GlutaMAXand 1% Pen/Strep with 0, 9, or 21 mM of calcium. While these are the sameconcentrations of calcium used to crosslink the LP and HP IPNs, we note that thesoluble calcium is likely lower in the IPNs. Cells were then stimulated with invasionmedium containing 50 ng mL−1 EGF and imaged live in an incubated chamber(37 °C and 5% CO2) at 20 min intervals with a Leica HCX PL APO ×10/0.40 NAobjective overnight.
To determine the importance of the rBM component of the IPNs, RFP-LifeActMDA-MB-231 cells were encapsulated in 1% wt vol−1 RGD-alginate hydrogels at aconcentration of 2 × 10⁶ cells mL−1. Cells were imaged live in an incubatedchamber (37 °C and 5% CO2) at 20 min intervals with a Leica HCX PL APO ×10/0.40 NA objective overnight.
To analyze the effect of matrix metalloproteinase (MMP) inhibitors on themigration of RFP-LifeAct MDA-MB-231 in collagen and rBM gels, cells wereencapsulated in collagen or rBM gels with or without protease inhibitor. Collagengels were prepared using High Concentration Rat Tail Collagen (Corning, Product#354249) according to the manufacturer’s protocol. Because this commerciallyavailable collagen-1 product does not contain intact telopeptides, the collagen-1hydrogel is not covalently cross-linked. The collagen solution was adjusted to thedesired pH with NaOH and mixed with 10x PBS to the desired concentration of4.0 mg mL−1. Cells were encapsulated at a concentration of 1.5 × 10⁶ cells mL−1 in4.0 mg mL−1 collagen gels46 or in 8 mgmL−1 rBM. After gelation, FluoroBritemedium with drug was added: FluoroBrite (Thermo Fisher Scientific)supplemented with GlutaMAX (Thermo Fisher Scientific), 1% Pen/Strep, 10% FBS,50 ng mL−1 EGF, and with vehicle alone (DMSO), 10 µM GM6001, 25 µMGM6001, or 100 µM Marimastat (Tocris). Cells were imaged live in an incubated
chamber (37 °C and 5% CO2) at 20 min intervals with a Leica HCX PL APO ×10/0.40 NA objective overnight.
Inhibitors. Inhibitors were implemented in invasive morphology and/or migrationassays at concentrations as follows: 10 μM GM6001 (Millipore) or 100 μM mar-imastat (Tocris) to broadly inhibit MMPs; 70 μM NSC23766 to inhibit Rac1(Tocris); 10 μM Y-27632 to inhibit ROCK (Sigma); 100 μM CK-666 to inhibit Arp2/3 (Sigma); 1 μg mL−1 monoclonal β1 integrin-blocking antibody (Abcam, P5D2);50 μM Blebbistatin (Abcam); and 2.5 μM Latrunculin-a (Tocris). Vehicle-alonecontrols for these inhibitors were as follows: DMSO for GM6001, Marimastat, CK-666, Blebbistatin, and Latrunculin-a; deionized water for NSC23766 and Y-27632;and IgG nonspecific antibody (Sigma, I5381) for β1 integrin-blocking antibody. Allinhibitor concentrations followed those used in similar studies: GM60016,47,Marimastat48, NSC2376615, Y-2763242, CK-66649, β1 integrin-blocking antibody42,Blebbistatin31,50, and Latrunculin-a50. Drug concentrations were also verified in-house using gelatin degradation assays and traction force microscopy experiments(described elsewhere in Methods).
Immunohistochemistry. Preparation of gels: For immunohistochemical staining,media were first removed from the gels. The gels were washed once with serum-free DMEM, and then fixed with 4% paraformaldehyde in serum-free DMEM atroom temperature for 45–60 min. The gels were then washed three times in PBScontaining calcium (cPBS), and then incubated in 30% sucrose in cPBS at 4 °C. Thegels were then placed in a mix, which contained 50% of a 30% sucrose in cPBSsolution, and the other 50% was OCT (Tissue-Tek), for at least 1 day. The mediawere then removed, the gels were embedded in OCT, and the gels were frozen. Thefrozen gels were sectioned and stained following standard immunohistochemistryprotocols.
Staining sections: The following antibodies and reagents were used forimmunohistochemistry: anti-paxillin antibody (1:300; Abcam, Y113), anti-β1integrin (1:300; Abcam, P5D2), and anti-CTTN (1:300; Abcam, ab33333). Negativecontrols, where the secondary antibody was added but the primary antibody wasnot, were conducted to ensure specificity of all stains. Matching secondaryantibodies were purchased from Life Technologies. Alexa Fluor 488 phalloidin (LifeTechnologies, dilutions of 1:50 for β1 integrin/paxillin co-stain and 1:60 for CTTNco-stain) was used to label the actin cytoskeleton, and DAPI (4′,6-diamidino-2-phenylindole) was used to label the nucleus. Fast Green (Sigma), a compound thatstains matrix nonspecifically and fluoresces in the near infrared, was used as anonspecific matrix stain in the adapted Boyden Chamber Invasion assays. The IPNborder was identified by thresholding the Fast Green emission signal (red) intensityusing ImageJ. ProLong Gold antifade reagent (Life Technologies) was used tominimize photobleaching. Images were acquired using a Leica HC PL APO ×63/1.4NA oil immersion objective.
Image analysis. To quantify morphology of cancer cells, ImageJ was used tomanually segment images and to calculate cell circularity, 4π ´ area ðperimeter�2Þ,whereby 1 indicates a perfect circle, for regions of interest. For migration studies,the centroids of RFP-LifeAct MDA-MB-231 cells were tracked over time using anautomated surfaces analysis algorithm in Imaris (Bitplane). Cells that were poorlysegmented or present within voids created by dissipated air bubbles were excludedfrom the analysis. A custom MATLAB script was used to reconstruct cell tracks in3D and identify cells that displaced greater than one average cell radius for thesestudies (~14 μm). ImageJ was also used to identify and characterize length andwidth of protrusions. MATLAB was used to fit protrusion extension distances overtime to sinusoids. For matrix densification visualization, ImageJ was used to obtainthe signal intensity profile across a cell migration channel, averaged over 10 pixels(cell alive) or 5 pixels (cells lysed) in width. Imaris was used to invert and generate3D renderings of migration channel z-stacks.
For matrix displacement maps, the procedure to convert bead displacementmeasurements to matrix displacement fields followed established approaches31.While a full 3D matrix displacement analysis would be ideal in order to analyzematrix displacements completely surrounding the cell, this analysis incorporatedinformation from a single z-plane for computational tractability. In brief, cell andbead channel images from a single z-plane were corrected for drift using the ImageJplugin StackReg. Then, the particle image velocimetry (PIV) ImageJ plugin wasused to perform a PIV analysis on the beads, which involved correlating images attime points of interest using a cross-correlation window of 64 pixels. Mesh sizes forthis analysis were manually chosen depending on the local bead concentration.This PIV analysis produced a vector field of matrix displacements. CustomMATLAB code was used to display the output as a vector field and as a heat map.In the case of inhibitors with non-motile cells in the HP IPN condition,representative, live cells with stable protrusions, which created observable beaddisplacement, were used for the analysis. The same rationale was used for analyzingnon-motile cells in the MP IPN and LP IPN conditions.
For the HP IPN control condition, 16 vector field maps were included in theaverage matrix displacement map shown in Fig. 4c. This procedure began by usingImageJ to calculate the cell centroids, based on thresholded fluorescent images ofthe actin cytoskeleton of the cell. Then, displacement vectors were collected thatwere within a cutoff radius of ~20 μm away from the cell centroid, as this radiuswas observed to both capture local matrix deformations and minimize noise due to
NATURE COMMUNICATIONS | DOI: 10.1038/s41467-018-06641-z ARTICLE
NATURE COMMUNICATIONS | (2018) 9:4144 | DOI: 10.1038/s41467-018-06641-z | www.nature.com/naturecommunications 11
other surrounding cells. The cell centroids were translated to a common origin, andthen cell outlines and displacement vector fields were rotated such that the cellmigration vector was aligned horizontally to the right. Matrix displacement vectorsfrom the 16 cells were binned using a 2D grid, summed within each 10 μm× 10 μmgrid space, and the vector magnitudes were divided by the number of cells includedin the analysis to create an average vector field.
Finite element analysis to estimate mechanical stress. The hydrogels used inthis work are viscoelastic, and exhibit creep, or an increase in strain over time,beyond an initial elastic strain under a constant stress (Fig. 1j and SupplementaryFig. 2c). As such, the relationship between stress and strain is time-dependent, andmatrix stresses can in general not be calculated from matrix strains using tradi-tional approaches. However, it is noted that the creep of the hydrogels results inlarger strains than would be observed in elastic materials with the identical elasticmodulus. Therefore, if the hydrogel is assumed to be elastic, stresses calculatedusing traditional approaches provide an upper bound on the actual stress generatedon hydrogel, or a maximum possible stress.
Based on the experimentally obtained matrix displacement maps on single z-planes and the assumption of elasticity, the finite element method was applied toestimate the maximum stress generated on the hydrogels51. After determining in-plane strain fields, and making the assumption that strains related to z-axis arenegligible, the stress field is calculated using generalized Hooke’s law, or
σij ¼E
ð1þ vÞ εij þvE
ð1þ vÞð1� 2vÞ εkkδij; i; j; k ¼ 1; 2; 3; ð3Þ
where E and v are elastic modulus and Poisson ratio, respectively. Elastic moduliwere determined as the experimentally measured value of ~2 kPa, and the Poissonratio is chosen as 0.49, as assumed in previous studies52. After calculating the stresstensor, the principal stress was calculated and reported to show the maximal stress.
Statistics. Statistical analyses were performed using the GraphPad Prism andMATLAB. P values provided in figure legends have been corrected for multiplecomparisons, where relevant. Additional information about statistical tests per-formed in these studies has been provided in Supplementary Tables 2 and 3.
Data availabilityAll relevant data from this manuscript are available upon request.
Received: 4 April 2018 Accepted: 18 September 2018
References1. Rowe, R. G. & Weiss, S. J. Breaching the basement membrane: who, when and
how? Trends Cell Biol. 18, 560–574 (2008).2. Leong, H. S. et al. Invadopodia are required for cancer cell extravasation and
are a therapeutic target for metastasis. Cell Rep. 8, 1558–1570 (2014).3. Murphy, D. A. & Courtneidge, S. A. The ‘ins’ and ‘outs’ of podosomes and
invadopodia: characteristics, formation and function. Nat. Rev. Mol. Cell. Biol.12, 413–426 (2011).
4. Eddy, R. J., Weidmann, M. D., Sharma, V. P. & Condeelis, J. S. Tumor cellinvadopodia: invasive protrusions that orchestrate metastasis. Trends Cell Biol.27, 595–607 (2017).
5. Wolf, K. et al. Physical limits of cell migration: control by ECM space andnuclear deformation and tuning by proteolysis and traction force. J. Cell Biol.201, 1069–1084 (2013).
6. Sabeh, F., Shimizu-Hirota, R. & Weiss, S. J. Protease-dependent versus-independent cancer cell invasion programs: three-dimensional amoeboidmovement revisited. J. Cell Biol. 185, 11–19 (2009).
7. Harada, T. et al. Nuclear lamin stiffness is a barrier to 3D migration, butsoftness can limit survival. J. Cell Biol. 204, 669–682 (2014).
8. Petrie, R. J. & Yamada, K. M. Multiple mechanisms of 3D migration: theorigins of plasticity. Curr. Opin. Cell Biol. 42, 7–12 (2016).
9. Friedl, P. & Wolf, K. Plasticity of cell migration: a multiscale tuning model. J.Cell Biol. 188, 11–19 (2010).
10. Glentis, A. et al. Cancer-associated fibroblasts induce metalloprotease-independent cancer cell invasion of the basement membrane. Nat. Commun.8, 1–13 (2017).
11. Van Helvert, S., Storm, C. & Friedl, P. Mechanoreciprocity in cell migration.Nat. Cell Biol. 8, 8–20 (2018).
12. Acerbi, I. et al. Human breast cancer invasion and aggression correlates withECM stiffening and immune cell infiltration. Integr. Biol. (Camb.). 7,1120–1134 (2015).
13. Sinkus, R. et al. MR elastography of breast lesions: understanding the solid/liquid duality can improve the specificity of contrast-enhanced MRmammography. Magn. Reson. Med. 58, 1135–1144 (2007).
14. Lu, P., Weaver, V. M. & Werb, Z. The extracellular matrix: a dynamic niche incancer progression. J. Cell Biol. 196, 395–406 (2012).
15. Chaudhuri, O. et al. Extracellular matrix stiffness and composition jointlyregulate the induction of malignant phenotypes in mammary epithelium. Nat.Mater. 13, 1–9 (2014).
16. Chaudhuri, O. et al. Hydrogels with tunable stress relaxation regulate stem cellfate and activity. Nat. Mater. 15, 326–333 (2015).
17. Lee, K. Y. & Mooney, D. J. Alginate: properties and biomedical applications.Prog. Polym. Sci. 37, 106–126 (2012).
18. Nam, S., Lee, J., Brownfield, D. G. & Chaudhuri, O. Viscoplasticity enablesmechanical remodeling of matrix by cells. Biophys. J. 111, 2296–2308(2016).
19. Yurchenco, P. D. Basement membranes: cell scaffoldings and signalingplatforms. Cold Spring Harb. Perspect. Biol. 3, 1–27 (2011).
20. Moshfegh, Y., Bravo-Cordero, J. J., Miskolci, V., Condeelis, J. & Hodgson, L. ATrio-Rac1-Pak1 signalling axis drives invadopodia disassembly. Nat. Cell Biol.16, 571–585 (2014).
21. Sharma, V. P. et al. Tks5 and SHIP2 regulate invadopodium maturation,but not initiation, in breast carcinoma cells. Curr. Biol. 23, 2079–2089(2013).
22. Riching, K. M. & Keely, P. J. Rho family GTPases: making it to the thirddimension. Int. J. Biochem. Cell Biol. 59, 111–115 (2015).
23. Fletcher, D. A. & Mullins, R. D. Cell mechanics and the cytoskeleton. Nature463, 485–492 (2010).
24. Prass, M., Jacobson, K., Mogilner, A. & Radmacher, M. Direct measurement ofthe lamellipodial protrusive force in a migrating cell. J. Cell Biol. 174, 767–772(2006).
25. Stroka, K. M. et al. Water permeation drives tumor cell migration in confinedmicroenvironments. Cell 157, 611–623 (2014).
26. Berre, L., Liu, Y. & Piel, M. Confinement and low adhesion induce fastamoeboid migration of slow mesenchymal cells graphical abstract articleconfinement and low adhesion induce fast amoeboid migration of slowmesenchymal cells. Cell 160, 659–672 (2015).
27. Pathak, A. & Kumar, S. Independent regulation of tumor cell migration bymatrix stiffness and confinement. Proc Natl Acad Sci USA 109, 10334–10339(2012).
28. Qi, L. et al. Talin2-mediated traction force drives matrix degradation and cellinvasion. J. Cell Sci. 129, 3661–3674 (2016).
29. Legant, W., Miller, J. & Blakely, B. Measurement of mechanical tractionsexerted by cells in three-dimensional matrices. Nat. Methods 7, 969–973(2010).
30. Eckert, M. A. et al. Article Twist1-induced invadopodia formation promotestumor metastasis. Cancer Cell 19, 372–386 (2011).
31. Poincloux, R. et al. Contractility of the cell rear drives invasion of breast tumorcells in 3D Matrigel. Proc Natl Acad Sci USA 108, 1943–1948 (2011).
32. Zaman, M. H. et al. Migration of tumor cells in 3D matrices is governed bymatrix stiffness along with cell–matrix adhesion and proteolysis. Proc NatlAcad Sci USA 103, 10889–10894 (2006).
33. Hagedorn, E. J. et al. The netrin receptor DCC focuses invadopodia-drivenbasement membrane transmigration in vivo. J. Cell Biol. 201, 903–913(2013).
34. Pflicke, H. & Sixt, M. Preformed portals facilitate dendritic cell entry intoafferent lymphatic vessels. J. Exp. Med. 206, 2925–2935 (2009).
35. Alowami, S., Troup, S., Al-haddad, S., Kirkpatrick, I. & Watson, P. H.Mammographic density is related to stroma and stromal proteoglycanexpression. Breast Cancer Res. 5, 129–135 (2003).
36. Bravo-Cordero, J. J., Hodgson, L. & Condeelis, J. Directed cell invasion andmigration during metastasis. Curr. Opin. Cell Biol. 24, 277–283 (2012).
37. Provenzano, P. P. et al. Collagen reorganization at the tumor-stromal interfacefacilitates local invasion. BMC Med. 4, 1–15 (2006).
38. Coussens, L. M. Matrix metalloproteinase inhibitors and cancer: trials andtribulations. Science 295, 2387–2392 (2002).
39. Fingleton, B. MMPs as therapeutic targets—still a viable option? Semin. CellDev. Biol. 19, 61–68 (2008).
40. Charras, G. & Sahai, E. Physical influences of the extracellular environment oncell migration. Nat. Rev. Mol. Cell. Biol. 15, 813–824 (2014).
41. Rowley, J., Madlambayan, G. & Mooney, D. Alginate hydrogels as syntheticextracellular matrix materials. Biomaterials 20, 45–53 (1999).
42. Chaudhuri, O. et al. Substrate stress relaxation regulates cell spreading. Nat.Commun. 6, 6365 (2015).
43. Courtneidge, S. A. Cell migration and invasion in human disease: the Tksadaptor proteins. Biochem. Soc. Trans. 40, 129–132 (2012).
44. Wisdom, K. & Chaudhuri, O. 3D cell culture in interpenetrating networks ofalginate and rBM matrix. Methods Mol. Biol. 1612, 29–37 (2017).
ARTICLE NATURE COMMUNICATIONS | DOI: 10.1038/s41467-018-06641-z
12 NATURE COMMUNICATIONS | (2018) 9:4144 | DOI: 10.1038/s41467-018-06641-z | www.nature.com/naturecommunications
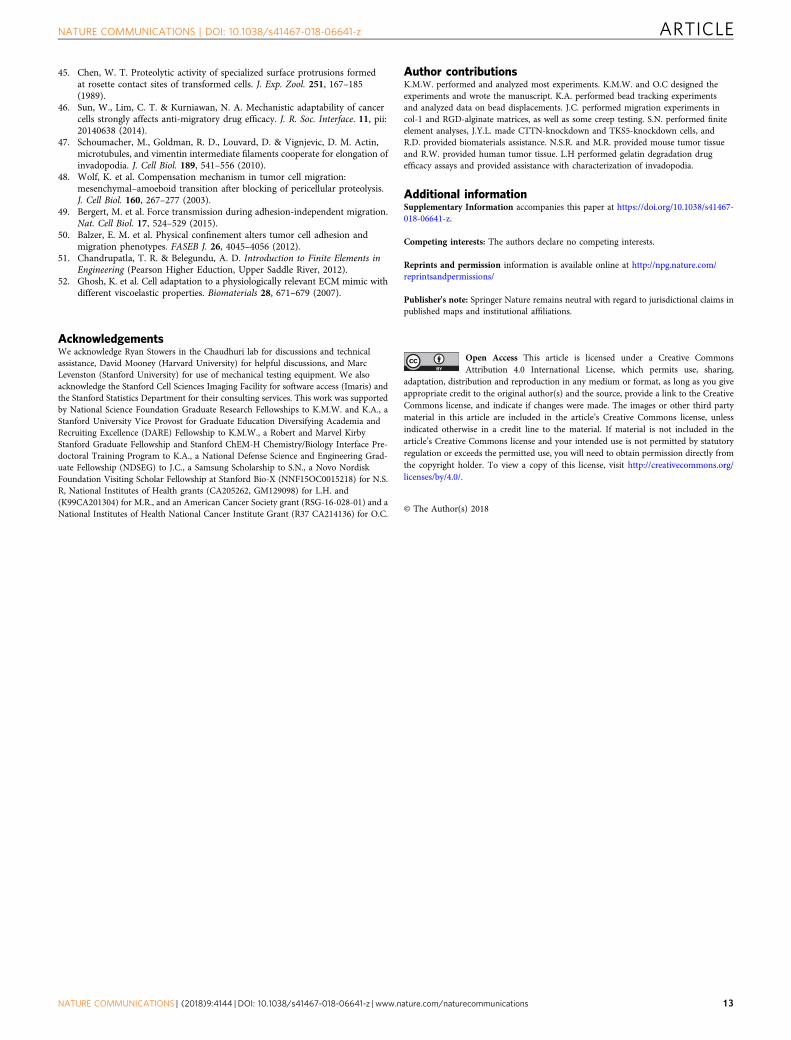
45. Chen, W. T. Proteolytic activity of specialized surface protrusions formedat rosette contact sites of transformed cells. J. Exp. Zool. 251, 167–185(1989).
46. Sun, W., Lim, C. T. & Kurniawan, N. A. Mechanistic adaptability of cancercells strongly affects anti-migratory drug efficacy. J. R. Soc. Interface. 11, pii:20140638 (2014).
47. Schoumacher, M., Goldman, R. D., Louvard, D. & Vignjevic, D. M. Actin,microtubules, and vimentin intermediate filaments cooperate for elongation ofinvadopodia. J. Cell Biol. 189, 541–556 (2010).
48. Wolf, K. et al. Compensation mechanism in tumor cell migration:mesenchymal–amoeboid transition after blocking of pericellular proteolysis.J. Cell Biol. 160, 267–277 (2003).
49. Bergert, M. et al. Force transmission during adhesion-independent migration.Nat. Cell Biol. 17, 524–529 (2015).
50. Balzer, E. M. et al. Physical confinement alters tumor cell adhesion andmigration phenotypes. FASEB J. 26, 4045–4056 (2012).
51. Chandrupatla, T. R. & Belegundu, A. D. Introduction to Finite Elements inEngineering (Pearson Higher Eduction, Upper Saddle River, 2012).
52. Ghosh, K. et al. Cell adaptation to a physiologically relevant ECM mimic withdifferent viscoelastic properties. Biomaterials 28, 671–679 (2007).
AcknowledgementsWe acknowledge Ryan Stowers in the Chaudhuri lab for discussions and technicalassistance, David Mooney (Harvard University) for helpful discussions, and MarcLevenston (Stanford University) for use of mechanical testing equipment. We alsoacknowledge the Stanford Cell Sciences Imaging Facility for software access (Imaris) andthe Stanford Statistics Department for their consulting services. This work was supportedby National Science Foundation Graduate Research Fellowships to K.M.W. and K.A., aStanford University Vice Provost for Graduate Education Diversifying Academia andRecruiting Excellence (DARE) Fellowship to K.M.W., a Robert and Marvel KirbyStanford Graduate Fellowship and Stanford ChEM-H Chemistry/Biology Interface Pre-doctoral Training Program to K.A., a National Defense Science and Engineering Grad-uate Fellowship (NDSEG) to J.C., a Samsung Scholarship to S.N., a Novo NordiskFoundation Visiting Scholar Fellowship at Stanford Bio-X (NNF15OC0015218) for N.S.R, National Institutes of Health grants (CA205262, GM129098) for L.H. and(K99CA201304) for M.R., and an American Cancer Society grant (RSG-16-028-01) and aNational Institutes of Health National Cancer Institute Grant (R37 CA214136) for O.C.
Author contributionsK.M.W. performed and analyzed most experiments. K.M.W. and O.C designed theexperiments and wrote the manuscript. K.A. performed bead tracking experimentsand analyzed data on bead displacements. J.C. performed migration experiments incol-1 and RGD-alginate matrices, as well as some creep testing. S.N. performed finiteelement analyses, J.Y.L. made CTTN-knockdown and TKS5-knockdown cells, andR.D. provided biomaterials assistance. N.S.R. and M.R. provided mouse tumor tissueand R.W. provided human tumor tissue. L.H performed gelatin degradation drugefficacy assays and provided assistance with characterization of invadopodia.
Additional informationSupplementary Information accompanies this paper at https://doi.org/10.1038/s41467-018-06641-z.
Competing interests: The authors declare no competing interests.
Reprints and permission information is available online at http://npg.nature.com/reprintsandpermissions/
Publisher's note: Springer Nature remains neutral with regard to jurisdictional claims inpublished maps and institutional affiliations.
Open Access This article is licensed under a Creative CommonsAttribution 4.0 International License, which permits use, sharing,
adaptation, distribution and reproduction in any medium or format, as long as you giveappropriate credit to the original author(s) and the source, provide a link to the CreativeCommons license, and indicate if changes were made. The images or other third partymaterial in this article are included in the article’s Creative Commons license, unlessindicated otherwise in a credit line to the material. If material is not included in thearticle’s Creative Commons license and your intended use is not permitted by statutoryregulation or exceeds the permitted use, you will need to obtain permission directly fromthe copyright holder. To view a copy of this license, visit http://creativecommons.org/licenses/by/4.0/.
© The Author(s) 2018
NATURE COMMUNICATIONS | DOI: 10.1038/s41467-018-06641-z ARTICLE
NATURE COMMUNICATIONS | (2018) 9:4144 | DOI: 10.1038/s41467-018-06641-z | www.nature.com/naturecommunications 13


![Welcome [med.stanford.edu]med.stanford.edu/.../aboutus/2017-MIPS-brochure.pdf · via sound (ultrasound, photoacoustic), magnetism (MRI or magnetic resonance imaging, MPI or magnetic](https://static.fdocuments.net/doc/165x107/5f0c64747e708231d4352ce6/welcome-med-med-via-sound-ultrasound-photoacoustic-magnetism-mri-or-magnetic.jpg)