Matplotlib for Python Developers - Packt · Matplotlib for Python Developers Sandro Tosi Chapter...
40
Matplotlib for Python Developers Sandro Tosi Chapter No. 6 "Embedding Matplotlib in Qt 4"
Transcript of Matplotlib for Python Developers - Packt · Matplotlib for Python Developers Sandro Tosi Chapter...

Matplotlib for Python Developers
Sandro Tosi
Chapter No. 6"Embedding Matplotlib in Qt 4"

In this package, you will find:A Biography of the author of the book
A preview chapter from the book, Chapter NO.6 "Embedding Matplotlib in Qt 4"
A synopsis of the book’s content
Information on where to buy this book
About the AuthorSandro Tosi was born in Firenze (Italy) in the early 80s, and graduated with a B.Sc. inComputer Science from the University of Firenze.
His personal passions for Linux, Python (and programming), and computer technologyare luckily a part of his daily job, where he has gained a lot of experience in systemsand applications management, database administration, as well as project managementand development.
After having worked for five years as an EAI and an Application architect in an energymultinational, he's now working as a system administrator for an important EuropeanInternet company.
I'd like to thank Laura, who has assisted and supported me whilewriting this book.
For More Information:www.packtpub.com/matplotlib-python-development/book

Matplotlib for Python DevelopersThis book is about Matplotlib, a Python package for 2D plotting that generatesproduction quality graphs. Its variety of output formats, several chart types, andcapability to run either interactively (from Python or IPython consoles) and non-interactively (useful, for example, when included into web applications), makesMatplotlib suitable for use in many different situations.
Matplotlib is a big package with several dependencies and having them all installed andrunning properly is the first step that needs to be taken. We provide some ways to have asystem ready to explore Matplotlib. Then we start describing the basic functions requiredfor plotting lines, exploring any useful or advanced commands for our plots until wecome to the core of Matplotlib: the object-oriented interface. This is the root for the nextbig section of the book—embedding Matplotlib into GUI libraries applications. Wecannot limit it only to desktop programs, so we show several methods to includeMatplotlib into web sites using low level techniques for two well known webframeworks—Pylons and Django. Last but not the least, we present a number of realworld examples of Matplotlib applications.
The core concept of the book is to present how to embed Matplotlib into Pythonapplications, developed using the main GUI libraries: GTK+, Qt 4, and wxWidgets.However, we are by no means limiting ourselves to that. The step-by-step introduction toMatplotlib functions, the advanced details, the example with web frameworks, andseveral real-life use cases make the book suitable for anyone willing to learn or alreadyworking with Matplotlib.
What This Book CoversChapter 1—Introduction to Matplotlib introduces what Matplotlib is, describing itsoutput formats and the interactions with graphical environments. Several ways to installMatplotlib are presented, along with its dependencies needed to have a correctlyconfigured environment to get along with the book.
Chapter 2—Getting started with Matplotlib covers the first examples of Matplotlibusage. While still being basic, the examples show important aspects of Matplotlib likehow to plot lines, legends, axes labels, axes grids, and how to save the finished plot. Italso shows how to configure Matplotlib using its configuration fi les or directly into thecode, and how to work profitable with IPython.
Chapter 3—Decorate Graphs with Plot Styles and Types discusses the additional plottingcapabilities of Matplotlib: lines and points styles and ticks customizations. Several typesof plots are discussed and covered: histograms, bars, pie charts, scatter plots, and more,along with the polar representation. It is also explained how to include textualinformation inside the plot.
For More Information:www.packtpub.com/matplotlib-python-development/book
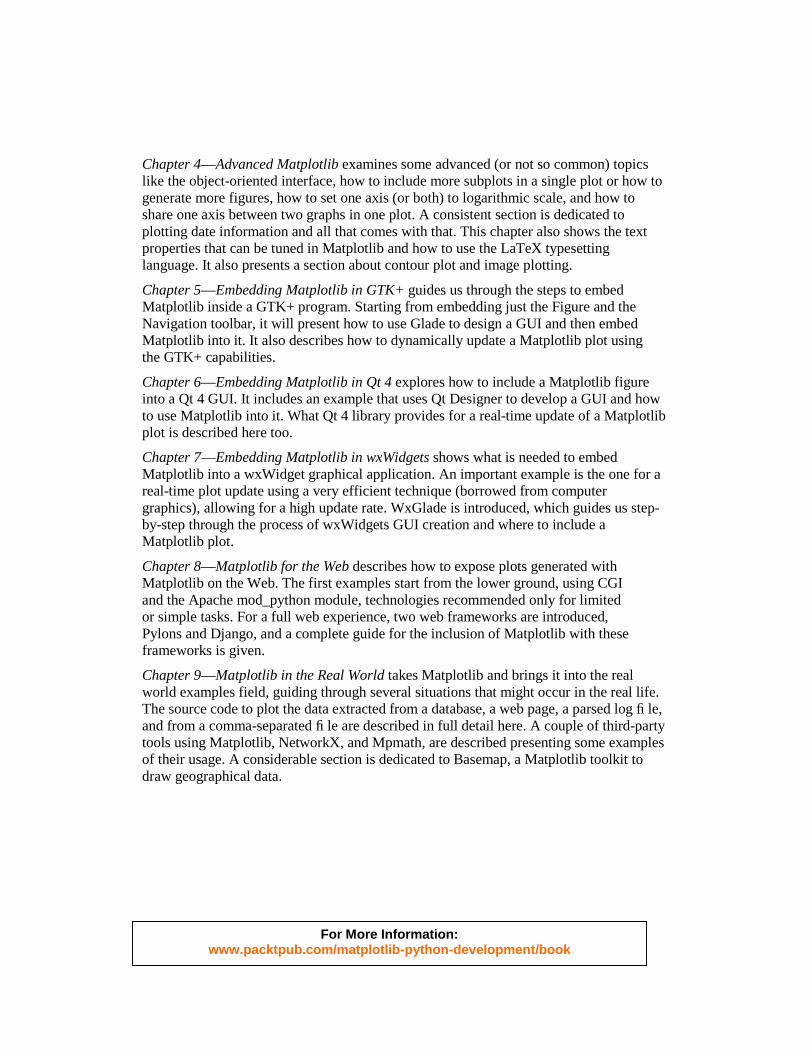
Chapter 4—Advanced Matplotlib examines some advanced (or not so common) topicslike the object-oriented interface, how to include more subplots in a single plot or how togenerate more figures, how to set one axis (or both) to logarithmic scale, and how toshare one axis between two graphs in one plot. A consistent section is dedicated toplotting date information and all that comes with that. This chapter also shows the textproperties that can be tuned in Matplotlib and how to use the LaTeX typesettinglanguage. It also presents a section about contour plot and image plotting.
Chapter 5—Embedding Matplotlib in GTK+ guides us through the steps to embedMatplotlib inside a GTK+ program. Starting from embedding just the Figure and theNavigation toolbar, it will present how to use Glade to design a GUI and then embedMatplotlib into it. It also describes how to dynamically update a Matplotlib plot usingthe GTK+ capabilities.
Chapter 6—Embedding Matplotlib in Qt 4 explores how to include a Matplotlib figureinto a Qt 4 GUI. It includes an example that uses Qt Designer to develop a GUI and howto use Matplotlib into it. What Qt 4 library provides for a real-time update of a Matplotlibplot is described here too.
Chapter 7—Embedding Matplotlib in wxWidgets shows what is needed to embedMatplotlib into a wxWidget graphical application. An important example is the one for areal-time plot update using a very efficient technique (borrowed from computergraphics), allowing for a high update rate. WxGlade is introduced, which guides us step-by-step through the process of wxWidgets GUI creation and where to include aMatplotlib plot.
Chapter 8—Matplotlib for the Web describes how to expose plots generated withMatplotlib on the Web. The first examples start from the lower ground, using CGIand the Apache mod_python module, technologies recommended only for limitedor simple tasks. For a full web experience, two web frameworks are introduced,Pylons and Django, and a complete guide for the inclusion of Matplotlib with theseframeworks is given.
Chapter 9—Matplotlib in the Real World takes Matplotlib and brings it into the realworld examples field, guiding through several situations that might occur in the real life.The source code to plot the data extracted from a database, a web page, a parsed log fi le,and from a comma-separated fi le are described in full detail here. A couple of third-partytools using Matplotlib, NetworkX, and Mpmath, are described presenting some examplesof their usage. A considerable section is dedicated to Basemap, a Matplotlib toolkit todraw geographical data.
For More Information:www.packtpub.com/matplotlib-python-development/book
Embedding Matplotlib in Qt 4There are several GUI libraries available, and one of the most famous is Qt. In this book, we will use Qt 4, the latest major version of this library. Unless explicitly mentioned, when we write Qt, we are referring to Qt 4.
We will follow the same progression as in the GTK+ chapter, and we will present the same examples, but this time written in Qt.
We believe that this method will allow us to directly compare the libraries, and it has the advantage of not leaving the "How would I write something with library X?" question unanswered.
During this chapter, we will see how to:
• Embed a Matplotlib Figure into a Qt widget• Embed a Figure and navigation toolbar into a Qt widget• Use events to update in real-time a Matplotlib plot• Use Qt Designer to draw a GUI and then use it with Matplotlib in a
simple Python application
We begin by giving an introduction to the library.
Brief introduction to Qt 4 and PyQt4 Qt is a cross-platform application development framework, widely used for graphical programs (GUI) but also for non-GUI tools.
Qt was developed by Trolltech (now owned by Nokia), and it's probably best known for being the foundation of the K Desktop Environment (KDE) for Linux.
For More Information:www.packtpub.com/matplotlib-python-development/book
Embedding Matplotlib in Qt 4
[ 146 ]
The Qt toolkit is a collection of classes to simplify the creation of programs. Qt is more than just a GUI toolkit; it includes components for abstractions of network sockets, threads, Unicode, regular expressions, SQL databases, SVG, OpenGL, and XML, as well as a fully functional web browser, a help system, a multimedia framework, and a rich collection of GUI widgets.
Qt is available on several platforms, in particular: Unix/Linux, Windows, Mac OS X, and also some embedded devices. As it uses the native APIs of the platform to render the Qt controls, applications developed with Qt have a look and feel which fi ts the running environment (without looking like aliens in it).
Though written in C++, Qt can also be used in several other programming languages, through language bindings available for Ruby, Java, Perl, and also Python with PyQt.
PyQt is a comprehensive set of Python bindings for the Qt framework. PyQt provides bindings for Qt 2 and Qt 3. PyQt4 is a separate set of bindings and covers the Qt 4 series of releases. We will use PyQt4 and references to PyQt should be considered to be referring to PyQt4.
PyQt brings together the Qt C++ cross-platform application framework and the cross-platform interpreted language, Python. An application written in Qt and PyQt often runs unchanged on all the supported platforms.
The Qt components are mapped to several Python submodules (where PyQt4 is the main module), and the most important are:
• The QtCore module, which contains the core non-GUI classes (for example, the event loop).
• The QtGui module, which contains the majority of the GUI classes. • QtOpenGL, QtScript (JavaScript support), QtSql (SQL databases support),
QtSvg (SVG fi le support), QtTest (unit testing support), QtXml (XML support), QtNetwork (for network programming), and several others. Note how many of these submodules provide functionalities that are already present in Python standard library.
For More Information:www.packtpub.com/matplotlib-python-development/book
Chapter 6
[ 147 ]
Embedding a Matplotlib fi gure in a Qt window We are going to see how to embed a Matplotlib Figure into a simple Qt window. We will fi rst walk through the code and describe it, while presenting it as a whole at the end of the section (this presentation style will be used throughout the chapter).
Here is the beginning:
import sys
The module sys contains information and functions used to interact with the Python interpreter. In this case, we need it to access the command-line arguments passed to the Python script.
from PyQt4 import QtGui
We import the PyQt4 submodule, QtGui which contains the biggest part of the GUI classes, for example, all the basic GUI widgets are located in this module.
import numpy as np
The NumPy module is needed for our example graph.
from matplotlib.figure import Figure
Import the Figure Matplotlib object: this is the backend-independent representation of our plot.
from matplotlib.backends.backend_qt4agg \ import FigureCanvasQTAgg as FigureCanvas
Here we import from the matplotlib.backends.backend_qt4agg module the FigureCanvasQTAgg class, which is the backend-dependent fi gure canvas; it contains the backend-specifi c knowledge to render the Figure we've drawn to the Qt 4 backend.
Note that FigureCanvasQTAgg, other than being a Matplotlib class, is also a QWidget—the base class of all user interface objects (it simply represents an empty area). So this means we can treat FigureCanvasQTAgg like a pure Qt widget object, using it in the GUI window as we would do with buttons, text areas, and so on.
class Qt4MplCanvas(FigureCanvas):
We now defi ne a new class, Qt4MplCanvas, to render our Matplotlib plot; it inherits from FigureCanvas, as well as from QWidget. Therefore, it can be used as a Qt element in the main window of our application.
For More Information:www.packtpub.com/matplotlib-python-development/book
Embedding Matplotlib in Qt 4
[ 148 ]
def __init__(self): self.fig = Figure() self.axes = self.fig.add_subplot(111) self.x = np.arange(0.0, 3.0, 0.01) self.y = np.cos(2*np.pi*self.x) self.axes.plot(self.x, self.y)
In the __init__ method, which is called upon class instantiation, we write the code to draw the graph.
FigureCanvas.__init__(self, self.fig)
We also instantiate the FigureCanvas, which is responsible for taking the Matplotlib Figure object, and render it in a Qt widget.
qApp = QtGui.QApplication(sys.argv)
This command creates the Qt application, initialized with the list of arguments given from the command line. This is a required parameter, and it's the reason we imported the sys module.
Every PyQt4 application must create one and only one QApplication instance, no matter how many windows compose the application.
QApplication manages the GUI application's control fl ow and main settings. It's the place where the main event loop is executed, processing and dispatching to the widgets all the events coming from the window system and other sources.
It is also responsible for application initialization and fi nalization, handling most of the system-wide and application-wide settings.
Since QApplication handles the entire initialization phase, it must be created before any other objects related to the UI are created.
mpl = Qt4MplCanvas()
We can now instantiate the Qt4MplCanvas. A QWidget with no parent (like the one over here) is called a window. Consider the parent as the object where we want to put the widget; if it's None, then it's a main window. Otherwise, if we want to put the widget in a window, then we set the parent as a reference to that window.
mpl.show()
The show() method makes the widget visible on the screen.
sys.exit(qApp.exec_())
For More Information:www.packtpub.com/matplotlib-python-development/book
Chapter 6
[ 149 ]
The command qApp.exec_() enters the Qt main event loop. Once exit() or quit() is called, it returns the relevant return code. Until the main loop is started, nothing is displayed on screen.
It's necessary to call this function as the main loop handles all events and signals coming from both the application widgets and from the window system; essentially, no user interaction can take place before it's called.
You may be wondering why there is an underscore in exec_(); the reason is simple: exec() is a reserved word in Python, thus the addition of the underscore to the exec() Qt method.
Wrapping it inside sys.exit() allows the Python script to exit with the same return code, informing the environment how the application ended (whether successfully or not).
Here is the complete source code:
# for command-line argumentsimport sys
# Python Qt4 bindings for GUI objectsfrom PyQt4 import QtGui
# Numpy functions for image creationimport numpy as np
# Matplotlib Figure objectfrom matplotlib.figure import Figure# import the Qt4Agg FigureCanvas object, that binds Figure to# Qt4Agg backend. It also inherits from QWidgetfrom matplotlib.backends.backend_qt4agg \ import FigureCanvasQTAgg as FigureCanvas
class Qt4MplCanvas(FigureCanvas): """Class to represent the FigureCanvas widget""" def __init__(self): # Standard Matplotlib code to generate the plot self.fig = Figure() self.axes = self.fig.add_subplot(111) self.x = np.arange(0.0, 3.0, 0.01) self.y = np.cos(2*np.pi*self.x) self.axes.plot(self.x, self.y) # initialize the canvas where the Figure renders into FigureCanvas.__init__(self, self.fig)
For More Information:www.packtpub.com/matplotlib-python-development/book
Embedding Matplotlib in Qt 4
[ 150 ]
# Create the GUI applicationqApp = QtGui.QApplication(sys.argv)# Create the Matplotlib widgetmpl = Qt4MplCanvas()# show the widgetmpl.show()# start the Qt main loop execution, exiting from this script# with the same return code of Qt applicationsys.exit(qApp.exec_())
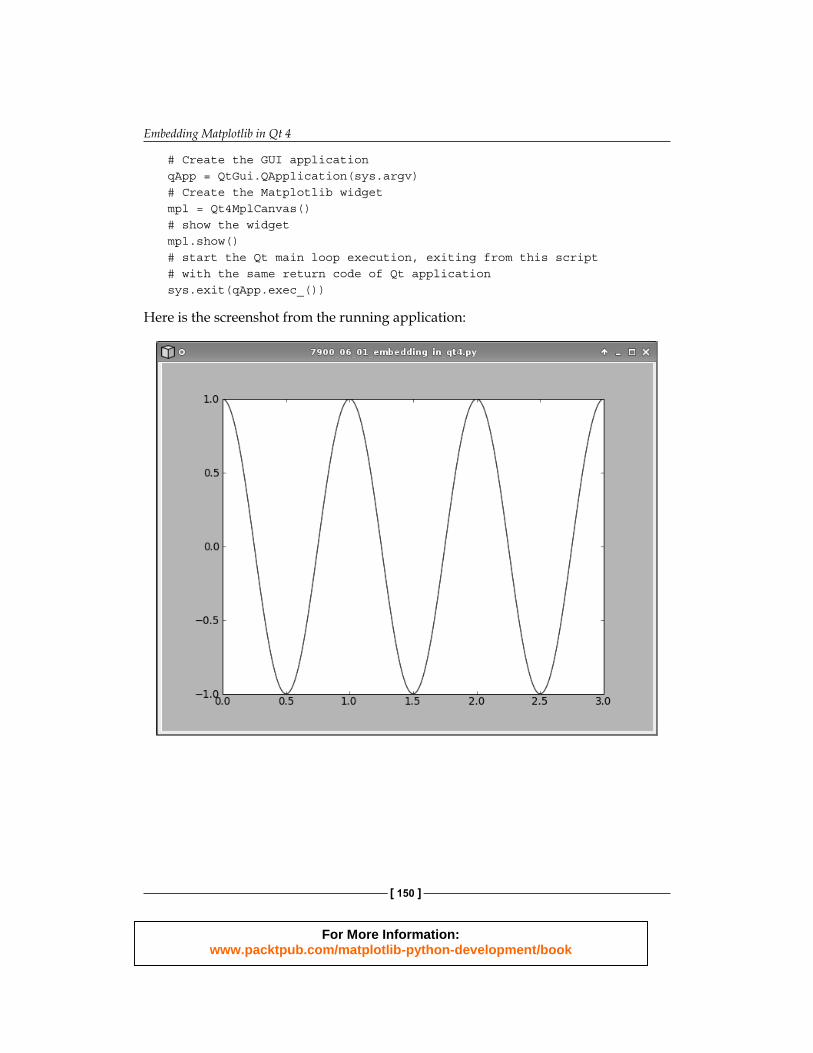
Here is the screenshot from the running application:
For More Information:www.packtpub.com/matplotlib-python-development/book
Chapter 6
[ 151 ]
Including a navigation toolbar Here we're going to add the navigation toolbar to the Matplotlib plot to explore some additional aspects of Qt.
import sys
This is used for command-line argument retrieval.
from PyQt4 import QtGui
We now import the Qt 4 GUI widget's submodule.
import numpy as np
This is the usual NumPy import to generate the plot data.
from matplotlib.figure import Figurefrom matplotlib.backends.backend_qt4agg \ import FigureCanvasQTAgg as FigureCanvasfrom matplotlib.backends.backend_qt4agg \ import NavigationToolbar2QTAgg as NavigationToolbar
Here we import the Matplotlib Figure object along with the FigureCanvasQTAgg and NavigationToolbar2QTAgg. Note that the last two are Qt 4 specifi c and also inherit from QWidget, so they can be used as Qt objects in a QApplication.
class Qt4MplCanvas(FigureCanvas):
We now defi ne a new class and as it inherits from FigureCanvas, it is also a QWidget that can be embedded into a Qt application.
def __init__(self, parent): self.fig = Figure() self.axes = self.fig.add_subplot(111) t = np.arange(0.0, 3.0, 0.01) s = np.cos(2*np.pi*t) self.axes.plot(t, s)
This is the usual code to draw a Matplotlib example graph.
FigureCanvas.__init__(self, self.fig)
We now initialize the FigureCanvas object, the Qt 4-specifi c fi gure canvas.
self.setParent(parent)
For More Information:www.packtpub.com/matplotlib-python-development/book
Embedding Matplotlib in Qt 4
[ 152 ]
We set the parent of this widget to the parent parameter of __init__.
FigureCanvas.setSizePolicy(self, QtGui.QSizePolicy.Expanding, QtGui.QSizePolicy.Expanding)
The setSizePolicy() QWidget method is used to set the widget size behavior. We set it to be freely expandable so that we can resize the window and have the Figure be resized accordingly.
FigureCanvas.updateGeometry(self)
We need to call this method because we have changed the size polices, so we now notify the layout system of this change.
class ApplicationWindow(QtGui.QMainWindow):
We create another class that will be our main application window.
The QMainWindow class provides a framework to create the main windows of application user interfaces; it's common to subclass it, when defi ning our own window.
As we've seen in the previous example, there are other ways to create a visible window (we did it with a QWidget without a parent), but using QMainWindow is the best way to build a full-featured GUI application.
def __init__(self): QtGui.QMainWindow.__init__(self)
We call the constructor of the superclass, since we inherit from it. It's necessary to initialize the base class (to be able to use its functionalities) while initializing our own class.
self.setWindowTitle("Matplotlib Figure in a Qt4 Window With NavigationToolbar")
We set the window title, as we expect a real application to have a title.
self.main_widget = QtGui.QWidget(self)
We create a widget that will be the main widget displayed by our application.
vbl = QtGui.QVBoxLayout(self.main_widget)
Here is a vertical box: vertical and horizontal boxes are used to group widgets together (on a vertical or horizontal layout) and allow size transformations on all of them. They are also called geometry or layout managers, since they are able to automatically position and adjust the widgets they contain.
For More Information:www.packtpub.com/matplotlib-python-development/book
Chapter 6
[ 153 ]
The idea behind layout managers is to pack widgets into an area where their positions are relative to the other widgets and to the window. Resize the window, and the layout managers will automatically adjust the size and position of widgets to accommodate this change.
qmc = Qt4MplCanvas(self.main_widget) ntb = NavigationToolbar(qmc, self.main_widget)
Now we have the two Matplotlib objects we're interested in—the fi gure canvas and the toolbar. Note how one of the toolbar parameters is the fi gure canvas.
vbl.addWidget(qmc) vbl.addWidget(ntb)
So now we can pack these two widgets into the vertical box that will align widgets from top to bottom.
self.main_widget.setFocus()
We set the focus on our main widget.
self.setCentralWidget(self.main_widget)
We now defi ne it as the central widget. QApplication has the concept of central widget that we can think of as the main part of the application. It is not the toolbar, the menu, or anything else, rather it is the actual main functional area of the application.
qApp = QtGui.QApplication(sys.argv)
We create the QApplication instance.
aw = ApplicationWindow()
We instantiate our main window.
aw.show()
We show the main window.
sys.exit(qApp.exec_())
and at the end, start the Qt 4 main events loop.
The whole code is :
# for command-line argumentsimport sys
# Python Qt4 bindings for GUI objectsfrom PyQt4 import QtGui# Numpy functions for image creation
For More Information:www.packtpub.com/matplotlib-python-development/book
Embedding Matplotlib in Qt 4
[ 154 ]
import numpy as np
# Matplotlib Figure objectfrom matplotlib.figure import Figure# import the Qt4Agg FigureCanvas object, that binds Figure to# Qt4Agg backend. It also inherits from QWidgetfrom matplotlib.backends.backend_qt4agg \ import FigureCanvasQTAgg as FigureCanvas# import the NavigationToolbar Qt4Agg widgetfrom matplotlib.backends.backend_qt4agg \ import NavigationToolbar2QTAgg as NavigationToolbar
class Qt4MplCanvas(FigureCanvas): """Class to represent the FigureCanvas widget""" def __init__(self, parent): # plot definition self.fig = Figure() self.axes = self.fig.add_subplot(111)
t = np.arange(0.0, 3.0, 0.01) s = np.cos(2*np.pi*t) self.axes.plot(t, s)
# initialization of the canvas FigureCanvas.__init__(self, self.fig) # set the parent widget self.setParent(parent)
# we define the widget as expandable FigureCanvas.setSizePolicy(self, QtGui.QSizePolicy.Expanding, QtGui.QSizePolicy.Expanding) # notify the system of updated policy FigureCanvas.updateGeometry(self)
class ApplicationWindow(QtGui.QMainWindow): """Example main window""" def __init__(self): # initialization of Qt MainWindow widget QtGui.QMainWindow.__init__(self) # set window title self.setWindowTitle("Matplotlib Figure in a Qt4 Window With NavigationToolbar")
# instantiate a widget, it will be the main one self.main_widget = QtGui.QWidget(self) # create a vertical box layout widget vbl = QtGui.QVBoxLayout(self.main_widget) # instantiate our Matplotlib canvas widget
For More Information:www.packtpub.com/matplotlib-python-development/book
Chapter 6
[ 155 ]
qmc = Qt4MplCanvas(self.main_widget) # instantiate the navigation toolbar ntb = NavigationToolbar(qmc, self.main_widget) # pack these widget into the vertical box vbl.addWidget(qmc) vbl.addWidget(ntb)
# set the focus on the main widget self.main_widget.setFocus() # set the central widget of MainWindow to main_widget self.setCentralWidget(self.main_widget)
# create the GUI applicationqApp = QtGui.QApplication(sys.argv)# instantiate the ApplicationWindow widgetaw = ApplicationWindow()# show the widgetaw.show()# start the Qt main loop execution, exiting from this script# with the same return code of Qt applicationsys.exit(qApp.exec_())
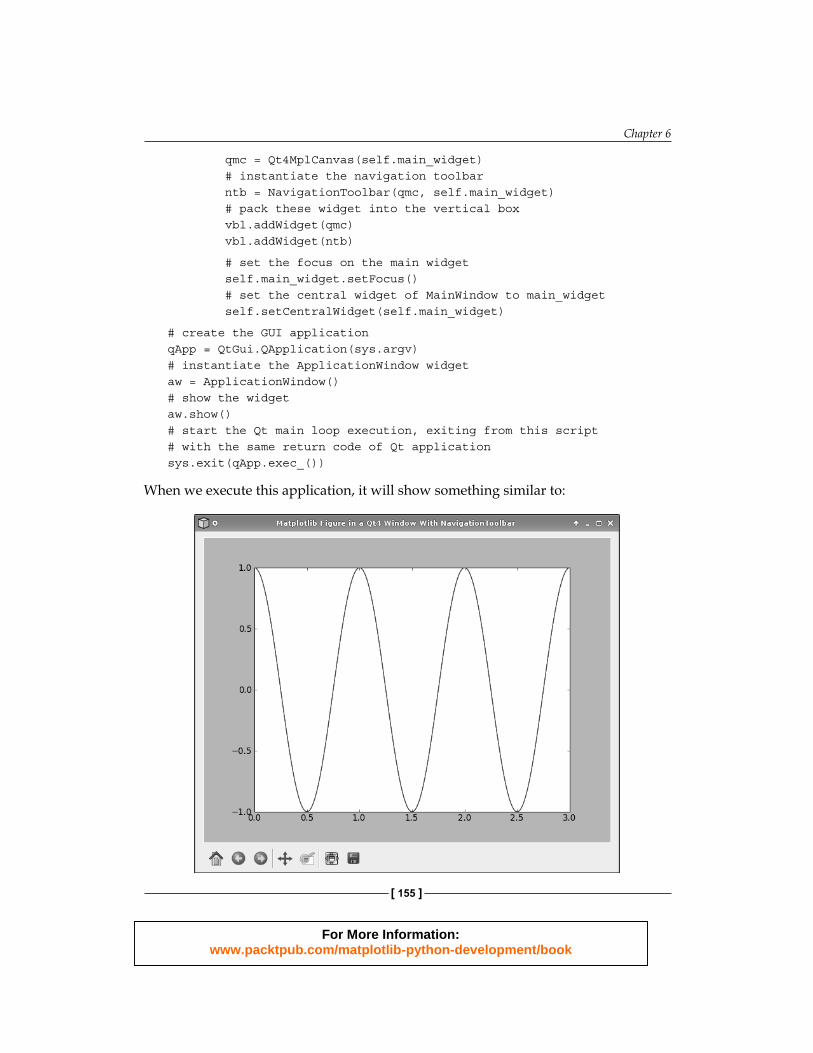
When we execute this application, it will show something similar to:
For More Information:www.packtpub.com/matplotlib-python-development/book
Embedding Matplotlib in Qt 4
[ 156 ]
Real-time update of a Matplotlib graph In this section, we will present a simple application—a CPU usage monitor, where we will update the Matplotlib graph in real-time (once every second over a period of 30 seconds).
As there are several indicators of CPU usage in a modern operating system, we decided to restrict our graph to the four main ones:
• user: The time consumed by processes executed by the users of the machine• nice: The time consumed by processes executed by users but with a lower
priority• system: The time consumed by system tasks• idle: The time consumed waiting for something to execute
The ignored indicators contribute for just a minimal part of the CPU usage, so their exclusion doesn't disturb the validity of the example.
Of those four indicators, what we will plot is the percentage of each of them against the total CPU usage.
Here we start:
import sysfrom PyQt4 import QtGui
These are the modules for command-line parameters and for Python bindings of the QtGui submodule.
from matplotlib.figure import Figurefrom matplotlib.backends.backend_qt4agg \ import FigureCanvasQTAgg as FigureCanvas
The classic Matplotlib import for the required objects.
import psutil as p
Python is full of modules that do almost everything we can think of, so for our example, we leverage an existing module—psutils.
psutil is a multiplatform module (available for Windows, Linux, and Mac OS X) that exports a common interface to access system information such as processes, memory, CPU, and so on. We will use its functionalities to obtain the CPU usage.
MAXITERS = 30
For More Information:www.packtpub.com/matplotlib-python-development/book
Chapter 6
[ 157 ]
This is the total number of iterations we want to perform. Since we perform an iteration every second, the total number of iterations equals 30 seconds of CPU usage monitoring.
class CPUMonitor(FigureCanvas):
As usual, we defi ne a class for the Matplotlib graph elaboration.
def __init__(self): self.before = self.prepare_cpu_usage()
In the initialization method, we save the current CPU usage information. The algorithm we will use to update the graph needs a previous set of values.
self.fig = Figure() self.ax = self.fig.add_subplot(111)
The basic Matplotlib Figure and Axes initialization.
FigureCanvas.__init__(self, self.fig)
Initialization for the canvas, referring to the Figure object defi ned earlier.
self.ax.set_xlim(0, 30) self.ax.set_ylim(0, 100) self.ax.set_autoscale_on(False)
We set the limits for the X-axis (to have a 30 seconds interval) and for the Y-axis (the range of percentage usage), and then disable the autoscale feature. This will allow us to have a fi xed dimension Axes, where the plot can be redrawn without resizing the fi gure.
self.user, self.nice, self.sys, self.idle = [], [], [], [] self.l_user, = self.ax.plot([],self.user, label='User %') self.l_nice, = self.ax.plot([],self.nice, label='Nice %') self.l_sys, = self.ax.plot([],self.sys, label='Sys %') self.l_idle, = self.ax.plot([],self.idle, label='Idle %')
This draws a placeholder line for the four datasets that we will use. This is important because we now have the references to the four line objects, and we can dynamically update their information without generating a new object at every iteration.
self.ax.legend()
Here, we add a legend.
self.fig.canvas.draw()
For More Information:www.packtpub.com/matplotlib-python-development/book
Embedding Matplotlib in Qt 4
[ 158 ]
The preceding line of code forces a draw of the canvas.
self.cnt = 0
We initialize the iterations counter to 0.
self.timerEvent(None)
We make an explicit call to the method that we will use to update the graph dynamically: this is a little trick used to speed up the visualization of the plot.
self.timer = self.startTimer(1000)
With this command, we start a timer object and save the reference to self.timer. QTimer is a class that triggers an event every n milliseconds (the interval is specifi ed on instantiation).
In this case, our timer will generate an event every second, and we will use this event to update our graph.
The main loop (started by exec_()) processes the timer events (along with all the others) and delivers them to this widget.
def prepare_cpu_usage(self):
This function will take care of preparing the CPU usage information we need.
t = p.cpu_times()
We use the psutil cpu_times() method to retrieve the current CPU usage.
if hasattr(t, 'nice'): return [t.user, t.nice, t.system, t.idle] else: # special case for Windows, without 'nice' value return [t.user, 0, t.system, t.idle]
We check if the nice attribute is available. On a Unix-like system, that attribute is present, so we can return the whole set of data. On Windows, where there is no distinction between user and nice processes, the attribute is missing, so we set its value to 0 while still returning the other indicators. The net result is that we have a cross-platform code able to run on Windows and on Unix-like systems.
def get_cpu_usage(self):
We defi ne another function to take the values from prepare_cpu_usage() and compute the information needed for plotting.
now = self.prepare_cpu_usage()
For More Information:www.packtpub.com/matplotlib-python-development/book
Chapter 6
[ 159 ]
We take the current CPU usage values.
delta = [now[i]-self.before[i] for i in range(len(now))]
Then we compute the deltas from the previous measurement to the current one. Delta is the Greek letter for d (from difference), commonly used when dealing with differences.
Values returned from psutil cpu_times() are counters. They are monotonically increased from the moment the machine boots until it is turned off. What we're interested in is the amount of CPU taken by each of the four categories that we plot during the measurement interval. These commands do this evaluation.
total = sum(delta)
We compute the sum of the deltas.
self.before = now
We replace the self.before value with now, so at the next iteration, the current values will be used.
return [(100.0*dt)/total for dt in delta]
and we return the CPU usage percentage for our four categories. dt/total represents the fraction of the total time used by that category and multiplying it by 100.0 generates a percentage value.
def timerEvent(self, evt):
As said, events are an important part of Qt, and the main loop receives and dispatches them to the right widgets. A common way by which a widget processes events is by reimplementing event handlers.
In our example, QTimer object generates (at a regular rate of one event per second) a QTimerEvent that is sent to our widget (since it's the widget that started the timer).
To modify the widget behavior following the reception of an event, we need to defi ne our own event handler, which in the case of a timer is called timerEvent().
result = self.get_cpu_usage()
We get the current percentage values for CPU usage.
self.user.append(result[0]) self.nice.append(result[1]) self.sys.append( result[2]) self.idle.append(result[3])
For More Information:www.packtpub.com/matplotlib-python-development/book

Embedding Matplotlib in Qt 4
[ 160 ]
We add them to the relevant datasets.
self.l_user.set_data(range(len(self.user)), self.user) self.l_nice.set_data(range(len(self.nice)), self.nice) self.l_sys.set_data( range(len(self.sys)), self.sys) self.l_idle.set_data(range(len(self.idle)), self.idle)
Now, we replot the lines with the updated information. We have added one item to each indicator's list, and now we are updating the line objects to refl ect the new data. Updating the lines instead of creating a completely new plot (or removing the old lines and adding new ones) is faster and does not create any annoying visual effect on the window.
self.fig.canvas.draw()
We force a redraw of the canvas to actually show the changed lines.
if self.cnt == MAXITERS:
then we have to check if we've performed all the iterations or not.
self.killTimer(self.timer)
Once we have completed all the iterations, we stop the timer by calling killTimer() and passing the timer reference that we had created and saved when creating startTimer().
else: self.cnt += 1
Alternatively, we simply increment the counter and wait for the next timer event to occur.
app = QtGui.QApplication(sys.argv)
we now start the main part of the application, and as the fi rst thing, we create our wrapper QApplication instance.
widget = CPUMonitor()
Here, we create our CPUMonitor widget.
widget.setWindowTitle("30 Seconds of CPU Usage Updated in RealTime")
we set the window title.
widget.show()
For More Information:www.packtpub.com/matplotlib-python-development/book
Chapter 6
[ 161 ]
We show the widget.
sys.exit(app.exec_())
and at the end, we start the main loop.
Here is the full example code:
# for command-line argumentsimport sys
# Python Qt4 bindings for GUI objectsfrom PyQt4 import QtGui
# Matplotlib Figure objectfrom matplotlib.figure import Figure# import the Qt4Agg FigureCanvas object, that binds Figure to# Qt4Agg backend. It also inherits from QWidgetfrom matplotlib.backends.backend_qt4agg \ import FigureCanvasQTAgg as FigureCanvas
# used to obtain CPU usage informationimport psutil as p
# Total number of iterationsMAXITERS = 30
class CPUMonitor(FigureCanvas): """Matplotlib Figure widget to display CPU utilization""" def __init__(self): # save the current CPU info (used by updating algorithm) self.before = self.prepare_cpu_usage()
# first image setup self.fig = Figure() self.ax = self.fig.add_subplot(111)
# initialization of the canvas FigureCanvas.__init__(self, self.fig)
# set specific limits for X and Y axes self.ax.set_xlim(0, 30) self.ax.set_ylim(0, 100)
# and disable figure-wide autoscale
For More Information:www.packtpub.com/matplotlib-python-development/book
Embedding Matplotlib in Qt 4
[ 162 ]
self.ax.set_autoscale_on(False)
# generates first "empty" plots self.user, self.nice, self.sys, self.idle =[], [], [], []
self.l_user, = self.ax.plot([],self.user, label='User %') self.l_nice, = self.ax.plot([],self.nice, label='Nice %') self.l_sys, = self.ax.plot([],self.sys, label='Sys %') self.l_idle, = self.ax.plot([],self.idle, label='Idle %')
# add legend to plot self.ax.legend()
# force a redraw of the Figure self.fig.canvas.draw()
# initialize the iteration counter self.cnt = 0
# call the update method (to speed-up visualization) self.timerEvent(None)
# start timer, trigger event every 1000 millisecs (=1sec) self.timer = self.startTimer(1000)
def prepare_cpu_usage(self): """helper function to return CPU usage info"""
# get the CPU times using psutil module t = p.cpu_times()
# return only the values we're interested in if hasattr(t, 'nice'): return [t.user, t.nice, t.system, t.idle] else: # special case for Windows, without 'nice' value return [t.user, 0, t.system, t.idle] def get_cpu_usage(self): """Compute CPU usage comparing previous and current measurements"""
# take the current CPU usage information now = self.prepare_cpu_usage() # compute delta between current and previous measurements
For More Information:www.packtpub.com/matplotlib-python-development/book

Chapter 6
[ 163 ]
delta = [now[i]-self.before[i] for i in range(len(now))] # compute the total (needed for percentages calculation) total = sum(delta) # save the current measurement to before object self.before = now # return the percentage of CPU usage for our 4 categories return [(100.0*dt)/total for dt in delta]
def timerEvent(self, evt): """Custom timerEvent code, called at timer event receive""" # get the cpu percentage usage result = self.get_cpu_usage()
# append new data to the datasets self.user.append(result[0]) self.nice.append(result[1]) self.sys.append( result[2]) self.idle.append(result[3])
# update lines data using the lists with new data self.l_user.set_data(range(len(self.user)), self.user) self.l_nice.set_data(range(len(self.nice)), self.nice) self.l_sys.set_data( range(len(self.sys)), self.sys) self.l_idle.set_data(range(len(self.idle)), self.idle)
# force a redraw of the Figure self.fig.canvas.draw()
# if we've done all the iterations if self.cnt == MAXITERS: # stop the timer self.killTimer(self.timer) else: # else, we increment the counter self.cnt += 1
# create the GUI applicationapp = QtGui.QApplication(sys.argv)# Create our Matplotlib widgetwidget = CPUMonitor()# set the window titlewidget.setWindowTitle("30 Seconds of CPU Usage Updated in RealTime")# show the widgetwidget.show()
For More Information:www.packtpub.com/matplotlib-python-development/book

Embedding Matplotlib in Qt 4
[ 164 ]
# start the Qt main loop execution, exiting from this script# with the same return code of Qt applicationsys.exit(app.exec_())
Here is a screenshot which was taken while running the preceding application:
At the top of the window, we can see the green line for the CPU usage of nice processes, down below there is the blue line for user CPU usage, and very near the 0 we have system time (in red) and idle time (in cyan) lines, barely visible. In Chapter 7, we will present a similar technique to update a plot in real time, but with a much higher throughput.
For More Information:www.packtpub.com/matplotlib-python-development/book
Chapter 6
[ 165 ]
Embedding Matplotlib in a GUI made with Qt Designer For simple examples, designing the GUI in the Python code can be good enough, but for more complex applications, this solution does not scale.
There are some tools to help you design the GUI for Qt, and one of the most commonly used is Qt Designer.
Similar to Glade, we can design the user interface part of the application using on-screen form and drag-and-drop interface. Then we can connect the widgets with the backend code, where we develop the logic of the application.
The core of our example application will be plotting the frequencies of occurrences of letters in a text fi le: we will count the number of times each letter of the English alphabet appears in a given fi le and then plot this information in a bar graph.
First, we will show how to design our GUI with Qt Designer, in particular, how to create a custom Matplotlib widget managed by an external Python source fi le. Then, we will convert that GUI into a Python code that we can use for our main program.
This example is made up of several source fi les:
• qtdesigner.ui: UI fi le generated by Qt Designer• qtdesigner.py: Python code generated from UI fi le• mplwidget.py: Python code to control the custom Matplotlib widget• 7900_06_04_qt_designer.py: Main code used to execute the example
We start by looking at how we used the Qt Designer. This chapter is about Qt 4, so we have to use development tools for that version, for example, our Qt Designer is the one for Qt 4 (in particular, version 4.5.1).
Designing the GUI using Qt Designer Once started, the Designer asks us what kind of form we want to design. For our purpose, we will create a main window. An empty window will show up, ready for designing the interface.
For More Information:www.packtpub.com/matplotlib-python-development/book
Embedding Matplotlib in Qt 4
[ 166 ]
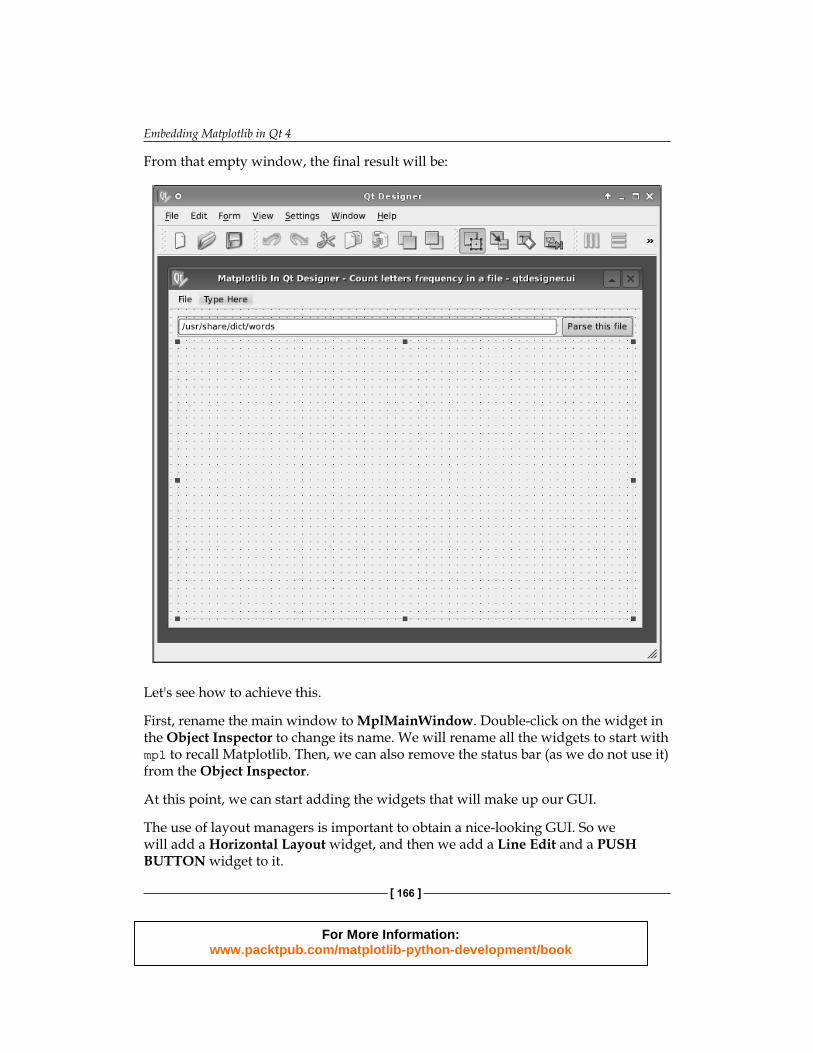
From that empty window, the fi nal result will be:
Let's see how to achieve this.
First, rename the main window to MplMainWindow. Double-click on the widget in the Object Inspector to change its name. We will rename all the widgets to start with mpl to recall Matplotlib. Then, we can also remove the status bar (as we do not use it) from the Object Inspector.
At this point, we can start adding the widgets that will make up our GUI.
The use of layout managers is important to obtain a nice-looking GUI. So we will add a Horizontal Layout widget, and then we add a Line Edit and a PUSH BUTTON widget to it.
For More Information:www.packtpub.com/matplotlib-python-development/book
Chapter 6
[ 167 ]
As you can see, the Horizontal Layout is just dropped in the window right where we dragged it, without a specifi c layout. Now that we have a widget in the main window, we can decide its global layout. Right-click on the main window widget in the Object Inspector, and choose Lay Out Vertically from the Lay Out submenu.
We can see that our Horizontal Layout widget is now expanded to fi ll the whole window.
Now, place a widget right below the Horizontal Layout. This will be our custom widget, where we will plot Matplotlib Figure. Each widget is resized to take only half of the window space, but we want to give all the space we can to the custom widget.
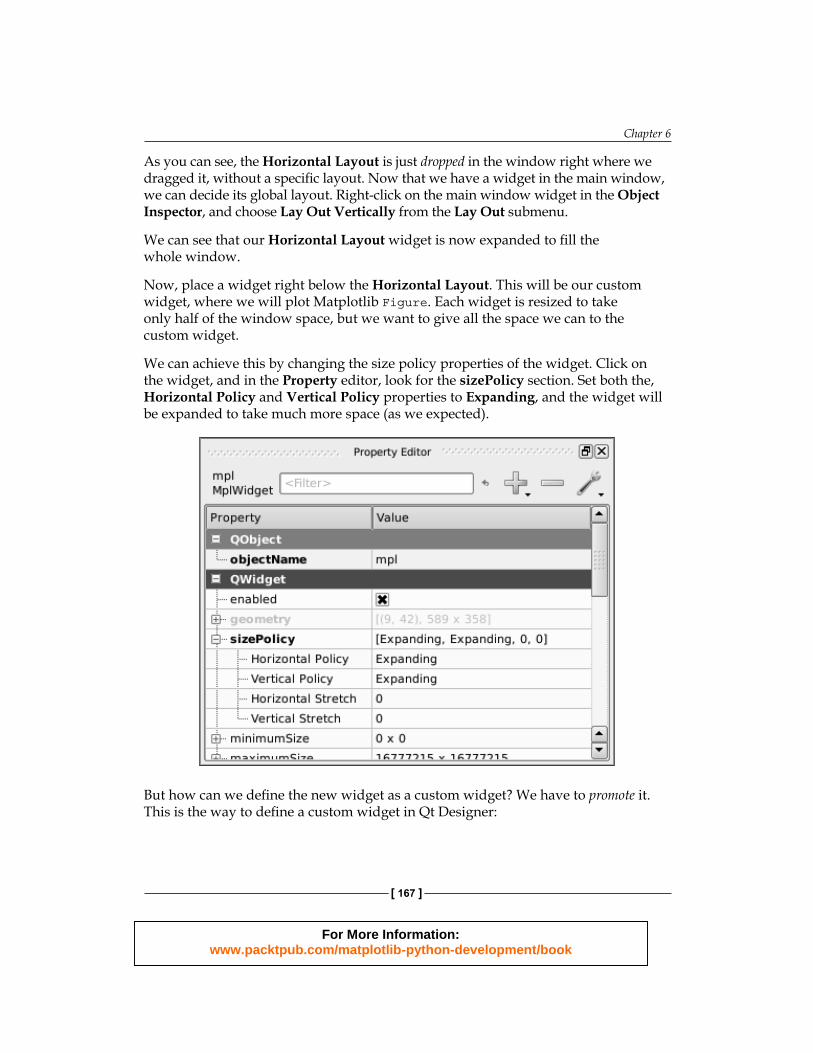
We can achieve this by changing the size policy properties of the widget. Click on the widget, and in the Property editor, look for the sizePolicy section. Set both the, Horizontal Policy and Vertical Policy properties to Expanding, and the widget will be expanded to take much more space (as we expected).
But how can we defi ne the new widget as a custom widget? We have to promote it. This is the way to defi ne a custom widget in Qt Designer:
For More Information:www.packtpub.com/matplotlib-python-development/book
Embedding Matplotlib in Qt 4
[ 168 ]
Select the widget, right-click on it and select Promote to... and a window will pop up. This is where we will defi ne our custom widget class name and the external library that manages it. We set Promoted class name to MplWidget to identify this as the widget for Matplotlib plotting, and Header fi le to mplwidget, that's the fi lename without the .py extension where we will write the Python code to govern its behavior. Add it to the promoted class, and fi nally promote the widget to it.
We have almost created the whole GUI, just another step left to go: add a menu with two items, one to select a fi le to parse and the other to close the application.
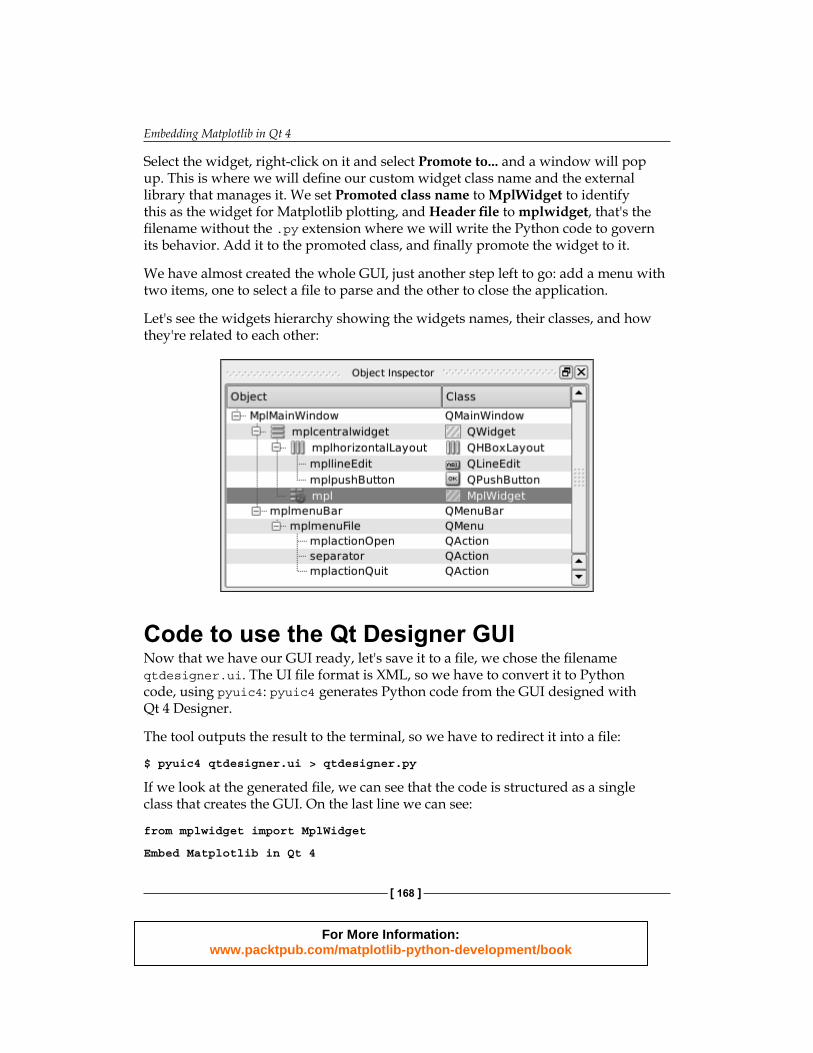
Let's see the widgets hierarchy showing the widgets names, their classes, and how they're related to each other:
Code to use the Qt Designer GUI Now that we have our GUI ready, let's save it to a fi le, we chose the fi lenameqtdesigner.ui. The UI fi le format is XML, so we have to convert it to Python code, using pyuic4: pyuic4 generates Python code from the GUI designed with Qt 4 Designer.
The tool outputs the result to the terminal, so we have to redirect it into a fi le:
$ pyuic4 qtdesigner.ui > qtdesigner.py
If we look at the generated fi le, we can see that the code is structured as a single class that creates the GUI. On the last line we can see:
from mplwidget import MplWidget
Embed Matplotlib in Qt 4
For More Information:www.packtpub.com/matplotlib-python-development/book
Chapter 6
[ 169 ]
This is the same name used in the Header fi le fi eld when promoting the widget.
This import connects the custom widget with the external Python code that controls it; in our example, the fi le that contains that code is mplwidget.py.
So let's give it a look:
from PyQt4 import QtGuifrom matplotlib.backends.backend_qt4agg \ import FigureCanvasQTAgg as FigureCanvasfrom matplotlib.figure import Figure
These are the usual imports for the Qt GUI widgets: the Matplotlib Qt4Agg backend canvas and the Figure object.
class MplCanvas(FigureCanvas): def __init__(self): self.fig = Figure() self.ax = self.fig.add_subplot(111) FigureCanvas.__init__(self, self.fig) FigureCanvas.setSizePolicy(self, QtGui.QSizePolicy.Expanding, QtGui.QSizePolicy.Expanding) FigureCanvas.updateGeometry(self)
This is the class that represents the Matplotlib Figure for the Qt backend; nothing new, we've already seen it in the previous examples.
class MplWidget(QtGui.QWidget):
This is an important class: the name must match with the one used for the custom widget defi ned in Qt Designer UI fi le, as this will manage widget drawing. The code is quite similar to what we already saw:
def __init__(self, parent = None): QtGui.QWidget.__init__(self, parent)
Here, we initialize the widget.
self.canvas = MplCanvas()
We instantiate the Matplotlib canvas object.
self.vbl = QtGui.QVBoxLayout()
Here, we create a layout manager (in this case a vertical box).
self.vbl.addWidget(self.canvas)
For More Information:www.packtpub.com/matplotlib-python-development/book
Embedding Matplotlib in Qt 4
[ 170 ]
We add the Matplotlib canvas to the layout manager.
self.setLayout(self.vbl)
Here, we delegate the layout handling to the vbl object.
The main program, 7900_06_04_qt_designer.py, will glue all the code together to create our application. It will:
• Import the UI• Defi ne the code to compose the application logic• Instantiate the QApplication with the window layout defi ned by our GUI• Start the main loop
At the beginning, we have the import part (as usual):
from __future__ import with_statement
This helps to open the fi le easily.
import numpy as np
NumPy is needed for its array support.
import sys
For command-line arguments, it is needed for QApplication instantiation.
from PyQt4 import QtCorefrom PyQt4 import QtGui
Here, we also import QtCore, the Qt submodules for non-GUI, low-level functions.
from qtdesigner import Ui_MplMainWindow
We import the main window designed with Qt Designer; the name of the main window in Designer is MplMainWindow and so pyuic4 creates a class called Ui_MplMainWindow that we can now import to have access to the main window object.
class DesignerMainWindow(QtGui.QMainWindow, Ui_MplMainWindow):
We now defi ne a class to merge the UI we have designed (with the Qt Designer) with the code to develop the application.
def __init__(self, parent = None): super(DesignerMainWindow, self).__init__(parent)
For More Information:www.packtpub.com/matplotlib-python-development/book
Chapter 6
[ 171 ]
We initialize the superclass.
self.setupUi(self)
setupUi() is a method of Ui_MplMainWindow, created by pyuic4 at conversion time.It is used to create the UI. The parameter is the widget in which the user interface is created.
QtCore.QObject.connect(self.mplpushButton, QtCore.SIGNAL("clicked()"), self.update_graph) QtCore.QObject.connect(self.mplactionOpen, QtCore.SIGNAL('triggered()'), self.select_file) QtCore.QObject.connect(self.mplactionQuit, QtCore.SIGNAL('triggered()'), QtGui.qApp, QtCore.SLOT("quit()"))
Here we need to introduce the concept of signals and slots.
Introduction to signals and slots One of the fundamental (and most innovative) concepts in Qt is signals and slots.
They are a very elegant solution which was introduced by Qt to let widgets interact. Signals are emitted (sent) by an object that wants to notify the world that something interesting just happened (usually in response to a user interaction, such as a click), and by connecting signals to slots, the notifi cation arrives to the slot of objects that are interested.
Slots are functions that respond to certain signals. When a signal is emitted, Qt executes all the slots that are connected to that signal.
We can also connect signals to other signals, creating a chain of notifi cations.
Signals and slots are primarily used for event handling, but they can also be used to let objects interact (keeping this fact hidden from them). Those objects know nothing about who emits the signals or where the slots are; it's all handled by Qt, so they are loosely coupled, resulting in more reusable components.
With the function QtCore.QObject.connect(), we connect a slot to a particular signal. The complementary function, QtCore.QObject.disconnect(), is used to remove the slot from the signal notifi cation. If a signal isn't connected to a slot, nothing happens; the component that emits the signal does not know if the signal is being used or not.
The general line for connect() is:
QtCore.QObject.connect(objA, QtCore.SIGNAL("QtSig()"), objB, QtCore.SLOT("QtSlot()"))
For More Information:www.packtpub.com/matplotlib-python-development/book
Embedding Matplotlib in Qt 4
[ 172 ]
It's made of four parameters:
• The sender, objA—the object emitting the signal• The signal, QtSig—the signal emitted• The receiver, objB—the object that will receive the signal• The slot, QtSlot—the slot that will react to the signal
In case objB is self, then we can omit the third argument:
QtCore.QObject.connect(objA, QtCore.SIGNAL("QtSig()"), QtCore.SLOT("QtSlot()"))
SIGNAL() is used to refer a signal, while SLOT() is used to refer a slot. The strings passed to those functions are used to look up dictionaries of signals and slots into Qt engine, so we have to match the defi nition precisely.
PyQt allows any Python callable (functions mainly) to be used as a slot, not just Qt slots. This is done by simply referencing the callable. As Qt slots are implemented as class methods, they are also available as Python callables. Therefore, it is not usually necessary to use QtCore.SLOT() for Qt slots.
So, we will end up with a line like this one:
QtCore.QObject.connect(objA, QtCore.SIGNAL("QtSig()"),pyFunction)
In our example, we used both formats: SLOT() is used to connect the quit() slot of qApp to the triggered() signal of Quit menu item, while Python function references are used for button clicked() signal and Open menu item triggered() signal.
A note about the order of signals receiving: there is no fi xed order for the arrival of signals at their destinations. If a signal is connected to more slots, then the slots are called in no particular order, every time the signal is emitted. Note that if two different signals are connected to two separated slots, then the slots are called in the order in which the signals are emitted.
Returning to the example Getting back to where we stopped:
def select_file(self):
This is the function called when the menu item Open is selected.
file = QtGui.QFileDialog.getOpenFileName()
For More Information:www.packtpub.com/matplotlib-python-development/book
Chapter 6
[ 173 ]
It creates a dialog to select a fi le, obtaining the selected fi le (if any).
if file: self.mpllineEdit.setText(file)
It saves the fi le to the Line Edit widget, but only if a fi le was selected in the dialog (think about what happens when we click on the Cancel button).
def parse_file(self, filename):
This function will take care of parsing the input fi le and extracting the information we will plot later.
letters = {}
We defi ne the dictionary that will hold the letters information.
for i in range(97, 122 + 1): letters[chr(i)] = 0
we initialize that dictionary with all the lowercase English letters (identifi ed in the ASCII table with numbers from 97 to 122) setting the value to 0.
with open(filename) as f: for line in f: for char in line: # counts only letters if ord(char.lower()) in range(97, 122 + 1): letters[char.lower()] += 1
For each line in the fi le and for each letter in that line, we check if it's a plain text letter, and in that case we increment the counter for it.
k = sorted(letters.keys()) v = [letters[ki] for ki in k] return k, v
At the end, we return the sorted dictionary keys with the related values.
def update_graph(self):
This function is called when the mplpushButton button is clicked and handles the graph update.
l, v = self.parse_file(self.mpllineEdit.text())
First of all, we get the letters and their frequencies by passing the fi le set in the Line Edit widget to parse_file().
self.mpl.canvas.ax.clear()
For More Information:www.packtpub.com/matplotlib-python-development/book
Embedding Matplotlib in Qt 4
[ 174 ]
Then we clear the Axes to ensure that the next plot will seem a completely new one, while we are reusing the same Figure and Axes instances.
self.mpl.canvas.ax.bar(np.arange(len(l))-0.25, v, width=0.5)
We plot a set of bars, one for each letter with the height set to the number of occurrences of that letter in the parsed fi le.
Note how we set up the bars: we shift their starting point by 0.25 to the left and the width is set to 0.5; this will result in bars centered on the X ticks.
self.mpl.canvas.ax.set_xlim(xmin=-0.25, xmax=len(l)-0.75)
We have to adjust the X limits. As said earlier, we shifted bars start by 0.25, so the minimum X value is -0.25; the maximum X value is len(l)-1 (the last tick position) but then we have to add 0.25 (half the bar width). With these limits, we have the bars perfectly fi tting into the plot area.
self.mpl.canvas.ax.set_xticks(range(len(l))) self.mpl.canvas.ax.set_xticklabels(l)
We set the X-axis ticks with their labels (the letters).
self.mpl.canvas.ax.get_yaxis().grid(True)
We draw a grid on the plot, but only for the Y-axis
self.mpl.canvas.draw()
Then we force a redraw of the canvas to show the changes we just did.
app = QtGui.QApplication(sys.argv)
As usual, we instantiate a QApplication to wrap our widget.
dmw = DesignerMainWindow()
we instantiate the main window.
dmw.show()
We show the main window.
sys.exit(app.exec_())
Then, we start the Qt main loop.
For More Information:www.packtpub.com/matplotlib-python-development/book
Chapter 6
[ 175 ]
The complete source code for mplwidget.py is:
# Python Qt4 bindings for GUI objectsfrom PyQt4 import QtGui
# import the Qt4Agg FigureCanvas object, that binds Figure to# Qt4Agg backend. It also inherits from QWidgetfrom matplotlib.backends.backend_qt4agg \ import FigureCanvasQTAgg as FigureCanvas
# Matplotlib Figure objectfrom matplotlib.figure import Figure
class MplCanvas(FigureCanvas): """Class to represent the FigureCanvas widget""" def __init__(self): # setup Matplotlib Figure and Axis self.fig = Figure() self.ax = self.fig.add_subplot(111)
# initialization of the canvas FigureCanvas.__init__(self, self.fig) # we define the widget as expandable FigureCanvas.setSizePolicy(self, QtGui.QSizePolicy.Expanding, QtGui.QSizePolicy.Expanding) # notify the system of updated policy FigureCanvas.updateGeometry(self)
class MplWidget(QtGui.QWidget): """Widget defined in Qt Designer""" def __init__(self, parent = None): # initialization of Qt MainWindow widget QtGui.QWidget.__init__(self, parent) # set the canvas to the Matplotlib widget self.canvas = MplCanvas() # create a vertical box layout self.vbl = QtGui.QVBoxLayout() # add mpl widget to vertical box self.vbl.addWidget(self.canvas) # set the layout to th vertical box self.setLayout(self.vbl)
For More Information:www.packtpub.com/matplotlib-python-development/book
Embedding Matplotlib in Qt 4
[ 176 ]
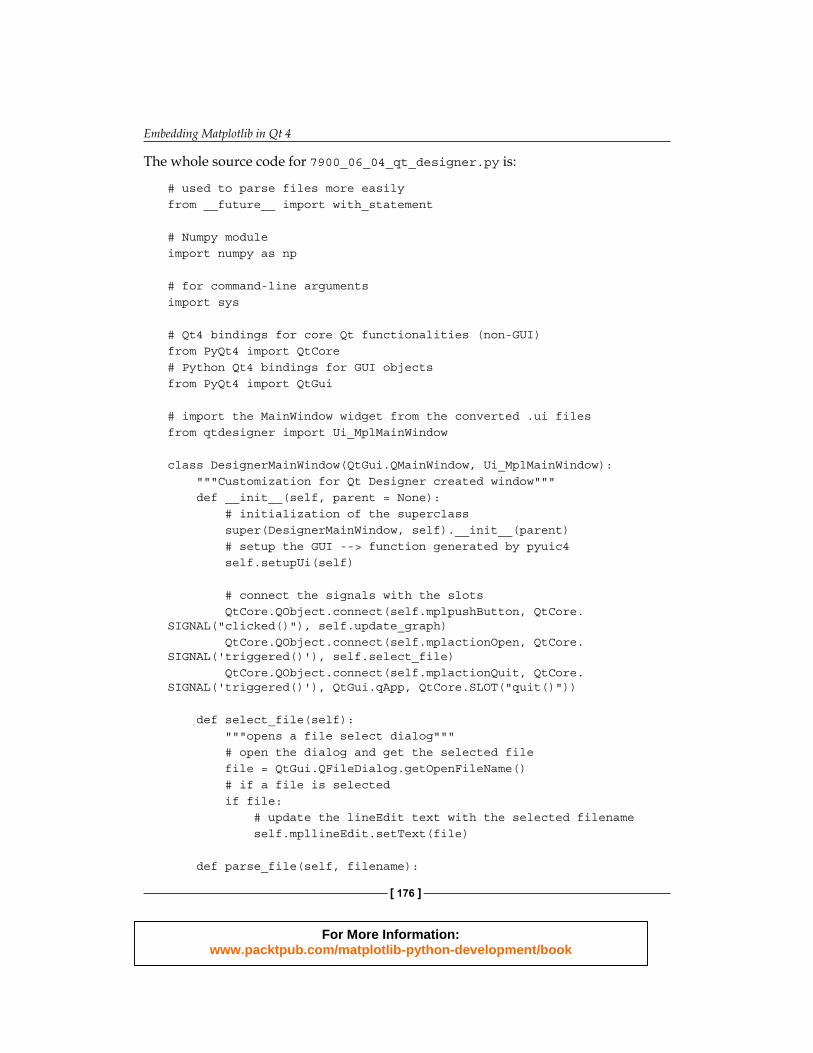
The whole source code for 7900_06_04_qt_designer.py is:
# used to parse files more easilyfrom __future__ import with_statement
# Numpy moduleimport numpy as np
# for command-line argumentsimport sys
# Qt4 bindings for core Qt functionalities (non-GUI)from PyQt4 import QtCore# Python Qt4 bindings for GUI objectsfrom PyQt4 import QtGui
# import the MainWindow widget from the converted .ui filesfrom qtdesigner import Ui_MplMainWindow
class DesignerMainWindow(QtGui.QMainWindow, Ui_MplMainWindow): """Customization for Qt Designer created window""" def __init__(self, parent = None): # initialization of the superclass super(DesignerMainWindow, self).__init__(parent) # setup the GUI --> function generated by pyuic4 self.setupUi(self)
# connect the signals with the slots QtCore.QObject.connect(self.mplpushButton, QtCore.SIGNAL("clicked()"), self.update_graph) QtCore.QObject.connect(self.mplactionOpen, QtCore.SIGNAL('triggered()'), self.select_file) QtCore.QObject.connect(self.mplactionQuit, QtCore.SIGNAL('triggered()'), QtGui.qApp, QtCore.SLOT("quit()"))
def select_file(self): """opens a file select dialog""" # open the dialog and get the selected file file = QtGui.QFileDialog.getOpenFileName() # if a file is selected if file: # update the lineEdit text with the selected filename self.mpllineEdit.setText(file)
def parse_file(self, filename):
For More Information:www.packtpub.com/matplotlib-python-development/book
Chapter 6
[ 177 ]
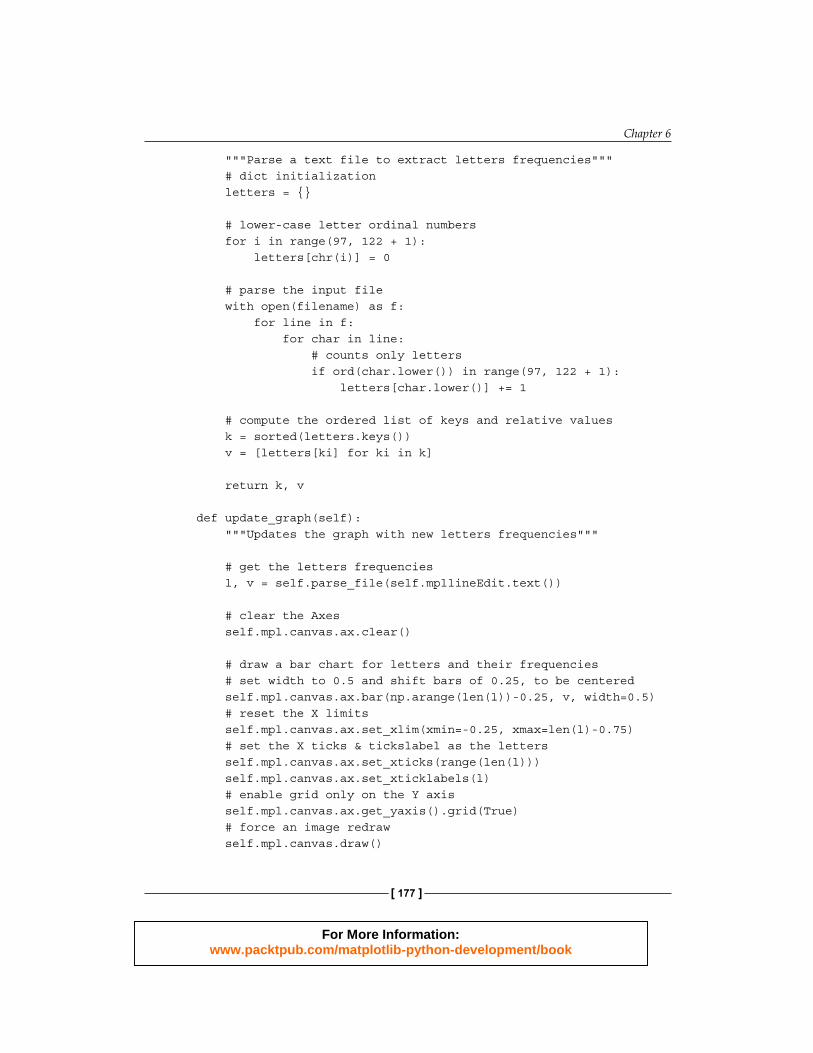
"""Parse a text file to extract letters frequencies""" # dict initialization letters = {}
# lower-case letter ordinal numbers for i in range(97, 122 + 1): letters[chr(i)] = 0
# parse the input file with open(filename) as f: for line in f: for char in line: # counts only letters if ord(char.lower()) in range(97, 122 + 1): letters[char.lower()] += 1
# compute the ordered list of keys and relative values k = sorted(letters.keys()) v = [letters[ki] for ki in k]
return k, v
def update_graph(self): """Updates the graph with new letters frequencies"""
# get the letters frequencies l, v = self.parse_file(self.mpllineEdit.text())
# clear the Axes self.mpl.canvas.ax.clear()
# draw a bar chart for letters and their frequencies # set width to 0.5 and shift bars of 0.25, to be centered self.mpl.canvas.ax.bar(np.arange(len(l))-0.25, v, width=0.5) # reset the X limits self.mpl.canvas.ax.set_xlim(xmin=-0.25, xmax=len(l)-0.75) # set the X ticks & tickslabel as the letters self.mpl.canvas.ax.set_xticks(range(len(l))) self.mpl.canvas.ax.set_xticklabels(l) # enable grid only on the Y axis self.mpl.canvas.ax.get_yaxis().grid(True) # force an image redraw self.mpl.canvas.draw()
For More Information:www.packtpub.com/matplotlib-python-development/book
Embedding Matplotlib in Qt 4
[ 178 ]
# create the GUI applicationapp = QtGui.QApplication(sys.argv)# instantiate the main windowdmw = DesignerMainWindow()# show itdmw.show()# start the Qt main loop execution, exiting from this script# with the same return code of Qt applicationsys.exit(app.exec_())
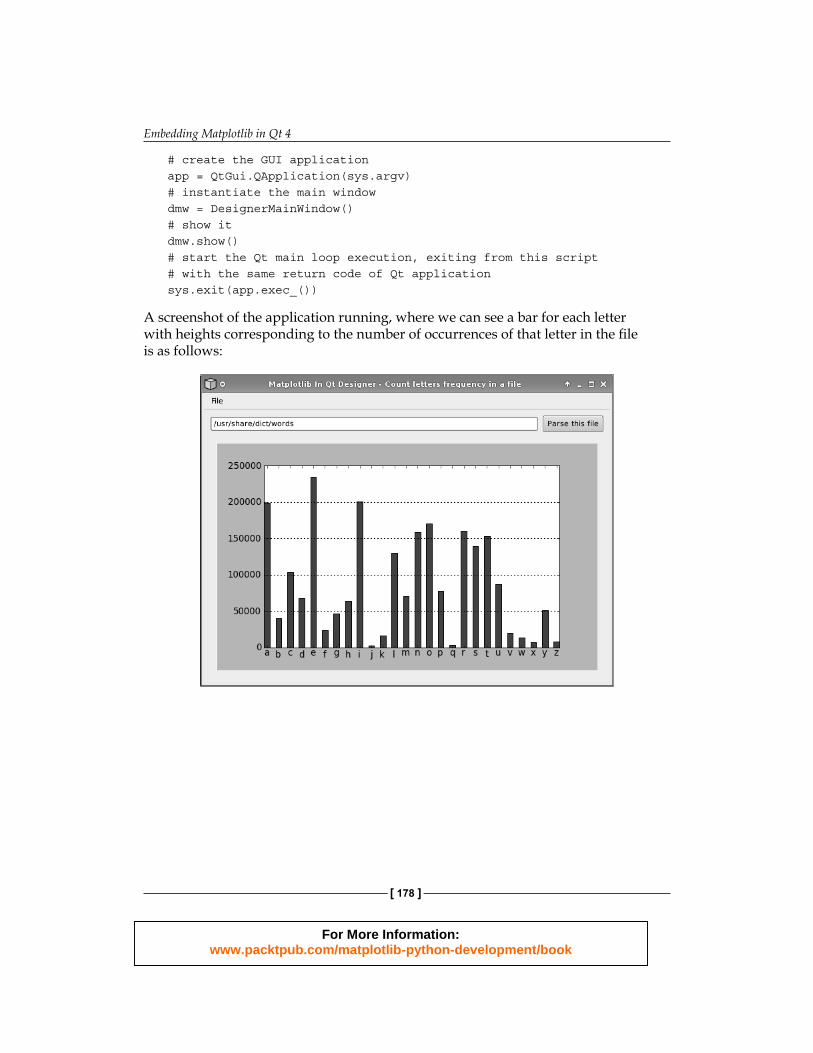
A screenshot of the application running, where we can see a bar for each letter with heights corresponding to the number of occurrences of that letter in the fi le is as follows:
For More Information:www.packtpub.com/matplotlib-python-development/book
Chapter 6
[ 179 ]
SummaryIn this chapter, we learned how to use Qt and Matplotlib together. Now we know how to:
• Embed a Figure in a QWidget• Use layout manager to pack a Figure and navigation toolbar in a QWidget• Create a timer, react to events, and update a Matplotlib graph accordingly• Use Qt Designer to draw a simple GUI and then refer it into our Python code
We are now ready to learn about another GUI library, wxWidgets.
For More Information:www.packtpub.com/matplotlib-python-development/book

Where to buy this bookYou can buy Matplotlib for Python Developers from the Packt Publishing website:http://www.packtpub.com/matplotlib-python-development/book
Free shipping to the US, UK, Europe and selected Asian countries. For more information, pleaseread our shipping policy.
Alternatively, you can buy the book from Amazon, BN.com, Computer Manuals andmost internet book retailers.
www.PacktPub.com
For More Information:www.packtpub.com/matplotlib-python-development/book