Mathematical modelling of epithelium homeostasis · Mathematical modelling of epithelium...
212
Mathematical modelling of epithelium homeostasis Elisa Domínguez Hüttinger DEPARTMENT OF B IOENGINEERING, I MPERIAL C OLLEGE L ONDON Supervisors: Reiko J Tanaka and Mauricio Barahona May 27, 2015 Submitted in partial fulfilment of the requirements for the degree of Doctor of Philosophy and the Diploma of Imperial College London
-
Upload
hoangthien -
Category
Documents
-
view
216 -
download
0
Transcript of Mathematical modelling of epithelium homeostasis · Mathematical modelling of epithelium...

Mathematical modelling of epitheliumhomeostasis
Elisa Domínguez Hüttinger
DEPARTMENT OF BIOENGINEERING,
IMPERIAL COLLEGE LONDON
Supervisors: Reiko J Tanaka and Mauricio Barahona
May 27, 2015
Submitted in partial fulfilment of the requirements for the degree of Doctor of
Philosophy and the Diploma of Imperial College London

Abstract
The body and organs of all animals are covered by epithelial tissues, such as the epidermis andthe airway epithelium. Epithelial tissues play a key role in protecting the body from environ-mental aggressors. Failure to maintain a competent epithelium can lead to the onset of manydiseases, including Atopic dermatitis (AD) and infection by Streptococcus pneumoniae. Treat-ment of AD is currently restricted to the relief of symptoms, mainly because the underlyingmechanisms remain elusive. Antibiotic resistance threatens the effectiveness of the prevalenttreatments for infection. Devising new and effective therapeutic strategies that halt the pro-gression of these diseases requires an understanding of the different disease mechanisms thatcan cause loss of epithelial homeostasis in different patients. Intricate regulatory networksof several biochemical and cellular interactions maintain epithelium homeostasis in healthyindividuals, but can also propagate different disturbances, resulting in a wide spectrum of pos-sible disease phenotypes. In this thesis, we propose mathematical models of these regulatorynetworks to analyse the mechanisms that lead to the onset and progression of AD and pneumo-coccal infection from a systems-level perspective. Our mathematical model of AD reproduced,for the first time, the different stages of the disease that have been observed in the clinic. More-over, we proposed different pathogenic mechanisms, triggered by different genetic and envi-ronmental risk factors that are known to predispose to AD. By assessing the effects of commontreatments for AD, we suggested effective treatment strategies that can prevent the aggravationof the disease, in a patient-specific way. Our data-driven mathematical model of pneumococ-cal infection identified four qualitatively different mechanisms by which co-infection can drivethe pathogenic process. They can be counteracted by distinctive treatment strategies that onlypartially involve antibiotics. Our work provides a theoretical framework for the integration andanalysis of clinical and experimental data describing epithelial homeostasis.

Contents
Abstract 1
Statement of Originality 9
Copyright Declaration 10
Acknowledgements 13
Acronyms and terminology 15
1 Introduction 181.1 Atopic dermatitis is a complex and socially relevant disease for which effective
treatment strategies are required . . . . . . . . . . . . . . . . . . . . . . . . . 211.2 Reducing the prevalence of infection by Streptoccoccus pneumoniae requires
new treatment strategies . . . . . . . . . . . . . . . . . . . . . . . . . . . . . . 231.3 Previous mathematical models of epithelium homeostasis . . . . . . . . . . . . 241.4 Motivation of the thesis . . . . . . . . . . . . . . . . . . . . . . . . . . . . . . 271.5 Aims and objectives . . . . . . . . . . . . . . . . . . . . . . . . . . . . . . . . 281.6 Main findings . . . . . . . . . . . . . . . . . . . . . . . . . . . . . . . . . . . 291.7 Publications . . . . . . . . . . . . . . . . . . . . . . . . . . . . . . . . . . . . 301.8 Structure and overview of the thesis . . . . . . . . . . . . . . . . . . . . . . . 31
2 Reaction network controlling epidermal homeostasis: the biology of Atopic der-matitis 322.1 Introduction . . . . . . . . . . . . . . . . . . . . . . . . . . . . . . . . . . . . 322.2 Structure and function of the epidermis . . . . . . . . . . . . . . . . . . . . . . 332.3 Symptoms and predisposing risk factors for Atopic dermatitis . . . . . . . . . . 34
2.3.1 AD characteristics . . . . . . . . . . . . . . . . . . . . . . . . . . . . 352.3.2 Genetic and environmental risk factors for AD . . . . . . . . . . . . . 37
2.4 Reaction network of biochemical interactions controlling epidermal homeostasis 38
1

2.4.1 Protease networks: Regulation of kallikrein (KLK) activity . . . . . . . 402.4.2 Skin barrier function . . . . . . . . . . . . . . . . . . . . . . . . . . . 412.4.3 Regulation of infiltrated pathogen load . . . . . . . . . . . . . . . . . . 422.4.4 IL1 and TLR mediated immune responses . . . . . . . . . . . . . . . . 422.4.5 Adaptive immune responses drive Th2 polarization . . . . . . . . . . . 43
2.5 Conclusions . . . . . . . . . . . . . . . . . . . . . . . . . . . . . . . . . . . . 43
3 Regulatory modules: Decomposition of the reaction network into network motifs 473.1 Introduction . . . . . . . . . . . . . . . . . . . . . . . . . . . . . . . . . . . . 473.2 Switch-like dose response behaviour characterizes the release of cytokines . . . 50
3.2.1 Bistability is a switch-like dose-response behaviour with memory . . . 503.2.2 Bistability characterizes immune responses . . . . . . . . . . . . . . . 503.2.3 Protease dependent innate immune reactions: KLK model . . . . . . . 523.2.4 Gata-3 mediated Th2 cell polarization . . . . . . . . . . . . . . . . . . 543.2.5 Network motifs that result in bistability: positive feedback and cooper-
ativity . . . . . . . . . . . . . . . . . . . . . . . . . . . . . . . . . . . 543.2.6 Phenomenological representation of bistable dose response behaviour
by a perfect switch . . . . . . . . . . . . . . . . . . . . . . . . . . . . 543.3 Self-recovery characterizes the barrier function components and is achieved by
negative feedback control . . . . . . . . . . . . . . . . . . . . . . . . . . . . . 573.3.1 Lipid content in the skin barrier is controlled by a double negative feed-
back and modulated by KLK activity . . . . . . . . . . . . . . . . . . 603.3.2 Filaggrin content is regulated by the interplay between a fast negative
feedback and a delayed positive feedback . . . . . . . . . . . . . . . . 613.3.3 Network motifs that result in self-recovering dynamical behaviour: The
key role of negative feedback . . . . . . . . . . . . . . . . . . . . . . . 633.3.4 Phenomenological description of the self-recovering dynamical behaviour
. . . . . . . . . . . . . . . . . . . . . . . . . . . . . . . . . . . . . . 643.4 Persistence of inflammation: Storing the memory of cytokine dynamics . . . . 653.5 Multi-scale structure of the reaction network controlling epidermal homeostasis 673.6 Conclusions . . . . . . . . . . . . . . . . . . . . . . . . . . . . . . . . . . . . 68
4 Modelling the early phases of AD: Interplay between protease-dependent innateimmune responses, barrier function and infiltrating pathogens 704.1 Introduction to the published paper in the context of the thesis . . . . . . . . . 704.2 Risk-factor dependent dynamics of atopic dermatitis:
Modelling multi-scale regulation of epithelium homeostasis . . . . . . . . . . 744.2.1 Abstract . . . . . . . . . . . . . . . . . . . . . . . . . . . . . . . . . . 74
2

4.2.2 Introduction . . . . . . . . . . . . . . . . . . . . . . . . . . . . . . . . 754.2.3 Multi-scale model for atopic dermatitis . . . . . . . . . . . . . . . . . 774.2.4 Bistable switch with hysteresis at the cellular level . . . . . . . . . . . 794.2.5 Dynamical behaviours in the multi-scale model . . . . . . . . . . . . . 814.2.6 Discussion . . . . . . . . . . . . . . . . . . . . . . . . . . . . . . . . 854.2.7 Appendix . . . . . . . . . . . . . . . . . . . . . . . . . . . . . . . . . 90
5 Modelling the effects of treatment of AD: Towards optimal patient-specific treat-ment for the early phases of AD 935.1 Introduction . . . . . . . . . . . . . . . . . . . . . . . . . . . . . . . . . . . . 935.2 Mathematical model of the treatments . . . . . . . . . . . . . . . . . . . . . . 945.3 Qualitative analysis of patient -specific treatment strategies for the early phases
of AD . . . . . . . . . . . . . . . . . . . . . . . . . . . . . . . . . . . . . . . 965.4 Conclusions and future work . . . . . . . . . . . . . . . . . . . . . . . . . . . 99
6 Modelling advanced stages of AD: The onset of adaptive immune responses 1016.1 Introduction . . . . . . . . . . . . . . . . . . . . . . . . . . . . . . . . . . . . 1016.2 Mathematical model of the advanced stages of AD . . . . . . . . . . . . . . . 1066.3 Onset of adaptive immune responses can be triggered by both genetic and en-
vironmental risk factors . . . . . . . . . . . . . . . . . . . . . . . . . . . . . . 1096.4 Conclusions . . . . . . . . . . . . . . . . . . . . . . . . . . . . . . . . . . . . 113
7 Mathematical model of AD: Conclusions and future work 114
8 Modelling host pathogen interactions between Streptococcus pneumoniae and theupper airway epithelium to understand co-infection 1208.1 Applying our modelling framework to understand the mechanisms that underlie
infection by commensal bacteria . . . . . . . . . . . . . . . . . . . . . . . . . 1208.2 Introduction . . . . . . . . . . . . . . . . . . . . . . . . . . . . . . . . . . . . 121
8.2.1 Previous mathematical models of host-pathogen interactions that occurat epithelial tissues . . . . . . . . . . . . . . . . . . . . . . . . . . . . 123
8.2.2 Novelty and timeliness of our approach . . . . . . . . . . . . . . . . . 1268.2.3 Aims and objectives . . . . . . . . . . . . . . . . . . . . . . . . . . . 126
8.3 The host-pathogen interactions that occur between Streptococcus pneumoniae
and the upper airway epithelium . . . . . . . . . . . . . . . . . . . . . . . . . 1288.4 Mathematical model of host-pathogen interactions to understand the dual role
of the epithelial barrier in determining the outcome of infectious processes . . . 1308.4.1 Model assumptions . . . . . . . . . . . . . . . . . . . . . . . . . . . . 130
3

8.4.2 Network motif representation . . . . . . . . . . . . . . . . . . . . . . 1338.4.3 Model parameters . . . . . . . . . . . . . . . . . . . . . . . . . . . . . 133
8.5 Qualitative dynamical behaviours . . . . . . . . . . . . . . . . . . . . . . . . . 1368.5.1 Epithelial homeostasis requires healthy clearance of a bacterial challenge1408.5.2 Recurrent flares of immune responses, barrier damage and infection . . 1428.5.3 Aseptic loss of homeostasis is characterized by sustained high immune
responses and barrier damage . . . . . . . . . . . . . . . . . . . . . . 1438.5.4 Sustained infection that fails to induce efficient immune responses . . . 1448.5.5 Total loss of homeostasis is characterized by high infiltration of im-
mune cells, loss of barrier function, and sustained infection . . . . . . . 1458.6 Uncovering the mechanisms that drive the lethal synergism that results from
co-infection . . . . . . . . . . . . . . . . . . . . . . . . . . . . . . . . . . . . 1458.6.1 Increase in the carrying capacity leads high invasion of bacteria, but no
associated barrier damage . . . . . . . . . . . . . . . . . . . . . . . . 1478.6.2 Decreased permeability barrier function leads to aseptic loss of home-
ostasis . . . . . . . . . . . . . . . . . . . . . . . . . . . . . . . . . . . 1488.6.3 Increased levels of resident neutrophils leads to aseptic loss of epithe-
lial homeostasis . . . . . . . . . . . . . . . . . . . . . . . . . . . . . . 1498.6.4 Desensitization of the TLR receptor leads to sepsis . . . . . . . . . . . 151
8.7 Conclusions . . . . . . . . . . . . . . . . . . . . . . . . . . . . . . . . . . . . 1528.8 Future work . . . . . . . . . . . . . . . . . . . . . . . . . . . . . . . . . . . . 153
9 Concluding remarks 155
A Mathematical representation of reaction networks 158
B Parameter estimation of the mathematical model describing the host-pathogen in-teractions between airway epithelium and Streptococcus pneumoniae 161
References 178
4

List of Figures
2.1 Structure and protective functions of the epidermis . . . . . . . . . . . . . . . 342.2 Causal interplay between the symptoms of Atopic dermatitis . . . . . . . . . . 362.3 Control structure of the reaction networks regulating epidermal homeostasis . . 45
3.1 Decomposition of the reaction network controlling epidermal homeostasis intoregulatory modules . . . . . . . . . . . . . . . . . . . . . . . . . . . . . . . . 49
3.2 Bistabile switching characterizes the dose-response behaviour of cytokine re-lease by active immune response pathways . . . . . . . . . . . . . . . . . . . . 51
3.3 Schematic representation of the qualitative dynamic behaviours of the hybridsystem described in the coupled equations 3.3 and 3.4. . . . . . . . . . . . . . 57
3.4 Self-recovery characterizes the barrier function components and is achieved bynegative feedback control . . . . . . . . . . . . . . . . . . . . . . . . . . . . . 59
3.5 Persistence of inflammation results from time-scale separation between fastcytokine dynamics and slow, cellular processes that involve mobilization ofimmune cells, triggered by cytokines . . . . . . . . . . . . . . . . . . . . . . . 66
3.6 A persistent network motif can act as a capacitor, by storing the history ofcytokine dynamics with a given frequency and amplitude of cytokine exposure 67
4.1 Reaction network mediating the early phases of AD: Interplay between protease-dependent innate immune responses, barrier function and infiltrating pathogens 72
4.2 Multi-scale model of the early phases of Atopic dermatitis . . . . . . . . . . . 804.3 Cellular-level switch-like behaviour . . . . . . . . . . . . . . . . . . . . . . . 814.4 Schematic representation of the three qualitative dynamic behaviours of skin
barrier integrity after environmental challenges . . . . . . . . . . . . . . . . . 834.5 Effects of risk factors . . . . . . . . . . . . . . . . . . . . . . . . . . . . . . . 844.6 Increase in skin vulnerability caused by the presence of multiple risk factors . . 86
5.1 A mechanistic representation of corticosteroid treatment results in a simplescaling of the dose response diagram describing protease mediated inflammation 96
5

5.2 Complete remission of AD can be achieved by treatment that drives the transi-tion from a unhealthy to a healthy steady state . . . . . . . . . . . . . . . . . . 98
5.3 Emollients decrease the frequency and amplitude of recurrent inflammation ina dose-dependent way . . . . . . . . . . . . . . . . . . . . . . . . . . . . . . . 99
6.1 Reversibility of mild and early forms of AD . . . . . . . . . . . . . . . . . . . 1026.2 Cartoon representation of the mechanisms leading to the onset of allergic sen-
sitization and the establishment of a pro-inflammatory micro-environment thatcharacterize the epidermis of AD patients with severe forms of AD . . . . . . . 104
6.3 Modular representation of the reaction network that underlies the onset of aber-rant adaptive immune responses. . . . . . . . . . . . . . . . . . . . . . . . . . 106
6.4 Increased risk factor severity, given by low FLG, high barrier damage, or syn-ergism between both, increases the frequency of the oscillations of the PAR2-mediated TSLP release . . . . . . . . . . . . . . . . . . . . . . . . . . . . . . 110
6.5 The onset of aberrant adaptive immune responses can be triggered by severeforms of individual genetic (FLG) or environmental (barrier damage) risk fac-tors. In combination, also mild forms of risk factors lead to allergic sensitization 111
8.1 Duality of the host-pathogen interactions between Streptococcus pneumoniae
and the airway epithelium . . . . . . . . . . . . . . . . . . . . . . . . . . . . . 1278.2 Reaction network underlying the host-pathogen interactions between Strepto-
coccus pneumoniae and the upper airway epithelium . . . . . . . . . . . . . . 1298.3 Network motif representation of the mathematical model of the host-pathogen
interactions occurring between Streptococcus pneumoniae and the airway ep-ithelium . . . . . . . . . . . . . . . . . . . . . . . . . . . . . . . . . . . . . . 134
8.4 Comparison of model simulations with in vivo data . . . . . . . . . . . . . . . 1388.5 Epithelial function is controlled by a two dimensional switch . . . . . . . . . . 1418.6 Epithelial homeostasis requires healthy clearance of a bacterial challenge . . . 1428.7 Recurrent flares of immune responses, barrier damage and infection . . . . . . 1448.8 Aseptic loss of homeostasis is characterized by sustained high immune re-
sponses and barrier damage . . . . . . . . . . . . . . . . . . . . . . . . . . . . 1458.9 Sustained infection that fails to induce efficient immune responses . . . . . . . 1468.10 Total loss of homeostasis is characterized by high infiltration of immune cells,
loss of barrier function, and sustained infection . . . . . . . . . . . . . . . . . 1468.11 Increase in the carrying capacity leads high invasion of bacteria, but no associ-
ated barrier damage . . . . . . . . . . . . . . . . . . . . . . . . . . . . . . . . 1488.12 Decreased permeability barrier function lead to an aseptic loss of homeostasis . 1498.13 Increased load of resident neutrophils results in loss of epidermal homeostasis . 150
6
8.14 Desensitization of the TLR receptor leads to sepsis . . . . . . . . . . . . . . . 151
A.1 Example reaction network. . . . . . . . . . . . . . . . . . . . . . . . . . . . . 160
B.1 Experimental techniques leading to quantitative dynamic experimental dataused for the parameter estimation and validation of the mathematical modelof the host-pathogen interactions between the airway epithelium and Strepto-
coccus pneumoniae. . . . . . . . . . . . . . . . . . . . . . . . . . . . . . . . . 172B.2 Data-points and model fit for the calculation of the barrier production rate κbp. . 173B.3 Data-points and model fit for the calculation of the bacterial growth rate κs and
carrying capacity µs . . . . . . . . . . . . . . . . . . . . . . . . . . . . . . . . 173B.4 Data-point and model fit for the calculation of the neutrophil death rate κnd . . 173B.5 Determination of the minimal bacterial concentration required for a significant
induction of TLR activity . . . . . . . . . . . . . . . . . . . . . . . . . . . . . 174B.6 Data-points and fitted dose-response curve of bacteria-mediated TLR activation
(parameters km and nH) . . . . . . . . . . . . . . . . . . . . . . . . . . . . . . 174B.7 Data-points and model fit for the calculation of the neutrophil- induced death
of bacteria (φNS) . . . . . . . . . . . . . . . . . . . . . . . . . . . . . . . . . . 175B.8 Data-points, model fit and validation for the calculation of the parameters quan-
tifying barrier damage by bacteria (θSabd and λSabp) . . . . . . . . . . . . . . . 175B.9 Estimation of parameters that quantify the rate of invasion of bacteria through
barrier (κSi and εS) . . . . . . . . . . . . . . . . . . . . . . . . . . . . . . . . 176B.10 Estimation and validation of parameters quantifying the switch-like damage of
barrier by neutrophils. . . . . . . . . . . . . . . . . . . . . . . . . . . . . . . . 176B.11 Switch-like dose response behaviour of barrier damage by basal neutrophils,
given by the parametrized scaled Hill function φnbBdF(Nb) . . . . . . . . . . . 177B.12 Model fit, model prediction and data-points showing the transmigration of neu-
trophils across a epithelial monolayer, parametrized by θnt and εn . . . . . . . . 177
7

List of Tables
2.1 Major genetic and environmental risk factors predisposing to the developmentof AD . . . . . . . . . . . . . . . . . . . . . . . . . . . . . . . . . . . . . . . 39
3.1 Parameters of the regulatory module controlling lipid dynamics (dimensionlessand arbitrarily chosen parameters for simulating equations 3.5) . . . . . . . . . 62
4.1 Parameters of the mathematical model of the early stages of AD . . . . . . . . 92
5.1 Parameters of the model of the treatment of the early phases of AD (dimen-sionless and arbitrarily chosen parameters for simulating equations 5.1) . . . . 97
8.1 Parameters of the mucosal barrier model . . . . . . . . . . . . . . . . . . . . . 137
8

Statement of Originality
This thesis and the research that is here presented, are product of my own work. Any ideasfrom the work of other people are fully acknowledged and appropriately referenced.
Elisa Domínguez HüttingerDepartment of Bioengineering
Imperial College London
9

Copyright Declaration
The copyright of this thesis rests with the author and is made available under a CreativeCommons Attribution Non-Commercial No Derivatives licence. Researchers are free to copy,distribute or transmit the thesis on the condition that they attribute it, that they do not use it forcommercial purposes and that they do not alter, transform or build upon it. For any reuse orredistribution, researchers must make clear to others the licence terms of this work.
10


This thesis is dedicated to my parents,
Christine Hüttinger and Raúl Domínguez Martínez.
We are a family of story-tellers.
The language of this narrative is mathematics,
its subject, biology,
and the plot, a process.
12

Acknowledgements
I would like to express my most sincere gratitude and admiration to my supervisor, DrReiko J Tanaka, for her constant support, motivation, guidance, encouragement and commit-ment during this research project. It has been a privilege and pleasure to have been part of thisprocess.
To my co-supervisor, Prof Mauricio Barahona (Department of Mathematics, Imperial Col-lege London) for his support, fruitful discussions and fundamental inputs to this research.
To my collaborators: Dr Masahiro Ono (University College London), Dr Georgios Stamatas(Johnson and Johnson), Dr Thomas B Clarke (Department of Medicine, Imperial College Lon-don), Dr Mariko Okada (RIKEN), Prof Alan Irvine (Trinity College Dublin), Dr Diego Oyarzún(Department of Mathematics, Imperial College), Dr Alejandro Colman-Lerner (Universidad deBuenos Aires), Dr Marina Macías-Silva (Universidad Nacional Autónoma de México) and DrYuzuru Sato (visiting researcher at Imperial College London), for enriching this research withtheir knowledge and expertise.To William Nightingale and George Buckle, for their interest, motivation and valuable inputsto this research project.To all my colleagues from the Biological Control Systems Lab., particularly to the membersof the ”epithelium-team”, Panayiotis Christodoulides, Mark van Logtestijn, Dr Neville J Boonand Matthias Malagó. It has been a real pleasure to work with you guys! Also to AlejandroAdrián Granados Castro and to Sang Y Lee for very insightful discussions. Thanks also to pastmembers of the group, particularly to Dr Andrea Y Weiße and to Dr Paula Freire-Pritchett.I am thankful for advice and discussions with Dr Heather Harrington, Dr Mariano BeguerisseDiaz, Dr Michael Schaub, Dr Borislav Vangelov, Dr Claire Higgings, Dr Martina Wicklein, DrKit Longden (Janela Research Campus), Dr Osbaldo Resendis Antonio (INMEGEN), Dr JuanCarlos Martínez García (Cinvestav) and Dr María Elena Álvarez-Buylla (UNAM).I am grateful for the support provided by my mentor, Dr Emmanuel Drakakis.
This thesis benefited strongly from the insightful comments and discussions with my examin-ers, Dr Stan Marée (John Innes Centre) and Dr Krishnan (Department of Chemical Engineering,Imperial College London).
The constant support and love from my family have been vital for accomplishing this task.Thanks to all the members of my ”family - sets”: Hüttinger (Christine, Helmut, Alexander,Ariane, Carolina, Julia, Gabriel, Paul, Angie and Pao), Domínguez (Raúl, Malú, Pepe, Mariana,Gabriela, Alejandro and Lulú) and Kronberger (Michi, Anna, Matilda and Maciej).
13

I want to thank my family in London: Alonso Castillo Ramírez (a.k.a. the ”real” Uri Alon),Daniela Franco Bodek (my official guru), Maria Fernanda Jiménez Sólomon (Sra M.F. - mybig sister!) -for being my family in London.
Thanks to my ”fellow-expats” Lorena Segura Morán and Olga Beatriz Zurita Rendón, for allthe ”cronopian” adventures that gave me a burst in life, energy and motivation throughout thisprocess.I want to express my appreciation to my friend Victor Hugo Jiménez Sánchez for being on myside all these years. To Elena Phoka, Dan Cook and Aleksandra Berditchevskaia for all thesunny moments that illuminated this research project. To Pável Hernández Ramírez, for allthe motivation and encouragement. To Edgar Salomón García Treviño, for promoting a lyricalview of engineering research.
I am very grateful to Filotheos Bezerianos, who supported me enormously during a substan-tial part of these years.
I want to give a special thanks to Léna Tanaka-Jammes, who motivated the beginning of thisresearch project.
This work was founded by CONACyT (scholarship 212800) and supported by a EPSRCgrant (through a Career Acceleration Fellowship to Reiko J Tanaka) and by the SantanderMobility Award 2013.
14

15

Acronyms and terminology
AD Atopic dermatitis.
AJ Adherens Junctions.
AMP Anti-Microbial Peptide.
BALF Broncheo-alveolar lavage fluid.
BD-2 β-defensin (type of AMP).
CDS Corneodesmosome (intercellular junction between corneocytes).
CFU Colony Forming Units.
DC Dendritic cell.
DDE Delay Differential Equations.
HAE Human Airway Epithelial cell culture.
HBE Human Broncheal Epithelial cell culture.
IBD Inflammatory Bowel Disease.
IL-1 Interleukin 1.
KLK Kallikrein (a protease).
NHEK Normal Human Epidermal Keratinocytes.
OD Optical Density.
PAMP Pathogen-Associated Molecular Pattern.
PAR2 Protease-activated Receptor.
16

PPI Protein-Protein Interactions.
PWA Piecewise Affine Function.
QSSA Quasi-steady state approach.
RHE Reconstructed Human Epidermis.
SC Stratum corneum.
SG Stratum Granulosum.
SNP Single Nucleotide Polymorphism.
T84 Human Colonic adenocarcinoma cell line.
TEER Trans-Epithelial Electrical Resistance (directly related to permeability barrier functionof epithelial monolayers).
TEWL Trans-Epidermal Water Loss (inversely related to epidermal permeability barrier func-tion).
TF Transcription Factor.
TJ Tight Junctions.
TLR Toll-Like Receptor (Innate immune response receptor).
TSLP Thymic Stromal Lympho-Poietin.
17

Chapter 1
Introduction
The body and the organs of all animals are covered by a tissue type termed epithelium [1]. Forexample, the outermost layer of the skin is enacted by the epithelial tissue called epidermis,and the respiratory tract is covered by airway epithelium [1]. Being directly in contact withthe environment, one of the main functions of the epithelium is to regulate the exchange ofsubstances between the self and the environment [2]. It plays a pivotal role in protecting thebody from environmental aggressors, such as pathogens or chemicals, and also mediates theexchange of water and nutrients [1].Accordingly, loss of epidermal function is associated to a wide variety of diseases, includinginfection [3, 4, 5, 6], allergies [7, 8, 1, 9, 10, 11, 12, 13], and cancer [14, 15]. Despite the highprevalence of these diseases [16, 17, 18, 19, 20, 18, 21, 22], the different mechanisms that cancause many of them have not yet been clarified, hindering the effectiveness of treatment andpreventive strategies [23, 24, 25, 12].The epithelium protects against environmental aggressors by two means: First, it enacts a phys-ical permeability barrier that hinders the penetration of external substances. Second, epithelialcells are able to mount immune responses that eradicate environmental aggressors that haveinfiltrated through the epithelial barrier [14].Interestingly, while a competent epithelial barrier function prevents the onset of unnecessaryimmune responses [10, 26, 13, 27], immune responses can lead to tissue-damaging inflamma-tion that impair barrier function [28, 29, 30, 31, 32]. Given this complex interplay betweenbarrier function and immune responses, a coordinated and balanced action of these two pro-tective properties is necessary to maintain a competent epithelium that prevents the onset ofdiseases [14, 1, 8].Coordination between barrier function and immune responses is achieved through strongly in-terconnected regulatory networks between the different biochemical and cellular componentsof the epithelium that enact barrier function and immune responses, respectively [33]. For ex-ample, both barrier components and anti-microbial substances are simultaneously produced in
18

response to physical damage to the epidermis [34] or to the colon [35]. Also, pro-inflammatorycytokines reduce the expression of epithelial barrier components in the airway epithelium [28]and in the epidermis [36]. The integrity of intercellular junctions that determine the perme-ability of epithelial tissues is affected by immune cells [30, 31] and signalling pathways thatmediate the immune responses [37, 38, 26]. In contrast, disruption of intercellular junctionsactivates signalling pathways that trigger immune responses [10] and triggers the recruitmentof pro-inflammatory cytokines to the epithelium [13, 27, 39].A myriad of genetic and environmental predisposing risk factors can impair the functioning ofindividual components of these regulatory networks, eventually triggering a pathogenic process[40, 41, 42, 11]. Genetic risk factors include mutations or polymorphisms that impair the levelsof expression of components of the epithelial barrier [43], of protease inhibitors controllingbarrier function and inflammation [44], of cellular receptors that sense the competence of theepidermal barrier function [45], and of cellular receptors that sense the pathogen load [46]. En-vironmental risk factors include an abnormal exposure to pathogens [14, 47, 48] or chemicals[49] and the immoderate use of soaps and detergents [50, 8].Thus far, the links between these predisposing risk factors and the development of diseaseshave been studied mainly by experimental and clinical methods that assess how individual riskfactors affect individual components of the regulatory networks. However, loss of epithelialhomeostasis often emerges from impaired interactions between the strongly entangled networkcomponents, and can seldom be attributed solely to the malfunction of an individual networkcomponent [51, 52, 53]. Hence, understanding how risk factors result in the development ofdisease requires a systems-level view, that considers the interplay between the different compo-nents of the regulatory networks of biochemical and cellular interactions that control epithelialfunction.
In this thesis, we analyse the mechanisms responsible for the maintenance of epidermalhomeostasis from a systems- biology perspective. Particularly, we propose mathematical mod-els of the regulatory networks of entangled biochemical and cellular interactions that controlepithelial function, and analyse the impact of predisposing risk factors on the functioning ofthese networks.We use the mathematical model to describe and understand the transition form a healthy ep-ithelium to a pathological state. This requires a dynamic description that considers the mul-tiple time-scales in which the different biochemical and cellular processes that underlie thepathogenic process operate.To achieve this, we represent the regulatory interactions controlling epithelial homeostasis inthe form of coupled systems of Ordinary Differential Equations (ODE) that operate at differ-ent time-scales. This mathematical framework assumes spatial homogeneity of the reactions
19

modelled. We [54] and others [55, 56, 57, 58, 59, 60, 61] have analysed different aspects of thespatial regulation of epithelial function, but the interplay between barrier function and immuneresponses has not been addressed within a spatial framework. Among other clinically relevantquestions, spatial assessment of the epithelial function in the context of AD or pneumococcalinfection could help to address the conditions required for the spread of infection and inflam-mation when epithelial homeostasis is lost. This analysis could be done using compartmentmodels, as in [54], Partial Differential Equations (PDEs) as in [59, 61], or agent-based modelsas in [56, 57, 58]. However, for simplicity, in this thesis, such a spatial analysis is neglected,and left for future work.Here, we first build and characterize mechanistic models of the sub-networks that determinethe activity of the main biochemical and cellular effectors that enact the immune responses andthe epithelial barrier function, respectively. They correspond to regulatory modules that con-trol the levels of pro-inflammatory cytokines, of immune cells and of structural components ofthe epithelium. We find that these regulatory modules can be grouped into different network
motifs that display distinctive qualitative behaviours that can be described in a simpler, phe-nomenological manner. We then re-assemble and analyse the regulatory networks controllingepithelial homeostasis by connecting the individual, phenomenologically represented regula-tory modules. This mesoscopic and qualitative description of the reaction network allows us toanalyse and extract the main control mechanisms that are responsible for the maintainance ofepithelial homeostasis.With our multi-scale and modular approach, we are able to obtain a mechanistic and quantita-tive description of pathological processes related to the loss of epithelial homeostasis.Our mathematical models serve as frameworks for the integration and analysis of scattered ex-perimental and clinical data, and reveal several potential mechanisms that are responsible forthe maintenance of epithelial homeostasis.
We focus on two diseases: Atopic dermatitis (AD), an allergic skin disease, and infection ofthe airway epithelium by Streptococcus pneumoniae. Both of these diseases represent a impor-tant social burden, given by their high incidence [19, 18, 20, 21] and ineffectiveness of currenttreatment strategies that can be attributed to the lack of understanding of the causes of AD[17, 11, 62, 24, 25, 63, 64, 65, 66] and the incipient threat of antibiotic resistance of evolvingstrains of Streptococcus pneumoniae [23].It is thus urgent to devise new therapeutic strategies that effectively prevent and cure AD andpneumococcal infection. This requires a understanding of the different pathogenic mechanismsthat underlie the development of these diseases.AD and infection by Streptococcus pneumoniae result from a loss of homeostasis of the epi-dermis [7, 8, 67] and the airway epithelium [68, 69, 38], respectively.
20

In both cases, loss of epithelial function results from an imbalance between the two protec-tive properties of the epithelium. i.e. permeability barrier function and immune responses toinvading pathogens [7, 70, 71, 72, 30]. In the epidermis and in the airway epithelium, thesetwo protective properties are co-regulated by an intricate network of biochemical and cellularinteractions [34, 36, 37, 28, 30, 38, 26]. Understanding the interplay between these two pro-tective properties, given by the entangled regulatory networks that control barrier function andimmune responses, is pivotal to elucidate the disease mechanisms of AD and pneumococcalinfection.Further, both in the epidermis [43, 73, 74, 75, 76, 47, 77, 40, 11, 47, 48, 49, 50] and in theairway epithelium [69, 78, 21], loss of epithelial homoeostasis can be triggered by differentmechanisms. Elucidating mechanism-dependent pathogenic process is essential to propose ef-fective, patient-specific treatment strategies.Given these common structural features, we believe that the mechanisms that underlie the onsetand progression of these apparently disparate diseases can be uncovered by our mathematicalmodelling framework, based on the analysis of the dual interplay between immune responsesand permeability barrier function.
1.1 Atopic dermatitis is a complex and socially relevant dis-ease for which effective treatment strategies are required
AD is a skin disease characterized a defective epidermal permeability barrier function that ap-pears as dry and scaly skin, and by aberrant immune responses to environmental insults, man-ifested as excessive inflammation and allergy [17]. AD affects approximately 15% of infantsworldwide (20% in the United Kingdom [19], 15% in Germany [18] and 10% in Nigeria [20]),and its incidence has been rapidly increasing [18, 19, 18]. Moreover, patients with a clinicalhistory of AD have a strong predisposition for developing other atopic diseases, such as asthmaand allergic rhinitis [17, 11, 62].In terms of its economic impact, the average costs of treating AD per patient per year has beenestimated to represent up to 4,480 USD in the United States of America [79] and 1425 EUR propatient per year in Germany [18]. These costs are increasing with the augmenting prevalenceof AD [80].Despite its clear socio-economic relevance, the mechanisms leading to AD have not been fullyelucidated, limiting the treatment options to the relieve of symptoms [17, 24, 25]. For instance,emollients enhance the permeability barrier function [40], steroids decrease the inflammation[66], and antibiotics reduce the infection that results from a defective epithelial function [81].However, long term treatment does not guarantee remission of the disease [63], and can even
21

lead to aggravation of the AD condition by further affecting the epidermal structure [64, 65, 66].The complexity of understanding and treating AD is further increased by the facts that several
different predisposing genetic [43, 73, 74, 75, 76, 47, 77] and environmental [40, 11, 47, 48,49, 50] risk factors have been linked to the development of AD, and that the pathogenesis ofAD comprises several different phases, characterized by distinctive epidermal phenotypes ofincreasing severities [25, 81]. Together, these two observations suggest that effective treat-ment strategies must account for the risk-factor and disease-stage dependent, patient-specificpathogenic process of AD. Hence, devising effective treatment for AD is a challenging taskthat requires a mechanistic and clear understanding of the full pathogenic process of AD.AD results from dysfunction of the regulatory networks of biochemical and cellular interac-tions that control epidermal homeostasis [43, 73, 74, 75, 76, 47, 77, 40, 11, 47, 48, 49, 50],leading to the impaired immune responses and barrier function that characterize the damagedepidermis of AD patients. In fact, the pathogenic effects of the predisposing risk factors forAD have been attributed to the impact of these genetic or environmental conditions on the reg-ulatory networks controlling epithelial homeostasis [43, 74, 47, 40, 50]. However, due to thestrong connectivity of these regulatory networks, the disturbances elicited on them by indi-vidual risk factors can propagate [8, 36, 13], gradually affecting the whole regulatory networkcontrolling epithelial homeostasis and resulting in disease phenotypes of increasing severities[25, 82]. Thus, understanding the relative contributions of the individual risk factors on thepathogenesis of AD requires a systems-level framework, that considers the interplay betweenthe co-regulated network components that control epithelial function.Here, we propose such a systems-level framework, in the form of a mathematical model ofthe regulatory mechanisms that control epithelial function and that are affected by the differentrisk factors that predispose to AD. Through mathematical modelling, we aim to uncover themechanisms that underlie pathological dynamics, as proposed in [83].In this thesis (chapters 2, 3, 4, 5 and 6), we build on the previous research from our group[84] to propose the first mathematical model of AD. The focus of our model is the analysisof the complex interplay that exists between the permeability barrier function and the immuneresponses to invading pathogens. For this, we consider different time-scales to simultaneouslydescribe the slow, cellular level processes and the fast, biochemical reactions that, together,maintain epidermal homeostasis.The resulting mathematical model provides a coherent explanatory framework for differentpathogenic mechanisms that can result in an AD condition.
22

1.2 Reducing the prevalence of infection by Streptoccoccuspneumoniae requires new treatment strategies
Yearly, 14.5 million severe cases of infection and 820 000 deaths are caused by Streptoccoccus
pneumoniae [21]. Further, the effectiveness of treating infection by Streptoccoccus pneumo-
niae and other bacterial pathogens is threatened by the incipience of antibiotic resistance [23].Thus, new therapeutic strategies for preventing and treating infection by Streptoccoccus pneu-
moniae are required. For this, a mechanistic and quantitative understanding of the infectiousprocess is necessary.Steptococcus pneumoniae is a bacteria that normally resides in the upper airway epithelium asa commensal organism that does not cause infection. However, circumstances such as colo-nization of the airway epithelium by other pathogens including Haemophilus influenzae, cantrigger an infectious process by Steptococcus pneumoniae, eventually developing into a severeinfection [21, 69].Systemic infection by Steptococcus pneumoniae starts by impaired host-pathogen interactionsbetween the upper airway epithelium and Steptococcus pneumoniae. This disruption is oftentriggered by the presence of a second pathogen [78, 69], but the exact pathogenic mechanismsare not clear.An appropriate host response that prevents infection requires a competent epithelial barrierfunction and immune responses. However, these two protective properties of the epitheliuminhibit each other. On the one hand, a competent barrier not only restricts bacterial invasion[85, 68, 38], but also limits the access of components of the immune systems to the site of in-fection [30, 86, 71, 87]. On the other hand, while reducing the pathogen load [88, 89], immuneresponses also damage the epithelial barrier [30, 86, 71, 87].Thus, infection results from an unbalanced host-response to the invading pathogen [90]. Under-standing the mechanisms by which co-pathogenesis triggers infection hence requires a quanti-tative systems-level framework that considers the complex interplay between barrier function,immune responses and pathogen load.In this thesis (chapter 8), we propose a mathematical model of the host pathogen interactionsbetween Streptococcus pneumoniae and the upper airway epithelium.Our model builds on previous models of pneumococcal infection [91, 92, 93, 94], and consid-ers, for the first time, the role of the epithelial barrier in mediating the infectious process, aswell as the complex interplay between barrier function and immune responses.Our data-driven mathematical model was calibrated with experimental data, and uncovereddifferent potential mechanisms that can result in infection.
23

1.3 Previous mathematical models of epithelium homeosta-sis
The mathematical models proposed in this thesis correspond to dynamical descriptions of theregulatory networks controlling epithelial homeostasis.We focus on the interplay between the two protective properties of the epithelium, namely theimmune responses and permeability barrier function. In our models, we represent the intercon-nected processes that control the biochemical and cellular mediators of the immune responseand barrier function by coupled systems of ODEs that operate at different time-scales.
Many of the previous mathematical models of epithelium function consider either perme-ability barrier function, or the immune responses to infiltrating pathogens. Only a handfulof models explore how epithelium homeostasis is maintained through a controlled interplaybetween immune responses and the permeability barrier function.
Two types of models explore permeability function of epithelial tissues.The first type encompasses the pharmacokinetic models, which assess the relation betweenstructure and composition of epithelial barriers (particularly, the skin barrier) with the perme-ability barrier function. These models are commonly used to gain a quantitative understandingof the penetration of substances (such as topical drugs) through the epidermis [95].The second type of models focuses on exploring how the structure of epithelial tissues (partic-ularly, epidermis [56, 57, 58, 59] and the intestine [60, 61]), is regulated. The dynamics of theepithelial cells are represented by multi-scale models, that consider the interplay between birth,death, migration and differentiation of sub-populations of cells in the tissue, and the biochem-ical processes that operate within the individual cells. The mathematical formalisms used forthe construction of these models comprise deterministic rule-based representations of the cel-lular kinetics [56, 57, 58], stochastic agent-based models [96] and PDEs [61, 59],allowing theanalysis of the spatial regulation of epithelial tissues. These modes were used, for example, tounderstand the mechanisms responsible for the self-renewal of healthy epidermis [56, 57, 58],as well as diseases such as psoriasis [96, 97], tissue damage by Human Papilloma Virus (HPV)[59], and colorectal cancer [60, 61].
Some other mathematical models have focused on the immune responses that occur on ep-ithelial tissues. For example, the ODE-based model of [98] considers the immune responseselicited by macrophages in response to cholesterol that leaks through a disrupted endothelium.This model could capture the early stages of atherosclerosis, although it neglects the effects ofchronic, tissue-damaging inflammation on the endothelial barrier function, although a impaired
24

permeability barrier function is also a characteristic feature of this disease [98].The ODE-based mathematical model of [99] describes how dose-response curves of cytokinesare affected by different micro-environments. The different dose-response behaviours are ob-tained by simulating the interplay between different populations of cytokine-producing cellsthat occur in healthy or in psoriatic epidermis.Most of the mathematical models of host-pathogen interactions that occur at epithelial surfacesfocus on the relation between different pathogens and the immune responses. For example,the ODE model proposed in [100] explores the host response to E coli to understand mastitis.Also, the model in [101] considers the mechanisms leading to infection in the stomach by Heli-
cobacter pylori. Mechanisms leading to pneumonia, a infection that results from impaired hostresponse between Steptococcus pneumoniae and the airway epithelium, have been analysed inthe models proposed in [91, 94] and [92] that do not consider the permeability barrier function.More abstract models [102, 103] have focused on the dual effect of immune responses onpathogen load. On one hand, immune responses can lead to effective elimination of the pathogen,and on the other, persistent immune responses result in tissue damage that promotes furtherpathogen growth.Several mathematical models of viral infection consider the role of the epithelium mediatingviral replication, but neglect its permeability barrier function that hinders the infection of theblood stream or other organs [5]. Examples include the models of infection by Influenza Avirus [104, 105], by Epstein Barr virus [106], and of the dynamics of foot-and-mouth disease[107].
Previously, two mathematical models that consider the role of the dual interplay betweenthe the permeability barrier function and the immune responses have been used to uncoverthe mechanisms that are responsible for the development of diseases associated to the loss ofepithelium homeostasis, namely Inflammatory Bowel Disease (IBD) [108] and colon cancer[109].The mathematical model of IBD proposed in [108], considers the interplay between pathogens,epithelial barrier function and the immune responses. IBD is characterized by a recurring in-flammatory response to commensal bacteria of the gut, caused by a decreased amount of anti-inflammatory immune response mediators that lead to a increased propensity of inflammation inIBD patients. In their ODE model, IBD is represented by setting a non-zero rate of productionof immune cells that both amplify the inflammation and also damage the epithelium. Simula-tions of a nominal interaction network reproduces the characteristic, transient immune responseand barrier damage that results from a bacterial challenge observed in healthy patients. In con-trast, simulations of the IBD condition results in a chronic decrease in the epithelial barrierfunction and unresolved inflammation, typical of IBD patients. Thus, their model successfully
25
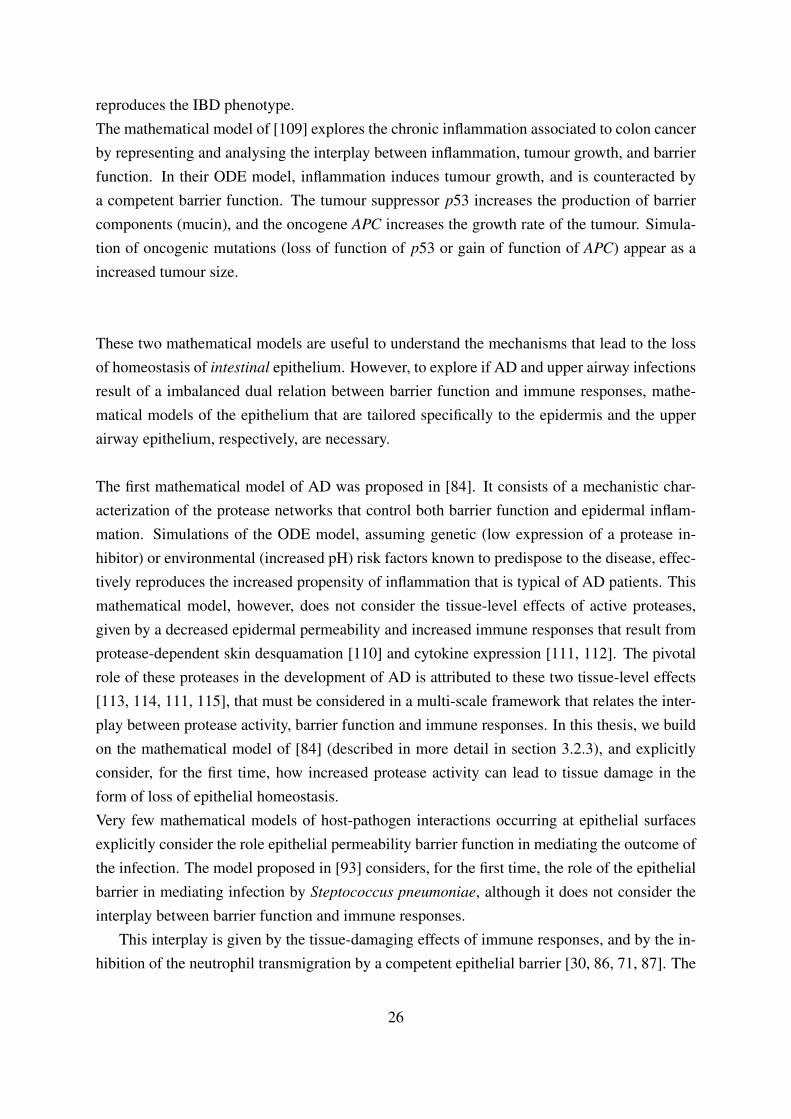
reproduces the IBD phenotype.The mathematical model of [109] explores the chronic inflammation associated to colon cancerby representing and analysing the interplay between inflammation, tumour growth, and barrierfunction. In their ODE model, inflammation induces tumour growth, and is counteracted bya competent barrier function. The tumour suppressor p53 increases the production of barriercomponents (mucin), and the oncogene APC increases the growth rate of the tumour. Simula-tion of oncogenic mutations (loss of function of p53 or gain of function of APC) appear as aincreased tumour size.
These two mathematical models are useful to understand the mechanisms that lead to the lossof homeostasis of intestinal epithelium. However, to explore if AD and upper airway infectionsresult of a imbalanced dual relation between barrier function and immune responses, mathe-matical models of the epithelium that are tailored specifically to the epidermis and the upperairway epithelium, respectively, are necessary.
The first mathematical model of AD was proposed in [84]. It consists of a mechanistic char-acterization of the protease networks that control both barrier function and epidermal inflam-mation. Simulations of the ODE model, assuming genetic (low expression of a protease in-hibitor) or environmental (increased pH) risk factors known to predispose to the disease, effec-tively reproduces the increased propensity of inflammation that is typical of AD patients. Thismathematical model, however, does not consider the tissue-level effects of active proteases,given by a decreased epidermal permeability and increased immune responses that result fromprotease-dependent skin desquamation [110] and cytokine expression [111, 112]. The pivotalrole of these proteases in the development of AD is attributed to these two tissue-level effects[113, 114, 111, 115], that must be considered in a multi-scale framework that relates the inter-play between protease activity, barrier function and immune responses. In this thesis, we buildon the mathematical model of [84] (described in more detail in section 3.2.3), and explicitlyconsider, for the first time, how increased protease activity can lead to tissue damage in theform of loss of epithelial homeostasis.Very few mathematical models of host-pathogen interactions occurring at epithelial surfacesexplicitly consider the role epithelial permeability barrier function in mediating the outcome ofthe infection. The model proposed in [93] considers, for the first time, the role of the epithelialbarrier in mediating infection by Steptococcus pneumoniae, although it does not consider theinterplay between barrier function and immune responses.
This interplay is given by the tissue-damaging effects of immune responses, and by the in-hibition of the neutrophil transmigration by a competent epithelial barrier [30, 86, 71, 87]. The
26

tissue-damaging effects of neutrophil transmigration are major determinants of the pathologyof infection [31, 30]. Therefore, we believe that it is important to explicitly consider the dualrelation between immune responses and barrier function.The mathematical model of the host-pathogen interactions between Streptococcus pneumoniae
and the upper airway epithelium proposed in this thesis (chapter 8) builds on the models pro-posed in [93, 91, 94, 92] and explicitly considers, for the first time, the dynamic interplaybetween the epithelium barrier function and the immune responses.Taking together, in this thesis, we propose the first mathematical models of AD (chapters 2-7)and upper airway infection (chapter 8) that consider the dual interplay between barrier func-tion and inflammation. Our models are conceptually similar to the models of Wendelsdorf etal (2010) [108] and Lo et al (2013) [109], but are specifically tailored to different types ofepithelium (epidermis and upper airway epithelium). Further, as will be discussed in comingchapters, our modelling approach is based on modularity and time-scale separation of differentmodel components, rather than being a explicit representation of the entangled biochemical re-actions controlling epithelial function, as in the models of Wendelsdorf et al (2010) [108] andLo et al (2013) [109].
1.4 Motivation of the thesis
The research presented in this thesis is motivated by the clinical and social importance of un-covering the mechanisms that underlie the onset and progression of diseases associated to theloss of epithelial homeostasis.These diseases include infections [3, 4, 5, 6], allergies [7, 8, 1, 9, 10, 11, 12, 13], and cancer[14, 15], affecting a wide proportion of the population worldwide [16, 17, 18, 19, 20, 18, 21,22]. The high prevalence of these diseases can partly be attributed to the lack of understandingof the underlying pathogenic mechanisms, that limits the effectiveness of the current treatmentsand of preventive strategies [23, 24, 25, 12]. It is therefore urgent to uncover the pathogenicmechanisms that result in loss of epithelial homeostasis, to find new ways to effectively pre-vent and cure these clinically, socially and economically important diseases. In this thesis, wefocus on the analysis of one allergic (AD) and one infectious (pneumonia) disease. However,we believe that the theoretical framework proposed in this thesis can be used to explore themechanisms that lead to the development of many other diseases that involve loss of epithelialfunction, such as asthma [39], viral infections [5] and several forms of cancer [116, 14].
These diseases result from impaired networks of cellular and biochemical interactions thatcontrol epithelial homeostasis. Particularly, alterations in the interplay between the two protec-tive properties of the epithelium, namely the immune responses to environmental aggressors
27

and the permeability barrier function, play a major role in driving these diseases. Thus, asystems-level framework that allows the simultaneous consideration of the immune responsesand permeability barrier function, and serves as a tool to integrate and analyse experimentaland clinical data describing different regulatory components is required.Currently, there exists no such a theoretical framework to represent the regulatory networksthat underlie epithelial homeostasis. It is therefore timely to develop such a theoretical andintegrative framework that allows the analysis of the mechanisms that are responsible for theloss of epidermal homoeostasis, associated to the onset of many socially relevant diseases.
1.5 Aims and objectives
The general objective of the thesis is to gain a mechanistic understanding of the regulatorynetworks that control epithelial homeostasis, and its role in the development of diseases thatinvolve loss of epithelial function, using a systems biology approach.Particularly, the work presented in this thesis has following aims:
• To integrate scattered experimental and clinical data on the regulatory networks control-ling epithelial homeostasis that underlie the pathogenic mechanisms of Atopic dermatitisand infection of the upper airway by Streptococcus pneumoniae. Addressed in chapter 2
and section 8.3.
• To develop a mathematical modelling framework to represent the regulatory networkscontrolling epithelial homeostasis. Addressed in chapter 3 and section 8.4.2.
• To uncover plausible patient-specific mechanisms that underlie the pathogenic process ofAD. Addressed in chapters 4 and 6.
• To use the insights gained from the mathematical model of AD to assess different patient-specific treatment strategies for this complex disease. Addressed in chapter 5.
• To reach a qualitative agreement between the AD model simulations and experimentaldata on the pathogenesis of the disease. Addressed in section 6.2.
• To apply the modelling framework, based on the analysis of the reaction networks under-lying epidermal homeostasis, to another disease that involves loss of epithelial function.Addressed in chapter 8
• To clarify different potential mechanisms that can lead to infection of the upper airwayepithelium by the commensal bacteria Streptococcus pneumoniae. Addressed in chapter
8.
28

• To calibrate a model of the regulatory mechanisms that underlie epithelial homeostasiswith quantitative experimental data. Addressed in appendix B.
1.6 Main findings
The main findings of this thesis are as follows:
• The reaction network controlling epidermal homeostasis, reconstructed from existing ex-perimental and clinical data (figure 2.3), contains the biochemical and cellular processesfrom which the pathogenesis of AD can be reconstructed by in vitro simulations. Thesemodelling results suggest that the disease (AD) can emerge from the complex interactionsbetween the components of the reaction network that have been previously described inthe literature (chapters 4 and 6).
• The host-pathogen interactions between Streptococcus pneumoniae and the upper airwayepithelium that underlie the infection by this bacterium can be described by the reactionnetwork presented in figure 8.2. The validity of this model is supported by the quali-tative agreement between the in silico simulations and experimental in vivo data (figure8.4), and by the qualitative description of different infectious processes that have beenobserved in the clinic (section 8.6).
• The epithelial barrier function components describe a self-recovering dynamical be-haviour that arises from the underlying feedback control structure (section 3.3).
• The immune cells affecting epithelial inflammation can act as a frequency filter that dis-criminates between different sporadic and recurrent events of cytokine release (section3.4).
• The reaction networks controlling epithelial homeostasis can be decomposed into threeelementary building blocks, representing the self-recovering determinants of the perme-ability barrier function, the switch-like release of pro-inflammatory cytokines, and thepersistence of immune cells (chapter 3). The control structure that underlies homeostasisof the epidermis (figure 3.1) and the airway epithelium (figure 8.3) can be represented byinterplay between these regulatory modules.
• The mathematical modelling framework proposed in this thesis, based on modularity andtime-scale separation, can be used to qualitatively (epidermis) and quantitatively (upperairway epithelium) describe the regulatory networks controlling epithelial homeostasis.
29

• The interplay between the two protective properties of the epithelium (barrier functionand immune responses) must be tightly controlled by the underlying regulatory networksof biochemical and cellular interactions to prevent the onset of diseases associated tothe loss of epithelial homeostasis. Indeed, our model analysis suggests that inherited orenvironmentally determined weak barrier function or immune response can result in thedevelopment of AD (figures 4.5 and 6.5 A) or infection (figures 8.12 and 8.13).
• Our mathematical model of AD is consistent with the clinical observation that this com-plex disease can result from both genetic as well as environmental predisposing riskfactors (figure 6.5).
• Our mathematical model of AD provides a plausible mechanistic explanation of the pre-ventive effect of emollient treatment (figures 5.3 and 6.5).
• Our mathematical model of AD explains why different cohorts of AD patients couldbenefit from different pharmacological treatment (chapter 5).
• Simulations of our mathematical model of AD agree with different pathogenic mecha-nisms that have been reported in the literature (section 6.2).
• Analysis of our mathematical model of the host pathogen interactions between the up-per airway epithelium by the commensal bacteria Streptococcus pneumoniae identifieddifferent mechanisms leading to loss of homeostasis (section 8.5)
1.7 Publications
• Elisa Domínguez-Hüttinger, Masahiro Ono, Mauricio Barahona, and Reiko J Tanaka.Risk factor-dependent dynamics of atopic dermatitis: modelling multi-scale regulationof epithelium homeostasis. Interface Focus, 3:20120090, February 2013.Reproduced in chapter 4.
• A mathematical model that uncovers disease mechanisms of Atopic dermatitis: in silico
reproduction of the disease dynamics from early to advanced stages of the pathogenicprocess. In preparation; results from chapters 5 and 6.
• Mathematical modelling of host pathogen interactions reveals patient-specific mecha-nisms leading to infection. In preparation; results from chapter 8.
30
1.8 Structure and overview of the thesis
This thesis is organized as follows: The mathematical model of the pathogenic mechanismsthat drive AD is presented in chapters 2-7.Particularly, in chapter 2 we describe the regulatory network controlling epidermal homeosta-sis. For this, we integrate clinical and experimental data from the literature that describe dif-ferent individual components of the reaction network. We also describe different risk factorsthat predispose for AD, as well as the clinical features of this disease, in the context of theregulatory networks controlling epidermal homeostasis.In chapter 3, we decompose the reaction network controlling epidermal homeostasis describedin chapter 2 into different regulatory modules. Using a combination of mathematical modelspreviously proposed in the literature, and new models that are proposed for the first time in thisthesis, we characterize each of these individual regulatory modules. We find that all of the reg-ulatory modules considered in this thesis can be categorized into three types of network motifsthat can be distinguished based on their qualitative behaviours. The mathematical modellingapproach used in this thesis is briefly described in appendix A.In chapters 4 and 6, using the network motif description developed in chapter 3, we re-assemblethe reaction network controlling epidermal homeostasis into mathematical models that describethe cellular and biochemical interactions that underlie early (chapter 4) and late (chapter 6)stages of AD. We analyse each of these two mathematical models, by asking how the risk fac-tors that predispose to AD affect the functioning of the regulatory network controlling epithelialhomeostasis, eventually leading to the onset (chapter 4) and progression (chapter 6) of AD.In chapter 5, we use the mathematical model that reproduces the early stages of AD to assessthe impact of different treatments, commonly used by AD patients, on the regulatory networkscontrolling epidermal homeostasis that have been disrupted by a particular risk factor.The general conclusions and future work of the results derived from the mathematical modelof AD (chapters 3-6) are presented in chapter 7.
The mathematical model of the host-pathogen interactions between Streptococcus pneumo-
niae and the upper airway epithelium that underlie pneumococcal infection is introduced, pre-sented, analysed and discussed in the self-contained chapter 8. Details on the parameter esti-mation for the pneumococcal infection model are given in appendix B.
The concluding remarks of this thesis are given in chapter 9.
Enjoy!
31

Chapter 2
Reaction network controlling epidermalhomeostasis: the biology of Atopicdermatitis
2.1 Introduction
This section is devoted to the description of the reaction network controlling epidermal home-ostasis. We integrated scattered clinical and experimental data on the individual reactionscontrolling epidermal function into a systems-level representation, which we call the reactionnetwork controlling epidermal homeostasis. Proper functioning of this reaction network isrequired for healthy epidermal functioning, and loss of epidermal homeostasis, resulting fromderegulation of this reaction network, underlies Atopic dermatitis (AD). In subsequent chapters,we will propose mathematical models of AD by representing (parts of) this reaction network.This chapter is organized as follows:First, in section 2.3, we will give a clinical description of AD, by giving an overview of thehallmarks of AD skin, the predisposing risk factors, and the main treatments for this disease.Next, in section 2.4 we provide a more detailed description of the reaction networks control-ling epidermal homeostasis (i.e. the underlying biology). We will focus on the keratinocyte,because: (1) it is the most abundant cell type of the epidermis, and the epidermis enacts theepithelial constituent of the skin, (2) it enacts both barrier and immune regulatory functions,corresponding to the two regulatory properties of the epithelium we are interested in, and (3) itis in direct contact with the environment, and must therefore constantly integrate and respondto changing environmental conditions, via its reaction networks.While describing the reaction network controlling epidermal homeostasis, we will pinpoint thecomponents of the network that are affected by the risk factors predisposing for AD. Identi-
32
fying the risk factors in the context of the complex, strongly interconnected reaction networksthat they affect, will evidence the need of a mathematical model of AD to uncover the diseasemechanisms triggered by the different risk factors.
2.2 Structure and function of the epidermis
AD is a disease that affects mainly the epidermis, which is a type of stratified epithelium thatenacts the upper layer of the skin (figure 2.1). The epidermal tissue is mainly composed by ker-atinocytes at different levels of differentiation [17]. The basal layer is composed by undiffer-entiated and proliferative keratinocytes (basal cells). Upward movement towards the granularlayer is accompanied by expression of differentiation markers, such as components of the skinbarrier, intercellular junctions (the desmosomes), proteases, immune receptors and lipid mod-ifying enzymes. The granular layer forms the last and most differentiated viable layer of ker-atinocytes. For simplicity, in figure 2.1, only the basal and the granular layers are represented.The uppermost layer of the epidermis is the skin barrier. It is formed by dead keratinocytes[117] that are held together by inter-cellular junctions, called desmosomes, and are embeddedin a lipid matrix. This ”brick and mortar” like structure [33] hinders the penetration of environ-mental aggressors, including pathogens, into the viable layers of the epidermis. A competentbarrier is also essential to prevent excessive loss of water that can lead to dehydration [118].Accordingly, a leaky barrier, resulting, for example, from excessive protease activity that leadsto increased desquamation of inter-cellular junctions and inhibits the formation of the lipid ma-trix [119], leads to invasion of the viable epidermis by environmental factors [33]. Infiltratedpathogens are recognized at the granular layer by immune receptors, triggering immune re-sponses that decrease the pathogen load but also can lead to the activation of adaptive immuneresponses via Dendritic cells (DC) [67, 7, 49]. Together, barrier function and immune responsesto infiltrating pathogens provide the protective function that characterizes the epidermis [33].
In this research, we pay special attention to the keratinocytes that form the granular layer,because these are the uppermost cells in the viable epidermis and are hence closest to theenvironment. As such, these keratinocytes play a central role in mediating, responding andadapting to changing environmental conditions. This complex signal processing is achieved bythe biochemical networks of regulatory interactions that are explained in detail later in thischapter.
33

Skin barrier
Granular layer (differentiated keratinocytes)
Basal layer
Pathogen
Protease
Desmosomes
Lipids
Immune receptor
Immune responseDifferentiation
Inflammation
Figure 2.1: Structure and protective functions of the epidermis. The epidermis is a stratifiedepithelium composed by keratinocytes at different levels of differentiation: Cells in the basallayer gradually differentiate until forming the granular layer. Eventually, cells in the granularlayer release their lipids and die to form the skin barrier. One of the main functions of the skinbarrier is to hinder the penetration of environmental aggressors, including pathogens, into theviable layers of the epidermis. Accordingly, a leaky barrier, resulting from excessive desqua-mation and reduced skin barrier formation, caused in part by over-active proteases, leads toinvasion of the viable epidermis by pathogens. Infiltrated pathogens are recognized at the gran-ular layer by immune receptors, triggering immune responses that decrease the pathogen loadbut eventually also lead to tissue-damaging inflammation.
2.3 Symptoms and predisposing risk factors for Atopic der-matitis
AD is a complex disease. First, because it has a complex phenotype, given by several symp-toms such as a dysfunctional skin barrier [7], infection [6], increased inflammation [81, 120]and allergy [121]. Second, because several genetic [77, 6, 47, 122, 75, 74, 76, 123] and envi-ronmental [47, 124] predisposing risk factors for AD have been identified as potential triggersof the disease. These include mutations or polymorphisms affecting skin barrier components[43, 73, 125, 126, 127] and immune responses [77, 6, 47, 122], prolonged use of hard water[124], increased [49] or decreased [47] exposure to environmental aggressors, and excessiveuse of soaps and detergents [124, 128], among others.The pathological process of AD is further complicated by the fact that the impaired AD epider-mis can lead to the emergence of further risk factors. For example, chronic inflammation canimpair the genetic expression levels of barrier components, and and a weak barrier function canalter the micro-environmental conditions of the epidermis (increase in pH). This dual interplay
34
between AD risk factors and symptoms is responsible for a gradual worsening of the diseaseand the intricate disease mechanisms that characterize AD.
2.3.1 AD characteristics
The epidermis of AD patients is characterized by following symptoms [17] (figure 2.2A):
• Dysfunctional skin barrier, leading to a increased permeability to environmental aggres-sors, such as pathogens and allergens. Loss of barrier function also results in skin dehy-dration, leading to a dry and scaly skin [7].
• Propensity for infection by bacteria such as Staphylococcus aureus [6, 129].
• Frequent [81] and long-lasting [120] inflammation that is sometimes accompanied byallergic reactions to ubiquitous environmental insults [121].
The pathological process of AD is further complicated by the fact that the impaired ADepidermis can lead to the emergence of further AD characteristics. For example, a chronicinflammation can impair the genetic expression levels of barrier components, and and a weakbarrier function can alter the micro-environmental conditions of the epidermis (increase in pH).This dual interplay between AD risk factors and symptoms is responsible for a gradual wors-ening of the disease and the intricate disease mechanisms that characterize AD. The causalrelations between these AD sympoms is given by (figure 2.2):
(1) Dysfunctional skin barrier leads to an increased permeability to environmental factors,such as pathogens, thus, increasing the susceptibility for infection [7, 13].
(2) Increased pathogen load in the viable epidermis weakens the skin barrier by the interfer-ence of the pathogens with the barrier repair mechanisms of the host [130, 119].
(3) Augmented pathogen load further promotes inflammation [13].
(4) Excessive inflammation weakens the pathogen-eradicating innate immune responses, fur-ther increasing the propensity for infection [6].
(5) Sustained inflammation further impair barrier function by interfering with gene expres-sion programs that control the barrier remodelling process [36].
This interplay, depicted in figure 2.2B, has two important consequences.First, it can lead to a gradual worsening of the disease. While early stages of AD are char-acterized by occasional flares of barrier damage and innate immune responses to infiltrating
35

pathogens [49], during late stages of the disease, AD skin suffers from unresolved inflamma-tion [81], sustained barrier defects [131, 132], secondary infection [133] and tissue remodelling[134, 135]. It is hence clear that gaining a mechanistic understanding of the early phases of thedisease process is clinically relevant, since this will help to devise early therapeutic interven-tions that can prevent the onset of late, severe forms of the disease.Second, this strong connectivity between the above mentioned symptoms suggests that thereare several different potential triggers of the disease process. Indeed, as we will see in the nextsection, there are different genetic and environmental risk factors that predispose for AD thatdirectly affect either pathogen load, immune responses or barrier function. Once initiated thepathogenic process, any of these risk factors can lead to the development of a full AD phe-notype, i.e. to the (progressive) impairment of pathogen load, immune responses and barrierfunction.
Pathogen
Skin5barrier
Viable5epidermis
Dendritic5cell
Allergy
Dysfunctional
Inflammation
Infection
1
2
3
45
Dysfunctional5barrier5
Inflammation
Infection
4
5
12
(A) (B)
Figure 2.2: Causal interplay between the symptoms of Atopic dermatitis Cartoon (A) andnetwork (B) representation of the interplay between the different symptoms of AD. (1) A dys-functional skin barrier leads to an excessive penetration of environmental aggressors. (2) Infil-trated pathogens trigger further barrier damage by interfering with skin barrier repairing pro-grams. (3) Increased load of infiltrated pathogens induce immune responses, eventually lead-ing to inflammation and allergy. (4) Inflammation weakens the pathogen-eradicating innateimmune responses. (5) Tissue-damaging inflammation interferes with the barrier formationprocess.
36

2.3.2 Genetic and environmental risk factors for AD
AD is a complex disease, because there are several different genetic and environmental riskfactors that predispose to this disease [124]. These risk factors can be divided into three maincategories, depending on which aspects of the epidermis they affect (summarized in table 2.1):
• Risk factors affecting skin barrier function. These risk factors affect the levels ofexpression of structural components of the skin barrier, most notably the protein filaggrin[43, 73, 125]. Filaggrin is responsible for cross-linking between the extracellular lipidenvelope and the intercellular cytoskeleton of the keratinocytes that form the skin barrier[136], and has been identified as a key determinant of the permeability barrier function ofthe epidermis [73]. Changes in gene expression of filaggrin and other components of theskin barrier can be driven by genetic risk factors, such as polymorphisms [126, 127] ormutations [73], but also by a long-term exposure to pro-inflammatory cytokines [137, 29,138] and by changes in barrier function [139, 140]. It has been suggested that expressionof barrier components can also be affected by prolonged use of hard water [124], likelydue to the interference of the high calcium concentrations contained in hard water withthe regulation of terminal differentiation of the keratinocytes [141, 45, 142, 140].
• Risk factors affecting immune responses. These risk factors affect the functioning ofthe signalling cascades that determine the innate immune reactions that occur in responseto infiltrated pathogens [143]. Alterations in these signalling cascades can result fromgenetically (polymorphisms) [77, 6] or environmentally [47] determined changes in thelevels of expression of innate immune receptors (TLR4 [47]), cytokines (Interleukin 1(IL1) [122]), anti-inflammatory cytokines (IL1 receptor antagonist [77]), and endogenousantibiotics termed Anti-microbial peptides (AMPs) [6]. Also environmental factors canaffect the functioning of the signalling cascades. Particular attention has received the socalled hygiene hypothesis, which states that that a defective development of the innateimmune system, responsible for reduced levels of immune system components, can alsoresult from the lack of contact with pathogens in very early stages of life [47].
• Risk factors affecting protease activity. The protease kallikrein (KLK) affects boththe immune responses [111, 112, 144] and the skin barrier function [113, 144, 145]. In-creased KLK activity can result from frequent use of soaps and detergents [124] that risethe pH, increasing the catalytic activity of these enzymes [128], from genetically deter-mined decrease in the expression of the protease inhibitor LEKTI [75, 74], or from theincreased expression and activity of the protease [76, 123]. The role of the levels of ex-pression of the protease inhibitor LEKTI on the development of AD is further supportedby the strong resemblance between the phenotype of Netherton Syndrome, a mendelian
37

disease caused by a loss of function mutation of SPINK5 gene (that encodes LEKTI),and severe forms of AD [74]. Also, the key role of the activity of the protease KLK onthe development of AD is evidenced by transgenic mice in which the overexpression ofKLK leads to the development of an AD- like phenotype [123].
Not only the pathogenic process of AD can be triggered by several genetic and environ-mental risk factors, but there is also a synergy between them, because the presence of two ormore risk factors dramatically increases the susceptibility to develop AD [146, 132].Once the pathogenic process has been triggered by any of these risk factors, the AD condi-tion can be further aggravated. This is because dysfunctional epidermis displays an alteredmicro-environment that can trigger the emergence of further risk factors. For example, per-sistent inflammation and altered barrier function that characterizes AD skin (see section 2.3.1)can lead to the decrease in the expression of filaggrin [138] and AMPs [47]. This causal rela-tion between risk factors is responsible for the gradual disease aggravation discussed in section2.3.1.To assess the impact of the different risk factors on the epidermal function, how they contributeto the onset of the pathogenic process, what causes the synergy between them, and what arethe mechanisms that underlie the gradual aggravation of the AD condition, it is necessary topinpoint the exact biochemical targets of these risk factors within their regulatory context, toshowcase how these impaired biochemical components are related among them. For this, inthe next section, we give a detailed description of the reaction network controlling epidermalfunction.
2.4 Reaction network of biochemical interactions controllingepidermal homeostasis
A healthy epidermis is given by a low pathogen load, a competent skin barrier, and infrequentimmune responses that resolve easily. To maintain this homeostatic condition, intricate reg-ulatory networks of biochemical interactions control barrier function, immune responses, andpathogen load (figure 2.3 A).Proteases (figure 2.3 B) play a key role in the maintenance of epidermal function [147], par-ticularly kallikreins (KLK) [144], because they affect both immune responses [130, 112] andbarrier function [110, 113]. They are activated by infiltrating pathogens [130, 148] and bychanges in barrier function [149], acting both as sensors and modulators of epidermal function.Changes in the pH of the skin, driven by soaps or detergents, can increase the catalytic activityof KLKs [128]. Changes in the gene expression of the gene encoding for KLK [76] or its in-hibitor LEKTI [75] can also increase the activity of KLK.
38

Table 2.1: Major genetic and environmental risk factors predisposing to the development ofAD
Genetic (Mutations, polymorphisms) Environmental (including an alteredmicro-environment)
Risk factors affecting skin permeability barrier functionMutations or polymorphisms of the Filag-grin gene [43, 73]
Prolonged use of hard water (impaired epi-dermal calcium gradient) [124]Pro-inflammatory micro-environment [137,29, 138]Impaired barrier function [139, 140]
Risk factors affecting immune responsesPolymorphisms in the gene encoding for theIL1 receptor antagonist [77]
Lack of contact with pathogens in early stageof life, associated to the impaired develop-ment of innate immune system (Hygiene hy-pothesis) [47]
Decreased expression of TLR2 [37]Risk factors affecting protease activity
Polymorphisms in the SPINK5 gene [75, 74] Prolonged use of soaps and detergents,which increase skin pH [124]
Polymorphisms affecting protease expres-sion [76, 123]
A competent barrier (figure 2.3 C), achieved by the combination of extracellular lipids, in-tracellular junctions (corneodesmosomes, CDS), and intercellular structural proteins such asfilaggrin, hinders the penetration of external pathogens. Its function can be affected by ex-ternal aggressors, such as tape strip or acetone treatment, as well as by the expression of itsconstituents, most notably, filaggrin [127]. Barrier function is modulated by KLKs [110, 113],pro-inflammatory cytokines [137, 29, 138] and by changes in the epidermal calcium gradientthat results from skin barrier disruption [139, 150, 151]. Barrier function is commonly mea-sured by Transepidermal Water Loss (TEWL), that quantifies the permeability of the epidermisand is hence negatively related to barrier function [152].Infiltrated pathogens (figure 2.3 D) trigger immune responses by activating signalling path-ways induced by TLR [153] (figure 2.3 E), Interleukin IL1 [154] (figure 2.3 F), and proteases[155, 130] (figure 2.3 B). Once activated, these signalling pathways trigger immune responsesin the form of release of AMPs [114, 34], recruitment of neutrophils [156, 144] and phagocy-tosis [157] that, together, reduce the pathogen load.Excessive activation of innate immune responses can lead to the activation of Th2 mediatedadaptive immune responses (figure 2.3 G). Pro-inflammatory cytokines, such as TLSP, are in-duced by innate immune response signalling cascades [111], and trigger the migration of den-dititic cells (DC) to the lymph nodes (figure 2.3 A,II). There, DC induce the differentiation of
39

naïve T cells into Th2 cells [158] via the IL4 dependent activation of the Gata3 pathway [159].This process, known as allergic sensitization [160, 161, 9], is responsible for the allergic com-ponent of AD, as well as for the establishment of the pro-inflammatory micro-environment inthe skin that further interferes with barrier function [137].This regulatory interplay between pathogen load, immune responses, barrier function and pro-tease activity is depicted in figure 2.3 A; a overview of the connectivity is represented in theinset of figure 2.3 A. Detailed description of the individual modules (figures 2.3 B-F) is givenbelow.
2.4.1 Protease networks: Regulation of kallikrein (KLK) activity
The activity of the protease KLK must be tightly controlled to maintain a proper epidermalfunction, because active KLK (KLK∗ in figure 2.3 B) and its target receptor, the protease ac-tivated receptor PAR2, play major regulatory roles in the determination of barrier function[110, 113] and immune responses [130, 112]. Particularly, active KLK controls the desqua-mation of the skin barrier via the pH-dependent degradation of CDS [113, 128, 145]. Acti-vated PAR2 (denoted by PAR2∗ in figure 2.3 B) inhibits the deposition of lipids into the skinbarrier [113], and increases the expression of pro-inflammatory cytokines, such as IL1a, IL6,IL8, TNF-α [130], ICAM2 [112] and TSLP [111, 162]. Active PAR2 also mediates the im-mune responses to infiltrating pathogens, by increasing the expression of AMPs such as hBD-2 [130, 114], inducing keratinocyte phagocytosis [157] and triggering neutrophil recruitment[156].The regulation of KLK activity involves several processing steps and different mediators. First,inactive KLK must be expressed and packed into LB (figure 2.3 B,1) and released into the ex-tracellular space (figure 2.3 B,2). These processes are mediated by barrier function (via changesin TEWL [163, 149] and in the epidermal calcium gradient [164]), and by infiltrated pathogens(via TLR signalling [148]).Once released into the extracellular space between skin barrier and granular layer, the inactiveKLK cleaves itself, in a auto-catalytic, pH dependent manner [128] (figure 2.3 B,3). ActiveKLK can be inhibited by LEKTI, via the formation of an inactive heterodimer [165] (figure2.3 B,4). Also this process is pH dependent [166]. The epidermal pH can be affected by im-moderate use of soaps and detergents [124]. All the pH dependent reactions are representedby red arrows in figure 2.3 B. Active KLK [111] and also exogenous proteases from infiltratedpathogens such as S. aureus [130, 162] cleave and activate PAR2 (figure 2.3 B,5, active PAR2denoted by PAR2∗).Noteworthy, the activity of KLK is increased in the disrupted skin of many AD patients, sug-gesting that KLK activity plays also a clinically important role in the maintenance of epidermal
40
homeostasis. Partly, this high KLK can be attributed to alterations in the levels of expression ofthe key components of the KLK regulatory network (KLK [76], PAR2 [112] and LEKTI [75]).In some (but not all) patients, these alterations are caused by genetic variants termed SingleNucleotide Polymorphisms (SNPs) [75, 76] (represented by green arrow in figure 2.3 B). Thecatalytic KLK activity can also be increased by the excessive use of soaps and detergents thatincrease the epidermal pH [124] (represented by red arrows in figure 2.3 B).
2.4.2 Skin barrier function
The permeability barrier function of the epidermis is enacted by the skin barrier, also knownas stratum corneum, which is the uppermost layer of the epidermis. It is formed by deathkeratinocytes (the corneocytes), embedded in a lipid matrix termed ”corneal envelope”, andhold together by strong intercellular junctions (the corneodesmosomes, CDS) [33]. Strongcohesion between the corneocytes is further provided by filaggrin, a protein that is responsiblefor cross-linking between the extracellular corneal envelope and the intercellular cytoskeleton[136]. Together, corneosomes [167, 113], lipids [168, 169], and filaggrin [73] are the keybiochemical determinants of the permeability barrier function.Regulated production and formation processes of these three skin barrier components are hencepivotal for maintaining a competent barrier. The expression of CDS (figure 2.3 C,1) and ofthe unprocessed and inactive filaggrin precursor pro-filaggrin (figure 2.3 C,2) are decreasedby pro-inflammatory cytokines, including IL4 [170, 138], IL13 [137], and IL22 [29] The de
novo production of lipids and packing into LB (figure 2.3 C,3) requires the expression of lipid-modifying enzymes [169, 171]. The levels of expression of pro-filaggrin [140, 138, 163, 172,142], CDS [173] and lipid-modifying enzymes [173] are further affected by changes in thepermeability barrier function (via changes in TEWL and the epidermal calcium gradient). Tobecome part of the lipid matrix, lipids must be released from their containing LB into theextracellular space [174] (figure 2.3 C,4). This process is induced by skin barrier disruption[174, 150, 140, 175] and inhibited by active PAR2 [113]. To become a functional part of theskin barrier, filaggrin must be post-translationally modified (figure 2.3 C,5), a process that ismediated by several proteases, including Caspase 14 (Casp-14) [176], SASPase [177], andELA2 [178]. Casp-14-mediated activation of pro-filaggrin is induced by barrier damage, viachanges in TEWL [139], enacting a negative feedback control mechanism.The key determinant in the desquamation of the skin barrier is active KLK, by cleaving theCDS (figure 2.3 C,6) in a pH dependent manner [113, 128, 145].
41

2.4.3 Regulation of infiltrated pathogen load
The pathogen load in the viable epidermis is controlled by the two protective properties ofthe epithelium: the permeability barrier function and the immune responses. The infiltrationof pathogens from the environment to the viable epidermis is determined by the permeabilitybarrier function [7, 132] (figure 2.3 D,1). The rate of infiltration of external aggressors is alsodependent on the amount of stimuli in the environment [49].Elimination of the pathogen is triggered by immune responses (figure 2.3 D,2) in the formof AMPs [6, 144, 179, 114, 133] neutrophil recruitment [144, 180] and phagocytosis of byepidermal cells [157]. Neutrophil recruitment to the site of infection in response to activationof immune response pathways is a cellular level process, represented in figure 2.3 A,I. The rateof elimination of invading pathogens can also be increased by antibiotics [129, 81, 24].
2.4.4 IL1 and TLR mediated immune responses
The focus of this thesis is on KLK-mediated immune responses, due to the pivotal role KLKactivity in mediating both immune responses and barrier function, the two protective propertiesof the epithelium that must be tightly co-regulated to maintain homeostasis.However, also the signalling pathways triggered by Interleukin-1 (IL1) and Toll-Like receptor(TLR) activation, respectively, seem to play important roles in mediating the innate immuneresponses in AD skin, since their activity is often impaired in AD patients [181, 77, 182, 183].TLR signalling is triggered by a broad range of infiltrated pathogens, via the association ofPathogen-Associated Molecular Patterns (PAMP) to the TLR [184] (figure 2.3 E,1). Upon ac-tivation, TLR pathway induces the activation of the Transcription Factor (TF) NFκB (figure2.3 E,2), which results in the increased expression of AMPs [153] and pro-inflammatory cy-tokines such as IFN-γ [122] (figure 2.3 E,3).Infiltrated pathogens lead to the expression of inactive, pro-IL1 (figure 2.3 F,1) via the induc-tion of TLR signalling by PAMPs [122]. PAMPs also trigger the activation of pro-IL1 intoIL1∗ by inducing its inflammasome- mediated cleavage (figure 2.3 F,2). Active IL1 forms abinds to IL1 receptor (IL1R) to form the heterodimer IL1∗1R (figure 2.3 F,3), which results inthe activation of a NFκB-dependent signalling pathway (figure 2.3 F,4), resulting in the releaseof pro-inflammatory cytokines and a further increase in pro-IL1 expression (positive feedbackloop). The receptor antagonist IL1Ra inhibits IL1 signalling by associating with IL1 receptor,forming an inactive complex (figure 2.3 F,5) [154].In many AD patients, SNPs affect the expression of IL1 [182] and of IL1Ra [77] (representedby green arrows in figure 2.3 F).
42

2.4.5 Adaptive immune responses drive Th2 polarization
The differentiation of naïve T cell into Th2 cells, a process known as Th2 polarization [39],plays a major role in the pathogenesis of AD, particularly during the advanced stages ofthe disease. Polarization of Th2 cells (1) triggers the onset of allergic reactions through aprocess termed allergic sensitization [160, 161, 27], (2) leads to the establishment of a pro-inflammatory environment in the epidermis, and (3) contributes to the chronic inflammationthat is typical of AD lesions from patients at severe stages of AD [185, 186]. Moreover, thepro-inflammatory micro-environment interferers with the epidermal differentiation programs,further inflicting on the epidermal function [137, 138, 29, 125].Polarization of Th2 cells involves two steps: First, cytokines released by keratinocytes in theviable epidermis [143] activate DC [187]. Particularly, active-PAR2- induced TSLP [39, 111],but also TNF-α [130] and IFN-γ, induced by TLR2 [122], stimulate the migration of DC to thelymph nodes [187], where they expose previously internalized antigen and increase the levelsof the cytokine IL4 [188]. This cellular level process of activation and migration of DC to thelymph nodes in response to rise in cytokine levels is represented in figure 2.3 A,II.The second step occurs in the lymph nodes, where active DCs increase the production of thecytokine IL4 [9, 39, 12]. This triggers the differentiation from naïve T cells into polarized Th2cells via the activation of the Jak-Stat6-signalling pathway (figure 2.3 G,1) which controls theproduction of the TF Gata3 [159, 189] (figure 2.3 G,2). The TF Gata3 acts as a master regulatorthat orchestrates the T cell differentiation process from from naïve T cells to Th2 cells [190](figure 2.3 G,3). This TF also increases its own expression [191] (figure 2.3 G,4), as well asthe production of more IL4 [122], enacting two positive feedback loops.Once polarized, Th2 cells migrate back to the epidermis (figure 2.3 A,III). There, Th2 cellscontribute to the establishment of a pro-inflammatory micro-environment by increasing theproduction of cytokines such as IL13 [9, 29], IL22 [137] and IL4 [122]. Th2 cells also elicit al-lergic reactions by releasing IgE and TARC that activate Mast cells that then release histaminein response to environmental insults [158, 9].
2.5 Conclusions
In this chapter, we integrated and organized scattered experimental and clinical data into a reac-tion network controlling epidermal homeostasis (figure 2.3). In the following chapters, we willrepresent this reaction network by mathematical models, and analyse the impact of differentrisk factors on its functioning. Such a formal description of the entangled biological processescontrolling epidermal homeostasis is necessary to uncover the pathogenic mechanisms leadingto the onset of AD.
43

Due to the modular, input-output representation of the reaction network controlling epider-mal homeostasis, further biological processes could easily be incorporated. A extension of themodel would require the identification of the components of the current version of the reactionnetwork that affect and are affected by newly added molecules or cell types.
44

IgE
/llergy
L/KuReactionunetworkucontrollinguepidermaluhomeostasis
Jak
StatY
L?KuSkinubarrierufunctionucontrolLvKuProteaseunetwork
LGKuGata9umediateduTh,ucellupolarizationu
LEKTI KLK* KLK
P/R,
LEKTIFKLK*
pH
Fortugno,5@@
vrattsand,558
P/R,*
LEKTIOLvu
RoedlH,55N
Kezic,5@,
Lee,5@5
Voegeli,55D
Yamasaki,5@@
KLKOLvu
Komatsu,557
Zommisch,557
Zommisch,557
vriot,55N
TNFaLee,5@5
I?/Mvuddenkotte
,558
Soapsuandudetergents
SNP
SNP
TLR
/MP
P/R,*
Exogenousuproteases
TEWL
NMFKLK*
ILFV
ILFV
Gata9
LZKuPathogenuload LEKuTLRFpathway
Infiltratedupathogen
Externalustimulus
varrierufunction
Immuneuresponse
/ntibiotics
IFNFg
NFkv
P/MP
Meephansanu,5@,
LFKuILF@Fumediateduimmuneuresponses
ILF@* ILF@R
ILF@*ILF@R
ILF@
ILF@Ra
ILF@RILF@Ra
Sims,5@5
Terui@NND
Inflammasome
ZeJongh,55D
P/MP
?ytokines
SNP
SNP
TEWL
Torma,55D?a--
Morizane,5@5
/hmadFNejad,55V
Skinubarrier
Output
?ontroller
KLK*
TEWLu1u?a--
Environmentaludisturbances
Proteaseuneworku
LKLKupathwayK
Pathogenuload
LZK
Inputs
v
/MP
TLRupathway
LEK
ILF@upathway
LFK
GataupathwayuLZifferentiationuofuTucellsuintou
Th,ucellsK
Externalupathogens
Environmentaludisturbances
Environmentaludisturbance
ILFV
Output
Inputs
Pex
Inputs
Output
?aj
S
TSLP
Input
Output
Output
SNP
Outputs
Postitiveufeedback
ILF,,
ILF@9
NMF
Environmentaludisturbance
TapeuStrip /cetone
Emmolient
SNP
Output
/ntibiotics
SNP
SNP
TEWL
Infection
Soapsdetergents
-
I
Inflammation
L?K
LvK
LGK
SNPNeutrophilurecruitment
Zas,55@Zheng
@NN7
ExternaludisturbancesuLRiskufactoruorutreatmentK
?linicallyumeasurableuoutput
SNP
varrieruufunction
Immuneresponse
Pathogenload
Protease
Overviewuofutheuconnectivityubetweenuregulatoryumodulesu
@
,
9V
8
?ork,55N
vriot,55N
Lipidsu Filaggrinu
?ZS
LipidsOLvu
proFfilaggrin
Hachem,559
FallonHu,55N
PalmerHu,55Y
Fallon,55N
vernard,5@,
Nograles,55D
Howell,557
Zemerjian,55D
?asp@V
Grubauer@NDN
ILF@9
ILF,,
ILFV
KLK*
TEWL
SNP
varrierufunction
-
Tapeustrip /cetone
Hatano,5@9
ILFV
Hachem,559
Janssens,5@,
Tu,5@,
?a--
Menon@NN,a
Elias,55,HHowell,557HuTorma,55DH
ZeKoning,5@,HuTu,5@,
@,
9
V
8
Y
/liahmadiu,55N
P/MP @
,
9
V
8
NFkv
/kira,55V @
9
TLR*
TLR
,
@
ScharschmidtHu,55N
EliasHu,55N
,McGirt,55Y
Sotiropoulou,5@5HuOng,55,Hu
Zommisch,557Hvrinkmann,55Vu
Sharlow,555Kisich,55D
I
Z?uactivationuandumigrationu
II
MigrationuofuTh,ucells
III
@
,
9
differentiation
Ho,55N
V
8 /liahmadi,55N
Figure 2.3: (Caption on next page).45

Figure 2.3: (Previous page.) Control structure of the reaction networks regulating epi-dermal homeostasis. [A] Systems-level representation of the control structure regulating epi-dermal homeostasis, given by the interplay between modules mediating skin barrier function(magenta), pathogen load (grey), protease activity (red) and immune responses (cyan). Eachof these modules is affected by inputs, environmental and genetic disturbances (SNPs) and aregulatory sub-network that is detailed in sub-figures [B-F]. The inset is a simplified represen-tation of the detailed control structure depicted in the main figure. With the exception of thecellular processes described in the three green boxes (labelled I, II and III in figure [A]), allthe reactions correspond to biochemical interactions. Sub-figures [B-F] represent the biochem-ical reactions controlling [B] protease networks, [C] Skin barrier function, [D] Pathogen load,[E] TLR-mediated immune responses, [F] IL1 mediated immune responses, and [G] Gata3-mediated adaptive immune responses. The key reference for each of the individual reactions isdenoted by a blue box. Green arrows denote SNPs. Incoming and outgoing arrows correspondto inputs and outputs, respectively (equivalent to those in figure [A]). Grey circles denote bio-chemical species. An arrow entering and exiting a grey box represents a production, conversionor degradation processes. Positive or negative modulations of these biochemical reactions aredenoted by spiky or blunt end arrows, respectively. For description of the individual reactions,please refer to the main text.
46

Chapter 3
Regulatory modules: Decomposition of thereaction network into network motifs
3.1 Introduction
In the previous chapter, we gave a detailed description of the reaction networks controllingepidermal homeostasis that are considered in this thesis. In this chapter, we present our math-ematical modelling approach, which consists in decomposing the reaction network (depictedin figure 2.3) into elementary building blocks, termed regulatory modules. These regulatorymodules can be divided into following three categories:
• Regulatory modules controlling skin barrier components. They correspond to the bio-
chemical networks controlling lipid and filaggrin content depicted in figure 2.3 C.
• Regulatory modules controlling the cytokine release. These include the biochemical
networks controlling innate immune responses triggered by the protease KLK (figure2.3 B), the active TLR pathway (figure 2.3 E), the cytokine IL1 (2.3 F), as well as theGata-3 signalling pathway mediated the adaptive immune reaction to IL4 (figure 2.3 G).For simplicity, we will focus on protease- and IL4 mediated cytokine release.
• Regulatory modules controlling the cellular immune effectors in response to biochemi-cal mediators. These include protease-dependent neutrophil recruitment to the epidermis(figure 2.3 A,I), the protease-dependent migration of DC to lymph nodes (figure 2.3 A,II),and the mobilization of differentiated Th2 cells (figure 2.3 A,III).
Previous characterization of these regulatory modules show that they display following threecharacteristic qualitative behaviours:
• Upon perturbation, skin barrier components, particularly lipids [151, 150, 174, 173, 140]and fillaggrin [176, 139], follow a self-recovering dynamical behaviour.
47

• The induction of cytokine release upon stimulation [192, 193, 194] follows a switch-like dose response behaviour. Particularly, previous research suggests that protease-dependent innate immune responses [84] (figure 2.3 B), and the IL4 dependent adaptiveimmune responses [195] (figure 2.3 G), represented by yellow boxes in figure 3.1, rep-resent such a switch-like dose response behaviour. Noteworthy, also the innate immuneresponse pathways that are triggered in response to TLR [194] (figure 2.3 E) and IL1activation [196] (figure 2.3 F) seem to display a switch-like dose response behaviour.
• The cellular immune effectors, namely neutrophils (2.3 A,I), DC neutrophils (2.3 A,II)and Th2 cells (2.3 A,III) that are activated and mobilized upon a biochemical (cytokine)stimulation, persist even after the cytokine levels have ceased [116, 144] (represented bygreen boxes both in figure 3.1 and in figure 2.3 A).
Accordingly, we classify the regions of the regulatory network controlling epithelial homeosta-sis (figure 2.3) controlling barrier components (figure 2.3 C), cytokine release (figure 2.3 B.E,F,G)and cellular immune effectors (figure 2.3 AI-III) into three different classes of regulatory mod-ules displaying a switch-like dose response behaviour, self-recovery, and persistent dynamics,respectively (figure 3.1). In this chapter, we will first introduce a mathematical representa-tion of the above mentioned regulatory modules. For those regulatory modules for which amathematical model exists in the literature, we will describe the regulatory module using theexisting mathematical representation. Particularly, we will use the mathematical descriptionof the switch-like innate immune responses induced by KLK proposed in [84] (yellow ”KLK”box in figure 3.1), the IL4-dependent signalling pathways that mediate Th2 cell polarizationdescribed in [195] (yellow ”IL4” box in figure 3.1), and the mathematical model of the self-recovering filaggrin dynamics proposed in [197] (blue ”filaggrin” box in figure 3.1). For theremaining regulatory modules considered in this thesis (persistent cellular immune mediators,represented as green boxes in figure 3.1 and self-recovering lipid content, represented by theblue ”lipid” box in figure 3.1), we will propose, for the first time, simple mechanistic modelsthat are able to reproduce the desired qualitative behaviour described in the experimental lit-erature. For all of the mathematical models considered (both from the literature and proposedin this thesis), we will show example simulations displaying the characteristic qualitative be-haviours.To model each of the regulatory modules considered in this thesis, we will chose the simplestmechanistic representation, in which the desired qualitative behaviour emerges from the un-derlying biochemical and cellular control structure. This will allow us to pinpoint the mostrelevant network properties that are responsible for the three different qualitative behavioursdisplayed by the individual regulatory modules. These control- and feedback structures are thethree network motifs that are responsible for the three qualitative behaviours displayed by the
48

epithelial regulatory modules. Particularly, we will see that a combination of positive feedback
and cooperativity can lead to a switch-like dose response behaviour, self-recovery dynamics areachieved by a negative feedback, and persistence results from time-scale differences betweenthe fast, biochemical processes that mediate cytokine production, and the slow dynamics of thecellular level effectors.Finally, having identified the underlying mechanisms, we will introduce simpler, phenomeno-
logical mathematical representations of these three different qualitative behaviours.In our qualitative modelling approach, experimentally observed behaviours of the individualregulatory network elements robustly emerge from the underlying control structure, withoutthe need of fine-tuning of parameters. This allows us to integrate scattered experimental andclinical data, for which no detailed quantitative information is available, into a quantitativeand systems-level framework. With this, we can systematically analyse the role of individualregulatory modules in the maintenance of epithelial homoeostasis, without neglecting their reg-ulatory context.
In subsequent chapters, we will use the resulting modular representation of the regulatory mod-ules to re-construct and analyse the reaction network presented in figure 2.3, as shown in figure3.1.
Switch
Persistence
Recovery
Qualitative behaviours
KLK
Filaggrin
Lipids
IL-4 DC
Neutrophil
Barrier function
Protease
Adaptive & innateImmune responses
Pathogen
Input
Th2
Figure 3.1: Decomposition of the reaction network controlling epidermal homeostasis intoregulatory modules. Barrier function components filaggrin and lipids are characterized by aself-recovering dynamics. Release of cytokines triggered by proteases or by the IL4 display aswitch-like dose response behaviour. The dynamics of cellular immune effectors persists evenafter the cease of their biochemical triggers.
49

3.2 Switch-like dose response behaviour characterizes the re-lease of cytokines
3.2.1 Bistability is a switch-like dose-response behaviour with memory
A switch-like dose response behaviour refers to the relation between a input (commonly, aligand) and the steady state concentrations of an output, where small changes in the input candrive large changes in the output [198]. A particular class of switch like behaviour is bistability,in which this abrupt change in output concentration is also history-dependent. In such a bistabledose-response behaviour, the critical concentration of the input at which the abrupt switchingfrom low to high values occurs (denoted by S+ in figure 3.2 A) is different from the criticalinput concentration that triggers the switching from high to low values (S− in figure 3.2 A).Hence, the onset of production of the output occurs at the threshold concentration S+, whilethe cease of output production occurs at the threshold concentrations S+. The region betweenthe two threshold values S+ and S− is termed bistable region, because the output can have twopossible values, high or low, depending on the previous values of the output; if previous valuesare low, then the system remains at the low branch, and vice versa. This property confers thesystem with memory, also termed as hysteresis, since the current state depends on past values(figure 3.2 A).
3.2.2 Bistability characterizes immune responses
Bistable dose-response behaviour has been repeatedly observed across different immune re-sponse pathways. For example, it has been observed for the response of DC to stimulationwith the PAMP LPS [193], in the release of pro-inflammatory cytokines in psioratic lesions[99], activation of T-cell receptor [199], the terminal differentiation of lymphocytes [200], andNFκB dependent response to mechanical stress [201].Particularly, immune responses that control epidermal homeostasis have also been found todisplay a bistable switching behaviour. These include the dose-response behaviour describingthe pathogen-mediated release of cytokines induced by proteases [84], IL1 [196], and TLR2/4[194] (corresponding to the innate immune response pathways, figure 3.2 B) as well as the therelease of pro-inflammatory cytokines induced by Gata3 in response to rises in IL4 [195] (cor-responding to a adaptive immune response pathway, depicted in figure 3.2 B).Here, we will consider two of these immune response pathways: innate immune responsestriggered by KLK in response to infiltrated pathogens (figure 3.2 C), and adaptive immune re-sponses triggered by the pro-inflammatory cytokine IL4 (figure 3.2 D). We acknowledge thatthe activation of other innate immune response pathways, particularly those involving IL1 andTLR2, also play a important role in the pathological process of AD, since long-term changes
50

D
P
C
OO K F CODHPkIL
+CDm
Abym
Gat
a+DB
Afol
dmin
crea
seB
ILvm[mgwml]m
thresholdmformTmcellmpolarization
Pathogen
PAR2*
PAR2
KLK*LEKTI KLK
LEKTI-KLK* pH
AABmBistability
Effe
ctor
StimulusSSS+
Bistablemregion
High
Low
Onset
Cease
ACBmProteasemdependentminnatemimmunemreactions
Stimulus
Stimulus
Effector
Effector
ABBmControlmofmimmunemresponses
ADBmGata+Dmdependentmadaptivemimmunemresponses
ILv
GataD
Innate
Adaptive
Pathogen
Cytokine
Cytokine
Pathogenm[mgwml]
HighmpH
LowmLEKTI
Control
K PO vO kOO
v
F
CP
CK
PO
TN
Fam
A~P
AR
PEB
Afol
dmin
crea
seB
Figure 3.2: Bistable switching characterizes the dose-response behaviour of cytokine re-lease by active immune response pathways. [A] Schematic representation of a bistable dose-response (bifurcation) behaviour describing the relation between the concentration of the input(stimulus) and the steady state concentration of the output (effector). Effector concentrationsremain at low values until a critical threshold S+ in the stimulus concentration is reached,triggering the abrupt activation of the effector. High effector values can be decreased only ifthe ceasing threshold S− < S+ is reached. The history-dependent region comprised betweenS− and S+ is termed bistable region. Figure adapted from [84]. [B] Innate and adaptive im-mune responses are triggered by pathogens or cytokines, respectively, and result the release ofcytokines in a bistable dose-response manner. [C] Left: Protease-dependent innate immune re-actions display a bistable dose response behaviour that is affected by environmental (high pH)and genetic (low LEKTI) risk factors. Right: Reaction network of biochemical interactionscontrolling protease activity. Figure adapted from [84]. [D] Left: Gata-3 dependent adaptiveimmune responses to stimulation with the pro-inflammatory cytokine IL4 displays a bistableswitching behaviour that is responsible for the irreversible polarization of individual T cells.It results from a underlying reaction network controlling Gata-3 activity that displays positivefeedback and cooperativity. Figure adapted form [195].
in the activation levels of components of the IL1 [32, 154, 182] and TLR [81, 47, 6, 183] sig-nalling pathways have been associated to the loss of epidermal homeostasis. However, giventhat they display the same qualitative dose-response behaviour as KLK-mediated immune re-sponses, namely bistability [84, 196, 194], in our qualitative modelling framework, the role a
51
switch like dose-response behaviour in mediating epithelial innate immune responses can beenacted by any of these innate immune response pathways. We chose to focus particularly onKLK signalling, because KLK activation not only affects innate immune responses, but alsohas a major impact barrier function and the onset of adaptive immune responses, representinga major hub in the regulatory network controlling epidermal homeostasis.In the following sections, we will introduce the mathematical descriptions of the regulatorymodules controlling KLK- and Gata3- mediated cytokine release. They correspond to the ODEmodels proposed in [84] and [195], respectively, and were chosen because they are simple yetmechanistic descriptions of the switch-like dose response behaviour that characterizes theseimmune responses.
3.2.3 Protease dependent innate immune reactions: KLK model
In this section, we describe the mathematical model of the control of KLK activation, proposed
by Tanaka et al [84].In [84], Tanaka et al proposed the first mathematical model of the regulatory module con-trolling the activity of the protease KLK. It describes the biochemical interactions regulatingKLK activity, detailed in section 2.4.1 and represented in figure 2.3 B. Particularly, it considersthe interplay between the key mediators of KLK activation, namely inactive (KLK) and ac-tive (KLK∗) protease, inactive (PAR2) and active (PAR2∗) protease receptor, unbound proteaseinhibitor (LEKTI), and the inhibitory complex (KLK∗LEKTI). The reactions considered areauto-catalysis of KLK (first positive feedback), reversible formation of the inhibitory complex,activation of PAR2 by active KLK5, and active PAR2- mediated production of KLK5 (secondpositive feedback) and LEKTI. The input to the network is represented by infiltrated pathogens(S) that induce the production of inactive KLK5. The connectivity between the network com-ponents is reproduced in figure 3.2 C (right). The corresponding mathematical model is givenby the system of equations 3.1:
52

d[KLK∗LEKTI]dt
= ka[KLK∗][LEKTI]− kd[KLK∗LEKTI]−δLK[KLK∗LEKTI], (3.1a)
d[LEKTI]dt
=−ka[KLK∗][LEKTI]+ kd[KLK∗LEKTI]+ tL(mL + fL[PAR2∗])−δL[LEKTI],
(3.1b)
d[KLK∗]dt
=−ka[KLK∗][LEKTI]+ kd[KLK∗LEKTI]+ k[KLK∗][KLK]
[KLK∗]+CK−δK∗[KLK∗],
(3.1c)
d[KLK]
dt=−k
[KLK∗][KLK]
[KLK∗]+CK−δK[KLK]+ fKSS+ fK[PAR2∗], (3.1d)
d[PAR2]dt
=−kP[KLK∗][PAR2][KLK∗]+CP
−δP[PAR2]+mP, (3.1e)
d[PAR2∗]dt
= fPSS[PAR2]+ kP[KLK∗][PAR2][KLK∗]+CP
−δP∗[PAR2∗]. (3.1f)
The model was analysed in terms of its steady state solutions, neglecting its fast transientdynamic behaviour. It displays a robust bistable dose response behaviour that can be attributedto the presence of the two positive feedbacks (auto-catalysis of KLK activation and activePAR2- dependent production of KLK) in the network. Example simulations of this bistabledose-response behaviour using the nominal parameter values in [84] are reproduced in figure3.2 C (left).Two of the risk factors that affect the reaction network controlling epidermal homeostasis havea direct impact on KLK activity: Increased epidermal pH dramatically increases the catalyticactivity of active KLK [128], as well as its affinity for LEKTI [166]. This environmental riskfactor was represented in the model by increasing the catalytic rates of KLK∗ (parameters k
and kP in equation 3.1) and the affinity between active KLK and LEKTI (parameters ka andkd in equation 3.1). Similarly, the lower expression of the KLK inhibitor LEKTI is a geneticrisk factor that is represented in the model of [84] by decreasing the LEKTI production rate(parameter tL in equation 3.1).Simulating these risk factors dramatically alters the dose response behaviours, decreasing thethresholds of onset and cease of the protease-mediated immune responses (S+ and S−) whichleads to a increased sensitivity to pathogen load (lower S+) and a more persistent immuneresponse (lower S−), as shown in figure 3.2 C.We follow the notation of [84] and refer to these two conditions as ”low LEKTI” and ”highpH”, respectively, as opposed to the healthy ”control” (figure 3.2 C).We refer to this model as the KLK model, and use it in the next chapters with the nominalparameters proposed in [84].
53

3.2.4 Gata-3 mediated Th2 cell polarization
In this section, we describe the mathematical model of the activation of Gata-3 production,
proposed by Höfer et al [195].In [195], Höfer et al proposed the first mathematical model of irreversible Th2 polarization inresponse to the activation of the Transcription Factor (TF) Gata-3 by IL4. This simple mathe-matical model describes the dynamics of the Gata-3 activity in the undifferentiated T cells thatreside in the lymph nodes, in response to stimulation with IL4. It comprises a positive feed-back term that describes the Gata-3 mediated Gata-3 expression, as well as a non linear termthat represents the post-translational modifications that the TF Gata-3 has to overcome beforeenacting the positive feedback (figure 3.2 D, right). The resulting one-dimensional ODE (equa-tion 3.2) displays a irreversible, bistable dose-response behaviour (given by a threshold valueS− < 0) that characterizes the irreversible polarization of individual Th2 cells, as shown in thesimulations of equation 3.2, using the nominal parameter values proposed in [195] (reproducedin figure 3.2 D, left).In the following chapters (particularly, chapter 6), we use this mathematical model with thenominal parameter values proposed in [195] to describe the IL4 dependent activation of Gata-3.
d[Gata3(t)]dt
= α[IL4]+κG[Gata3(t)]2
1+[Gata3(t)]2−κ[Gata3(t)]. (3.2)
3.2.5 Network motifs that result in bistability: positive feedback and co-operativity
As we have seen in the two examples above, bistability can result from biochemical networksdisplaying positive feedback with cooperativity. In fact, it has been suggested [202, 203], thatin many different reaction networks, the presence of these two network properties are requiredfor a bistable dose-response behaviour. Thus, the combination of positive feedback and co-operativity represents a class of network motifs that can be enacted by different mechanisms[204, 205, 206], including the auto-catalysis controlling KLK activity (equations 3.1) and theself-regulated transcription that enhances Gata-3 expression (equation 3.2).
3.2.6 Phenomenological representation of bistable dose response behaviourby a perfect switch
In addition to mechanistic mathematical models (such as equations 3.1 and 3.2) in which bista-bility emerges from the underlying reactions (as shown in figures 3.2C and D, respectively),
54

the bistable-dose response behaviour (figure 3.2 A) can be mathematically described and sim-plified with Piecewise-affine (PWA) functions [207].In brief, the PWA approximation gives a phenomenological (as opposed to mechanistic) rulethat relates the input (stimulus) to the output (effector) (figure 3.2 A).Assuming a perfect switch, the effector can be approximated by two constant values, Elow andEhigh, representing the ”low” or ”high” branches of the bifurcation diagram, respectively.Assuming that the input changes dynamically in the time-scale τ, then the relation between thetime-dependent input S(τ), the current output E(τ) and the previous output values E(x < τ) canbe approximated as follows:
• If S(τ)< S−, then E(τ) = Elow (effector is low if the stimulus concentration is low).
• If S(τ)> S−, then E(τ) = Ehigh (effector is high if the stimulus concentration is high).
• If S(τ) ∈ [S−,S+], then:
– if E(x < τ) = Elow, then E(τ) = Elow, or
– if E(x < τ) = Ehigh, then E(τ) = Ehigh,
corresponding to the history-dependent determination of the effector value when thestimulus is in the bistable region.
More formally, these conditions can be represented by the PWA given in equation 3.3(adapted from [208]):
E(τ) =
Elow if (S(τ)< S−) or S(τ) ∈ [S−,S+] and E(x < τ) = Elow
Ehigh if (S(τ)> S+) or
S(τ) ∈ [S−,S+] and E(x < τ) = Ehigh.
(3.3)
Note that equation 3.3 implicitly assumes two time-scales:
• A fast time-scale t that governs the stabilized biochemical interactions that underlie thebistable dose-response behaviour (typically involving a positive feedback and coopera-tivity, as discussed in section 3.2.5). These biochemical reactions can be represented bya system of ODEs E(t,S,E) (corresponding, for example, to the mathematical model de-scribing KLK activation represented in equations 3.1) that operates at time-scale t andhas a input S that does not change significantly (S(t) ≈ constant) while E(t) reaches itsequilibrium value (given by Elow or Ehigh, respectively).
• A slow time-scale τ that determines the dynamics of the input S(τ) by the governingequation S(τ) = F(τ,S).
55
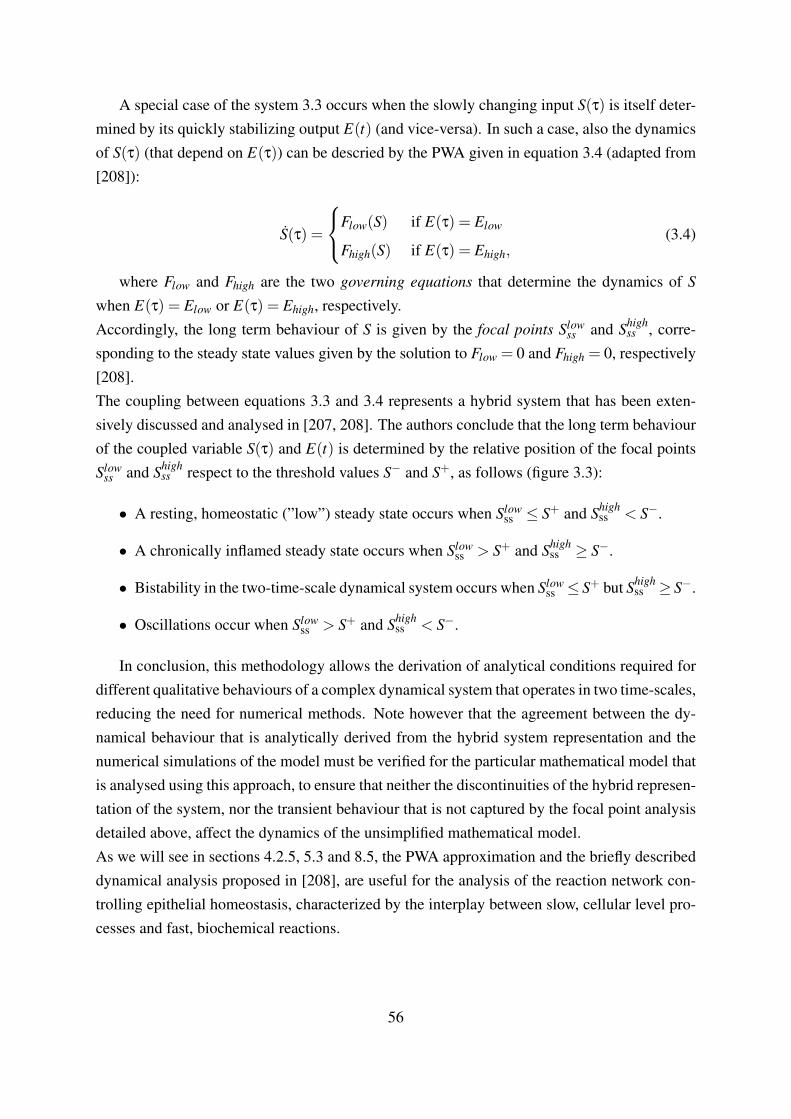
A special case of the system 3.3 occurs when the slowly changing input S(τ) is itself deter-mined by its quickly stabilizing output E(t) (and vice-versa). In such a case, also the dynamicsof S(τ) (that depend on E(τ)) can be descried by the PWA given in equation 3.4 (adapted from[208]):
S(τ) =
Flow(S) if E(τ) = Elow
Fhigh(S) if E(τ) = Ehigh,(3.4)
where Flow and Fhigh are the two governing equations that determine the dynamics of S
when E(τ) = Elow or E(τ) = Ehigh, respectively.Accordingly, the long term behaviour of S is given by the focal points Slow
ss and Shighss , corre-
sponding to the steady state values given by the solution to Flow = 0 and Fhigh = 0, respectively[208].The coupling between equations 3.3 and 3.4 represents a hybrid system that has been exten-sively discussed and analysed in [207, 208]. The authors conclude that the long term behaviourof the coupled variable S(τ) and E(t) is determined by the relative position of the focal pointsSlow
ss and Shighss respect to the threshold values S− and S+, as follows (figure 3.3):
• A resting, homeostatic (”low”) steady state occurs when Slowss ≤ S+ and Shigh
ss < S−.
• A chronically inflamed steady state occurs when Slowss > S+ and Shigh
ss ≥ S−.
• Bistability in the two-time-scale dynamical system occurs when Slowss ≤ S+ but Shigh
ss ≥ S−.
• Oscillations occur when Slowss > S+ and Shigh
ss < S−.
In conclusion, this methodology allows the derivation of analytical conditions required fordifferent qualitative behaviours of a complex dynamical system that operates in two time-scales,reducing the need for numerical methods. Note however that the agreement between the dy-namical behaviour that is analytically derived from the hybrid system representation and thenumerical simulations of the model must be verified for the particular mathematical model thatis analysed using this approach, to ensure that neither the discontinuities of the hybrid represen-tation of the system, nor the transient behaviour that is not captured by the focal point analysisdetailed above, affect the dynamics of the unsimplified mathematical model.As we will see in sections 4.2.5, 5.3 and 8.5, the PWA approximation and the briefly describeddynamical analysis proposed in [208], are useful for the analysis of the reaction network con-trolling epithelial homeostasis, characterized by the interplay between slow, cellular level pro-cesses and fast, biochemical reactions.
56

(i) Homeostasis
S(τ)
E(τ)
S- S+Elow
Ehigh
(ii) Chronic inflammation
S(τ)
E(τ)
S- S+Elow
Ehigh
(iii) Bistability
S(τ)
E(τ)
S- S+Elow
Ehigh
(iv) Oscillations
S(τ)
E(τ)
S- S+Elow
Ehigh
Ssslow
Ssshigh
Slow(0)
Shigh(0)
Focal points
Initial conditions
Figure 3.3: Schematic representation of the qualitative dynamic behaviours of the hybridsystem described in the coupled equations 3.3 and 3.4. The long term dynamical behaviourof the hybrid system 3.3 and 3.4 is determined by the position of the focal points Slow
ss and Shighss
respect to the threshold values S− and S+. (i) Slowss ≤ S+ and Shigh
ss < S− lead to homeostasis,(ii) chronic inflammation occurs when Slow
ss > S+ and Shighss ≥ S−, (iii) Bistability arises from
Slowss ≤ S+ but Shigh
ss ≥ S−, and (iv) Oscillations result from Slowss > S+ and Shigh
ss < S−.
3.3 Self-recovery characterizes the barrier function compo-nents and is achieved by negative feedback control
A system displays a self-recovering dynamic behaviour if it can recover and maintain a nominalvalue, even in the presence of perturbations that alter its functioning, both in terms of initialconditions of the system’s variables, and of its parameters [209, 210] (figure 3.4 A).In the epidermis, the skin barrier components lipids and filaggrin display such self-recoveringbehaviour [211] (figure 3.4 B,C). Disturbances occur in the form of changes in initial conditions-inflicted by environmental triggers such as tape stripping, acetone treatments, or desquamation-, or by constant changes in kinetic parameters, particularly production rates that are affected bypro-inflammatory cytokines [137, 29, 138].This robustness of skin barrier components to (micro) environmental perturbations is funda-mental for the maintenance of a healthy skin. Skin barrier forms the first contact with the envi-ronment, and is hence prone to many different perturbations, such as pathogen load, chemicals
57

including soaps and detergents, physical disruption by scratching, and changes in humidity.Despite these environmental disturbances, skin barrier must maintain a nominal value to main-tain its pivotal role in providing protection against these environmental conditions, by actingas a semi-permeable (selective) membrane that controls the flux of substances [33] (see figure3.4 A, top).The self-recovering dynamical behaviour of a biochemical determinant of the barrier function(X) is represented in figure 3.4 A, bottom. Upon a perturbation that alters its initial conditionand its production rate , the barrier function transiently drops, but then recovers again to itsnominal value X . We call the time required for the barrier function component X(t) to restoreits nominal value ”recovery time”.Such a self-recovering dynamic behaviour that confers robustness to environmental perturba-tions in the form of parameter changes in the system results from negative feedback controlmechanisms that regulate the production of skin barrier components [150, 33].In the skin barrier, negative feedback control seems to be mediated by an epidermal calciumgradient that is altered upon perturbation of the skin barrier and subsequently triggers severalbarrier-reparation processes [141, 142, 212].Indeed, the role of negative feedback in mediating recovery dynamics upon perturbations (ro-
bustness) has been observed for many different biochemical networks [210], including the syn-thetic Tet-repressor system in E. coli [213, 214], the pheromone response pathway controlledby Fus3 in S. cerevisiae [215, 216], the BMP4 signalling pathway modulated by the pseudo-receptor BAMBI in X laevis [217], the hyperosmotic stress response in yeast [218, 219], andsignalling networks underlying bacterial chemeotaxis [220, 221].Mathematical models have identified the key role of negative feedback in determining the self-recovering dynamic behaviour of epithelial cell volume [222] and filaggrin content in the epi-dermis [197].Negative feedback can thus be regarded as the key network motif that is responsible for theself-recovering dynamic behaviour. In fact, this has been theoretically proven, both by analyti-cal [223] and computational [224] methods.In the following, we will introduce mathematical models that represent the regulatory modulesthat are responsible for the self-recovering dynamical behaviour of the skin barrier compo-nents, lipids and filaggrin. These regulatory modules correspond to network motifs comprisinga negative feedback control structure (figures 3.4 B,C, left). We will show simulations thatexemplify the self recovering dynamical behaviour upon changes in production rates that resultfrom these network structures (figures 3.4 B,C, right). Finally, we will introduce a phenomeno-logical representation of the self-recovering dynamics (figure 3.4 D).
58

Bar
rier,
func
tion,
6XA
6nor
mal
ize
d,to
,XA
time,6daysA
Xss=X~
Nominal,barrier,6XA
Recovery,time
~
Impulse,perturbation,6initial,conditionA
Data,6Hoffman,et,alT,
k+FKA
Simulation
,F
,+Lh,+Lg,+LK,+Lk
,+
,+
,K
,h
,Fk
6AA,Self,recovery,of,barrier
Barrier,function,6XA
Environment
Body,6selfA
Pertu
rbat
ion
TEWLCakP
Perturbation
Barrier,formation
Nominal,barrier
Barrier,function,6XA
Feedback
W
6BA,Self,recovery,of,lipids,is,mediated,by,KLK,activity
L
pL
KETEWL
,Nominal
Fila
ggrin
,6F
A6n
orm
aliz
ed,
to,F
A
Fss=F~
Perturbed,productionT,Weak,6PCWA,feedback
Perturbed,productionT,High,6PCWA,fb,
,F
,+
,F
,k
,K
time,6daysA
,+Lh
,+Lg
,+LK
F
pF
KETEWL
Cytokines
6CA,Filaggrin,recovery,through,positive,and,negative,feedback
proWFilaggrin,6pFA6normalized,to,nominal,steady,state,valueA
,F
,+Lh
,+Lg
,+LK
,+LK
,F ,FLK k
[pFTF]+
dpF=+
dF=+
,+
,F
,k
,K
time,6daysA
,Nominal
Low,productionWeak,KLKWmediated,Pfb
Lss=L~
Lipi
ds,6
LA6n
orm
aliz
ed,
to,L
A
Low,production,6kprodA
,F
,+Lh,+Lg,+LK,+Lk
,+
Weak,KLKWmediated,Pfb
Lipid,precursors,6pLA6normalized,to,nominal,steady,state,valueA
,F
,+Lh,+Lg,+LK,+Lk
,+
,F
,F+
dL=+dpL=+
~ ~~
[pLTL]+
Figure 3.4: Self-recovery characterizes the barrier function components and is achievedby negative feedback control (A), Top: Skin barrier regulates the exchange of substances withthe environment even in the presence of perturbations. Center: Self-recovery of the skin barrieris achieved through negative feedback. Bottom: Barrier function (X) shows a self-recoveringdynamic behaviour, characterized by a return to its nominal steady state X upon a perturba-tion. This self-recovery has been characterized experimentally [225] and can be simulated byequation 3.7. (B) Self recovery of lipid content in the skin is mediated by KLK activityLeft The lipid content in the skin barrier is controlled by two TEWL- driven negative feedbackloops and a KLK-mediated positive feedback loop. Center Lipid concentration recovers toa nominal value even after step changes in the basal production rate. The speed of recoveryis increased by the KLK-mediated positive feedback. Right In the presence of perturbations,lipid precursors are over-produced to maintain a nominal lipid concentration. (C) Filaggrinrecovery is achieved through the interplay between positive and negative feedbacks Left
Filaggrin content in the skin is controlled by a double negative feedback, mediated by TEWLand KLK activity, and a double positive feedback, mediated by TEWL and pro-inflammatorycytokines. Center An interplay between a strong positive and a strong negative feedback medi-ate the recovery of filaggrin upon perturbations in initial conditions and basal expression rate.Right Upon perturbation, maintenance of a nominal filaggrin steady state is achieved by thefeedback-mediated increase in pro-filaggrin expression.
59

3.3.1 Lipid content in the skin barrier is controlled by a double negativefeedback and modulated by KLK activity
In this section, we propose a novel mathematical model of the regulatory networks controlling
the self-recovery of the skin barrier lipids.
Already early studies characterizing barrier function have shown that the rate of synthesis oflipids is directly proportional to loss of permeability barrier function, measured by TEWL[151]. Further, this increased rate of lipid release upon barrier disruption does not take place ifthe skin is occluded [150, 174]. More recent studies using high throughput analysis of gene ex-pression dynamics upon barrier disruption also show that genes associated to lipid metabolismtend to be up-regulated upon disruption [173].Recovery upon disruption is achieved by the barrier-damage-induced release of previously syn-thesized lipids that are contained in the LB of differentiated keratinocytes [140] (denoted by”Lipids@LB” in figure 2.3 C), a restoration process that is inhibited by active proteases (KLK)[113]. Given that KLKs are also activated by barrier damage [149], this KLK-mediated inhi-bition of lipid production corresponds to a positive feedback from barrier function to barrierrestoration that constrains the negative feedback control mediating lipid homeostasis (see fig-ure 3.4 B, left).In equation 3.5, we propose a simple model of this regulatory module mediating lipid con-centrations. It represents the coupled dynamics between the lipid component of the barrier(L, corresponding to ”Lipids” in figure 2.3 C), and the lipid precursors contained in the LB(pL, corresponding to ”Lipids@LB” in figure 2.3 C) depicted figure 3.4 B, left. We assumethat barrier function is directly proportional to L and negatively regulates the synthesis of pL
(first negative feedback, denoted by ”TEWL-mediated -fb” in equation 3.5b) and the releaseof pL into L (second negative feedback, denoted by ”TEWL-mediated -fb” in equation 3.5a).The inhibitory effect of active proteases (K∗) on the release of LB lipids is modelled in thesimplest possible way, by assuming that the rate of pL release is proportional to L, with ratefKLK. This positive feedback enacted by KLK results from the fact that activation is induced bybarrier damage, but inhibits LB release, comprising two negative feedbacks that together givea positive feedback (denoted by ”KLK-mediated +fb” in equation 3.5a). No degradation forpL is assumed, representing the fact that the precursors are consumed mainly during the barrierproduction process. Simulations of equations 3.5, using the parameters in table 3.1, are shownin figure 3.4 B, right.In these simulations, we consider two perturbations: A step-like (ten-fold) decrease in thebarrier production rate kprod , and a decrease in the initial condition (50% reduction from thenominal steady state value Lss). The effect of KLK-mediated positive feedback was assessedby considering a nominal and a low (100-fold decreased) positive feedback strength fKLK. To
60

asses the effect of a stronger negative feedback, we considered a 10-fold increase in frelease.The resulting recovery behaviours are shown in figure 3.4 B, center (dynamic trajectories) andright (nullclines). Upon perturbation in the initial condition, all of the simulated conditionsdisplay a self-recovering dynamical behaviour, where L(t) returns to its nominal steady stateL, even in the presence of an additional perturbation in the production rate. As shown bythe displacement of the nullclines in the presence of perturbations (figure 3.4 B, right), themaintenance of a nominal lipid concentration is achieved by the compensating increase in theconcentration of lipid precursors. A strong KLK-mediated positive feedback accelerates thespeed of recovery to a nominal, healthy value while producing an overshoot in the L(t) dy-namics. In contrast, weakening the positive feedback strength (red and magenta trajectoriesin figure 3.4 B) or increasing the negative feedback strength (not shown) compensates theseeffects, resulting in over-damped convergence to the nominal steady state value.Taking together, this preliminary analysis of this toy model representing the regulatory mech-anisms controlling lipid concentration suggests that the underlying network motif structure,based on the interplay between two negative feedback loops and one positive feedback enactedby KLK, is capable of displaying a recovering dynamic behaviour upon perturbations both ininitial conditions and in production rates.
dL(t)dt
=
lipid production from precursors︷ ︸︸ ︷kprod (1+ fKLKL(t))︸ ︷︷ ︸
KLK-mediated +fb
11+ freleaseL(t)︸ ︷︷ ︸TEWL-mediated -fb
pL(t)−lipid degradation︷ ︸︸ ︷
kdegL(t) , (3.5a)
dpL(t)dt
=1
1+ fproductionL(t)︸ ︷︷ ︸TEWL-mediated -fb
−kprod1+ fKLKL(t)
1+ freleaseL(t)pL(t). (3.5b)
3.3.2 Filaggrin content is regulated by the interplay between a fast nega-tive feedback and a delayed positive feedback
In this section, we describe the mathematical model of the regulatory networks controlling the
filaggrin content in the skin barrier, originally proposed in [197] but further analysed in this
thesis to explore the relation between the feedback structure and the resulting self-recovery
dynamical behaviour.
The filaggrin content in the skin barrier is controlled by a intricate control structure that involvesthe interplay between two negative and two positive feedback loops (shown on figure 3.4 C left):
• A damaged barrier leads to a reduction of filaggrin expression [140, 138, 163, 172, 142].
61

Table 3.1: Parameters of the regulatory module controlling lipid dynamics (dimensionless andarbitrarily chosen parameters for simulating equations 3.5)
Symbol Name Nominal valuekprod Barrier production rate 7.5 (nominal)
0.75 (perturbation)fKLK Positive feedback strength, enacted by
KLK∗25 (nominal feedback)
0.25 (weak KLK∗-mediatedfeedback)
frelease Negative feedback strength from barrierfunction to release of LB lipids
1
fproduction Negative feedback strength from barrierfunction to de novo production of pL (LBlipids)
5 (nominal feedback)
50 (strong negative feedback)kdeg Lipid degradation rate 10
This positive feedback is further accentuated by the presence of pro-inflammatory cy-tokines. High cytokine levels are characteristic for a chronically damaged skin barrier,and further interfere with filaggrin expression [226, 137, 227, 137].
• Barrier damage induces the post-translational processing of filaggrin into a active form[176, 139], a process that is further accentuated by active KLK [139]. Recall that alsoKLK activity directly depends on permeability barrier function, hence, this modulationcorresponds to a further negative feedback loop.
Based on this reaction network structure, Panayiotis Christodoulides proposed in [197] amathematical model of filaggrin control, represented by a coupled system of Delay DifferentialEquations (DDE) describing the dynamics of the filaggrin precursor pro-filaggrin (pF , corre-sponding to ”pro-filaggrin” in figure 2.3 C) and filaggrin (F , corresponding to ”Filaggrin” infigure 2.3 C). To explore if this system displays a self-recovering dynamical behaviour, weperformed further simulations of a simplified version of the original model [197], neglectingthe delay describing the de novo production of filaggrin precursors. Note that, in general, thedelay can affect the transient, but not the steady state value of the system. Further, as shownin [197], delay does not affect the stability of equations 3.6. Hence, to roughly explore if thecontrol structure depicted in figure 3.4 C, left can eventually lead to the recovery of a nominalfilaggrin content (F) upon a perturbation, it is enough to consider the ODE version of the equa-tions proposed in [197]. The model (equations 3.6) considers a de novo production term forpro-filaggrin that comprises a nominal production rate (ke) that is further enhanced by a com-
62

petent barrier. The positive feedback is enacted by TEWL and, indirectly, by pro-inflammatorycytokines (”+ f b” in equations 3.6). It also represents the post-translational modifications thatconvert pro-filaggrin into filaggrin. This process is inhibited by a competent barrier (directly byTEWL and indirectly by active KLK), representing a negative feedback (”− f b” in equations3.6).
dF(t)dt
= pF(t)kP
-fb︷ ︸︸ ︷1
1+ fLF(t)︸ ︷︷ ︸post-translational modification
−δLF(t), (3.6a)
dpF(t)dt
= ke +
+fb︷ ︸︸ ︷fpF(t)︸ ︷︷ ︸
de novo production
−pF(t)kP1
1+ fLF(t)−δpLpF(t). (3.6b)
Simulations of this model, using the nominal parameters reported in [197], are shown infigure 3.4 C center (dynamic trajectories) and right (nullclines). They show the dynamicalbehaviour of filaggrin content in response to perturbations in the initial conditions (half thenominal, steady state value F). Under nominal conditions (black), filaggrin recovers to itsnominal level. Upon a step like decrease in the basal expression rate (to half the nominal valueof ke), fillagrin levels do not recover completely when the two positive and negative feedbackstrengths are weak (blue, using the nominal parameter values fP and fL). We mimicked theonset of the two further feedback arms, driven by KLK and cytokines, by increasing the strengthof the negative (2.5 fold in the nominal fP value) and the positive (two-fold increase in thenominal fL) feedback strengths. The resulting dynamics, shown in red, are able to display aself recovering behaviour to perturbations in both the initial condition and the step-like decreasein the production rate.These results suggest that the regulatory module controlling filaggrin concentration, consistingon the interplay between two positive and two negative feedback arms, is responsible for theself-recovering behaviour that characterizes filaggrin content in the skin barrier.
3.3.3 Network motifs that result in self-recovering dynamical behaviour:The key role of negative feedback
As shown in the previous section, the skin barrier components lipids and filaggrin display aself-recovering dynamic behaviour in terms of robustness of its steady state values to perturba-tions both in the initial condition and in step (constant) changes in nominal production rate ofbarrier precursors.
63

Both for filaggrin and lipid content, the mechanism by which this self-recovering behaviouris achieved is though the presence of a negative feedback that controls the barrier formationprocess. This negative feedback is further modulated by positive feedback loops enacted byKLK (in the case of lipids, figure 3.4 B) and by the TEWL- and cytokine-mediated de novo
expression of pro-filaggrin (figure 3.4 A).These results are in congruence with numerous previous findings in the literature [210, 213,214, 215, 216, 217, 218, 223, 219, 220, 221, 222] (discussed in section 3.3), that have iden-tified negative feedback as the key mechanism responsible for the self-recovering dynamicalbehaviour.Intriguingly, the self-recovering dynamical behaviour of the skin barrier components (figures3.4 B,C) seems to depend not only on a negative, but also on a positive feedback structure.Few publications (for example, [228] and [197]) have discussed the role of positive feedbackin stabilizing biological circuits controlled by a negative feedback. However, further researchis needed to clarify the role of positive feedback in the determination of the self-recoveringdynamical behaviour of the skin barrier components.
3.3.4 Phenomenological description of the self-recovering dynamical be-haviour
The self-recovering dynamical behaviour upon perturbations in the initial conditions (impulseperturbation, figure 3.4 A, bottom) and on the production rate can be described in a phenomeno-logical way with the equation 3.7:
X(t) = α(1− X(t)X
). (3.7)
Defining X as the homeostatic steady state value of X , it can be seen directly from inspec-tion of equation 3.7 that the steady state Xss = X , regardless of the value of the parameter α.Indeed, variations in the parameter α affect the recovery time, but do not lead to deviations fromthe nominal steady state X . Furthermore, given that equation 3.7 has a unique steady state X , X
is also perfectly robust to changes in initial conditions, it will always return to its steady statevalue after any impulse perturbation. This self-recovering dynamical behaviour of equations3.7 (with α = 0.5), and its agreement with the experimentally observed self-recovering dynam-ical behaviour of the barrier function of healthy human volunteers upon perturbation with soap[225] is shown in figure 3.4A (bottom).For simplicity (reduction in number of parameters and state variables), in the remainder of thethesis, the mathematical models representing the network motifs responsible for the homeo-static behaviour of the skin barrier components (lipids and filaggin) are approximated by theequation 3.7.
64

3.4 Persistence of inflammation: Storing the memory of cy-tokine dynamics
Inflammation is a cellular-level process that involves the activation and migration of cells ofthe immune system, such as DC, polarized Th2 cells, or neutrophils, in response to biochemical
mediators such as cytokines or antigens [116, 229].Thus, inflammation is a process that involves two time-scales: fast dynamics of the biochemicalspecies regulate cytokine production, and slow cellular level dynamics describe the migration,activation and death of immune cells.Mathematically, this corresponds to an (uncoupled) Quasi-Steady State(QSS) state system, inwhich some of the variables are assumed to stabilize much (infinitely) faster than the otherslower dynamic components of the system. Here, the variable triggering the slow immunecell migration process is the cytokine concentration (C), assumed to be in QSS because it iscontrolled by fast biochemical processes that mediate cytokine release (Css). In contrast, thelevel of migrated immune cells (IP), changes dynamically in a slow time-scale τ. As depictedin figure 3.5 left, the dynamics of the cellular immune response mediators IP can be describedby a cytokine-dependent migration, and a natural death rate.This simple network motif, depicted in figure 3.5 left, can be described by the ODE:
IP(τ) = kmigrationCss(τ)− IP(τ)kdeath. (3.8)
As we have seen in section 3.2, the cytokine levels (output of immune responses) can be ap-proximated by two discrete values, Chigh and Clow, corresponding, respectively, to the upper andlower branches of the bifurcation diagrams (see also figure 3.2 left). Thus, an abrupt rise in thecytokine levels from Clow to Chigh, will be followed by a steady, but slower, rise in the immuneresponses. Similarly, sudden decrease in the cytokine levels will lead to a eventual, but slower,decline in the inflammation. This qualitative dynamical behaviour is exemplified in figure 3.5.It shows the experimentally measured number of macrophages that migrate to the nasal epithe-lium of mice in response to a bacterial challenge that triggers cytokine release within hoursof epithelial infection [230], as well as simulations of equation 3.8, setting kmigration = 0.4,Chigh = 100%, Clow = 0%, and the time of high cytokine exposure, to 8 days.This dynamical behaviour implies that (1) the cytokine levels that trigger the inflammationmust remain high for a extended period of time for a full (maximal) induction of the inflamma-tion to be triggered, and (2) inflammation persists for some time after the cytokine levels havebeen cleared (figure 3.5 left). Thus, although simple, this network motif confers memory to thesystem, because the inflammation levels depend on previous exposures to cytokines.
A transient rise in cytokine levels is mirrored by a transient but slow increase and decrease
65

migration death
Cytokine
Immune[Cell
Biochemical[DfastZ
Cellular[DslowZ
Cytokine[high
Cytokine[low
persistence
time[DdaysZ
Simulation
[100
Infla
mm
atio
n[D5
[Mig
rate
d[m
acro
phag
es[[I
P]Z
[0 [5 [10 [15 [20[0
80
60
40
20
Data[DZhang[et[al,[
2009Z
Figure 3.5: Persistence of inflammation results from time-scale separation between fastcytokine dynamics and slow, cellular processes that involve mobilization of immune cells,triggered by cytokines An abrupt rise in the cytokine levels from low to high is followedby a steady, but slower, rise in the immune response, as exemplified by the slow macrophagerecruitment to the airway epithelium in response to a bacterial invasion [231] that triggerscytokine release within hours of epithelial infection [230]. Similarly, sudden decrease in thecytokine levels lead to a eventual, but slower, decline of the inflammation, which persists forsome time even after cytokine levels have dropped.
in inflammation (figure 3.6 A). Similarly, low-frequency, recurrent exposure to cytokines is fol-lowed by oscillating inflammation that is able to resolve between two episodes of high cytokineexposure (figure 3.6 B). However, in a high frequency scenario, in which the time between twoepisodes of high cytokine exposure is too short for the inflammation to resolve, the persistinginflammation gradually adds up on each new event of cytokine exposure, constantly increasinguntil eventually stabilizing at oscillations with a higher amplitude than in the low-frequencyscenario shown in figure 3.6 B. Under these conditions, the inflammation gradually stores thehistory of cytokine exposure, acting, effectively, as a capacitor (figure 3.6 C). Chronic expo-sure to cytokines leads to persistent inflammation that increases monotonically until eventuallyreaching its maximum amplitude, corresponding to the steady state value of equation 3.8 withCss =Chigh (figure 3.6 D).Taking together, figure 3.6 shows that inflammation described by equation 3.8 is able to storethe history of cytokine dynamics, characterized by a given frequency and amplitude.This persistent network motif has has been observed in other biological systems. For example,it seems to play a important in mediating the context-dependent induction of gene expressionby TF NFκB [232, 233], a master regulator that controls the gene expression of many targetgenes in a context-dependent way [234].In the context of the reaction network controlling epidermal function, this network motif plays
66

a key role in the induction of cellular level immune responses by cytokines. Particularly, it isenacted by the migration of DC to the lymph nodes in response to TSLP stimulation [111],the PAR2-mediated recruitment of neutrophils from the blood to the epidermis [156], andthe IL4-induced migration of differentiated Th2 cells from the lymph nodes to the epidermis[159, 189, 158].Equation 3.8 can also be represented by its analytical solution, shown in equation 3.9:
IP(τ) = kmigration
∫τ
0Css(t)ekdeath(τ−t) dt. (3.9)
For simplification, in the next chapter, we will use this approximation to describe the per-sisting cellular level immune responses to cytokines.
0 2 4 6 8 10 12 14 160 2 4 6 8 10 12 14 160 2 4 6 8 10 12 14 160
102030405060708090100
time (days)
Infla
mm
atio
n (#
Mig
rate
d im
mun
e ce
lls)
0 2 4 6 8 10 12 14 16time (days) time (days)time (days)
Amplitude
(A) Transient inflammation (B) Relaxation with low frequency oscillations
(C) Amplitude increase withhigh frequency oscillations
(D) Maximum amplitude withchronic cytokine exposure
Amplitude
Amplitude
Amplitude
Figure 3.6: A persistent network motif can act as a capacitor, by storing the history of cy-tokine dynamics with a given frequency and amplitude of cytokine exposure. (A) transientrise in cytokine levels is mirrored by a transient increase and decrease in inflammation. (B)
Similarly, low-frequency, recurrent exposure to cytokines is followed by a oscillating inflam-mation that is able to resolve between two episodes of high cytokine exposure. (C) In contrast,in a high frequency scenario in which the time between two episodes of high cytokine exposureis too short for the inflammation to resolve, the persisting inflammation gradually adds up oneach new event of cytokine exposure, stabilizing at oscillations with a higher amplitude. (D)
Chronic exposure to cytokines leads to persistent inflammation that increases monotonicallyuntil eventually reaching its maximum, steady state value.
3.5 Multi-scale structure of the reaction network controllingepidermal homeostasis
In this chapter, we decomposed the reaction network controlling epidermal homeostasis pre-sented in the previous section into individual regulatory modules. These elementary buildingblocks can be grouped into three different network motifs, operating at two different time-scales:
67

• A switch-like dose-response behaviour that characterizes fast biochemical interactionsthat mediate the release of cytokines in response to infiltrated pathogens (innate immuneresponses) or other pro-inflammatory cytokines (adaptive immune responses). They cor-respond to the regulatory modules represented in figures 2.3 B and G and in the yellowboxes in figure 3.1.
• Self-recovering dynamics characterizing epidermal barrier components (figure 3.4). Thesedynamics are driven by barrier restoration processes that involve both de novo productionof skin barrier precursors (pL and pF) as well as and post-translational modifications re-sulting in the active barrier components (L and F). They correspond to the regulatorymodules represented in figures 2.3 C), corresponding to the blue boxes in figure 3.1.
• Persistent levels of cellular immune mediators that are activated and migrate in responseto rises in cytokine levels. They correspond to the regulatory modules represented infigures 2.3 A,I-III, corresponding to the red boxes in figure 3.1.
The switch-like dose-response behaviour is driven by biochemical interactions that mainlyinvolve Protein-Protein Interactions (PPI), which occur at a comparatively much faster time-scale than the slower processes of barrier restoration (involving de novo synthesis of barriercomponents) and and mobilization of immune cells (involving migration and extravasation be-tween body sites).Hence, the network motifs that are considered here can be distinguished depending on in whichtime-scale they operate: network motifs leading to a switch-like dose-response behaviours op-erate quickly, stabilizing almost immediately as compared with the slower network motifs thatresult in homeostasis or persistent dynamics.Together, the reaction network controlling epidermal homeostasis (figure 2.3) corresponds toa regulatory structure that comprises different modules (figure 3.1) and time-scales (fast PPIscontrolling the switch-like cytokine production, intermediate de novo formation of barrier com-ponents, and slow migration and death dynamics immune cells).
3.6 Conclusions
Here, we decomposed the reaction network controlling epidermal homeostasis (figure 2.3) intoindividual regulatory modules, corresponding to three elementary building blocks character-ized by a distinctive qualitative behaviour.Each of the regulatory modules is associated to a particular qualitative behaviour, that can bemathematically represented either by simple mechanistic models from which the behaviouremerges, or by phenomenological descriptions described in this chapter.
68

For the mathematical representation of the switch-like release of cytokines characterizing in-nate and adaptive immune responses controlling epidermal function, we used mathematicaldescriptions that were previously proposed in [235] and [195], respectively.To describe the dynamical behaviours of lipids and filaggrin (figures 3.4 B and C, respectively),we identified for the first time the reaction network structures that mediate the self-recoverydynamics of these skin barrier components, and proposed the first mathematical model thatreproduces the self-recovery dynamics of skin lipids (equation 3.5). Another contribution ofthis chapter is that the recovery dynamics that characterize skin barrier components can be de-scribed in a phenomenological way by equation 3.7.Regarding the persistence motif, in this thesis we identified the regulatory modules and theunderlying network motif structure, and proposed a simple mathematical model that displaysthis persistent behaviour of the immune cells (figure 3.5). We show how this simple motif canact as a frequency filter that distinguishes between different types of cytokine dynamics (figure3.6).Each of these network motifs represents hence a distinctive module of the reaction networkcontrolling epidermal homeostasis, characterized by particular inputs, outputs, genetic and en-vironmental disturbances, feedback control and, importantly, a plant that operates at giventime-scale (figure 2.3 A).The modular and multi-scale representation of this detailed network is given in figure 3.1. Inthe coming chapters, we will analyse multi-scale, modular mathematical models that represent(parts of) this re-assembled reaction network.First, in chapter 4 we will consider only the interplay between innate immune responses andbarrier function. This is a valid and clinically meaningful simplification of the reaction net-work, since the adaptive immune responses are activated only during late stages of the disease.The model that we examine in chapters 4 and 5 corresponds thus to the early stages of thedisease progression.Then, in chapter 6, we will explore the conditions leading to activation of adaptive immuneresponses that are responsible for late and severe stages of the disease.This gradual step - by step re assembly of the reaction network will allow us to reproduce thefull pathological dynamics of AD, characterized by a onset phase described in chapter 4 and adisease aggraviation phase described in chapter 6.
69

Chapter 4
Modelling the early phases of AD:Interplay between protease-dependentinnate immune responses, barrier functionand infiltrating pathogens
The contents of this chapter are reproduced from our paper [236], that was published under aCreative Commons licence in February 2013. The original article can be found under http://rsfs.royalsocietypublishing.org/content/3/2/20120090.full.The chapter consists of the Author Generated Postprint of the paper [236], preceded by a intro-duction that locates the paper in the context and terminology of this thesis.
4.1 Introduction to the published paper in the context of thethesis
In the previous chapter, we decomposed the reaction network controlling epidermal homeosta-sis (figure 2.3) into elementary building blocks (the regulatory modules) that can be groupedinto three different network motifs (figure 3.1).This chapter comprises the first step in the re-assembly of the decomposed reaction network.We consider the interplay between protease-dependent innate immune responses, barrier func-tion and infiltrating pathogens that is disrupted during early phases of AD (figure 4.1). Weneglect in this chapter the adaptive immune responses, which are activated only during the laterstages of the pathogenic process.The aim of this chapter is to understand how risk factors that are known to affect the function-ing of these network motifs impair the reaction network, triggering the onset of the pathogenic
70
process. For this, we considered the genetic risk factors that lead to the reduction in the ex-pression levels of the barrier component filaggrin (”low FLG”), the protease-inhibitor LEKTI(”low LEKTI”) and the immune response mediators AMP (”low AMP”). We also consider theenvironmental risk factor ”high pH”, responsible for the pH-dependent increase in the catalyticcapacity of the proteases.The reaction network and the risk factors is given in figure 4.1, and was represented by themathematical model that results from coupling following mathematical representations of theregulatory modules described in chapter 3:
• The concentrations of protease (KLK) and protease-activated receptor (PAR2) are de-scribed by the QSS variables [KLK∗]s and [PAR2∗]s in equations 4.1 b and 4.2. TheseQSS values are the steady state solutions to the system of equations 3.1 [84] for differentvalues of S (equation 4.1 A).
• The dynamics of the barrier function is described in equation 4.1 B by a production termthat corresponds to the phenomenological representation of the self-recovering dynami-cal behaviour of the barrier described in equation 3.7. We further assumed that the rateα in equation 3.7 (corresponding to the term bpre
1+kL[PAR2∗]sin equation 4.1) is negatively
affected by [PAR2∗]s. We also added a [KLK∗]s-dependent degradation term.
• The immune reactions in equation 4.2 correspond to the solution to equation 3.8, givenin equation 3.9, with kmigration = kdeath = 1 and Css(τ) = [PAR2∗]s.
Additionally, we added a dynamical description for the pathogen S (equation 4.1 A), assumedto increase by the infiltration through the skin barrier, and decrease by the immune responses.
Simulations of the resulting mathematical model of this sub-network (figure 4.1, repre-sented in more detail in figure 4.2) with different risk factors, resulted in following three quali-tatively distinct dynamic behaviours that correspond to the dynamical behaviours of the hybridsystem described in section 3.2.6 (figure 3.3 ):
• Homeostasis: Return to a nominal, healthy steady state level after a transient decrease inbarrier function and a single flare of innate immune responses.
• Recurrence: Cycles of barrier destruction and recovery and recurrent flares of innateimmune responses.
• Chronic damage: Persistent barrier damage and unresolved immune responses.
As we can see in figures 4.5 and 4.6, the risk factors ”low AMP” and ”high pH” tend to triggera chronic loss of homeostasis, while ”low LEKTI” and ”low FLG” are associated to recurrentflares of barrier damage and immune responses, of different amplitudes (figure 4.6, low) and
71

Innate immune responses
Low AMP
Risk factors
G Genetic
EnvironmentalE
(Adaptive immune responses not considered)
Switch
Persistence
Recovery
Qualitative behavioursKLK
Filaggrin
Lipids Neutrophil
Barrier function
Protease
Pathogen
Input
G
Low FLGIL-4 DCTh2
High pH Low LEKTI
E
G
G
Figure 4.1: Reaction network mediating the early phases of AD: Interplay be-tween protease-dependent innate immune responses, barrier function and infiltratingpathogens. Early phases of the pathogenesis of AD are characterized by the aberrant interplaybetween the regulatory modules controlling protease activity, filaggrin and lipid barrier compo-nents, and innate immune responses mediated by infiltrating neutrophils and release of AMPs.These regulatory modules can be grouped into three types of network motifs: switch-like dose-response behaviour characterizing protease activation, self recovery of barrier components, andpersistence of the cellular mediators of the immune responses. Input of the multi-scale systemis given by the amount of infiltrated pathogens, that is negatively affected by barrier functionand by innate immune responses. The G (genetic) and E (environmental) risk factors consid-ered here are represented by red arrows.
frequencies (figure 6.4).We also used the model to explore the synergism between risk factors. Consistent with clinicalobservations, it was found that the combined action of risk factors leads to a significant increasein disease severity.From these simulation results, following specific predictions can be derived:
1. The severity of the symptoms of the AD epidermis [171] can be classified into threequalitatively different dynamical behaviours of the skin barrier function that changes inresponse to a pathogenic challenge (figure 4.4):
• In a healthy skin, the skin barrier quickly recovers to its homeostatic level (figure4.4 A).
• Mild forms of AD appear as recurrent flares of barrier damage (figure 4.4 B). In theclinic, this oscillatory behaviour is manifested as the sub-clinical barrier damage
72
that is characteristic of non-lesional AD skin.
• Severe forms of AD are manifested as a chronic loss of barrier function (figure4.4 C) that is characteristic of lesional AD skin.
2. Alone, intermediate levels of the protease inhibitor LEKTI (modelled as the risk factor”low LEKTI”) or of the barrier component Filaggrin (modelled as the risk factor ”low
FLG” lead to recurrent loss of epidermal homeostasis.
3. A ”low pH” or weak immune responses (”low AMP”) increase the frequency of theseoscillations, eventually leading to a chronic damage.
In conclusion, in this chapter, we proposed mechanisms by which risk factors can lead tothe loss of epidermal homeostasis, mediated by impaired balance in the interplay between bar-rier function and innate immune responses. With this, we could reproduce the early phases ofthe pathogenic process of AD.In section 5, we use the insights obtained from the analysis of the early phases of AD obtainedin this chapter, particularly the risk-factor dependency of the loss of epidermal homeostasis, toenvision possible patient-specific treatment for the early phases of AD.In chapter 6, we evaluate the impact of an impaired epidermis described in this chapter on theonset of aberrant adaptive immune responses. With this, we aim to uncover the mechanismsthat underlie the severe phases of AD, characterized by an aberrant immune response that in-terferes with epithelial remodelling.Combining the insights obtained in sections 5 and 6 can inform new and more efficient patient-specific early treatment strategies for AD that can prevent the onset of advanced and severeforms of the disease while minimizing the unwanted side effects of pharmacological treat-ments.
73

4.2 Risk-factor dependent dynamics of atopic dermatitis:Modelling multi-scale regulation of epithelium homeosta-sis
Authors:Elisa Domínguez Hüttinger1, Masahiro Ono2, Mauricio Barahona3, Reiko J. Tanaka1 4
Author-generated postprint of paper [236],
found under http://rsfs.royalsocietypublishing.org/content/3/2/20120090.
full .
4.2.1 Abstract
Epithelial tissue provides the body with its first layer of protection against harmful environmen-tal stimuli by enacting the regulatory interplay between a physical barrier preventing the influxof external stimuli and an inflammatory response to the infiltrating stimuli. Importantly, thisinterdependent regulation occurs on different time scales: the tissue-level barrier permeabilityis regulated over the course of days, whereas the cellular-level enzymatic reactions leading toinflammation take place within minutes. This multi-scale regulation is key to the epithelium’sfunction, and its dysfunction leads to various diseases. This paper presents a mathematicalmodel of regulatory mechanisms in the epidermal epithelium that includes processes on twodifferent time scales at the cellular and tissue levels. We use this model to investigate the es-sential regulatory interactions between epidermal barrier integrity and skin inflammation andhow their dysfunction leads to atopic dermatitis (AD). Our model exhibits a structure of dual(positive and negative) control at both cellular and tissue levels. We also determined how thevariation induced by well-known risk factors for AD can break the balance of the dual control.Our model analysis based on time-scale separation suggests that each risk factor leads to qual-itatively different dynamic behaviours of different severity for AD, and that the coincidence ofmultiple risk factors dramatically increases the fragility of the epithelium’s function. The pro-posed mathematical framework should also be applicable to other inflammatory diseases thathave similar time-scale separation and control architectures.Keywords: Multi-scale modelling, epithelium, time-scale separation, atopic dermatitis, riskfactors
1Department of Bioengineering, Imperial College London, London SW7 2AZ, United Kingdom2Institute of Child Health, University College London, 30 Guilford St, London WC1N1EH3Department of Mathematics, Imperial College London, London SW7 2AZ, United Kingdom4Correspondence: [email protected]
74

4.2.2 Introduction
Most physiological processes are tightly controlled by regulatory interactions across differenttemporal and spatial scales. An important example of such multi-scale regulatory interactionsis found in the epithelium, the tissue covering the organs and cavities of animal bodies. Theepithelium provides the first layer of protection against harmful environmental stimuli suchas bacteria, chemicals or pollen through a tightly controlled interplay between the regulationof the physical barrier permeability to the environmental stimuli and the immune reaction tothe infiltrating stimuli [34, 237, 39, 238]. Importantly, while the regulation of the physi-cal barrier permeability results from the orchestration between growth, differentiation, andapoptosis of different cell types on the order of hours or days [139, 173], the phenotype ofeach cell within the epithelium is determined locally based on the concentration of local ef-fectors (such as enzymes and gene transcripts) regulated through protein-protein interaction(PPI) networks on the order of minutes [239, 128]. In turn, the strength of the inter-epithelialstimulus depends on epithelial permeability, a tissue-level property determined by the epithe-lium’s homeostasis. Therefore, regulation of epithelium function involves an interplay of fastinflammation-inducing PPIs with slow barrier-reconfiguring processes in an archetypical ex-ample of multiple-scale regulatory feedback.
Defects in this multi-scale feedback regulation may lead to the loss of epithelial homeosta-sis, inflammation and the development of diseases, including atopic diseases such as asthma [39],allergic rhinitis (hay fever) [12], and atopic dermatitis (AD) [7]. These diseases are typicallycharacterised by two strongly interconnected symptoms (loss of barrier function and exacer-bated inflammatory reactions to environmental stimuli) that occur at different spatio-temporalscales.
Epidemiological and biochemical studies have established the relevance of a variety of riskfactors that predispose persons to atopic diseases, although the exact causes of these diseasesare not fully understood. Risk factors include genetic polymorphisms, as well as environmentalfactors (such as exposure to allergens or pollutants) [127, 75, 182, 27]. However, the role ofindividual risk factors in epithelial function is difficult to pinpoint experimentally due to thecomplexity of the highly interconnected, multi-scale epithelium regulatory network. Indeed,loss of regulation triggered by a risk factor may be the result of imbalances between differentprocesses across cellular and tissue levels. Furthermore, clinically relevant studies are ham-pered by the interference between multiple risk factors, often observed in patients with atopicdiseases [181]. This paper presents a mathematical framework to analyse systems-level mecha-nisms for atopic diseases. Our framework allows us to systematically assess the effects of single
75

or multiple risk factors on epithelium function; study how the coincidence of multiple risk fac-tors severely increases the propensity to develop atopic diseases; and deepen our understandingof the underlying mechanisms that lead to pathological conditions.
Several mathematical models have been proposed for studying the spatial dynamics of ep-ithelial cells, including migration, proliferation, differentiation and death of gut cells in relationto colorectal cancer [60, 61], or reorganisation of the epidermis during wound healing [240, 56].However, these models do not explicitly consider the regulatory interplay between the two de-fensive mechanisms of the epithelium, although the skin barrier integrity and the inflammatoryresponse mediated by PPIs have been modelled in isolation [152, 99]. Our framework buildsupon a mathematical model of the cellular-level regulatory mechanisms leading to AD thatfocuses on the activity of proteolytic enzyme kallikreins (KLKs) responsible for both skindesquamation and inflammation [84]. Although this cellular model successfully captures keyclinical features of AD and their dependence on some risk factors, it does not consider theintertwined, multi-scale feedback regulation across cellular and tissue levels.
This paper proposes an ordinary differential equation (ODE) model of epithelium functionthat includes the essential regulatory interplay between the two protective properties that oper-ate on different time scales: physical barrier integrity (on slow scales) and immune reactionsto eradicate the stimulus (on fast scales). We focus on the disruption of homeostasis in theepidermis leading to AD, an archetypical example of atopic diseases that affects nearly 30% ofthe paediatric population worldwide [27]. AD is characterised by an abnormal hypersensitivityto environmental stimuli and a loss of skin barrier function and is commonly manifested as dry,scaly skin and a rash. Note, too, that the essential features of complex regulatory mechanismsclarified by our multi-scale model can be used to broaden our understanding of other patho-physiological processes related to the loss of epithelial homeostasis, particularly in asthma andhay fever, given the confirmed association between AD and other atopic diseases [27].
Crucially, it is the slow, tissue-level behaviour that is observable and used for treatmentin clinical settings, yet such long-term dynamics are intricately interlinked with the fast, cel-lular PPIs. To study the slow dynamics, we assume a separation of time scales and considerquasi-stationarity at the cellular-level, leading to a system of differential-algebraic equations.Our model (Fig. 4.2) is constructed based on the view that overall homeostasis is achieved bymainly two types of regulated balance: one between activation and inhibition of KLKs at thecellular level and another between positive and negative feedbacks from inflammation-inducingsignalling pathways to the strength of stimulus at the tissue level. The interplay between thefast cellular-level reactions [84] and the much slower tissue-level dynamics controlling the con-centration of the inter-epidermal stimulus is needed in order to understand AD as being a resultof the disruption of epithelium homeostasis: excessive skin desquamation weakens the skinbarrier, allowing more stimulus to penetrate and trigger PPIs that result in immune reactions
76

capable of eradicating the stimulus and also lead to inflammation (Fig. 4.2A). Furthermore, ourmodel allows us to identify particular terms and parameters that disrupt these balances at thecellular and tissue levels, which naturally correspond to well-known AD risk factors.
Our model reproduces several key clinical features of AD. In particular, it clarifies therelationship between risk factors and specific dynamical responses to external stimuli. Themodel also predicts, in a quantitative manner, the increase in the susceptibility of the epidermisto developing atopic conditions given multiple risk factors. These results contribute to theidentification of the key underlying regulatory interplay between skin barrier homeostasis andinflammation in AD, and may lead to a more accurate characterisation of the disease symptomsrequired for personalised treatment. Moreover, our modelling approach, based on the time-scale separation and the view that the disease occurs as a result of loss of balance betweendual (positive and negative) feedbacks, provides a theoretical framework for the study of multi-scale regulatory interactions in many other physiological systems. We discuss the generalityof our modelling approach for studying the regulatory interactions between the cellular-levelinflammatory response and tissue-level regulation of epithelial homeostasis.
4.2.3 Multi-scale model for atopic dermatitis
Our multi-scale model of epidermal homeostasis builds upon a recent cellular-level model forregulation of KLK activities [84], which we couple to a model of tissue-level regulation. Theinput and output of the cellular-level model are the stimulus and the resultant inflammation,respectively, which, in turn, become the output and input of the tissue-level model (Fig. 4.2C).The biological processes considered in the multi-scale model are explained below, while acomplete model description, together with the nominal parameters used in the simulation, isfound in the Appendix. The corresponding processes in the model (Fig. 4.2A) are indicated bythe same labels (a)-(f) in Fig. 4.2C.
Modelling the tissue-level processes
Healthy skin with high barrier integrity prevents exacerbated penetration of environmental stim-uli into the inner epidermal layers (Fig. 4.2A(g)) [132]. Our model considers the skin barrierintegrity determined by a combination of the amount of corneocytes [113], their cohesion [43]and the lipid content [34] in the skin barrier. Accordingly, high barrier integrity is preserved byan appropriate balance between the production and desquamation rates of terminally differenti-ated keratinocytes and by maintenance of high lipid content. Skin barrier integrity is weakenedas a result of cellular-level responses. Excessive activation of KLKs leads to increased skin bar-rier desquamation by degrading the inter-cellular junctions (Fig. 4.2A(a)) [113], while activa-tion of Protease Activated Receptor 2 (PAR2) by active KLKs (Fig. 4.2A(c)) leads to enhanced
77
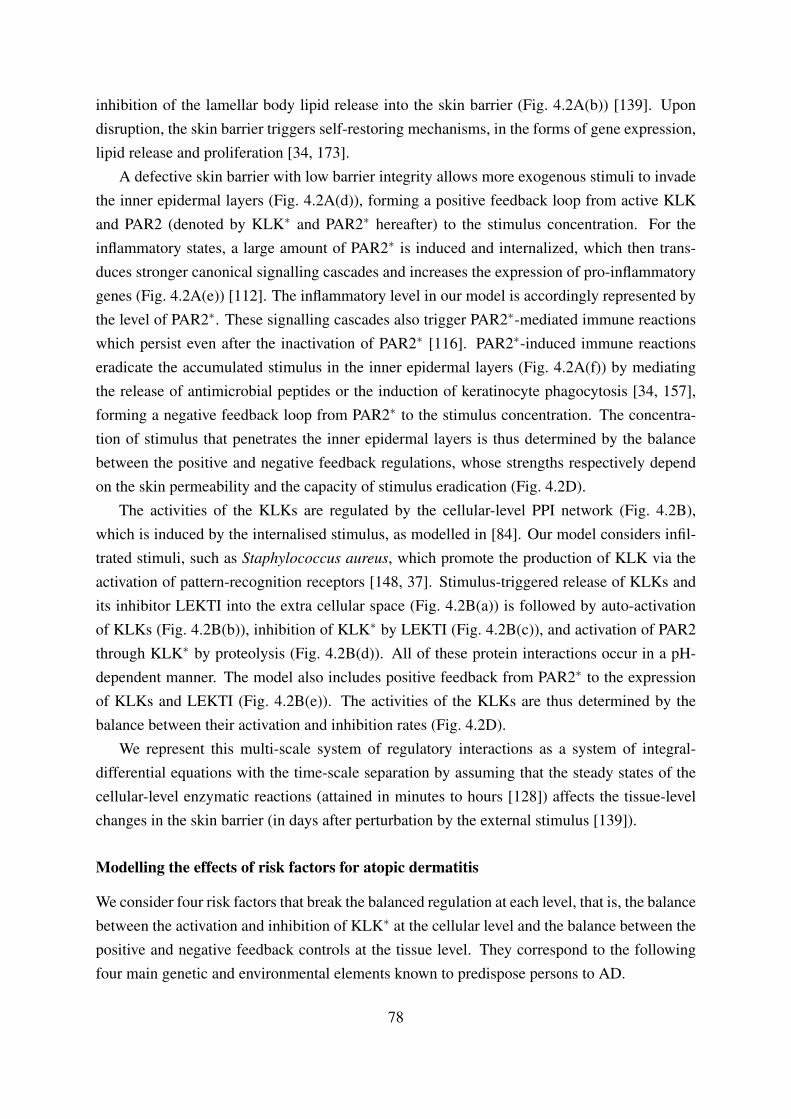
inhibition of the lamellar body lipid release into the skin barrier (Fig. 4.2A(b)) [139]. Upondisruption, the skin barrier triggers self-restoring mechanisms, in the forms of gene expression,lipid release and proliferation [34, 173].
A defective skin barrier with low barrier integrity allows more exogenous stimuli to invadethe inner epidermal layers (Fig. 4.2A(d)), forming a positive feedback loop from active KLKand PAR2 (denoted by KLK∗ and PAR2∗ hereafter) to the stimulus concentration. For theinflammatory states, a large amount of PAR2∗ is induced and internalized, which then trans-duces stronger canonical signalling cascades and increases the expression of pro-inflammatorygenes (Fig. 4.2A(e)) [112]. The inflammatory level in our model is accordingly represented bythe level of PAR2∗. These signalling cascades also trigger PAR2∗-mediated immune reactionswhich persist even after the inactivation of PAR2∗ [116]. PAR2∗-induced immune reactionseradicate the accumulated stimulus in the inner epidermal layers (Fig. 4.2A(f)) by mediatingthe release of antimicrobial peptides or the induction of keratinocyte phagocytosis [34, 157],forming a negative feedback loop from PAR2∗ to the stimulus concentration. The concentra-tion of stimulus that penetrates the inner epidermal layers is thus determined by the balancebetween the positive and negative feedback regulations, whose strengths respectively dependon the skin permeability and the capacity of stimulus eradication (Fig. 4.2D).
The activities of the KLKs are regulated by the cellular-level PPI network (Fig. 4.2B),which is induced by the internalised stimulus, as modelled in [84]. Our model considers infil-trated stimuli, such as Staphylococcus aureus, which promote the production of KLK via theactivation of pattern-recognition receptors [148, 37]. Stimulus-triggered release of KLKs andits inhibitor LEKTI into the extra cellular space (Fig. 4.2B(a)) is followed by auto-activationof KLKs (Fig. 4.2B(b)), inhibition of KLK∗ by LEKTI (Fig. 4.2B(c)), and activation of PAR2through KLK∗ by proteolysis (Fig. 4.2B(d)). All of these protein interactions occur in a pH-dependent manner. The model also includes positive feedback from PAR2∗ to the expressionof KLKs and LEKTI (Fig. 4.2B(e)). The activities of the KLKs are thus determined by thebalance between their activation and inhibition rates (Fig. 4.2D).
We represent this multi-scale system of regulatory interactions as a system of integral-differential equations with the time-scale separation by assuming that the steady states of thecellular-level enzymatic reactions (attained in minutes to hours [128]) affects the tissue-levelchanges in the skin barrier (in days after perturbation by the external stimulus [139]).
Modelling the effects of risk factors for atopic dermatitis
We consider four risk factors that break the balanced regulation at each level, that is, the balancebetween the activation and inhibition of KLK∗ at the cellular level and the balance between thepositive and negative feedback controls at the tissue level. They correspond to the followingfour main genetic and environmental elements known to predispose persons to AD.
78

High pH: Increased pH in the epidermis (pH around 6.5 in AD patients compared to 4.5 inhealthy skin) leads to increased catalytic activity of KLKs [128, 113].
Low LEKTI: A decrease in the basal expression rate of LEKTI, a KLK inhibitor, leads tocompromised inhibition of KLK activity [75].
High permeability: Increased skin barrier permeability, for example by a genetically deter-mined decrease in the expression of filaggrin (an essential protein for maintaining strongcohesion between epithelial cells) [43], allows increased penetration of stimulus, lead-ing to strong positive feedback from PAR2∗ and KLK∗ to the stimulus concentration.It is modelled with increased nominal skin permeability, P, which corresponds to thepermeability of the unaffected skin.
Weak stimulus eradication: Decreased capacity of the immune reactions to eliminate the in-filtrating stimuli [6, 241] leads to compromised negative feedback from PAR2∗ to thestimulus concentration.
We investigate the effects of the risk factors (in isolation and combination) on the devel-opment of AD by altering the corresponding parameters in the model. The parameters corre-sponding to the cellular-level risk factors, "high pH" and "low LEKTI", are taken from [84].New parameters corresponding to the tissue-level risk factors, "high permeability" and "weakstimulus eradication", are varied to see the effects of the balance between the positive andnegative feedbacks on the development of AD.
4.2.4 Bistable switch with hysteresis at the cellular level
We are interested in the steady states of PAR2∗ and KLK∗ (denoted hereafter as [PAR2∗]s and[KLK∗]s, with the subindex s indicating steady states), since we assume that [PAR2∗]s and[KLK∗]s are reached quickly compared with the overall tissue dynamics which they affect.
Figure 4.3A shows the bifurcation diagram for PAR2∗ (inflammation) described in [84] withthe inter-epidermal stimulus concentration as a bifurcation parameter. This dose-response curveexhibits bistability, with low and high branches corresponding to the non-inflamed and inflamedstates, respectively. Therefore, the state switches to the high branch when the stimulus increasesabove the inflammation threshold S+ and remains there until the stimulus decreases below therecovery threshold S−< S+, at which point it goes back to the low branch and the inflammationstops. This classic hysteretic behaviour induced by the bistability of the model captures thecharacteristic features of AD, namely the outbreak and persistence of inflammation [84]. Wenote that similar bistability and hysteresis is observed for [KLK∗]s with the same S+ and S−
values as for [PAR2∗]s.
79

gC) gD)
gA) gB)
Inflammation
Cor
nifie
d la
yer
(ski
n ba
rrie
r)G
ranu
lar
laye
r
g
a
b
c
d
e f
Inflammation
InactivebKLK
ActiveKLK
LEKTI
InactivePAR2
LBblipid
ActivePAR2
Stimulus
a
bc
d
e
Stimulus
+ -
KLK*
Permeability
LEKTI pH
Switch +-
Stimuluseradication
Inflammation
Stimulus
PAR2*
PAR2
KLK*LEKTI KLK
LEKTI-KLK* pH
Permeabilityb
Stimuluseradication
a
b
c
d
e
f
Inflammation
Barrierintegrity
Figure 4.2: Multi-scale model of Atopic dermatitis. (A) Tissue-level reactions considered.(a) Skin desquamation by KLK∗ (active KLK), (b) inhibition of LB lipid release by PAR2∗
(active PAR2), (c) PAR2 activation by KLK∗ (at the cellular-level), (d) penetration of the envi-ronmental stimuli into the inner layers of the epidermis, (e) inflammation triggered by PAR2∗
(at the cellular-level), (f) eradication of stimuli by immune reactions, and (g) protection againstenvironmental stimuli by healthy skin barrier. (B) Cellular-level reactions considered. (a)Release of inactive KLK and its inhibitor LEKTI enhanced by inter-epidermal stimulus, (b)auto-activation of KLK by proteolysis, (c) inhibition of KLK∗ by LEKTI, (d) activation ofPAR2 by KLK∗, leading to inflammation, and (e) increased release of KLK and LEKTI uponPAR2 activation. (C) Schematic representation of the multi-scale model for epidermal func-tion, consisting of the tissue-level regulation for skin barrier integrity (beige circle) and thecellular-level PPI leading to inflammation (violet circle). (D) Core structure of our model andthe risk factors. Switch behaviour of inflammation occurs through stimulus-induced PPI atthe cellular level (violet circle) mediated by a combination of positive (KLK∗ activation) andnegative (KLK∗ inhibition by LEKTI) controls. The concentration of the inter-epidemal stim-ulus is controlled at the tissue level (beige circle) by a combination of positive (via skin barrierpermeability) and negative (via stimulus eradication) feedbacks from KLK*-activated PAR2*leading to inflammation. We consider four risk factors for AD, "high pH", "low LEKTI", "highpermeability", and "weak stimulus eradication", each of which breaks the balanced control atthe cellular and tissue levels.
80
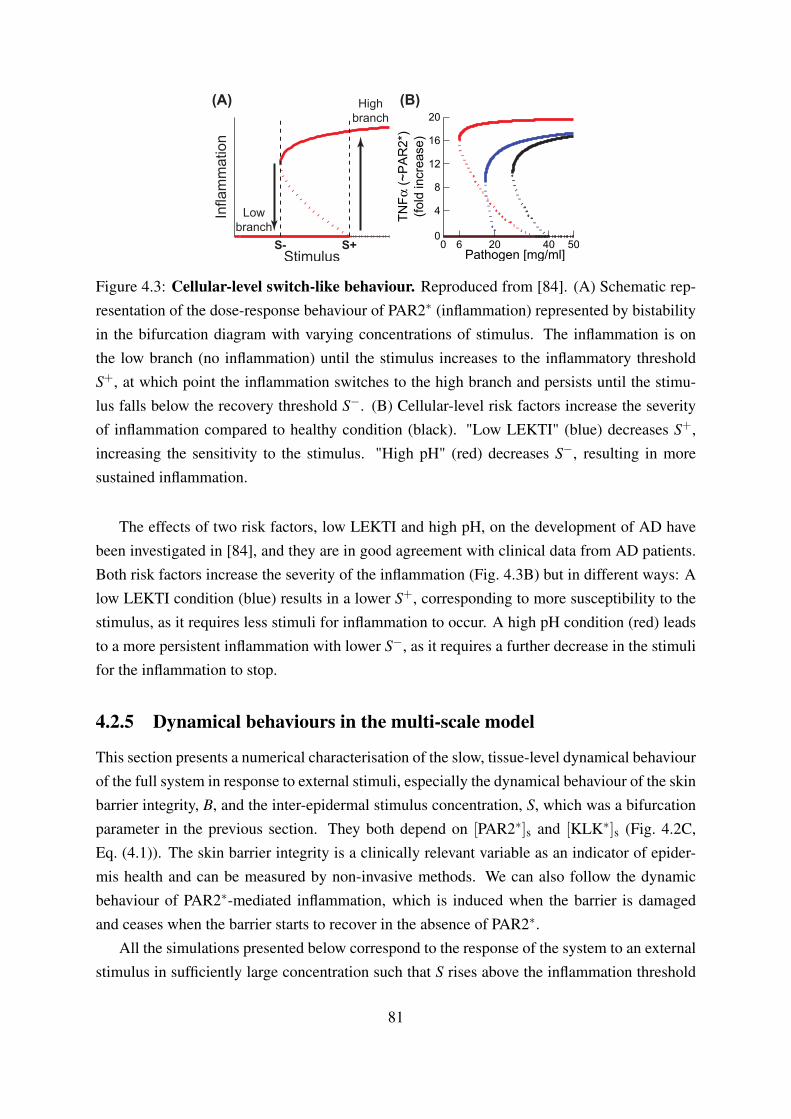
Infla
mm
atio
n
Stimulus
(A) (B)Highbranch
Lowbranch
S- S+ 6 20 40 5000
4
8
12
16
20
Pathogen/[mg/ml]
TN
Fa/
R~P
AR
2)*
Rfol
d/in
crea
se*
Figure 4.3: Cellular-level switch-like behaviour. Reproduced from [84]. (A) Schematic rep-resentation of the dose-response behaviour of PAR2∗ (inflammation) represented by bistabilityin the bifurcation diagram with varying concentrations of stimulus. The inflammation is onthe low branch (no inflammation) until the stimulus increases to the inflammatory thresholdS+, at which point the inflammation switches to the high branch and persists until the stimu-lus falls below the recovery threshold S−. (B) Cellular-level risk factors increase the severityof inflammation compared to healthy condition (black). "Low LEKTI" (blue) decreases S+,increasing the sensitivity to the stimulus. "High pH" (red) decreases S−, resulting in moresustained inflammation.
The effects of two risk factors, low LEKTI and high pH, on the development of AD havebeen investigated in [84], and they are in good agreement with clinical data from AD patients.Both risk factors increase the severity of the inflammation (Fig. 4.3B) but in different ways: Alow LEKTI condition (blue) results in a lower S+, corresponding to more susceptibility to thestimulus, as it requires less stimuli for inflammation to occur. A high pH condition (red) leadsto a more persistent inflammation with lower S−, as it requires a further decrease in the stimulifor the inflammation to stop.
4.2.5 Dynamical behaviours in the multi-scale model
This section presents a numerical characterisation of the slow, tissue-level dynamical behaviourof the full system in response to external stimuli, especially the dynamical behaviour of the skinbarrier integrity, B, and the inter-epidermal stimulus concentration, S, which was a bifurcationparameter in the previous section. They both depend on [PAR2∗]s and [KLK∗]s (Fig. 4.2C,Eq. (4.1)). The skin barrier integrity is a clinically relevant variable as an indicator of epider-mis health and can be measured by non-invasive methods. We can also follow the dynamicbehaviour of PAR2∗-mediated inflammation, which is induced when the barrier is damagedand ceases when the barrier starts to recover in the absence of PAR2∗.
All the simulations presented below correspond to the response of the system to an externalstimulus in sufficiently large concentration such that S rises above the inflammation threshold
81

S+, moving the system onto the high branch in the bifurcation diagram for both cellular-levelrisk factors with a nominal barrier permeability (Fig. 4.3B).
Classification of dynamical behaviours in the slow time
For different sets of parameters, our model exhibits three qualitatively different dynamic be-haviours for the skin barrier integrity when responding to environmental challenges of the stim-ulus (Fig. 4.4), in order of increasing severity of the AD manifestation:
Homeostasis: Complete recovery to the homeostatic level, typical for a healthy epidermis,
Oscillation: Periodic loss of homeostasis, often found in moderate AD skin, and
Persistent damage: Incapability of recovery to the homeostatic level, often observed in se-vere AD skin.
These three behaviours can be understood in terms of the interplay between the slow andfast dynamics leading to a quasi-static sweep of the bifurcation curve of the fast system.
In the case of homeostasis, the stimulus S is eradicated via immune reactions and fallsbelow the recovery threshold S−, at which point the inflammation stops as it jumps to the lowbranch (Fig. 4.4A, right). The barrier integrity then recovers to its homeostatic value with noinflammation (Fig. 4.4A, left). This behaviour is observed when the stimulus eradication isstrong enough to decrease S below S− through negative feedback, although the skin barriersuffers from transient damage while the inflammation is on the high branch, leading to theincrease in S through positive feedback.
In some cases, however, S can increase again to S+ after it transiently falls below S−, thusre-triggering inflammation that again decreases S below S− through the same mechanism. Thiscycle leads to an oscillation of the skin barrier integrity (Fig. 4.4B). Whether S re-increases toS+ or not is determined by its steady state concentration, Ss, when the inflammation is on thelow branch (no inflammation). If Ss is higher than S+, then S eventually exceeds S+. A highSs reflects a weak barrier which cannot keep S low enough without the inflammation causingnegative feedback on S.
Under other conditions, S cannot be decreased below S−, for example, when the stimuluseradication is not strong enough (weak negative feedback) or when the barrier permeability istoo high (strong positive feedback) (Fig. 4.4C). Such conditions lead to persistent damage ofthe skin barrier integrity with the complete loss of barrier integrity, as the inflammation cannotbe resolved.
In addition to the qualitative nature of the dynamical behaviour, the severity of the transientbarrier damage can be quantitatively evaluated in terms of two clinically relevant measures:the recovery time required for the barrier integrity to recover to its homeostatic level and the
82

(A)
(C)
(B)
Bar
rier in
tegr
ity
Time
Bar
rier in
tegr
ityB
arrie
r in
tegr
ity
Infla
mm
atio
n
S- S+Stimulus
Infla
mm
atio
nIn
flam
mat
ion
Figure 4.4: Schematic representation of the three qualitative dynamic behaviours of skinbarrier integrity after environmental challenges. (A) Homeostasis: observed when the stim-ulus is decreased to S− and the inflammation stops. (B) Oscillation: observed when the stimulusis repeatedly decreased to S− (inflammation stops) and then re-increased to S+ (inflammationreoccurs). (C) Persistent damage: observed when the stimulus fails to decrease to S−.
maximum amplitude of the damage to the skin barrier. These two measures are usually notindependent: the maximum amplitude of the barrier damage depends on the recovery time,since the longer the recovery takes, the heavier the damage is to the barrier.
Risk-factor dependent of dynamical behaviours in the slow time
Our model predicts the risk-factor dependence of the observed behaviour for the skin barrierintegrity classified above, based on the different effects of each risk factor on the tissue-leveldynamics of S, the value of Ss, which is a solution of the multi-scale model, and the thresholdvalues S+ and S− determined by the cellular-level PPI (Fig. 4.5A).
Since the low LEKTI condition leads to a decrease in the inflammatory threshold S+ (Fig. 4.3B,blue), S is more likely to increase to S+ after it transiently decreases below S−, thereby leadingto an oscillation of the epidermal integrity (Fig. 4.5B, blue). The high pH condition with a lower
83

S- S+Stimulus
HighpH
LowLEKTI
Permeability
Stimuluseradication
Infla
mm
atio
n
(B)(A)
0.2
0.4
0.6
0.8
1
0 2 4 6 8 10
Timed(days)
0
Bar
rier
dinte
grity
(nor
mal
ize
ddto
dB)~
Figure 4.5: Effects of risk factors. (A) Schematic representation of the effects of single riskfactors on the cellular-level bifurcation diagram. "High pH" decreases S− and "weak stimuluseradication" prevents the decrease of S, resulting in difficulty in lowering S below S−. "LowLEKTI" decreases S+ and "high permeability" increases S, facilitating S to go above S+. Anincrease of S by "high permeability" makes it more difficult to reach S−. (B) Risk-factor depen-dent behaviour of barrier integrity. While healthy (black) shows homeostasis, "high pH" (red)leads to persistent damage, whereas "low LEKTI" (blue) results in oscillation. The effects ofthe tissue-level risk factors are shown in Fig. 4.6.
recovery threshold S− (Fig. 4.3B, red) leads to persistent damage (Fig. 4.5B, red), because it ismore difficult to decrease S below S−.
The high permeability increases S by allowing more of the external stimulus to penetrate(Fig. 4.5A). The larger S is, the more easily S+ is reached, leading to the oscillation, and themore difficult S is decreased to S−, leading to the persistent damage. Increasing the degreeof the high permeability risk factor (Fig. 4.6A, blue arrow) leads to a qualitative transitionfrom homeostasis (green) to oscillation (yellow), and further to persistent damage (red). Thistransition is accompanied by a continuous increase in the maximum amplitude of the barrierdamage. Note that the external stimulus does not penetrate enough to induce the inflammatoryresponse ("non-responsive") if the permeability is very low (Fig. 4.6A, grey).
When the capacity of stimulus eradication is weak, S cannot be decreased even with highinflammation (Fig. 4.5A). Decreasing the capacity of stimulus eradication (Fig. 4.6A, pinkarrow) results in a qualitative transition from homeostasis (green) to persistent damage (red)directly, with a continuous increase in the maximum amplitude of barrier damage. Weakeningthe stimulus eradication capacity by itself does not lead to the onset of oscillation, since itdoes not affect either of the two oscillation determining factors, i.e., Ss (determined by thenon-inflamed state) or S+ (determined by the cellular-level PPI).
Our quantitative analysis of the proposed model suggests that the severity of the (transient)damage to the skin barrier is significantly increased by the concurrence of multiple risk factors,
84

as is often the case for AD [127, 43, 42]. Concurrence of the two tissue-level risk factors ("highpermeability" and "weak eradication") makes the transition from homeostasis to oscillation andpersistent damage occur by a smaller increase in the degree of each risk factor, resulting in morefrequent occurrences of oscillation and persistent damage with a larger maximum amplitude ofbarrier damage (Fig. 4.6A, grey arrow). Additional presence of cellular-level risk factors ("lowLEKTI" (Fig. 4.6B) or "high pH" (Fig. 4.6C)) further increases the skin vulnerability, with alower occurrence of "non-responsive" (grey) and "homeostasis" (green) and a higher proclivitytowards "oscillation" (yellow) and "persistent damage" (red) with a larger maximum amplitudeof barrier damage.
4.2.6 Discussion
The regulatory structure of the model leads to distinct dynamic signatures for differentrisk factors
We have proposed a multi-scale model of the epidermis as a means to investigate the regulatoryinterplay between the tissue-level skin barrier integrity and cellular-level inflammation with anintrinsic separation of time scales. As a result of a combination of the cellular-level switch-ing and the tissue-level feedback control (Fig. 4.2D), our model displays three qualitativelydifferent dynamic responses for skin barrier integrity: homeostasis, oscillations and persistentdamage (Fig. 4.4). These behaviours emerge from a combination of balanced feedback regula-tion at the cellular level and tissue level.
Our multi-scale model allowed us to assess the impact of several risk factors on the epider-mal function and suggests that each risk factor has its own specific dynamic signature (Fig. 4.6).These features could be used to characterise patient-specific causes of AD from the observeddynamic behaviours of the epidermis and to improve the personalised treatment of AD. Impor-tantly, the risk-factor dependent qualitative behaviours do not depend on the particular choiceof system parameters, but rather on the general structure of the multi-scale regulatory networkmodel and how the different terms are affected by the risk factors. The PAR2∗-induced in-flammation is regulated by a dual (positive and negative) control at the cellular level: negativecontrol with inhibition of KLK∗ by LEKTI and positive control with pH-dependent activationof KLK∗ and PAR2∗. The concentration of stimulus at the tissue level is also controlled in adual way: negative control to decrease it through its eradication and positive control to increaseit by degrading the skin barrier. A balance between the two dual controls acting at the cellularand tissue levels is essential to maintaining the healthy homeostasis. The risk factors in thispaper correspond to disturbed feedback strengths that cause an imbalance of the dual control(Fig. 4.2D), leading to either oscillatory or persistent loss of homeostasis. The concurrence ofmultiple risk factors, each of which affects the dual control, dramatically increases the fragility
85

(A) Healthy (B) Low LEKTI (C) High pH
EradicationEradication Eradication Eradication
Pe
rme
ab
ilit
yP
erm
ea
bilit
y
B
0
~
00
1
0.5
0.5 1 0 0.5 1 0 0.5 1
0
1
0.5
Figure 4.6: Increase in skin vulnerability caused by the presence of multiple risk fac-tors. The figure presents a summary of the bifurcations and dynamical behaviours observedfor different combinations of tissue-level risk factors ("high permeability" and "weak stimula-tion eradication") for (A) healthy (high LEKTI and low pH), (B) low LEKTI, and (C) high pHconditions. The black, blue and red circles in (A), (B), and (C) respectively correspond to thenominal values used for the simulation in Fig. 4.5B. Increase in AD severity is represented (toppanel) by transition of the dynamical behaviours of the epidermal integrity from homeostasis(green) to oscillations (yellow) and further to persistent damage (red) accompanied (bottompanel) by increases in the maximum amplitude of the skin damage. The grey area indicates"non-responsive" due to the strong skin barrier integrity. (A) Increasing permeability (blue ar-row) leads to a qualitative transition from homeostasis to oscillation, and further to persistentdamage, accompanied by a continuous increase in the maximum amplitude. Decreasing thecapacity of stimulus eradication (pink arrow) results in a direct transition from homeostasis topersistent damage. Concurrence of the two tissue-level risk factors accelerate this transition(grey arrow). Additional presence of cellular-level risk factors ("low LEKTI" (B) or "high pH"(C)) increases the skin vulnerability with a smaller region of "non-responsive" and "homeosta-sis" but with a larger region of "oscillation" and "persistent damage", compared to healthy (A).
86

of the regulatory system of epithelial function, even if the system is robust enough to buffer outdisturbances caused by single risk factors.
Applicability to other inflammatory diseases
One of the main features of our model is the presence of a switch at the cellular level realisedby the bistability in the bifurcation diagram of the inflammation (Fig. 4.3A), coupled with aslower regulatory system. This structure makes our model resemble an ‘on-off’ hybrid sys-tem [242], in which switching between two dynamic control regimes (depending on whetherthe inflammation is ‘on’ or ‘off’) determines the global behaviour of the system.
Pathogen-induced signalling cascades play a key role in protecting the body from infec-tion by triggering immune reactions that contribute to the eradication of the stimulus. How-ever, these signalling cascades also trigger tissue-damaging inflammation, since the inductionof stimulus-eradicating mechanisms often concurs with the release of pro-inflammatory me-diators [114, 130, 154]. The switch mechanism prevents unnecessary and inefficient immunereactions to be triggered, since the activation of the signalling cascades occurs only when thestimulus concentration is high enough (above the inflammation threshold) to endanger the tis-sue, and the immune reactions persist until the stimulus falls significantly below the inflamma-tion threshold. This ensures that inflammation does not re-occur through random fluctuationsof the stimulus concentration.
Unnecessary and ineffective immune reactions are accompanied by inflammation that cancause the destruction of tissues and has a significant impact on the epithelial function by affect-ing morphology [238, 157], composition [138], abundance [243] and micro-environment [34]of epithelial cells, without contributing to eradicating pathogens [244, 245]. Indeed, this consti-tutes a major part of pathology in many inflammatory and infectious conditions including atopicdermatitis [244, 245, 246]. Therefore, fast resolution of the inflammation is essential for therestoration of homeostasis, and relies on a balance between negative (via stimulus eradication)and positive (via tissue damage) feedback from the inflammation to the stimulus concentration.
The bistability of the cellular-level inflammatory responses together with the dual feedbackon a longer time scale constitute a biologically reasonable architecture in terms of efficiencyand robustness, and it has been found in many inflammation-inducing PPI networks [201, 247].For example, bistability has been found in the multi-scale regulatory networks of the inflam-matory response induced by cytokine interleukin 1 (IL1), another system of interest as regardsAD [182, 248]. This system is similar in structure to the KLK system discussed in this paper,since PPI leading to IL1 activation is also triggered by stimuli that infiltrate through the skinbarrier [122], including several biotic and abiotic allergens [49, 154], and active IL1 affects thestimulus concentration by initiating immune reactions that eliminate the stimulus [154] and byaltering skin barrier formation [226]. Our model can also be applied to the other two atopic
87

diseases, asthma and hay fever, since the regulation of bronchial and nasal epithelium functionoccurs though a similar interplay between the tissue-level barrier and cellular-level inflamma-tory response in the epidermis, bronchial epithelium, and nasal epithelium [12, 27].
Clinical significance
Despite its clinical importance, the epidermal function has seldom been studied from a systems-level perspective. Conventional experimental approaches have not fully revealed the relation-ships between the barrier dysfunction and inflammatory response in the development of AD[241, 8]. Our model provides a platform to analyse the bi-directional interplay between skinbarrier dysfunction and aberrant inflammatory response (Fig. 4.2D).
Our model suggests that the measurement of the barrier integrity over time can predictthe type of clinical course a particular patient is expected to follow (Fig. 4.4). This is alsocompatible with clinical findings: the long-term prognosis of atopic patients may be relatedto the type of behaviour observed; whereas persistent inflammation is associated with a poorprognosis, patients with periodic inflammation have better chances for resolution of the disease,indicating there may be a correspondence between these behaviours to increasing severities ofatopic diseases [249].
An empirical validation of our model predictions, particularly the association between thefour risk factors and dynamic model behaviours (Fig. 4.6), and implementing the predictionin dermatological practice will require an empirical system-level investigation of the epithe-lium to measure the barrier integrity and inflammation over time for different phenotypes andenvironmental conditions. For this purpose, it is essential to develop a new way to continu-ously measure the barrier integrity over several hours to a day, for example by non-invasivemeasurement of transepidermal water loss and skin hydration measurements for the skin fromAD patients [250] or by use of organotypic cultures, which allow temporal and spatial quan-titative characterisation of the skin [251]. Validation of our results through such studies willcontribute to a more efficient, patient-specific treatment of AD and other atopic diseases, sincethe risk factor triggering the disease condition in a particular patient can be deduced from thetime course of the barrier integrity.
Possible extensions of the model and future work
Our model considers the essential processes and reactions that contribute to the regulatory inter-play between tissue- and cellular-level dynamics at different time scales from the viewpoint ofdual controls. This framework could be extended to include another level with an even slowertime scale corresponding to the proliferation and differentiation of epithelial cells. The regener-ation of the skin barrier requires skin barrier precursors, i.e., correctly differentiated cells at the
88

lower layers of the epithelium [171]. Our model assumes a constant concentration bpre of skinbarrier precursors. However, formation of these barrier precursors is in fact a dynamic processthat is orchestrated among differentiation, proliferation and apoptosis of epithelial cells, and isfurther affected by inflammatory signals [226, 252]. Describing such dynamics of the epithe-lial cells at an even slower time scale and coupling it to the multi-scale model proposed herewould allow us to explore the interplay between inflammation and epithelial tissue renewal,and to address interesting, open questions regarding deregulation of epithelium renewal in thecontext of inflammation, which plays an important role not only for AD [171], but also for thedevelopment of tumors [253].
The skin immune system can interact with the systemic immune system in AD, which maybe incorporated into the model in the future. It has been widely observed that AD patientsare more prone to develop asthma and hay fever, leading to the so-called atopic march [27,62]. It is thought that allergic reactions occur in different organs due to allergic sensitisation,which is the induction of allergic reaction and the establishment of immunological memoryby repeated exposure of inter-epithelial cells to antigen [27]. This sensitisation usually occursat the systemic level, and the exposure to the allergen in other organs, after the establishmentof sensitisation in the skin, can initiate allergic reactions and subsequent immunopathologythere, although local factors such as the integrity of epithelium may be also important for thedevelopment of allergic diseases [254]. Incorporation of the allergic reaction in the modelwould allow us to explore not only the mechanisms of the atopic march but also the allergicdiseases of strong clinical relevance [121, 255], while our model considers early events inthe pathogenesis of AD that occur before adaptive immune responses to the stimuli, such ashistamine release by primed mast cells, are initiated.
Concluding remarks
We proposed a multi-scale model for epithelial function which predicts that the underlyingrisk factors for AD can be inferred from the clinically observable dynamic response of the skinbarrier to environmental challenges. Our model analysis using time-scale separation reveals theeffects of AD risk factors on the epidermal function regulated by the dynamic interplay betweeninflammation and skin barrier permeability. Our results may lead to a better understanding ofthe design principles of the regulatory systems for epithelial homeostasis and inflammation andmay be able to be extrapolated to other atopic diseases. Our modelling approach provides atheoretical framework for studying multi-scale regulatory interactions, characteristic of nearlyall physiological systems.
Atopic diseases represent an important and unresolved health problem, mainly because theircauses have not yet been elucidated due to the complex nature of the underlying regulatory net-works across different scales. Clinical research will benefit from our systems-level mathemat-
89

ical framework for studying epithelium function, as it will allow systematic evaluations of theeffects of risk factors and different treatments, such as corticosteroids or emollients, on clini-cally observable epithelium markers such as the barrier function. We expect our research willcontribute to a deeper understanding, more accurate description, and patient-specific treatmentof atopic diseases.
Acknowledgments
EDH thanks the Mexican Council for Science and Technology (CONACyT) for a PhD scholar-ship. MO is a Human Frontier Science Program Long-Term Fellow. MB acknowledges partialsupport from the BBSRC through grants BB/F005210/2 and BB/G020434/1. RJT acknowl-edges funding from the EPSRC through a Career Acceleration Fellowship.
4.2.7 Appendix
Multi-scale KLK model description
Our multi-scale model is a combination of the cellular-level model proposed in [84] (Model 1with positive feedback from [PAR2∗] to LEKTI production) and a tissue-level model describedas:
dSdτ
= SoutP
B+ ε−S ( fIP IP + I0) , (4.1a)
dBdτ
=bpre
1+ kL[PAR2∗]s
(1− B
B
)−dK[KLK∗]sB, (4.1b)
where τ corresponds to the slow time scale, S is the concentration of the inter-epidermal stim-ulus and B is the barrier integrity.
The inter-epidermal stimulus, S, increases by the penetration of external stimulus, Sout,through the barrier, hence its rate is proportional to Sout and inversely proportional to the skinbarrier integrity, B (Fig. 4.2C(d)). The minimum barrier integrity, ε, reflects the fact that evenvery severe cases of AD [44] do not lead to a complete destruction of the skin barrier andensures that the model is always well-defined. Eradication of S occurs by the combination ofPAR2∗-independent (I0) and -dependent (IP) immune reactions (Fig. 4.2C(f)) represented by
IP =∫
τ
0[PAR2∗]se
−τ+x dx, (4.2)
where the convolution with a decaying exponential captures the persistence of the immunereactions even after inactivation of PAR2∗ [116].
90

The barrier integrity, B, is determined by the balance between the production and degrada-tion of the barrier. The barrier is produced from precursors, which are assumed to be constantlyavailable with a fixed concentration, bpre, and lipids, whose release is inhibited by PAR2∗
(Fig. 4.2C(b)). The capacity of the barrier to self-restore the nominal barrier integrity, B, fol-lowing its disruption [34, 173] is represented by a logistic term. The degradation of the barrieroccurs as a result of desquamation mediated by KLK∗ (Fig. 4.2C(a)).
Note that [PAR2∗]s and [KLK∗]s are the stable steady state concentrations of PAR2∗ andKLK∗ obtained from the ODE model [84] for the cellular-level PPI reaction network whichdescribes the dynamic behavior of the concentration of six species, including PAR2∗ and KLK∗,as a six-dimensional system of ODEs with 21 parameters.
Parameter values and robustness of the model outcomes
The nominal values of the parameters for the cellular-level model are taken from [84]. Forthe tissue-level model, we chose nominal values (Table 4.1) that are consistent with availableexperimental data. Since the experimental data to date is qualitative rather than quantitative,our model predictions are concerned with the qualitative effects of the risk factors, in terms ofa loss of balance of the dual control, on the system’s behaviour.
Such results are largely robust to the parameter choices, as confirmed by a detailed analy-sis of the sensitivity of the parameters on the model behaviours. Our numerics show that thequalitative behaviour is preserved when the parameters are changed 10-100 fold. More specif-ically, the PAR2∗-independent immune reactions (I0) and the nominal skin barrier integrity (B)are scaling factors for Ss. The concentration of skin barrier precursors (bpre) affects the skinbarrier recovery time, but does not alter the qualitative behaviours. The strength of lipid releaseinhibition by PAR2∗ (kL) and the rate of desquamation by KLK∗ (dK) scale the concentrationsof [KLK∗]s and [PAR2∗]s, thus affecting the propensity for persistent loss of homeostasis butnot the qualitative behaviours.
The other two parameters of the model encapsulate the effects of particular risk factors.The skin permeability (P) was varied from P ≈ 0 (no influx of the stimulus) to P = 1 (100% permeable barrier) to assess the effects of the "high permeability" risk factor on the modelbehaviours (Fig. 4.6). The effects of the "weak stimulus eradication" risk factor were assessedthrough varying the corresponding parameter ( fIP) from 0.01 (weak stimulus eradication) to 1(healthy stimulus eradication) (Fig. 4.6). Varying fIP for orders of magnitude higher and lowerdid not show qualitatively different results.
91

Table 4.1: Parameters of the mathematical model of the early stages of AD
Parameter Description Nominal value UnitsSout Concentration of external stimulus 95 mg/mlP Nominal skin permeability 0.4 1/dayfIP Strength of stimulus eradication by PAR2∗-
mediated immune reactions0.8 1/day
I0 PAR2∗-independent immune reactions 1 1/daybpre Concentration of skin barrier precursors 0.5 1/daykL Strength of lipid release inhibition by PAR2∗ 10 noneB Nominal skin barrier integrity 1 nonedK Rate of desquamation by KLK∗ 0.1 1/dayε Minimum barrier integrity 0.01 none
Model analysis
[PAR2∗]s and [KLK∗]s were calculated by solving the fixed point for algebraic equations of thecellular-level model [84] using Maple 13 (Maplesoft, Waterloo, Ontario, Canada). These wereused for the dynamic simulations of the multi-scale model using the ODE solver |ode23t|in Matlab Version R2010a (The MathWorks, Inc., Natick, MA, USA). The solver |ode23t|was chosen to increase the accuracy of the numerical simulations of our stiff multi-scale model,in which abrupt changes in the QSS variables [KLK∗]s and [PAR2∗]s dramatically change thedynamical behaviour. At each iteration of the solver, the values of [PAR2∗]s and [KLK∗]swere updated according to the history of S, by using the |odeset| command in the functiondeclaration.
92

Chapter 5
Modelling the effects of treatment of AD:Towards optimal patient-specifictreatment for the early phases of AD
5.1 Introduction
In this section, we use the insights obtained in chapter 4 on the disease mechanisms underlyingearly phases of AD to explore the effects of possible treatments on the pathogenic process.With this, we aim to contribute to the design of patient-specific therapeutic interventions thatcan prevent the aggravation of the disease (discussed in chapter 6).We focus on three treatments commonly prescribed to AD patients: antibiotics, emollients andcorticosteroids. They directly affect the infiltrated pathogens, the barrier function and the im-mune responses, respectively [24, 25, 256].Intriguingly, different treatments benefit only a fraction of AD patients [24]. Likely, thispatient-specific effectiveness of the individual treatments can be attributed either to the patient-specific cause (risk factor) or to the patient-specific stage (early vs. late) of the disease [25].Effective, personalized treatment thus requires an understanding of the underlying mechanismsof these different treatments, and how their impact on the restoration of epidermal homeostasisdepends on particular causes and stages of the disease process.Further, prolonged treatment in the form of antibiotics, emollients and corticosteroids can haveadverse long term effects on epidermal homeostasis. For example, frequent use of high doses ofantibiotics can lead to antibiotic resistance [23], long term use of emollients can impair barrierrestoration mechanisms due to its occlusive effects [150, 174], and extended use of corticos-teroids impairs barrier function [64], due to its interference with keratinocyte proliferation anddifferentiation programs [65]. It is hence clinically relevant to minimize the strength and dura-
93

tion of the treatment [63]. Our quantitative analysis proposed here corresponds to a first steptowards this optimization of the treatment strategy.To achieve this goal, we explore possible mechanisms responsible for differential effects ofthese treatments in the context of the model proposed here. This quantitative framework allowsthe investigation of potential patient-specific causes of AD [236], contributing towards the de-velopment of personalized treatment strategies.The results presented here are preliminary, and are being further investigated in collaborationwith Dr Yuzuru Sato (visiting researcher at Imperial College London) and William Nightingale(undergraduate student at the Department of Bioengineering, Imperial College London).
5.2 Mathematical model of the treatments
To model the risk-factor dependent effects of the three different treatments on loss of epidermalfunction that occurs in early phases of AD, we add following terms to equation 4.1, correspond-ing to the effects of antibiotics, corticosteroids and emollients, respectively:
• Antibiotics increase the rate of elimination of infiltrated stimulus. They are modelled byadding a second degradation term in equation 5.1.
• Emollients increase the barrier function. They are modelled by adding a constant termto the barrier production rate (green term in equation 5.1).
• Corticosteroids have opposing effects on the functioning of the epithelium. First, theydecrease the strength of the immune responses [66]. This mitigates the barrier damagingeffects of inflammation (desired therapeutic effect), but can also lead to a increased in-fection due to reduction of pathogen-eradicating immune responses (adverse effect) [65].Moreover, sustained use of corticosteroids lead to a decrease in barrier function by inter-fering with the barrier formation process, an adverse effect known as skin atrophy [65].We model these effects by the blue terms in equation 5.1, namely:
– Decreasing the rate of immune-response-dependent barrier degradation, with rateκdegradation ∈ [0,1). This represents the corticosteroid-induced mitigation of inflammation-induced barrier damage.
– Decreasing the rate of immune-response-dependent pathogen elimination, with rateκpathogen ∈ [0,1). This represents one adverse effect of corticosteroids.
– Scaling the interference of PAR2-mediated inflammation with the barrier produc-tion rate, by the term C(t)κproduction. Values for κproduction < 1 reduce the bar-rier damaging effects of PAR2-dependent inflammation (desired therapeutic effect),
94

while values of κproduction > 1 represent a increase in the interference with barrierformation processes (adverse effects).
For simplicity, we chose to model the effects of corticosteroids on epidermal homeostasisby this phenomenological approximation. In an alternative, mechanistic representationof the effects of corticosteroids on the inhibition of immune responses, we modelled theeffects of the corticosteroids by assuming that C(t) decreased the rate of activation ofthe PAR2-mediated immune response pathway. Particularly, we assumed that the cor-ticosteroids decrease the rate of PAR2 activation of the model proposed in [235] (kP
in equation 3.1). The resulting simulations are shown in figure 5.1. Clearly, the corti-costeroids affect the stimulus-dependent onset of PAR2-mediated immune responses bysimply decreasing (linear scaling) the strength of the PAR2-mediated immune responses,but do not significantly affect the threshold parameters S− and S+. These results suggestthat a mechanistic representation of the effects of corticosteroids on the PAR2−mediatedimmune responses (by scaling the PAR2 activation rate, as in figure 5.1) can be reason-ably approximated by the phenomenological representation in equations 5.1 (scaling ofimmune responses IP, barrier damage mediated by active KLK∗s , and inhibition of barrierproduction meditated by active PAR2∗s effects).
The mathematical model used for the quantitative analysis of the risk-factor dependenteffects of treatments is given in equation 5.1:
IP =∫
τ
0[PAR2∗]se
−τ+x dx, (5.1a)
dSdτ
= SoutP
B+ ε−S(t)C(t)κpathogen ( fIP IP + I0)−S(t)Antibiotics(t), (5.1b)
dBdτ
= Emollient(t)+bpre
1+ kLC(t)κproduction[PAR2∗]s
(1− B
B
)−dKC(t)κdegradation[KLK∗]sB.
(5.1c)
A healthy epidermis is modelled by assuming the nominal parameters of the model 3.1(HC in [84]), with Sout = 95, P = 0.4, fIP = 0.8 and bpre = 0.5 in equation 5.1. High proteaseactivity induced by high pH is modelled by increasing the catalytic rates of KLK in model 3.1(High pH in [84]). The other parameters used for the model simulations (figures 5.2 and 5.1)are given in table 5.1.
95

Nominalv
Lowvdosevofvsteroids
Highvdosevofvsteroids
Pathogenv[mg/ml]
Imm
une
vres
pons
ev
3fol
dvin
crea
sevin
vPA
R2v
activ
ity4
S- S60 10 20 30 40 500
2
4
6
8
10
12
14
16
18
20
Figure 5.1: A mechanistic representation of corticosteroid treatment results in a simplescaling of the dose response diagram describing protease mediated inflammation A mech-anistic model of corcorticosteroid treatment (decrease in the PAR2- activation rate kP in equa-tion 3.1) results in a almost-linear decrease in the steady state levels of PAR2 activity (”In-flammation”), without significantly changing the threshold parameters S+ and S−. Hence, thiseffect can be approximated by simply scaling the steady state levels of PAR2∗ and KLK∗ onepidermal function, as in equations 5.1.
5.3 Qualitative analysis of patient -specific treatment strate-gies for the early phases of AD
In sections 4.2.5 (particularly, figure 4.5) and 3.2.6, we determined the two different mecha-nisms by which risk factors can lead to the loss of epidermal homeostasis. It occurs by differ-entially affecting the relative position of the steady state values of the infiltrated stimulus whenimmune responses are low (Slow
ss ) or high (Shighss ) respect to the threshold values S− and S+.
Recall that a homeostatic epidermis requires Slowss ≤ S+ and Shigh
ss < S− (figure 3.3).Risk factors such as ”low LEKTI” or ”low FLG” preferentially impair the first of these con-ditions. By decreasing S+ (”low LEKTI”) or increasing Slow
ss , these risks factors propitiateSlow
ss ≤ S+, resulting in a recurrent events of barrier damage and inflammation (figure 5.3 A,B)Risk factors such as high pH or low AMP preferentially impair the second of these conditionsfor homeostasis. The risk factor high pH decreases S−, and low AMP increases Shigh
ss , resultingin a persistent loss of epidermal homeostasis (figure 5.2 A,B). Accordingly, treatment can pro-pitiate the recovery of epidermal homeostasis by restoring Slow
ss ≤ S+ or Shighss < S−.
Antibiotics and emollient treatments decrease both Slowss and Shigh
ss . Therefore, they can poten-tially counteract epidermal loss of homeostasis regardless of the mechanism that triggers thedisease.In contrast, corticosteroid treatment interferes with the effects of immune responses on epider-
96

Table 5.1: Parameters of the model of the treatment of the early phases of AD (dimensionlessand arbitrarily chosen parameters for simulating equations 5.1)
Symbol Name Nominal valuesTreatment parameters
no treat-ment
treatment
Emollient Emollient treatment 0 1 (low), 5 (high)C(t) Corticosteroid treatment 1 0.1κdegradation Inflammation-dependent barrier degradation 1 0.1κproduction Inflammation-dependent inhibition of barrier
production1 0.1
κpathogen Inflammation-dependent pathogen elimination 1 0.05antibiotic Strength of emollient treatment 0 1
Phenotype parametershealthy disease
fIP Strength of immune response 0.8 (HC) 0.1 (low AMP)P Skin barrier permeability 0.4 (HC) 0.7 (low FLG)
mal function, and can therefore only affect Shighss . Hence, corticosteroid treatment might lead to
remission only when the loss of epidermal homeostasis is driven by Slowss > S+.
Figure 5.2 C exemplifies a scenario in which loss of epidermal homeostasis is caused by low
AMP, resulting in Shighss > S− (figure 5.2 B), even though Slow
ss ≤ S+ (bistability discussed insection 3.2.6). In this case, a single dose of antibiotics, which reduces S(τ) below S− (figure5.2 C), results in total remission (figure 5.2 D). Analogous results are obtained for a scenarioin which loss of epidermal homeostasis is caused by high pH (figure 5.2 E).In these examples, a single dose of treatment are sufficient to trigger total remission. The treat-ment has to be sufficiently strong to drive S(τ) below S−. Once reached S−, the infiltratedpathogen will stabilize to a homeostatic value of Slow
ss ≤ S+ (as shown in figure 5.2 C). In thecase of antibiotics treatment, the stronger the dose, the more likely S(τ) can be driven belowS−. For corticosteroids, however, a optimal dose that leads to remission corresponds to a in-termediate concentration of corticosteroids, because of the dual effects of corticosteroids onbarrier function and pathogen load.
Figure 5.3 shows a scenario in which use of emollients alleviate the recurrent flares ofbarrier damage and inflammation (figure 5.3 A) caused by the combination of Slow
ss > S+ andShigh
ss > S− (figure 5.3 B). Specifically, we consider the cases in which emollients compensatethe damaging effects of ”low LEKTI” (figure 5.3 C) and ”low FLG” (figure 5.3 D) by increas-ing Slow
ss .In the absence of emollients, ”low LEKTI” or ”low FLG” induce recurrent flares of inflam-
97

Time
v
PersistenceBar
rierv
inte
grity
StimulusIn
flam
mat
ion
S6 S3
SHighss
5A1vDynamicvpathologicvbehaviourv
5B1vTreatmentvcompensatesthevpathologicalvmechanism
5C1vMechanismvofvtreatment
5D1vAntibiotics
SHighss
5E1vCorticosteroids
HighvpHv3vsinglevdosevofvcorticosteroids
Treatment
HighvpH
5pathological1
5treatment1
S6
S3SLow
ss
LowvAMP
Timev5days18 ] R8 R] *88
R8
*8
[8
/8
]8
z8
~8
Timev5days18 R * [ / ]8
87*
87/
87z
878
R
Timev5days18 R * [ / ]8
87*
87/
87z
878
R
LowvAMP
LowvAMP3vsinglevdosevofvantibiotics
TreatmentTreatment
HighvpHv3vsinglevdosevofvcorticosteroids
HighvpH
Imm
une
vres
pons
e5f
oldv
PA
R*2
vincr
eas
e1Timev5days1
8 ] R8 R] *88
*8
8
R*
Rz
/
Pat
hoge
nv[m
g.m
l]
Bar
rierv
inte
grity
5nor
mal
ize
dvto
vP1~
Figure 5.2: Complete remission of AD can be achieved by treatment that drives the tran-sition from a unhealthy to a healthy steady state The qualitative dynamic behaviour ”persis-tence” (A), resulting from a inability to reach the recovery threshold value S− in the bifurcationdiagram (B), can be compensated by a single dose of treatment that enables the decrease of S(τ)
in equation 5.1 until surpassing S−. Once reached S−, the treatment can be suspended, and S(τ)
(now on the low branch) stabilizes to Slowss < S+ (C). Two examples of these treatments include
antibiotics (D) and and corticosteroids (E), that can lead to restore epidermal homeostasis thatis lost by low AMP and or high pH, respectively.
mation with a high amplitude and frequency (figures 5.3 C and D, red lines). Low doses ofemollient decrease both amplitude and frequency of these oscillations (figures 5.3 C and D,blue lines), by accelerating the decrease of S(τ) to S− (S in equation 5.1 b is larger in the pres-ence of emollients), even if the dose is not strong enough to decrease treated Slow
ss below S+.Emollients can lead to a complete remission if the dose is sufficiently high to decrease Slow
ss
below S+ (black lines in figures 5.3 C and D).Note that when loss of homeostasis is caused by Slow
ss > S+, a constant use of emollients isnecessary to alleviate the loss of epidermal homeostasis. As soon as the treatment is stopped,Slow
ss will return back to its original, high steady state, re-setting the pathogenic phenotype givenby the recurrent flares of inflammation.
98

Bar
rierD
inte
grity
Infla
mm
atio
n
Recurrence
StimulusSP S1
SHighss
SLowss
Time
TimeDGdays0
GA0DDynamicDpathologicbehaviourD
GB0DTreatmentDcompensatesDtheDpathologicalDmechanismD
GC0DLowDLEKTID1DEmollient
SLowss
GD0DLowDFLGD1DEmollient
noDemollient
lowDdoseDofDemollient
highDdoseDofDemollient
Gpathological0
Gtreatment0
0 5 10 150
5
10
15
25
25
TimeDGdays00 5 10 15
0
5
10
15
25
25
Imm
une
Dres
pons
eGf
oldD
PA
R25
Dincr
eas
e0
Figure 5.3: Emollients decrease the frequency and amplitude of recurrent inflammationin a dose-dependent way. The qualitative dynamic behaviour ”recurrence” (A), results froma increase in Slow
ss to a value above S+ that is caused by risk factors such as ”low LEKTI” (C)or ”low FLG” (D). This loss of homeostasis can be alleviated by emollients, which reduce Slow
ss
in a dose-dependent manner. Low doses of emollients reduce the amplitude and magnitudeof the recurrent inflammation, while high doses of emollients lead to a recovery of epidermalhomeostasis.
5.4 Conclusions and future work
In this section, we presented a qualitative analysis of the effects of three common treatments,namely antibiotics, emollients and corticosteroids, on the early development of AD.We explored how different treatments can differentially affect epidermal function that has beenlost in a risk-factor dependent way. These results contribute to understanding the patient-specific effects that characterize the treatment of AD [24].So far, our results rely on a qualitative analysis that is based on the hybrid systems approach,proposed in [207, 208] and discussed in section 3.2.6. It helped us to pinpoint different mech-anisms by which treatment can lead to the recovery of homeostasis. We exemplified these
99

mechanisms by considering the effects of antibiotics on a virtual patient in which AD is im-paired due to a low expression of AMPs (figure 5.2 D), simulated treatment of patients wherethe skin is disrupted by high pH corticosteroids (figure 5.2 E), and different doses of emollientson virtual patients where the skin is disrupted by low levels of expression of LEKTI (figure5.3 C) and filaggrin (figure 5.3 D).However, a systematic analysis of the effect of treatments on different virtual patients, each ofthem characterized by a particular risk factor and parameter combination, is required to derivequantitative and clinically relevant model predictions.We will also use the mathematical model to explore different treatment regimes which combineemollients, antibiotics and corticoseroids that are administrated with particular frequencies andmagnitudes.This will help us to devise a optimal treatment that effective induces epithelial remission butrequires only a minimal dose and frequency of drugs, reducing the adverse effects of AD treat-ments.Finding optimal treatment to restore epidermal homeostasis that characterizes early phases ofAD is particularly important in the context of preventive, patient specific medicine, becausetreating early phases of AD has the potential to prevent the onset of advanced, severe andirreversible phases of the disease that will be discussed in the next chapter.
100

Chapter 6
Modelling advanced stages of AD: Theonset of adaptive immune responses
6.1 Introduction
In chapter 4, we investigated the role of different risk factors on the early development of AD,characterized by a aberrant interplay between innate immune responses and barrier function.During this phase of the disease, mild forms of epithelial dysfunction, appearing as recurrentcycles of barrier damage and inflammation, can be reversed as soon as the risk factor is coun-teracted [25].This situation is exemplified in figure 6.1. It corresponds to simulations of equations 4.1 (ex-plained in chapter 4) for three different phases: During the first phase of the simulations (Iin figure 6.1), the permeability barrier function is set to its nominal value, corresponding toa healthy system with a nominal filaggrin content (P = 0.4). Then, in phase II (red area infigure 6.1), we simulated a decrease in filaggrin content (by setting P = 0.7, corresponding tothe genetic condition ”low FLG” discussed in section 4.2.3). As discussed previously (section4.2.5), a decreased filaggrin content is associated to loss of epidermal homeostasis that appearsas recurrent events of loss of barrier function, characteristic of early phases of AD. In the thirdphase (III), we increased again the fiaggrin content (by re-setting P = 0.4). As seen in figure6.1, restoration of the nominal conditions leads to a recovery of homeostasis. This suggeststhat mild forms of loss of epidermal homeostasis, appearing as recurrent flares of barrier dam-age, can be reversed to a healthy phenotype as soon as the risk factor that causes the loss ofhomeostasis (low FLG expression in figure 6.1) is counteracted.
This reversibility is further discussed in chapter 5. As shown in figures 5.3 and 5.2, duringthe early phases of the disease, it is possible to attain transient or even complete remission (i.e.restoration of epidermal homeostasis) upon administration of treatments such as emollients,corticosteroids and antibiotics that counteract the triggers of the disease.
101

0 2 4 6 80
0.5
1
timez(weeks)z
Bar
rierz
func
tionz
LowFLGz
Iz II III
(nor
mal
ize
dzto
zP)~
Figure 6.1: Reversibility of mild and early forms of AD The plot shows simulations of themodel of the early phases of AD, described by equations 4.1. The simulations start with nomi-nal parameters characterizing a healthy epidermis (I), followed by window of time (II) in whichfilaggrin expression is decreased (by setting P from 0.4 to 0.7) and ending with a restoration ofthe nominal, healthy conditions (by re-setting P from 0.7 to 0.4) in phase III. Low expressionof filaggrin induces a mild form of early AD (appearing as recurrent cycles of barrier damage)that can be reversed as soon as healthy filaggrin expression is restored.
This reversibility of the pathological phenotype is possible because the innate immune re-sponses triggered by the infiltrated pathogen display a reversible, switch like dose responsebehaviour (figure 3.2). As soon as the infiltrated stimulus is decreased below a threshold S−,the immune responses cease and the barrier is restored. No immunological memory is keptfrom the past events of stimulus infiltration.Advanced stages of the disease process, however, are characterized by allergic sensitization[160, 161, 27], that refers to the irreversible activation of impaired adaptive immune responses(mainly via Th2 cells) that are responsible for allergic reactions to infiltrating pathogens andchronic inflammation [39, 254, 160]. This is process is triggered by a cumulative history ofinnate immune responses and infiltrated pathogens [187].It is clinically relevant to understand allergic sensitization in the context of AD, since this pro-cess is responsible for the allergic component that characterizes this disease [160, 161].As shown in figures 2.3 A (control structure) and in 6.2 (cartoon representation), the onset ofallergic sensitization and a pro-inflammatory micro-environment starts by the release of cy-tokines in response to activation of innate immune response pathways [111, 158]. Particularlyimportant is TSLP, a cytokine that is produced by PAR2-mediated signalling pathways [39, 111]and has been show to play a key role in the onset of allergic inflammation that characterizes AD[257] (figure 6.2). TSLP induces the activation and migration of DC from the epidermis to thelymph nodes [158, 39] (figure 6.2, 2 and 2.3 A,II). Once in the lymph node, DC increase thelevels of IL4 [9, 254, 158] (figure 6.2, 3). This triggers the differentiation of T cells from naïve
102

T cells into polarized Th2 cells, a process that involves Gata-3 mediated signalling [159, 189](figure 6.2, 4), and is called T-cell polarization. Polarized Th2 cells migrate from the lymphnode to the epidermis [159, 189] (figure 6.2, 5), where they contribute to the establishmentto the allergic [158], pro-inflammatory micro-environment that characterizes the epidermis ofpatients with advanced [254] and severe [185, 186] forms of AD.The establishment of this pro-inflammatory micro-environment in the epidermis of AD patientsas a consequence of allergic sensitization further interferes with epidermal homeostasis, sincepro-inflammatory cytokines released by polarized Th2 cells affect epidermal tissue remodellingby interfering with gene expression programs [137, 138, 29, 125]. The establishment of a pro-inflammatory and allergic micro-environment as a consequence of Th2 polarization is henceresponsible for further worsening of the disease condition.
Furthermore, atopic sensitization is also the first step of the atopic march, defined as aprogression from AD to other atopic diseases, namely asthma and allergic rhinitis [62, 25].This sequential impairment of epithelial tissues (epidermis and airway epithelium) seems to betriggered by the increased levels of serum IgE and pro-inflammatory cytokines that result fromTh2 cell polarization [258]. By circulating in the blood, these molecules are able to interferenot only with epidermal remodelling, but also with other epithelial tissues, including the air-way epithelium [146]. This significantly increases the risk of developing asthma and allergicrhinitis [62, 258, 121]. Upon progression of the atopic march, loss of epithelial homeostasisis no longer confined to the epidermis, but spreads out to other epithelial systems to becomesystemic, since the rise in the levels of IgE and cytokines affects not only the epidermis, butalso the serum that comes in contact with many other epithelial tissues [258, 62].Early treatment (assessed in section 5) has the potential to prevent the advanced stages of AD,and avoid (1) the chronicity (associated to the irreversibility), (2) the worsening (associated tothe impaired gene expression programs by pro-inflammatory cytokines) and (3) the decentral-
ization of the loss of homeostasis from epidermis to other epithelial tissues the via the atopicmarch.Shedding light on the mechanisms that underlie the onset of a pro-inflammatory micro-environmentin the epidermis is the first step towards understanding the emergence of the aberrant gene ex-pression patterns that characterize the epidermis of patients with severe forms of AD [134].As observed for filaggrin, these impaired gene expression patterns can result from chronic ex-posure to cytokines without the need of ”hard coded” genetic defects, such as mutations orpolymorphisms [36].In this chapter, we build on the previous mathematical model that captured the early phasesof AD (described in chapter 4), to encompass the processes that lead to allergic sensitizationthat characterizes advanced forms of AD. Our previous model considered following processes(depicted in figure 4.1):
103

Epidermis
Blood vessel
TSLP
DCActivation
Lymph node
Migration
IL-4
Pathogen
Protease
Release
Cytokines (IL-13, IL-22)
Th2 cell
(1)
(2)
(3)
Migration
(4)
(5)
naive T cell
Gata3
IgE
Figure 6.2: Cartoon representation of the mechanisms leading to the onset of allergic sen-sitization and the establishment of a pro-inflammatory micro-environment that charac-terize the epidermis of AD patients with severe forms of AD Onset of allergic sensitizationand a pro-inflammatory micro-environment occurs through the polarization of T cells, a processthat involves following steps: (1) Pathogen infiltration through a damaged skin barrier and theresulting activation of protease -mediated innate immune responses trigger the release of TSLP.(2) TSLP induces the activation and migration of DC from the infected epidermis to the lymphnode. (3) There, DC increase the levels of IL4, a cytokine that (4) mediates the irreversiblepolarization of naïve T cells into Th-2 cells, in a Gata-3 dependent way. (5) Once polarized,Th-2 cells migrate back to the epidermis, where they play a protagonic role in the establishmentof a allergic, pro-inflammatory micro-environment by rising the levels of cytokines.
• Infiltration of pathogens through the skin barrier.
• Switch-like activation of KLK networks in response to the infiltrated pathogen.
• KLK-mediated reduction of barrier function (through degradation of intercellular junc-tions and by reduction of the replenishment of skin barrier components).
• Self-recovery of the skin barrier function.
• KLK-mediated onset of innate immune responses, in the form of increase in AMPs andneutrophil recruitment.
104

• Persistence of neutrophils, even after the KLK activity has ceased.
• Elimination of pathogens by the immune responses.
To include the onset of allergic sensitization, in the model proposed in this chapter, we addfollowing modules:
• Production of IL4 by DC that have migrated to the lymph nodes in response to TLSPstimulation. This module is simulated by the ”persistence” network motif described insection 3.4.
• Irreversible polarization of T cells in response to IL4 levels in the lymph node. Thismodule corresponds to the regulatory module presented in figure 2.3 G, and is simulatedby the equation 3.2 proposed in [195]. The dose-response behaviour of this equationcorresponds to a irreversible switch, as described in section 3.2.4 and shown in figure3.2.
The migration of polarized Th2 cells from the lymph nodes to the epidermis is not consid-ered in this model.
A schematic representation of the model of the onset of allergic sensitization, including thetwo added modules, is given in figure 6.3.
We use the resulting mathematical model (equations 6.1 and described in section 6.2) toassess whether environmental or genetic risk factors can potentially trigger the onset of allergicsensitization. We find that genetic (filaggrin mutation) and environmental (barrier perturbation)risk factors can trigger Th2 cell polarization, both alone and in combination (figure 6.5). Thesefindings are congruent with different sets of experimental data, derived from different mousemodels of AD in which the pathogenic process is triggered by only genetic [73], only environ-mental [258, 186, 255], or a combination of both [132] risk factors. For example, it has beenobserved that barrier perturbation, triggered by tape stripping and epicutaneous sensitization[258, 186], as well as repeated hapten exposure [255], leads to the development of an AD-likephenotype. A severe AD-like phenotype can also be triggered by a complete ablation of the fi-laggrin gene [73], and by a combination of filaggrin deficiency and repeated hapten challenges[132].Our model conciliates these apparently disparate experimental observations by providing a co-herent theoretical framework in which different mechanisms can trigger the onset of severeforms of AD.It contributes to understanding risk-factor-dependent disease mechanisms, which is necessaryto envision personalized treatment that considers the patient-specific pathogenic processes.Early therapeutic interventions can potentially prevent the onset of allergic sensitization, and
105

Switch
Persistence
Recovery
Qualitative behaviours
KLK
Filaggrin
Lipids
IL-4 DC
Neutrophil
Barrier function
Protease
Innate immune
responses
Pathogen
Input
Th2
Adaptive immune responses
Figure 6.3: Modular representation of the reaction network that underlies the onset ofaberrant adaptive immune responses. Infiltrating pathogens activate KLK networks in aswitch-like manner. Active KLK reduce barrier function by degrading the barrier componentsand by reducing the lipid replenishment. Active KLK also triggers innate immune responses byinducing the recruitment of neutrophils that persist even after the KLK activity has ceased. Ac-tive KLK (via PAR2-induced TSLP) also triggers the activation and migration of DC from epi-dermis to the lymph nodes, where they increase the concentration of IL4. IL4 then mediates thepolarization of Th2 cells via the switch like activation of the Gata3 pathway. Polarized Th2 cellsare responsible for the establishment of an allergic and pro-inflammatory micro-environmentthat decreases the expression of filaggrin (represented by grey arrow, not considered in thismodel).
must be assessed in a systems-level dynamic framework that considers different stages of thedisease.
6.2 Mathematical model of the advanced stages of AD
The mathematical model of the advanced stages of AD builds on the the mathematical modelof the early stages of AD, described in section 4.It considers the interplay between the barrier function and innate immune responses, mediatedby the activation of protease (KLK) by the infiltrated pathogen (figure 4.1). The correspond-ing reaction network is modelled by the multi-scale system of ODEs (equations 4.1 and 4.2,reproduced for clarity in equations 6.1a-c), where [PAR∗]s(τ) and [KLK∗]s(τ) are the history-
106

dependent steady-state solutions of equations 3.1 (reproduced for clarity in equations 6.2),determined by the infiltrated pathogen load S(τ).
In this model, we add two additional components to represent the mechanisms leading to theonset of allergic sensitization via the induction of Th2 cell polarization: (1) Release of IL4 byDC that have been activated by proteases (via the PAR2-dependent induction of TSLP), and (2)Th2 cell polarization by the IL4 dependent induction of Gata3.The PAR2-mediated increase in IL4 involves the activation and mobilization of a cellular com-ponent of the imune system (DC) in response to changes in cytokine levels (TSLP). It thereforecorresponds to a persistent network motif described in section 3.4. To mathematically describethis process, we use the mechanistic description of the cytokine-mediated induction of cellular-level immune cells (equation 3.8, reproduced for clarity in equation 6.1 e, where [IL4] is theconcentration of IL4 in the lymph nodes, kIL4 is the rate of induction of IL4 by active PAR2,and dIL4 quantifies the rate of degradation of IL4.T cell polarization occurs by the IL4- induced expression of Gata3 via the activation of the Stat6signalling pathway [159]. The activation of the Stat6 signalling pathway involves biochemi-cal interactions that stabilize quickly as compared to the slower, cellular processes leading toIL4. Further, Gata-3 mediated T cell polarization is irreversible, all-or-nothing process, sinceit involves major changes in gene expression programs [191]. Thus, the levels of Gata-3 asa function of IL4 correspond to a network motif that displays a switch-like dose response be-haviour, as described in section 3.2. We use the mathematical description of the IL4-mediatedGata3 activation proposed in [195] equation 3.2 (reproduced for clarity in equation 6.1 e). Theresulting dose response behaviour is a irreversible switchthat represents the irreversible differ-entiation of T cells: Once the levels of IL4 surpass the critical threshold value at which Gata3switches from a low to a high value due to a saddle node bifurcation, Gata3 expression levelsremain high, even if the IL4 levels completely cease afterwards (figure 3.2 D). We denote this
107

critical concentration of IL4 as the threshold for T cell polarization (figure 6.5).
dSdτ
= SoutP
B+ ε−S ( fIP IP + I0) , (6.1a)
dBdτ
=bpre
1+ kL[PAR2∗]s
(1− B
B
)−dK[KLK∗]sB, (6.1b)
IP =∫
τ
0[PAR2∗]se
−τ+x dx, (6.1c)
d[IL4](τ)dτ
= [PAR∗]s(τ)kIL4− [IL4](τ)dIL4, (6.1d)
d[Gata3(t)]dt
= α[[IL4]]+κG[Gata3(t)]2
1+[Gata3(t)]2−κ[Gata3(t)]. (6.1e)
d[KLK∗LEKTI]dt
= ka[KLK∗][LEKTI]− kd[KLK∗LEKTI]−δLK[KLK∗LEKTI], (6.2a)
d[LEKTI]dt
=−ka[KLK∗][LEKTI]+ kd[KLK∗LEKTI]+ tL(mL + fL[PAR2∗])−δL[LEKTI],
(6.2b)
d[KLK∗]dt
=−ka[KLK∗][LEKTI]+ kd[KLK∗LEKTI]+ k[KLK∗][KLK]
[KLK∗]+CK−δK∗[KLK∗],
(6.2c)
d[KLK]
dt=−k
[KLK∗][KLK]
[KLK∗]+CK−δK[KLK]+ fKSS+ fK[PAR2∗], (6.2d)
d[PAR2]dt
=−kP[KLK∗][PAR2][KLK∗]+CP
−δP[PAR2]+mP, (6.2e)
d[PAR2∗]dt
= fPSS[PAR2]+ kP[KLK∗][PAR2][KLK∗]+CP
−δP∗[PAR2∗]. (6.2f)
Unless otherwise stated, we used the nominal parameter values given in table 4.1 (for equa-tions 6.1a-c), in [195] (for equation 6.1e, and in [84] (for equations 6.2). The parameters thatquantify equation 6.1e are kIL4 = 0.04, dIL4 = 0.05, and the initial condition IL4(0) = 0 (di-mensionless and arbitrarily chosen).
A schematic representation of this model is given in figure 6.3.
108

6.3 Onset of adaptive immune responses can be triggered byboth genetic and environmental risk factors
To determine if genetic, environmental or a combination of both risk factors can trigger theonset of allergic inflammation, we simulated the mathematical model of the advanced stages ofAD (equations 6.1) for different concentrations of filaggrin (corresponding to different levelsof genetically determined filaggrin deficiency) and severities of environmentally determinedbarrier damage.Filaggrin deficiency was simulated as previously explained (section 4.2.3), by increasing thenominal skin permeability, P, to represent the fact that a low filaggrin content increases thepermeability of the skin barrier to external pathogens [73]. We considered three values ofP, P = 0.4, P = 0.6, and P = 1, representing the healthy control (FLG+/+), mild deficiency(FLG+/−), and severe (FLG−/−) filaggrin deficiency, respectively. These correspond to genet-ically encoded variations in filaggrin copy number [126].Environmentally determined barrier damage, induced, for example, by acetone treatment, tapestripping or exposition to sodium-lauryl-sulphate, was modelled by changing the concentra-tions of barrier precursors bpre, to mimic the fact that the expression of pro-filaggrin [140, 138,163, 172, 142] and many other precursors of barrier components [173] are decreased upon bar-rier perturbation. We considered three values for bpre, corresponding to a control (bpre = 0.05),mild (bpre = 0.02) and severe (bpre = 0.01) barrier damage, representing different regimes ofskin barrier perturbations (eg. tape stripping or acetone treatment with a particular frequencyand intensity).
As we saw in section 4.2.5, particularly figure 4.6, our model suggests that increased skinbarrier permeability caused by low FLG concentrations lead to oscillations in epidermal func-tion (yellow area in figure 4.6, top) with an amplitude (figure 4.6, bottom) that increases withdecreasing concentrations of FLG. As shown in figure 6.4, this dose-dependent severity of ofthe loss of epidermal homeostasis, caused in our model by low FLG expression, is also reflectedin the frequency of PAR2-mediated release of TSLP. Very low levels of FLG (FLG−/−) resultto a higher frequency in the PAR2-mediated release of TSLP, as compared to mild forms ofFLG deficiency (FLG+/−). Only high frequency TSLP oscillations lead to a rapid increase inIL4 expression in the lymph nodes, because very short periods of relaxation (characterized byno TSLP expression) do not allow IL4 levels to decay before the subsequent period of inductionof IL4 by TSLP. This results in a gradual accumulation of IL4 in the lymph nodes that even-tually surpasses the threshold of Th2 cell polarization (figure 6.5 A, red line). Low frequencyoscillations lead to a much slower increase in IL4 expression, stabilizing once the values of IL4are equal between two periods of high TSLP expression (figure 6.5 B, blue line).This dose-dependent effect of filaggrin expression on the risk of developing severe forms of
109

0 10 200
0.5
1
1.5
2
timeTndaysc0 5 10
0
0.5
1
1.5
2
timeTndaysc2 4 6 8 10 12
0
0.5
1
1.5
2
timeTndaysc
FLG-/- FLG+/- SevereTdamageMildTdamage
MildTdamageT+TTFLG+/-
FLG+/-MildTdamage
(A) (B) (C)T
SLP
Tn~
PA
R2*
cTnf
oldT
incr
ease
c
Figure 6.4: Increased risk factor severity, given by low FLG, high barrier damage, or syn-ergism between both, increases the frequency of the oscillations of the PAR2-mediatedTSLP release (A) Dynamic profiles for the levels of active PAR2-mediated release of TSLPfor mild (FLG+/−, simulated by setting P = 0.6) and severe (FLG−/−, simulated by settingP = 1) filaggrin deficiency. Decreasing the levels of FLG increases the frequency of TSLPrelease. (B) Dynamic profiles for the levels active PAR2-mediated release of TSLP for mild(bpre = 0.02) or severe (bpre = 0.01) barrier damage. Severe barrier damage increases the fre-quency of TSLP release. (C) The combination of mild filaggrin deficiency (FLG+/−, simulatedby setting P = 0.7) and mild barrier damage (simulated by setting bpre = 0.02) drastically in-creases the frequency of TSLP release that is triggered by a individual genetic (FLG+/−, withP = 0.4 and bpre = 0.05) or environmental (bpre = 0.02 and P = 0.4), risk factor.Unless otherwise stated, the parameters for these simulations correspond to the nominal valuesgiven in table 4.1. Parameters related to the KLK module correspond to the HC of [84]. Pa-rameters related to the Gata3 module correspond to the nominal parameters given in [195]. Theparameters quantifying the IL4 module are kIL4 = 0.04, dIL4 = 0.05, and the initial conditionIL4(0) = 0.
AD is consistent with experimental and clinical findings, which have established a direct re-lation between filaggrin content (determined copy number variations, different forms of SNPsand null-mutations) and the severity of the disease [126, 125].Our mathematical model also provides a plausible explanatory framework for murine modelsof AD, in which a AD-like phenotype is induced by manipulations in the genetic or environ-mental conditions of the mouse.As reported in [73], genetic ablation of filaggrin results in the development of an AD-likephenotype in mice in a dose-dependent manner. Congruent with our results, only completeabrogation of filaggrin (FLG−/−, but not FLG−/+) results in allergic sensitization. Furtherincreasing the penetration of environmental insults by subjecting the FLG−/− mice to a highconcentration haptens augments the severity of the phenotype [73, 132]. Indeed, very frequent
110

NoFdamage
MildFdamage
SevereFdamage
010 30 50 70
1
2
3
4
5
0
timeFpdaysz
IL4F
[mg/
ml]
FLGC/C
FLGC/-
FLG-/-
010 30 50 70
1
2
3
4
5
0
timeFpdaysz
ThresholdFforFT-cellFpolarizationpGata3Factivationz
Control
MildFdamageFCFFFLGC/-
FLGC/-
MildFdamage
010 30 50 70
1
2
3
4
5
0
timeFpdaysz
(A) (B) (C)
Figure 6.5: The onset of aberrant adaptive immune responses can be triggered by severeforms of individual genetic (FLG) or environmental (barrier damage) risk factors. In com-bination, also mild forms of risk factors lead to allergic sensitization. (A) Dynamic profilesfor the levels of IL4 in the lymph node for different severities of genetically determined filag-grin deficiency. These are simulated by setting P = 0.4 (FLG+/+, control), P = 0.6 (FLG+/−,mild), and P = 1 (FLG−/−, severe), corresponding to variations in FLG copy number. Onlythe most severe form of filaggrin deficiency results in a increase of IL4 above threshold forTh2 polarization, triggering in the onset of allergic sensitization. (B) Dynamic profiles for thelevels of IL4 in the lymph node for different severities of environmentally determined barrierdisturbances. These are simulated by setting bpre = 0.05 (control), bpre = 0.02 (mild barrierdamage), bpre = 0.01 (severe barrier damage), corresponding to the decreased amount of bar-rier precursors that result from sustained and frequent barrier damage. Only severe barrierdamage triggers the onset of allergic sensitization, by leading a gradual rise in IL4 levels thateventually eventually surpass the threshold for Th2 polarization. (C) Alone, a mild form of ge-netic (FLG+/−, simulated by setting P = 0.7 with bpre = 0.05) or environmental (mild barrierdamage, simulated by setting bpre = 0.02 with P = 0.4) risk factor does not lead to the onset ofallergic inflammation. However, in combination (simulated by setting bpre = 0.02 and P= 0.7),even mild forms can result in the polarization of Th2 cells. Unless otherwise stated, the param-eters for these simulations correspond to the nominal values given in table 4.1. Parametersrelated to the KLK module correspond to the HC of [84].
and severe hapten exposure can result in an AD-like phenotype, even in the absence of FLG
mutations [255].As shown in section 5, the use of emollients reduces the amplitude of the recurrent flares ofPAR2 activation and immune responses caused by low FLG expression (figure 5.3 D). As weshow in figure 6.5 A, reduced FLG expression seems to trigger the onset of adaptive immuneresponses by affecting the frequency of TSLP release, in a dose-dependent manner. These find-ings suggest that early use of emollient in high risk populations (eg. with FLG mutations) could
111

prevent the onset of advanced, severe and irreversible stages of AD. This model prediction isconsistent with clinical findings, that suggest that a emollient therapy in neonates significantlyreduces the risk for AD development [256].The skin of neonates displays lower permeability barrier function that improves during the firstyear of life [211]. Partly, this weak barrier function can be attributed to the small corneocytesize [259] and low filaggrin content [211] that characterize the skin of neonates, increasingtheir propensity to develop AD. Hence, emollient treatment during the first year of life couldbe sufficient to prevent the onset of advanced stages of AD, by supporting the post-natal skinmaturation process [259, 260].
Analogous to the results for filaggrin deficiency, our simulations suggest that severe formsof environmentally determined barrier damage can also result in T cell polarization.As seen in figure 6.4 B, increasing severities in barrier damage result in increased frequency inactive PAR2-mediated TSLP release, resulting in a rapid increase in the concentration of IL4in the lymph nodes that eventually surpasses the threshold of T cell polarization (figure 6.5 B).
Our model suggests that the combined effect of filaggrin deficiency and environmentally de-termined barrier perturbation dramatically increases the risk of developing a severe AD pheno-type. As seen in figure 6.5 C, the coincidence of filaggrin deficiency and barrier damage resultsin T cell polarization, even if the severity of the individual risk factors is not enough to triggera increase of IL4 above the threshold of T cell polarization.Our model predicts that this synergism between the environmental and genetic risk factor canbe attributed to the dramatic increase in the frequency of TSLP oscillations caused by the si-multaneous occurrence of barrier damage and filaggrin deficiency (figure 6.4 C).This theoretical result is congruent with experimental observations. A severe AD phenotypecan be reproduced in mice that have been subjected to prolonged exposure to high doses ofhaptens (increasing their penetration though the skin barrier) and tape stripping [258, 186].Further, the development of an AD like phenotype requires that the frequency of the pertur-bations (hapten exposure and tape strip) are high [255], confirming our model predictions thatsuggest that high-frequency disturbances in epithelial function can result in severe forms of AD(figures 6.4 and 6.5).This mechanism highlights the critical role of the persistence motif described in section 3.4,that acts as a capacitor that gradually stores the cyclic events of loss of barrier homeostasis ina frequency-dependent manner (figure 3.6).
112

6.4 Conclusions
In this chapter, we presented a model of the regulatory networks controlling epidermal functionthat can reproduce the onset of advanced stages of AD, triggered by genetic (FLG deficiency),environmental (barrier perturbation), or the synergism between both risk factors.Our results agree with clinical [126, 125] and experimental data that describe the onset of anAD like phenotype that is caused by a severe increase in the permeability to environmentalinsults [258, 186, 255, 73, 132].Our results also support the ”outside-in hypothesis”, stating that allergic inflammation can re-sult from barrier defects [7].Together with the results presented in section 5, our model predictions provide a plausible the-oretical explanation of the mechanisms that underlie the preventive effect of early emollienttreatment on AD development [256].Taken together, this mathematical model effectively captures the dynamic process leading to thedevelopment of late stages of AD that has been observed in the clinic and in experiments. Wewill continue using this model to further explore the mechanisms that underlie the pathogene-sis of AD. We hope that it will contribute to the design of better methods for early diagnosis,treatment and prevention of this socially relevant disease.
113

Chapter 7
Mathematical model of AD: Conclusionsand future work
The mathematical model of AD proposed in this thesis is able to reproduce the two stages ofthe pathogenic dynamics that is triggered by different combinations and severities of geneticand environmental risk factors.Based on the compilation of abundant but scattered experimental and clinical data, in chapter 2we presented a manually curated reaction network responsible for controlling epidermal home-ostasis. The network contains the most relevant biochemical and cellular effectors known toplay a important role in the pathogenesis of AD. Specifically, it represents the regulatory inter-play that exists between skin barrier function and inflammation, which are the two epithelialproperties that are impaired in AD. It was previously known that the genetic and environmentalrisk factors predisposing to AD alter epidermal function by targeting individual componentsof this entangled network of biochemical and cellular interactions. However, the complexityof AD comes mainly from the fact that disturbances elicited on the strongly connected regula-tory network components can eventually propagate, affecting different regions of the reactionnetwork. This process is largely responsible for (1) the existence of many different potentialtriggers of the pathogenic process, (2) the synergy between risk factors, that appear in the clinicas a dramatic increase in the propensity to develop AD as a consequence of the co-occurrenceof more than two risk factors, and (3) the gradual aggravation of the disease phenotype. Thisresults in a wide spectrum of possible disease phenotypes, each of which might require a spe-cific treatment. Decreasing the social burden of AD thus requires a systems-level approach,in which the effects of individual risk factors on the regulatory network are systematically as-sessed, alone and in combination, to entangle the complex pathogenesis of AD. Here, we pro-vide such as systems-level framework, in the form of the first multi-scale mathematical modelof AD. The model is a mechanistic representation of the previously described reaction network,that was assembled and carefully curated in chapter 2.
114
By simulating different risk factors, our model reproduces the main features of AD, providingan in silico representation of the different pathogenic processes that occur in different patientcohorts. Our model thus provides a plausible, mechanistic and integrative framework that canbe used to study AD from a systems-level perspective.Most of the experimental and clinical data describing the individual regulatory network com-ponents is qualitative. It clearly shows regulatory interactions and the different qualitativebehaviours described in chapter 3, but fails to provide quantitative kinetic information. Toaccount for this uncertainty, we use a qualitative modelling framework, in which the mainexperimentally described qualitative behaviours robustly arise from the underlying networktopology without requiring accurate parameter choices. The resulting network motifs are thenre-assembled into a multi-scale reaction network, which comprises the first multi-scale mathe-matical model of AD, proposed in this thesis.We simulated virtual patient cohorts by altering the model components that are affected by thedifferent risk factors. As a result, our mathematical model is able to display the different formsof loss of epidermal homeostasis that characterize early (chapter 4) and late (chapter 6) stagesof AD.This in silico reproduction of the pathogenic dynamics of AD, in which late and severe formsof AD emerge from specific early forms of the disease, pinpoints plausible mechanisms thatunderlie the gradual disease progression that affects some AD patients. Further, our frameworkallows us to map different forms of a worsening pathogenic dynamic trajectory to specific com-binations and strengths of risk factors, that correspond to patient-specific pathogenic triggersof the disease.This theoretical analysis can be used to inform new and more effective early treatment strate-gies that halt the progression of the pathogenic process. Indeed, as we showcased in chapter5.3, using our mathematical model, we can explore the effects of different pharmacologicaltreatments that are commonly used to control AD on the development of the disease in dif-ferent cohorts of virtual patients. As we discuss in chapter 6, this analysis allows us proposepreventive strategies that hinder the onset of severe forms of AD.Our mathematical modelling results agree with different in vivo clinical and experimentaldatasets. Specifically, the sudden onset of allergic sensitization as a consequence of severefilaggrin deficiency, severe skin barrier damage, or a combination of mild filaggrin deficiencyand mild barrier damage predicted in chapter 6 is congruent with different animal models ofAD, in which abrupt skin barrier defects can be triggered by different combinations of filag-grin mutations, repeated hapten challenges and tape stripping. Also, the dynamical profilesdiscussed in chapter 4 resemble different disease phenotypes that have been observed in theclinic.Our mathematical analysis predicts that the disease progresses from a mild to severe form of
115

AD, manifested as recurrent events of skin barrier damage and inflammation (discussed inchapter 4) that are suddenly transformed into a severe loss of barrier function resulting fromthe onset of allergic sensitization (chapter 6), only when the frequency of the early oscillationsin barrier damage and inflammation are high enough. Further, we predicted that different types,severities and combinations of risk factors can be mapped onto specific pathological dynamicalbehaviours that appear as oscillating barrier function and inflammation with distinctive fre-quencies and amplitudes. Together, this suggests that there exists a risk-factor dependent onsetof allergic sensitization. Validation of this theoretical result would mean that the pathogeniccourse in an individual patient, affected by a particular combination of risk factors, could po-tentially be predicted. This would enable early diagnosis and a pharmacological interventionthat halts the incipient progression of AD in patients in which AD would eventually developallergic sensitization.
The next steps are to validate the model predictions and to reach also a quantitative agree-ment between the model simulations and experimental and clinical data. For this, the proposedmathematical model of AD must be compared to in vivo datasets that dynamically describedifferent interacting components of the reaction network controlling epidermal homeostasis,and account for the different time-scales at which these different components operate.Such datasets can be obtained from clinical analysis of AD patients, as well as from experi-mental analysis of animal models of AD.Given that the epidermis is the most exposed (and hence, experimentally accessible) of all ep-ithelial systems, several measurements can be taken, in a non invasive way, from AD patients.For example, optical methods such as Raman spectorscopy can be used to measure the contentof several components of the skin barrier [261, 262, 263], and also the rate of epidermal prolif-eration [259].In addition to this clinical data, detailed empirical description of the pathogenic process ofAD can be obtained from murine models of AD. Together with our experimental collaborators(headed by Dr Mariko Okada, at RIKEN), we will use signalling activity profiles, quantifi-cations of immune cell populations, dynamic gene expression profiles and quantification ofhistological sections to calibrate our mathematical model of AD.We are confident that this will result in a experimentally validated and calibrated model of ADthat can be used to make clinically relevant predictions and to devise optimal, patient specifictreatment of AD.
116

To showcase the methodology to be followed to for the calibration of the mathematical modelof AD, we present in the next chapter a experimentally calibrated mathematical model of ep-ithelium homoeostasis.The data-driven mathematical model presented in chapter 8 describes the host pathogen inter-actions between Streptococcus pneumoniae and the upper airway epithelium.Similarly to the reaction network that controls epidermal homeostasis, airway epithelium home-
ostasis is also achieved by a balanced interplay between the two protective properties of theepithelium: immune responses and permeability barrier function.Given this similarity, we can adapt the mathematical modelling framework that we developedfor AD, based on a modular representation of the processes that control immune responses andbarrier function, to explore the mechanisms that lead the commensal bacteria Streptococcus
pneumoniae to become pathogenic as a consequence of a co-infection.As we will see, our mathematical model of the host pathogen interactions between Streptococ-
cus pneumoniae and the upper airway epithelium successfully captures the loss of epithelialhomeostasis that results from co-infection, and agrees with experimental in vivo data.This shows that our modelling framework to analyse the mechanisms responsible for the main-tenance of epithelial homeostasis, inspired by the analysis of epidermal tissue, can be appliedto uncover the mechanisms that control the functioning of other epithelial systems.
Thus far, we have used the mathematical model of the advanced stages of AD to explorehow ”low FLG” expression or a physical damage to the barrier results in the onset of allergicsensitization (figures 6.5). As a next step, we will explore the effect of other risk factors, suchas ”low AMP”, low LEKTI and ”high pH” (assessed in terms of their role in the onset of earlyphases of AD in chapter 4) on the gradual aggravation of the disease phenotype.For example, we saw in figure 4.5 that ”low AMP” expression is associated to a persistent lossof barrier damage, accompanied with a chronic activation of innate immune responses. In thisscenario, the levels of active PAR2 and TSLP remain elevated (figure 3.6 D), implying (equa-tion 6.1d) that the levels of IL4 will increase constantly until the maximal, steady state value([IL4]high
ss = [PAR∗]highs kIL4
dIL4) is reached (figure 3.4 D). Hence, as long as this steady state value
[IL4]highss is above the threshold of Th2 cell polarization, we expect that persistent activation of
innate immune responses, given by low AMP expression, will inevitably result in the onset ofaberrant adaptive immune responses.This direct relation between persistent loss of homeostasis and the onset of adaptive immuneresponses also highlights the important role that early treatment can play in preventing allergicsensitization. As discussed in section 5.3, this can be achieved, under some circumstances,by a single dose of antibiotics or corticosteroids that reverse the persistent loss of homeostasiscaused by risk factors such as ”low AMP”.
117

By exploring the effect of these different risk factors on the development of allergic sensiti-zation, we aim to provide a coherent framework that can explain the incidence of a severeAD-like phenotype that arises either by over-active proteases (equivalent to our ”high pH” riskfactor) [123] or low LEKTI [264, 265], ”low AMP” (unpublished data from our collaborators),or combinations of ”low FLG” and barrier damage (chapter 6).To achieve this, we plan to carry out further analysis of the model proposed in chapter 6 (equa-tions 6.1). This will be achieved by a combination of numerical simulations and a analyticexploration of the model behaviours. Particularly, we would like to quantitatively evaluate therelation between risk factor severity, the frequency of the TSLP oscillations, and the propensityto develop a severe form of AD.
Once we have quantitatively characterized the impact of different risk factors on the onsetof allergic sensitization, we want to further expand our model to analyse the impact of the pro-inflammatory micro-environment that results from T cell polarization on epidermal function.It is known that a pro-inflammatory micro-environment further impairs epidermal function bythe interference of pro-inflammatory cytokines with the expression of skin barrier components[137, 138, 29, 125]. Modelling this requires ”closing the loop” in the model proposed in chap-ter 6 (equations 6.1), by considering the inhibitory effect of Th2 induced cytokines on theexpression of filaggrin and other barrier components (grey blunt arrow in figure 6.3). We ex-pect that this further addition to the model will contribute to understand why low levels offilaggrin expression can emerge from a impaired control structure regulating epidermal func-tion (represented in figure 2.3), even in the absence of ”hard coded” genetic defects in theform of mutations or polymorphisms [138]. It will also help to understand the mechanismsthat underlie the further aggravation of the AD condition that occurs upon allergic sensitization[185, 161, 160].
The mathematical model proposed here is able to reproduce the pathogenesis of AD, that isa disease that affects a particular type of epithelium, namely, the epidermis. However, the onsetof several other diseases related to loss of epithelial function are caused by similar mechanismsas those that trigger AD, including asthma [266, 39, 266], allergic rhinitis [12], Crohn’s disease[237, 1] and colon cancer [267].This suggests that our modelling framework, derived from the analysis of the pathogenesisof AD, can be extrapolated to other epithelial systems, to explain the pathogenesis of otherdiseases related to loss of epithelial function.In fact, as we will see in the next chapter (8), we can use modelling framework, based ona modular representation of the interplay between barrier function and immune responses, tosuccessfully reproduce the loss of airway epithelium function that results from co-infection
118

with the commensal bacteria Streptococcus pneumoniae and the virus Influenza.
119
Chapter 8
Modelling host pathogen interactionsbetween Streptococcus pneumoniae andthe upper airway epithelium tounderstand co-infection
This work has been done in collaboration with our experimental collaborator Dr Thomas BClarke (Faculty of Medicine, Imperial College London), who introduced us to this biolog-ical system and has contributed extensively to the understanding of the underlying biology.Currently, we are continuing this work with George Buckle (MRes is Molecular and CellularBiosciences, Imperial College London).
8.1 Applying our modelling framework to understand themechanisms that underlie infection by commensal bac-teria
In the previous chapters, we presented our mathematical modelling framework, based on mod-ularity and time-scale separation, and applied this framework to model the reaction networkscontrolling epidermal homeostasis, to uncover the mechanisms leading to the onset of AtopicDermatitis (AD).In this chapter, we extend this theoretical framework to analyse the functioning of another ep-ithelial system: the host-pathogen interactions that occur in the airway epithelium in responseto the bacterium Streptococcus pneumoniae (the pneumococcus), to understand the mecha-nisms that lead to infection by this pathogen that normally resides as a harmless commensal
120

organism.In this epithelial system, homeostasis is achieved by a interplay between immune reactions(enacted by by neutrophils) and barrier function (given by intercellular junctions) that must bebalanced to prevent the onset of infection (figure 8.1).As discussed in previous chapters, this interplay is a key structural feature of the reaction net-works controlling epidermal homeostasis, since loss of balance in this interaction results in theonset of AD.Thus, the mathematical framework presented in the previous chapters, developed originally forunderstanding AD, can be naturally adapted to encompass the host-pathogen interactions thatoccur in the airway epithelium in response to Streptococcus pneumoniae.Mechanistic and quantitative understanding the host-pathogen interactions between the airwayepithelium and Streptococcus pneumoniae is fundamental to help preventing the yearly 14.5million cases of severe infection and 820 000 deaths by Streptococcus pneumoniae [21], andfind new and improved treatments that can circumvent antibiotic resistance [23].Besides this clinical relevance, extrapolating our modelling framework to the host-pathogen in-teractions between the airway epithelium and Streptococcus pneumoniae also has two scientificobjectives:First, we want to show that our modelling framework for understanding epithelium functionin health and disease is not specific for understanding epidermis, but can be naturally adaptedto other disease that are triggered by a imbalance between the two protective properties of theepithelium: immune responses and permeability barrier function.Second, we want to show how we can achieve a quantitative, not only a qualitative under-standing of epithelial function, using our proposed modelling framework. The interactionsbetween single-layered epithelial tissues (such as the airway epithelium), pathogens and neu-trophils have been extensively characterized in experimental settings. This enables us to fit ourmathematical model to empirical, quantitative data, and to make quantitative predictions.
8.2 Introduction
Steptococcus pneumoniae is a bacterium that normally resides in the upper airway epitheliumas a commensal organism without causing infection. However, circumstances such as colo-nization of the airway epithelium by other pathogens such as the influenza virus, can trigger ainfectious process that eventually can lead to severe disease [21]. In fact, most of the severecases of infection by Steptococcus pneumoniae occur as a consequence of a previous infectiousevent [69].Given the incipient problem of antibiotic resistance [23], it is necessary to devise new therapeu-tic strategies that minimize the use of antibiotics. Preventing a infection that requires extensive
121

use of antibiotics could be achieved by intervening the early stages of the infectious processes,namely the colonization or the upper airway epithelium by Steptococcus pneumoniae. Thisrequires a mechanistic and quantitative understanding on how co-infection impairs the host-pathogen interactions between the upper airway epithelium and Steptococcus pneumoniae.
Co-infection can drive the infectious process by Steptococcus pneumoniae by different mech-anisms, including the reduction in the immune responses [78], impairment of epithelial barrierfunction, and the increase in bacterial carrying capacity [69].It is however still not clear how exactly these effects result in a loss of epithelial function thatcan lead to super-infection by the second pathogen (Steptococcus pneumoniae). Further, differ-ent pathogenic mechanisms might appear as different disease phenotypes that require specificpharmacological treatment. Clarifying the relation between disease mechanism and phenotypeis important to devise adequate treatments that are specifically tailored to the patient-specificmechanism of infection. Here, we ask whether the different perturbations inflicted to the ep-ithelium can be mapped to specific phenotypes.To answer this question, a quantitative and mechanistic understanding of the host-pathogen in-teractions that occur between the airway epithelium and Steptococcus pneumoniae is necessaryto systematically assess how different disturbances elicited by previous infectious events con-tribute to the development of super-infection.Invasion of the bloodstream by Steptococcus pneumoniae is prevented by the airway epitheliumby the combined effect of its two protective properties: A barrier function that physically hin-ders bacterial invasion, and immune responses that decrease the pathogen load by phagocytingand killing the bacterium.Interestingly, these two protective properties inhibit each other. A competent barrier restrictsnot only the invasion of inhaled bacteria into the bloodstream, but also the transmigration ofcomponents of the immune systems (neutrophils) from the bloodstream to the epithelial tissuewhere bacteria reside. Further, immune responses elicited by transmigrating neutrophils arerequired for control of pathogen load, but also lead to barrier damage (figure 8.1 A).Clarification of the relation between the pathogenic processes and the resulting disease pheno-types requires a quantitative systems-level view, that considers the complex interplay betweenbarrier function, immune responses and pathogen (figure 8.1 B) load that must be balanced tomaintain a healthy, non infected epithelium.Here, we propose a quantitative systems level view of host-pathogen interactions betweenStreptococcus pneumoniae and the airway epithelium in the form of a mathematical modelthat considers all the relevant regulatory connections between the bacterium and the host.The model builds on previous models of pneumococcal infection [91, 92, 93, 94], and consid-ers, for the first time, the role of the epithelial barrier in mediating the infectious process, as
122

well as the complex interplay between barrier function and immune responses (figure 8.1 C).We obtained the parameter values of the model by fitting the model to quantitative and dynamicexperimental data (appendix B), and used the resulting calibrated model to assess the differentpathogenic mechanisms.Then, we analysed the different qualitative dynamic behaviours, corresponding to differentialphenotypes, that can be displayed by the mathematical model.Finally, we simulated the disturbances that the first pathogen (influenza) causes to the reactionnetwork, and grouped the resulting dynamic behaviours into the different disease phenotypes.Our preliminary results suggest that co-infection can trigger loss of epithelial homeostasis byat least four qualitatively different mechanisms that appear as four distinguishable phenotypes:(1) Increased carrying capacity leads to sepsis, but the epithelial barrier function remains in-tact (figure 8.11). (2) A strong decrease in barrier function is associated to a high immunecell infiltration and further barrier damage, but no infection (figure 8.12). The same qualitativebehaviour is observed if immune cell infiltration is increased (figure 8.13, red trajectories). (3)Weakened strength in immune reactions lead to recurrent, low level flares of infection (figure8.13, blue trajectories), and (4) Receptor desensitization leads to sepsis, but no associated bar-rier damage nor increased immune responses (figure 8.14).This work contributes to understanding of the mechanisms and resulting disease phenotypesthat are driven by Streptococcus pneumoniae, a bacterium that is normally a non-harmful com-mensal resident of the upper airway epithelium. It constitutes a first step towards devising bettertreatments that minimize the use of antibiotics.
8.2.1 Previous mathematical models of host-pathogen interactions thatoccur at epithelial tissues
This section reviews the mathematical models of the host-pathogen interactions that occur be-tween different pathogens (including Steptococcus pneumoniae) and epithelial tissues (includ-ing airway epithelium).
Mathematical models of the interplay between immune responses and pathogens that donot consider epithelium function
There are numerous mathematical models on host-pathogen interactions. However, most ofthese focus on the immune responses, neglecting the role of the epithelium. For example,[268] propose a mathematical model of the interplay between HIV and immune cells, and themodel of [100] examines the infection of mammary glands by E coli. The interplay betweenthe bacterium Helicobacter pylori and immune response is explored in the model proposedin [101], that considers a dual effect of immune responses on infectious outcome: immune
123

responses not only eradicate the pathogen, but also trigger inflammation that rise the bacterialcarrying capacity, by increasing the amount of nutrients that results from tissue damage. Thisdual effect was explored in a more abstract framework (i.e. not specific for a system) in [102],leading the authors to derive conditions that underlie two lethal forms of disease outcome of thehost response to pathogen: septic (infected) or aseptic (uninfected, but chronically inflamed)death. In the model proposed in [103], the general mechanisms of interaction between innateimmune responses and pathogens are systematically explored, to identify the conditions thattrigger a persistent (pathological) vs a transient infection.
Mathematical models of viral infection of epithelial tissues consider the interplay betweenimmune responses, viral load and epithelium-mediated viral replication
Host-pathogen interactions between virus and epithelial tissues are characterized by a dual roleof the epithelial tissue. Epithelial cells form the basis for viral replication, but also enact abarrier that hinders the penetration of the virus into the bloodstream. This protective functionof the epithelium mediates the between-host dynamics of the virus (eg. sexual transmission ofHIV, which depends on the passage of the virus between cervix and bloodstream) [5], but thusfar, has not be taken into account in mathematical models. Further, the clearance of viral in-fection by immune cells requires the killing of infected epithelial cells, resulting in significanttissue damage. Hence, a mathematical model that considers this complex interplay betweenbarrier function, immune responses and pathogen load could be particularly relevant to under-stand the mechanisms of viral infection.Thus far, the mathematical models of viral infection only consider the role of the epithelial cellsin mediating viral replication, but not its barrier function. For example, using a system of ODErepresenting the interactions between Influenza A virus, epithelial cells and immune cells, themodel in [104] explores the effects of initial viral load on the dynamic outcome of infection.Although the authors model the damaging effects of immune system on barrier function, theprotective effects of epithelial tissue are not taken into consideration.The mathematical model proposed in [106] analyses the different outcomes of Epstein Barrvirus infection, considering that the virus can infect both immune cells (B cells) and epithelialcells. It uncovers the optimal strategies for the virus that maximise viral load and the proba-bility of transmission to another host. This mathematical model considers both immune andepithelial cells, but the role of the epithelium is restricted to functioning as a substrate for viralreplication, neglecting the barrier function.The experimentally calibrated model of [105] quantitatively characterizes the dynamics of in-fluenza A virus infection. The model considers the interplay between epithelial cells, virusand immune cells. In the model, the main role of the epithelial cells is as a substrate for viralreplication, but the permeability barrier function is not considered.
124

Mathematical models of infection by Steptococcus pneumoniae
The first mathematical model of infection by Steptococcus pneumoniae was proposed in [91].It focuses on the interplay between the pathogen and the immune response mediators. The ep-ithelium is considered dynamically, but without having a regulatory effect neither on bacterialpopulation, nor on the immune response. In their model, the role of the epithelium is restrictedto mediating the immune responses triggered by bacteria (cytokine production is assumed to beproportional to epithelium that is associated to bacteria). It is further assumed that damage ofepithelial cells, caused by immune responses, contribute to the debris production that positivelycontributes to the bacterial load by increasing the bacterial carrying capacity (as in [101]). Theregulatory role of epithelium in mediating both the bacterial invasion and the immune responseswas not assessed in this model.Originally, the model proposed in [91] was used to assess the role of initial bacterial load oninfectious outcome, but was expanded in [94] and [92] to study co-infection with influenza.The viral load was modelled dynamically, but, once again, the dual role of the epithelial barrierwere not considered. The authors used the mathematical model to explore two mechanisms bywhich co-infection can drive pathogenicity of the commensal bacterium Steptococcus pneumo-
niae: (1) Increase in carrying capacity and (2) decreased phagocytosis of bacteria by immunecells.A similar mathematical model, proposed in [94] and also based on [91], explores the effect ofthe time and size of inoculation with the first pathogen on the outcome of the host-pathogeninteractions.The model proposed in [93] considers for the first time the role of the epithelial barrier in me-diating pneumococcal infection. It distinguishes two sub-populations of bacteria (but not ofimmune cells), separated by the airway epithelium. They use the model to assess the effectsof variations between strains on the outcome of infection, represented in the model as differ-ences in the strength of the immune mechanisms elicited by the host, on the outcome of theinfection (clearance or sepsis). However, their model does not consider the interplay betweenbarrier function and immune responses, given by the tissue damaging effects of infiltratingneutrophils and by the effect of the barrier in mediating the immune responses. Given that thetissue-damaging effects of neutrophil transmigration are responsible for a major component ofthe pathology of infection [31, 30], we believe that they are fundamental to consider in a modelthat is constructed to understand how loss of epithelial homeostasis results from impaired host-pathogen interactions.Here, we build on the mathematical model of the host-pathogen interactions between Stepto-
coccus pneumoniae and the airway epithelium proposed in [91, 94]. Specifically, our modelfocuses on the complex interplay between barrier function and immune responses. We follow[93] in considering apical and basal populations of bacteria, to explicitly consider the regula-
125

tory effect of the epithelial barrier in mediating the invasion of bacteria to the bloodstream. Wefurther add apical and basal sub-populations of neutrophils, to explore the dual interplay be-tween barrier function and neutrophil transmigration. Particularly, we use the model to clarifythe different mechanism that drive the ”lethal synergism” [69] that results from super-infectionwith a virus (typically influenza) and Steptococcus pneumoniae.
8.2.2 Novelty and timeliness of our approach
To our knowledge, this is the first mathematical model of the host-pathogen interactions be-tween Streptococcus pneumoniae and the upper airway epithelium that focuses on the dynamicinterplay between the epithelium barrier function and the immune responses.Super-infection by Streptococcus pneumoniae arises from a loss of balance in the relation be-tween pathogen load, barrier function and immune responses. Hence, a quantitative frameworkthat explicitly considers the regulatory roles of barrier function and immune responses is nec-essary to clarify the mechanisms responsible for the loss of epithelial homeostasis that resultsfrom co-infection.
8.2.3 Aims and objectives
With our proposed mathematical model of the host-pathogen interactions between Streptococ-
cus pneumoniae and the airway epithelium, we aim to:
• Increase our understanding on role of individual components on mediating the host re-sponse.
• Integrate and analyse scattered experimental data into a coherent quantitative frameworkto reconcile quantitative but partial in vitro with complete but qualitative in vivo datasets.
• Propose a calibrated, data-driven mathematical model of epithelium function that can beused to drive quantitative, and not only qualitative predictions.
• Generalize and extrapolate previous modelling results on epidermal homeostasis to a dif-ferent epithelial system, to understand the emergence of another disease that is associatedto loss of epithelial function.
• Clarify the different mechanisms that underlie lethal synergism between Streptococcus
pneumoniae and another pathogen. This is the first step to devise novel treatment strate-gies that minimize the use of antibiotics.
126

• Minimize costly animal studies that are required for a systems-level analysis of the host-pathogens by informing the experimental design with predictions derived from in silico
simulations.
(C)
Blood vessel
Pathogen
Inhalation
Invasion Recognition
Immuneresponse
Barrier
Transmigration
Neutrophil
Eradication
Recruitment
(B)(A)
TLR signalling
Immune response
Barrier function
Pathogen
Pathogen
apical
basal
TLR2(1)
(1) (2)
(2)
(3)
(3)
(4)(4)
(5)
(5)
(6)
(6)
Figure 8.1: Duality of the host-pathogen interactions between Streptococcus pneumoniaeand the airway epithelium Cartoon (A) and regulatory structure representation (B) of the
host-pathogen interactions between Streptococcus pneumoniae and the airway epithelium.
Upon inhalation, the pathogen Streptococcus pneumoniae comes in contact with the apical sideof the upper airway epithelium. (1) A competent barrier hinders the infiltration of the pathogento the basal aspect of the epithelium, preventing systemic infection (colonization of the bloodvessel). Recognition of the pathogen by innate immune receptors (such as TLR) located on theapical side of the epithelial cell triggers (2) weakening of the barrier function and (3) immuneresponses in the form of neutrophil recruitment. A weaker barrier leads to the invasion of thepathogen to the basal side of the epithelium. (4) Neutrophils diminish the pathogen load byphagocytosis. To attack the apically located pathogens, neutrophils must transmigrate from thebasal to the apical side of the epithelium, a process that requires barrier opening (5) and thatfurther damages the barrier (6). (C) The contact of the pathogen with epithelial cells triggertwo opposing effects: diminishing barrier function increases, and immune responses reducepathogen load, representing a dual host response.
127

8.3 The host-pathogen interactions that occur between Strep-tococcus pneumoniae and the upper airway epithelium
The airway epithelium consists of a single layer of polarized epithelial cells with a apical sidethat is exposed to inhaled pathogens, dust and other environmental components, and a basal
side that faces the bloodstream. Passage of inhaled environmental insults from the apical to thebasal side is restricted by inter-cellular junctions between the epithelial cells, that collectivelydetermine the permeability barrier function of the epithelial tissue. Of particular relevanceare the Tight Junctions (TJ), which are composed by claudin [38] and occludin [26], amongother structural proteins [10]. In vitro barrier function of epithelial monolayers is commonlymeasured by Trans-Epithelial Electrical Resistance (TEER).Under healthy conditions, a competent epithelial function restricts the location of Streptococcus
pneumoniae to the apical side of the mucosa, where it resides as a non-pathogenic, commensalbacterium. Weak barrier function caused by barrier opening facilitates the invasion of bacteriafrom the apical to the basal side of the epithelium [68]. This is the first step in the infectiousprocess. Contact of bacteria with the apical side of the epithelium can lead to a decrease inthe barrier function, facilitating bacterial invasion [85, 68]. This tissue-level effect of bacterialcontact with epithelial cells is triggered by the activation of TLR signalling by Streptococcus
pneumoniae. Activation of TLR signalling increases expression of SNAIL1, a transcriptionalrepressor which inhibits the expression of the TJ component claudin, effectively leading to adecrease in permeability barrier function of the airway epithelium [38]. Also, the activation ofhost signalling cascades by the pathogen triggers the activation of proteases that reduce barrierfunction [269, 270, 271, 272].Activation of TLR signalling by apically located bacteria also triggers immune responses inthe form of neutrophil recruitment [273], via the NFκB-mediated release of IL-17 [231] thatactivates neutrophil -attracting interleukins IL-8 [274].Neutrophils phagocytose the bacteria they encounter, contributing to the control the bacterialload in the mucosa [88, 89].Effective immune responses require neutrophils to transmigrate from the basal to the apical sideof the epithelium, a process that is restricted by the barrier function and requires the presence ofapically located bacteria to guide the neutrophil movement (”chemeotaxis”) [86]. Neutrophiltransmigration also causes reduction of permeability barrier function [30, 86, 87] through arelease of barrier -degrading proteases that are released by transmigrating neutrophils [71].
128

TLR2
SNAIL
IL8
Phagocytosis
Chemeotaxis
Ca++
Extravasation
ProteasesTransmigration
Nb
NaSa
Sb
B
Nv
s
ss
Blood vessel
(A)
Invasion
(B)
Apical
Basal
S. pneumoniae (apical)
S. pneumoniae (basal)
Barrier
Neutrophils (blood vessel)
Neutrophils (apical)
Neutrophils (basal)1
1
2
23
3 44
5
5
66
77
Figure 8.2: Cartoon (A) and reaction network (B) of the host-pathogen interactions thatoccur between Streptococcus pneumoniae and the upper airway epithelium Apically lo-cated Streptococcus pneumoniae (Sa) activate TLR pathway signalling, leading to (1) neu-trophil recruitment from the blood vessel (Nv) but also to (2) a down-regulation of Barrierfunction (B). Competent barrier hinders (3) the invasion of bacteria to the basal side of theepithelium, but also (4) the transmigration of Neutrophils from the basal (Nb) to the apical(Na) compartment. (5) Transmigrating neutrophils reduce barrier function via the release ofbarrier-degrading proteases. Upon contact with Streptococcus pneumoniae, neutrophils phago-cyte bacteria, both in the (6) apical and on the basal (7) side of the epithelium.
129

8.4 Mathematical model of host-pathogen interactions to un-derstand the dual role of the epithelial barrier in deter-mining the outcome of infectious processes
We represent the reaction network underlying the host-pathogen interactions between Strepto-
coccus pneumoniae and the upper airway epithelium by the system of equations 8.1.
dSa(t)dt
=
[κS
(1− Sa(t)
µS
)− κsi
εSB(t)+1−φNSNa(t)
]Sa(t), (8.1a)
dSb(t)dt
=κsi
εSB(t)+1Sa(t)+
[κS
(1− Sb(t)
µS
)−φNSNb(t)
]Sb(t), (8.1b)
dNa(t)dt
=θnt
εNB(t)+1Sa(t)Nb(t)−κNdNa(t), (8.1c)
dNb(t)dt
= θSanrNvF(Sa(t))−[
θnt
εNB(t)+1Sa(t)+κNd
]Nb(t)+β, (8.1d)
dB(t)dt
=κbp(1−B(t))
1+λSabpF(Sa(t))− [θSabdF(Sa(t))+φNbbdF(Nb(t))]B(t), (8.1e)
F(X(t)) =X(t)nH
X(t)nH +KnHM
(Switch function), (8.1f)
where Sa(t) and Sb(t) represent the concentrations of apically and basally located bacteria,respectively, and are given in units of Colony-Forming Units (CFU) ×105/ml, B(t) representsthe dimensionless barrier function, and Na(t) and Nb(t) are the concentrations of apically andbasally located neutrophils, respectively, given in units of [cells ×105/ml].The translation of the kinetic interactions between these species represented in the reactionnetwork 8.2 B to the system of ODEs in 8.1 was done by using the Law of Mass Action(methodology described in section A).In addition, our model has the assumptions detailed in the next section.
8.4.1 Model assumptions
Distinction between apical and basal sub-populations of bacteria and neutrophils
In our model, we distinguish between apical and basal sub-populations of bacteria and neu-trophils to explore the role of the epithelial barrier in modulating the invasion of bacteria andthe transmigration of neutrophils.Accordingly, we follow up on the model proposed in [93], which distinguished between apicaland basal sub-populations of bacteria, and add, for the first time, the distinction between apical
130
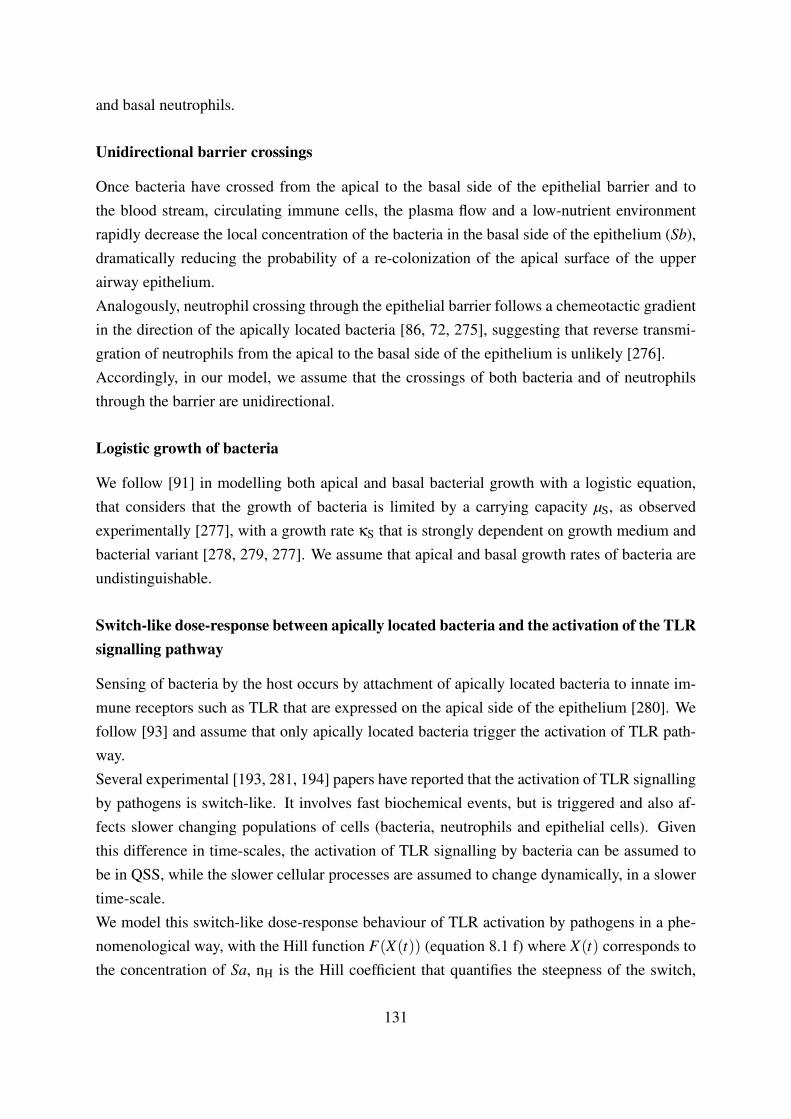
and basal neutrophils.
Unidirectional barrier crossings
Once bacteria have crossed from the apical to the basal side of the epithelial barrier and tothe blood stream, circulating immune cells, the plasma flow and a low-nutrient environmentrapidly decrease the local concentration of the bacteria in the basal side of the epithelium (Sb),dramatically reducing the probability of a re-colonization of the apical surface of the upperairway epithelium.Analogously, neutrophil crossing through the epithelial barrier follows a chemeotactic gradientin the direction of the apically located bacteria [86, 72, 275], suggesting that reverse transmi-gration of neutrophils from the apical to the basal side of the epithelium is unlikely [276].Accordingly, in our model, we assume that the crossings of both bacteria and of neutrophilsthrough the barrier are unidirectional.
Logistic growth of bacteria
We follow [91] in modelling both apical and basal bacterial growth with a logistic equation,that considers that the growth of bacteria is limited by a carrying capacity µS, as observedexperimentally [277], with a growth rate κS that is strongly dependent on growth medium andbacterial variant [278, 279, 277]. We assume that apical and basal growth rates of bacteria areundistinguishable.
Switch-like dose-response between apically located bacteria and the activation of the TLRsignalling pathway
Sensing of bacteria by the host occurs by attachment of apically located bacteria to innate im-mune receptors such as TLR that are expressed on the apical side of the epithelium [280]. Wefollow [93] and assume that only apically located bacteria trigger the activation of TLR path-way.Several experimental [193, 281, 194] papers have reported that the activation of TLR signallingby pathogens is switch-like. It involves fast biochemical events, but is triggered and also af-fects slower changing populations of cells (bacteria, neutrophils and epithelial cells). Giventhis difference in time-scales, the activation of TLR signalling by bacteria can be assumed tobe in QSS, while the slower cellular processes are assumed to change dynamically, in a slowertime-scale.We model this switch-like dose-response behaviour of TLR activation by pathogens in a phe-nomenological way, with the Hill function F(X(t)) (equation 8.1 f) where X(t) corresponds tothe concentration of Sa, nH is the Hill coefficient that quantifies the steepness of the switch,
131

and KM is the concentration of bacteria at half maximal activity of TLR signalling. The func-tion F(X(t)) describes the QSS concentration of biochemical effectors that are induced by theactive TLR pathway (for example, snail1 [38]).The importance of a switch-like dose-response behaviour in mediating the immune responseshas been discussed in section 3.2. In the case of the host-pathogen interactions between theairway epithelium and Streptococcus pneumoniae, a switch-like dose-response behaviour isparticularly relevant, since Streptococcus pneumoniae normally resides on the airway epithe-lium as a commensal bacteria that does not trigger any immune responses.In our model, TLR activity mediates both the immune responses (in the form of neutrophil re-cruitment) as well as the barrier damage (in the form of down-regulation of barrier productionrate). Note that the model of [93] also assumes this dual effect of apically located bacteria, butwithout considering the switch-like dose-response behaviour of these rates. This is because themodel of [93] focuses on the bronchial epithelium, that under healthy conditions does not haveany resident S. pneumoniae. In contrast, we want to understand the host responses that occur inthe upper airway epithelium, where S. pneumoniae normally resides as commensal bacterium.
No de novo production of neutrophils
We assume that neutrophils do not divide in the epithelial tissue, since it has been observed thatde novo production of neutrophils does not occur outside the bone marrow [282]. Accordingly,in our model, apically and basally located neutrophils are subjected to death rate κNd, but notto a proliferation rate.
Self-recovery of the barrier function upon perturbation
It has been consistently observed that epithelial monolayers [28, 283, 284] follow self-recoveringdynamics upon perturbation.We model this self-recovery in a phenomenological way (see section 3.3), with a first orderlogistic equation that has a nominal barrier production rate κbp.The inhibition of barrier production by apically located bacteria was modelled in a phenomeno-logical manner (see appendix A), by dividing κbp by the term 1+λSabpF(Sa(t)), where F(Sa(t))
is the Hill function that describes the switch-like activation of TLR signalling by bacteria, andλSabp quantifies the inhibitory effect of TLR activation on barrier function.
Phagocytosis of bacteria by neutrophils
Upon contact with neutrophils, bacteria are eliminated with a rate φNS [88, 89]. We assume thatthis killing rate are not dependent on the location of the interaction (no distinction between basal
132

and apical killing rates). This pathogen elimination rate by neutrophils was also considered inthe model of [91].
Switch-like barrier degradation by neutrophils
Barrier degradation by neutrophils occurs in a switch-like manner [87]. It is mediated by therelease of proteases, corresponding to a fast biochemical process that can be approximated bythe Hill function F(X(t)), where X(t) corresponds to the concentration of Nb, and F(X(t)) isthe resulting steady state concentration of barrier-damaging proteases.
8.4.2 Network motif representation
We identified three key regulatory modules in the reaction network controlling the host-pathogeninteractions described in figure 8.2 and represented accordingly in the systems of equations 8.1:
• Switch-like activation of immune responses and barrier damage.
• Self-recovering dynamics of barrier function.
• Persistence of immune cells in the airway epithelium even after ceasing of the cytokinelevels, resulting from the difference in time-scales between slow recruitment of neu-trophils by fast activating TLR signalling.
These regulatory modules correspond to the network motifs that also mediate epithelialfunction, described in chapter 3, suggesting that our modelling framework, based on modular-ization (switching, self-recovery and persistence modules) and time-scale separation (interplaybetween fast biochemical and slow cellular level processes), can be applied to model other ep-ithelial systems. The modular representation of the host-pathogen interactions are representedin figure 8.3.
8.4.3 Model parameters
All the the parameters of the model 8.1, except those involving the recruitment of neutrophilsfrom the bloodstream, were estimated by extensively fitting the model to quantitative and dy-namic experimental in vitro data that we gathered from the literature, as described in appendixB. The resulting set of nominal parameters is given in table 8.1.Given that to date there is no systems-level experimental characterization of the reaction net-work modelled in this chapter, the dataset used for the calibration of our mathematical modelwas gathered from many different data-sources, in which different types of system components
133

Neutrophil
PathogenInnate immuneresponse
TLRTJ
Proteases
Barrier function
Switch
Persistence
Recovery
Qualitative behaviours
Figure 8.3: Network motif representation of the mathematical model of the host-pathogeninteractions occurring between Streptococcus pneumoniae and the airway epithelium.Apically located pathogens lead to the activation of the TLR signalling pathway in a switch-likedose-response manner. Active TLR pathway triggers innate immune responses in the form ofneutrophil recruitment from the bloodstream to the site of infection. Neutrophils degrade thepathogen, but also damage the barrier via the switch-like induction of barrier-degrading pro-teases, and persist in the epithelium tissue even after the production of cytokines has ceased.In turn, competent barrier hinders the transmigration of neutrophils from the basal to the apicalside of the epithelium. Active TLR pathway also decreases the epithelial barrier function byinterfering with its production and degradation rates. Neutrophil recruitment is modelled by apersistence motif, to represent the difference in time-scales between this slower cellular processthat is triggered by a rise in TLR-induced cytokine levels. Barrier function, given by the amountof TJ, is modelled by a self-recovery motif. Both TJ and neutrophil concentrations reduce thepathogen load in the bloodstream by enacting the two protective properties of the epithelium:barrier function that prevents the invasion of bacteria to the bloodstream, and innate immuneresponses that eliminate the pathogen.
(eg. different epithelial tissues and bacterial strains) were empirically characterized under dif-ferent experimental conditions. This results in a very heterogeneous dataset, with a strongvariability between different measurements of the same process (see for example the differentself-recovering dynamical behaviours observed for different epithelial tissues in figure B.2, orthe different growth curves of Streptococcus pnueumoniae in different media, shown in figureB.3). Thus, although the parameter values presented in table 8.1 are biologically plausible,their exact values must be considered within a relatively large error margin that arises from thevariability in the experimental system and the experimental conditions.Hence, in addition to the determination of parameters (by optimization) presented in appendixB, it is necessary to further explore the effects of parameter variations on the system’s be-haviour. This is done in this chapter in section 8.6, and could be further complemented by asensitivity analysis.
134

The parameters that quantify the basal (β) and TLR-dependent (θSanrNv) rates of infiltration ofthe neutrophils from the blood can be estimated only from in vivo datasets that represent ratherqualitative, but not quantitative dynamical behaviours of bacteria and neutrophils.To obtain a rough estimate for these values, we adjusted our model simulations, by manuallytuning the values for β and θSanrNv, to qualitatively reproduce the dynamics of a in vivo dataset.Particularly, we used the in vivo data from [231]. It shows the the dynamics of the concentra-tions of apical bacteria Sa(t) and neutrophils and macrophages, obtained from the analysis ofthe Broncheoalveolar Lavage Fluid (BALF) of mice that were colonized with Streptococcus
pneumoniae (by direct instillation of the bacteria into the nares of the mice). These experi-ments were done for wild type (wt) and TLR mutant mice (T LR2−/−).Both neutrophils and macrophages are represented in our model by the variable Na(t), thatrepresents all the innate immune responses to the pathogen. We assume that our variableNa(t) corresponds to the sum of the experimentally measured concentrations of neutrophilsand macrophages.To integrate the different in vitro in vivo datasets into a coherent and quantitative framework,we converted the in vitro experimental measurements -usually given in number of cells for neu-trophils and CFUs for bacteria- to concentrations. This allowed us to directly compare the in
vitro data to in vivo data, since the measurements of apical and basal neutrophils and bacteriain a mouse are usually accompanied with measurements of the volume of the solutions thatcontain neutrophils and bacteria (BALF and serum).In addition to obtaining a first estimate for β and θSanrNv, we also used this dataset to obtain asecond value for the bacterial carrying capacity µs. As shown in section B, the value for µs canbe estimated from in vitro data. However, we consider that in vitro estimates for the values ofµs greatly over-estimate the in vivo conditions. Therefore, by comparing the model simulationswith the in vitro data from [231], we roughly estimated a second, in vivo value for µs (table8.1).We acknowledge that the resulting parameter values for β, θSanrNv and µs are not accurate, andare used only as a starting point for the model simulations.As shown in figure 8.4, simulations of our mathematical model (system of equations 8.1), us-ing the nominal parameter set shown in table 8.1, show a qualitative agreement with the in vivo
data from [231]. Both model simulations and the experimental data show that wt and also TLR2
mutant mice effectively clear the infection, decreasing the pathogen load to a low, non-virulentvalue. This clearance occurs already within the first day post-infection for the wt mice, and isdelayed in the TLR2 mutant mice, as shown both by the experimental data and by the modelsimulations. Despite this qualitative agreement, the simulation results from our mathematicalmodel do not agree quantitatively with the experimental data. Likely, this mismatch can beattributed to the fact that some of the processes that are involved in vivo in the bacterial clear-
135

ance are not considered in our simplified in vitro model. For example, the recruitment of otherimmune cells, such as macrophages, also play a important role in decreasing the pathogen load[231], but are not considered in our model.
The experimental results from [231] suggests that neither TLR-mediated immune responsesnor TLR-mediated barrier damage play a major role in the determination of the pathogen load,since both the wt and the TLR mutant mice show a rapid clearance of the bacterial load.These qualitative dynamics are also reflected in the model simulations of the wt and the TLR
mutant. The initial high pathogen concentration Sa(0) is rapidly decreased, for both of thesevirtual genetic conditions.In our simulations, the concentration of Sa(t) in the wt decreases quicker that in the TLR mu-
tant, however, no experimental information is available for the fist hours of the host-pathogeninteraction, when presumably these TLR-dependent immune responses occur.Two possible mechanisms that could explain this TLR-independent control of the pathogenload are either a low bacterial carrying capacity (µs), or strong resident immune responses (rep-resented in our model by the parameter β). Both correspond to basal, unstimulated conditionsof the host that effectively controls pathogen load.In the following section, we explore the consequences of changing these and other parameterson the model behaviours. To do so, we first present the possible dynamic behaviours that themodel 8.1 can exhibit, and assess then the impact of parameters including µs and β that areaffected by a previous episode of infection of the host.The main aim of this analysis, that uses our quantitative mathematical model that his parametrizedwith in vitro experimental data and qualitatively reproduces in vitro data, is to help clarifyingthe mechanisms of co-infection. More generally, it will also serve as a tool for the analysis ofthe systems-level, but costly, inaccurate and incomplete in vivo datasets.The qualitative agreement between our model simulations and in vivo experimental data from[231] (figure 8.4) is a first indication of the validity of our data-driven model. Further compar-isons between our mathematical model simulations and other in vivo datasets will be performedin the future.
8.5 Qualitative dynamical behaviours
Healthy host-pathogen interactions, i.e. epithelial homeostasis, is defined by following condi-tions:
• A competent, undamaged barrier (”high permeability barrier function”).
136

Table 8.1: Parameters of the mucosal barrier model
Symbol Name Nominal value Reference UnitsSystem independent parameters: Natural production and decay rates
κbp Barrier production 0.45 [87] h−1
κs Bacterial proliferation 0.45 [279] h−1
µs Bacterial carrying capacity (invitro)
< 0.5×10⁴ Dr Tom Clarke,personal commu-nication
CFU×105
ml
” (in vivo) 180 Arbitrary CFU×105
mlκnd Neutrophil death 0.0831 [282] h−1
Switch parameters: TLR activationkm Threshold of TLR2 activation by Sa 120 [285] CFU×105
mlnh Hill coefficient of TLR-activation 5.75 [285] dimensionless
Bacteria - neutrophil interactionsφNS Neutrophil-induced death of Bacte-
ria0.0019 [89] [h105×cells
ml ]−1
Bacteria - barrier interactions: Barrier damage by bacteriaλSaBp Active TLR on barrier production 0.18 [85] dimensionlessθsabd Active TLR-induced proteases on
barrier degradation0.8 [85] h−1
Bacteria - barrier interactions: Invasion of bacteria through barrierκsi Bacterial invasion through barrier 0.05 [270] h−1
ε Barrier-dependent inhibition ofbacterial invasion
1 [270] dimensionless
Neutophil barrier interactions (1): Barrier damage by neutrophilsφNbbd Neutrophil-induced barrier degra-
dation3.2 [86] h−1
KMN Concentration of the basal neu-trophils at half maximal barrierdegradation rate
9 [86] [cells]×10−5
h
nnH Hill coefficient of barrier degrada-tion by neutrophils
5 [86] dimensionless
Neutophil barrier interactions (2): Infiltration of neutrophils through barrierθnt Bacteria-induced neutrophil trans-
migration rate14 [71] CFU×10−5
h
εS Inhibition of neutrophil transmigra-tion by barrier
81 [71] dimensionless
In vivo parametersθSanrNv Bacteria-induced recruitment of
neutrophils from blood vessels100 Arbitrary CFU×10−5
h
β Basal neutrophil extravasation rate 2 [231] [cells]×10−5
h
137

Simulation×wt
Data×wt
0 1 3.5 5 70
20
40
60
80
Sa×
[CF
U×
105 /m
l]
t ime (days)
Simulation×TLR-/-
Data×TLR-/-
Figure 8.4: Comparison of model simulations with in vivo data Data-points reproduced from[231] (T LR2−/− data from figure 1, open circles, and and wt data from figure 6, closed circles).Simulations of model given by the system of equations 8.1, parametrized with the nominalparameter set shown in table 8.1. The in vivo parameters values are θSanrNv = 1000 β = 2 andµs = 120. The initial conditions are Sa(0) = Saexp(0) = 50[CFU×105
ml ], Sb(0) = Nb(0) = B(0) =0, and Na(0) = Naexp(0) = 0. We assumed that the simulated Na(t) is equivalent to the sum ofthe experimentally measured neutrophils and macrophages in [231].
• Low immune responses.
• No infection (” low pathogen load”).
To fulfil these conditions, it is necessary that, at steady state:
• The barrier is not damaged, neither by bacteria nor by neutrophils,
• the immune responses are not triggered by bacteria, and
• the bacterial load is maintained below its carrying capacity by the epithelial barrier andthe basal immune responses.
Violation of these conditions results in different forms of loss of epithelial homeostasis,resulting from excessive pathogen load, activation of immune responses, or barrier damage.To systematically characterize these different forms of loss of epidermal homeostasis, and howthey result in qualitative dynamical behaviours, we recall that, in our model, barrier damageis mediated by switch-like activation of TLR signalling by apical pathogens, and by switch-like release of proteases by basal neutrophils dependent decrease in barrier function (figures8.5 A,B).Assuming perfect switching behaviours (which corresponds to setting the Hill coefficient tobe infinitely large, i.e. nH → ∞, resulting in a Hill function F(X(t)) that resembles a perfect
138

step [286]), we can approximate the rates of Sa and Nb induced barrier degradation F(X(t))
in equation 8.1f by constant ”low” or ”high” rates of TLR or protease activities, dependingif the concentration of apical bacteria or basal neutrophils is below or above the thresholdconcentration Sa+ or Nb+, respectively. The threshold concentration Sa+ or Nb+ correspond tokm and Kmn, when nH → ∞ in F(Sa(t)) and F(Nb(t)), respectively. Formally, this correspondsto the Piece-Wise-Affine function (PWA):
limnH→∞
F(X(t))∼ F(x,x+,ylow,yhigh) =
ylow, if x≥ x+
yhigh, if x < x+,(8.2)
where x corresponds to Sa or Nb, x+ denotes the threshold values Sa+ or Nb+, respectively,ylow and yhigh are the ”low” and ”high” values of TLR and protease activity, and nH is the Hillcoefficient of the Hill equation F(X(t)) (see section 3.2.6 for details on this PWA approxima-tion).This simplifying assumption allows us to discretize the projection of the phase plane of theconcentrations of apically located pathogens and basally located neutrophils into four regions,corresponding to ”high” or ”low” concentrations of Sa and Nb, separated by the thresholds Sa+
and Nb+, respectively (figure 8.5 C).Epithelium homeostasis requires that the steady state values of Sa(t) and Nb(t) are below theirthreshold concentrations Sa+ and Nb+, at which bacteria and neutrophil dependent barrierdamage is negligibly low. This corresponds to the white the region of the phase plane projec-tion Sa×Nb depicted in figure 8.5 C and figure 8.6.Different forms of loss of epithelial homeostasis correspond to distinct trajectories on the re-gions of the phase plane projection Sa×Nb. Defining Sass and Nbss as the steady states of thevariables Sa(t) and Nb(t), respectively, we can distinguish following dynamical behaviours,which depend on the position of Sass and Nbss on the phase plane Sa×Nb [208], as follows:
• Convergence of apical bacteria and basal neutrophils towards the steady state concentra-tions Sass > Sa+ and Nbss < Nb+, respectively (figure 8.9 A). This appears as bacteria-induced barrier damage and high pathogen load (figure 8.9 B).
• Convergence of apical bacteria and basal neutrophils towards the steady state concentra-tions Nbss > Nb+ and Sass < Sa+, respectively (figure 8.8 A), resulting in neutrophil-induced barrier damage and high infiltration of immune cells (figure 8.8 B).
• Convergence of apical bacteria and basal neutrophils towards their ”high” steady stateconcentrations Nbss > Nb+, and Sass > Sa+ (figure 8.10 A). This condition is associ-ated to barrier damage, high infiltration of immune cells, and high pathogen load (figure8.10 B).
139

• Recurrent flares of barrier damage, pathogen invasion and high immune cell infiltration,depicted in figure 8.7 B, occur when the system of equations 8.1 has no global attractor(figure 8.7 A).
In the following sections, we present a systematic analysis of these different qualitative dy-namic behaviours.The possible qualitative behaviours of the PWA system, given by the approximation of equa-tions 8.1 by 8.2, can be analysed by assessing the position of its focal points in relation to thefour regions of the phase plane, depicted in figure 8.5 C.The focal points are the steady state values of the mathematically simpler sub-system of equa-tions resulting from setting F(Sa(t)) and F(Nb(t)) to a constant ”high” or ”low” value. Focalpoints are attractors of the whole system of equations only if all the trajectories (departing fromany of the four regions of the phase plane) converge to this focal point [208].In the following, we characterize each of the qualitative dynamic behaviours enlisted above.We follow [208] and present a mathematical analysis and simulations of the underlying, sim-plified PWA model, given by the step-like Hill function given by equations 8.2, and comparethese to simulations of the original, continuous model given by the system of equations 8.1. Inmost of the cases, the PWA approximation retrieves a similar qualitative dynamical behaviourthan the original, continuous model.
8.5.1 Epithelial homeostasis requires healthy clearance of a bacterial chal-lenge
To achieve epithelial homeostasis, the focal point of the sub-system of equations given byF(Sa)=”low” and F(Nb)=”low” must be a global attractor of the system. I.e., all the trajec-tories must converge into the region of the phase-plane given by Sa < Sa+ and Nb < Nb+.Particularly relevant is the trajectory followed after a initial bacterial challenge to the system,when Sa(0)> Sa+ (figure 8.6 A).A healthy clearance of this initial bacterial load is achieved by a transient TLR mediated induc-tion of immune responses leading to the increase of Nb (figure 8.6 B, left). The combination ofTLR activation and the resulting increase in neutrophil concentrations leads to a transient de-crease in barrier function (figure 8.6 B, center), which is restored again to a homeostatic valueonce the immune responses have cleared the infection (figure 8.6 B, center) and cease. Notethat the homeostatic barrier slightly deviates from its nominal value, because in the continuousversion of the model, barrier damage occurs even when Sa < Sa+ and Nb < Nb+. This is be-cause F(Sa) = low and F(Nb) = low are small, but not always equal to zero in the continuousversion of the model.If TLR-mediated immune responses are sufficient to clear the infection without surpassing the
140

2SaH.Pf5
Sa3
Nb3
BacteriaP2apical5
NeutrophilsP2basal5
TLR4dependentPbarrierPdamagePandPimmuneP
responses
Protease4ind
ucedPbarrierPdam
age
2A5PSwitch4likePbarrierPdamagePandPimmunePresponsesPinducedPbyPSa
2B5PSwitch4likePbarrierPdamagePbyPNb
EpithelialPhomeostasis
2C5PEpithelialPhomeostasisPisPdrivenPbyPaPtwoPdimensionalPswitch
2i5 2ii5
HighPTLR2Pactivity
2iii5
HighPproteasePactivity
2iv5
HighPproteasePandPTLR2Pactivities
5f 1ff 15f 2ff 25f 3ff 35f
f62
f64
f66
f68
1
162
Sa+
Sa[CF U ×105/ml]
Act
iveP
TLR
Ppa
thw
ay2f
oldP
incr
ease
PinPa
ctiv
ity5
f 5 1f 15 2f 25 3ff
f65
1
165
2
265
3
Nb+
Nb cells×
5
High
Low
] 105/ml]
Neu
trop
hil4d
epen
dent
Ppro
teas
esP
2fol
dPin
crea
sePin
Pact
ivity
5
Figure 8.5: Epithelial function is controlled by a two dimensional switch. [A] Barrier dam-age and induction of immune responses by bacteria are mediated by a switch-like activationof TLR signalling pathway by apically located bacteria (Sa). Only values above the thresh-old of activation Sa+ lead to a significant barrier damage and immune responses induced bybacteria. [B] Similarly, neutrophil dependent barrier damage is described by a switch that re-lates the basally located neutrophils (Nb) and the concentrations of barrier-damaging proteases.Only concentrations of Nb that are above threshold Nb+ trigger significant barrier damage.[C] Together, these two switches determine different regions of the phase plane projectionSa×Nb corresponding to (i) homeostatic epithelium (Sa < Sa+ and Nb < Nb+), (ii) TLR-dependent barrier damage and immune responses (Sa > Sa+ and Nb < Nb+), (iii) neutrophilprotease-dependent barrier damage (Sa < Sa+ and Nb > Nb+), or (iv) barrier damage and im-mune responses, induced by both bacteria-dependent TLR and neutrophil-dependent proteases(Sa > Sa+ and Nb > Nb+). Long term epithelium homeostasis, involving a competent barrierand resolution of the immune responses, requires thus that the steady state values of Sa and Nb
are confined to the (i) region of the phase plane, in which no barrier damage occurs.
threshold values Nb+, the transient barrier damage is lower (figure 8.6 B, center, blue line), butthe transient infection is higher (figure 8.6 B, right, blue lines), as compared to strong immuneresponses that transiently surpass the threshold Nb+ (red trajectories in figure 8.6).When the initial concentration of bacteria is low (Sa(0)< Sa+), the basal, unstimulated condi-tions of the host suffice to maintain the bacterial load below Sa+.
This homeostatic dynamical behaviour, characterized by a healthy clearance of the infec-tion, is consistent with the homeostatic behaviour observed in other mathematical models ofthe host-pathogen interactions between Streptococcus pneumoniae and the airway epithelium[94, 92, 93, 103].
141

Sa6
Nb6
Bacteriaf1apical2
Neutrophilsf1basal2
TLR,dependentfbarrierfdamagefandfimmunefresponses
Nb,inducedfbarrierf
Attractor Initialfcondition
1I2fImmunefresponses
1II2fPathogenfreduction
1III2fResolutionf
1A2fSchematicfrepresentationfofftheftrajectoriesfinfthefphasefplanefprojection
1B2fDynamicsfoffepitheliumffunction
timef1hours2
Nb6
Weakfinductionfoffimmunefresponses
ApicalBasal
BacteriafloadApicalBasal
Neutrophils
Strongfinductionfoffimmunefresponses
] w] .]] .w]]
z]
C]
F]
×]
.]]
Imm
une
fres
pons
ef1
Na8
fNb
[.]w fc
ells
/ml]2
] w] .]] .w]]
][z
][C
][F
][×
.
Bar
rierf
func
tion
1nor
mal
ize
d2
Strongfimmunefresponses:ffurtherfbarrierfdamage
timef1hours2
Transientfinfectionf
Sa6
Carryingfcapacity
LowerftransientfinfectionfbyfhighfimmunefresponsesIn
fect
ion
f1S
afan
dfS
b[C
FU
×.]
w /ml]
2
] w] .]] .w]]
z]
C]
F]
×]
.]]
timef1hours2
Transientfdamagefcausedfbyfbacteriaf
Nominalfbarrierffunction
Figure 8.6: Epithelial homeostasis requires healthy clearance of a bacterial challenge (A)Epithelial homeostasis requires that the global attractor of the system is such that Sass < Sa+
and Nbss < Nb+. Upon a pathogen challenge (Sa(0)> Sa+), a healthy clearance is character-ized by a transient induction of TLR-mediated immune responses (B, left), accompanied by atransient decrease in barrier function (B, center), and a transient infection (B, right). Increasein immune responses leads to reduction of bacterial load (Sa(t) < Sa+), followed by a resolu-tion of the immune responses, resulting in homeostasis after a transient loss of barrier functionand induction of immune responses. (B) shows the dynamics of epithelium, given by immuneresponses, barrier function and bacterial load. If the induction of immune responses are weak,i.e. such that Nb < Nb+∀t, then the barrier damage is caused only by the transient bacterialchallenge. Otherwise, infiltrating neutrophils lead to a further stronger, but equally transientreduction of barrier function.These results were obtained by simulating the continuous system of equations 8.1 with thenominal parameters given in table 8.1, except for β = 5 (high basal immune responses) andkMN = 18 (higher threshold for neutrophil activation, to compensate for higher β). High induc-tion of immune responses (red trajectories) were simulating by increasing θSanrNv from 100to 1000. The initial conditions are Sa(0) = Sa+ + 5, Sb(0) = Na(0) = 0, Nb(0) = 60, andB(0) = 1.
8.5.2 Recurrent flares of immune responses, barrier damage and infec-tion
Recurrent flares of barrier damage, immune responses and infection arise when none of thefocal points is a global attractor of the system (figure 8.7 A).In this scenario, a bacterial challenge Sa(0) > Sa+ results in a transient induction of immuneresponses and the associated decrease in barrier function described in section 8.5.1. However,once the bacterial infection has been cleared and the immune responses cease, the pathogenload increases again until Sa(t)> Sa+, initiating a new cycle of induction of immune responses(figure 8.7 B, left), decrease in barrier function (figure 8.7 B, center) and burst of infection (fig-ure 8.7 B, right).In the continuous version of the model, given by equations 8.1, these oscillations eventually
142

relax to a steady state value corresponding to moderate immune responses (figure 8.7 B, left),barrier damage (figure 8.7 B, center, blue line), and infection (figure 8.7 B, right).Only in the discrete version of the model (given by the PWA resulting from the approximationin 8.2), the oscillations persist with constant frequency and amplitude, because the binary func-tion F(X(t)) is not defined for the intermediate values towards which the continuous systemrelaxes (figure 8.7 B, center, red line) [208].These results suggest that TLR-mediated immune responses alone cannot account for long termepithelial homeostasis, because homeostasis requires that, at steady state, TLR signalling is in-active (i.e. Sass < Sa+, figure 8.5). If clearance of infection is solely dependent on TLR medi-ated immune responses, the resulting dynamic behaviour corresponds to the non-homeostatic,recurrent flares of immune responses, barrier damage and infection described in figure 8.7.However, besides TLR-dependent immune responses, bacterial clearance is mediated also bybasal levels of infiltration of immune cells, represented in the model by the parameter β. Res-ident immune cells can decrease Sass below Sa+, playing a pivotal role in determining thelong-term behaviour of the host-pathogen interactions.Understanding and preventing this cyclic behaviour that converges to a low level infectionis clinically relevant, since frequent events of bacterial infiltration into the bloodstream caneventually result in the leakage of a particularly aggressive, or antibiotic resistant bacterialvariant [279]. This relation between a sustained low level infection and the emergence of asub-population of antimicrobial resistant pathogens has been addressed in the stochastic modelof [287] for the host-pathogen interactions between E coli in the large intestine of cattle.
8.5.3 Aseptic loss of homeostasis is characterized by sustained high im-mune responses and barrier damage
Aseptic loss of homeostasis, characterized by sustained high immune responses and barrierdamage, occurs when the focal point associated to the sub-system of equations given by F(Sa)=”low”and F(Nb)=”high” is a global attractor of the system, i.e., all the trajectories converge into theregion of the phase-plane given by Sa < Sa+ and Nb > Nb+ (figure 8.8 A).In this scenario, a pathogenic challenge (given by Sa(0) > Sa+), leads to TLR-mediated in-duction of immune responses (figure 8.8 B, left) that eventually eradicate the pathogen (figure8.8 B, right). However, the barrier damage that results from high (Nb(t) > Nb+) immune re-sponses persists (figure 8.8 B, center), even after the infection has been cleared (Sa(t)< Sa+).This is because the basal, TLR-independent immune responses are high enough to surpass theNb+ threshold, even when Sa(t) < Sa+ (and hence, no TLR mediated immune responses areinduced).Hence, even in the absence of a pathogenic challenge, i.e. when Sa(0) < Sa+, the basal im-
143

Sa/
Nb/
Bacteria:1apical0
Neutrophils:1basal0
1IV0:Increase:in:bacterial:load
1B0:Dynamics:of:epithelium:function
Continuous:ODE::Damped:oscillations]:
Perfect:switch:Sustained:oscillations
1A0:Schematic:representation:of:the:trajectories:in:the:phase:plane:projection
Discrete:1PWA0
Continuous:1ODE0
Nominal:barrier:function
Sa/
ApicalBasal
Neutrophils
time:1hours0
Imm
une
:res
pons
e:1
Na]
:Nb
[32. :c
ells
×ml]0
Infe
ctio
n:1
Sa:
and
:Sb
[CF
U×
32. ×m
l]0
2 .2 322 3.22
32
42
62
z2
.2
82
2 .2 322 3.22
.2
322
3.2
422
4.2
Bar
rier
:1n
orm
aliz
ed0
2 .2 322 3.22
2U4
2Uz
2U8
2UR
3
time:1hours0time:1hours0
ApicalBasal
Bacteria:load
1I0:Immune:responses
1II0:Pathogen:reduction
1III0:Resolution:
Nb/
Figure 8.7: Recurrent flares of immune responses, barrier damage and infection [A] Cyclicloss of epithelial homeostasis and infection results from focal points being outside correspond-ing sub-domains of the Sa×Nb phase plane projection. A bacterial challenge (Sa(0) > Sa+)leads to onset of TLR-mediated immune responses which effective reduce the bacterial load.Decreasing Sa(t) below the threshold Sa+ of TLR activation leads to remission of the immuneresponses. In the absence of TLR-induced neutrophil recruitment, bacterial load increasesagain to Sa(t)> Sa+ and then Nb(t)> Nb+, resulting the cycles of infection and accompany-ing barrier damage. [B] The corresponding recurrence dynamics for barrier function, immuneresponses and infection. In the continuous version of the model, the oscillations are dampedand stabilize to a value corresponding to moderate immune responses, barrier damage andpathogen invasion.These results were obtained by simulating model 8.1 with the nominal parameter set given intable 8.1, except for θSanrNv = 1000, and θnt = 0.7. The initial conditions are Sa(0) = Sa++5,Sb(0) = Na(0) = 0, Nb(0) = 1, and B(0) = 1. For the discrete (PWA) approximation, we de-fined Sa+ = 0.5km and Nb+ = 0.5kmn. The resulting discrete trajectories are shown only forthe barrier function dynamics ([B], center, red curve). For the immune responses and pathogenload, only the continuous dynamics are displayed (red trajectories).
mune responses eventually surpass the threshold Nb+ (figure 8.8 A, pink arrow), resulting insustained barrier damage.This qualitative dynamic behaviour has been observed in previous mathematical models ofinfection [103, 102]. However, these models do not consider epithelial barrier function, andcould therefore not capture the long term tissue damage that results from persistent immuneresponses [31].
8.5.4 Sustained infection that fails to induce efficient immune responses
Sustained infection that fails to induce sufficiently strong immune responses occur when theglobal attractor of the system satisfies that Sass > Sa+ and Nbss < Nb+ (figure 8.9 A).Under these conditions, the immune responses induced by the high pathogen load (figure 8.9 B,left) are not strong enough to clear the pathogen (figure 8.9 B, right), resulting in a sustained
144

Sa]
Nb]
Bacteria0[apical^
Neutrophils0[basal^
Attractor
High0TLR×.independent0
immune0responses
Nb]
F jF UFFF
×F
DF
PF
8F
UFF
U×F
Imm
une
0res
pons
e0[
Naf
0Nb
[UF^
j0ce
llsCm
l]^
time0[hours^
Nominal0barrier0function
F jF UFFF
Fz×
FzD
FzP
Fz8
U
Bar
rier
0[n
orm
aliz
ed^
time0[hours^
Sa]
F jF UFFF
jF
UFF
UjF
×FF
Infe
ctio
n0[
Sa0
and
0Sb
[CF
U×
UFj Cm
l]^
Carrying0capacity
time0[hours^
[B^0Dynamics0of0epithelium0function[A^0Schematic0representation0of0the0trajectories0in0the0phase0plane0projection
ApicalBasal
NeutrophilsApicalBasal
Bacteria0load
[I^0Immune0responses
[II^0Pathogen0reduction
Figure 8.8: Aseptic loss of homeostasis is characterized by sustained high immune re-sponses and barrier damage Aseptic loss of homeostasis occurs when the global attractor ofthe system of equations 8.1 is such that Nbss > Nb+ and Sass > Sa+ ([A]), leading to persistenthigh immune responses ([B], left) that lead to chronic loss of barrier function ([B], center) andclearance of infection ([B], right).These results were obtained by simulating model 8.1 with the nominal parameter set given intable 8.1, with a high basal rate of immune cell infiltration (β = 10), and initial conditionsSa(0) = Sa++5, Sb(0) = Na(0) = 0, Nb(0) = 1, and B(0) = 1.
infection and TLR- mediated barrier damage (figure 8.9 B, center).
8.5.5 Total loss of homeostasis is characterized by high infiltration of im-mune cells, loss of barrier function, and sustained infection
Inefficient immune responses can drive the global attractor of the system to the region of thephase plane where Sass > Sa+ and Nbss > Nb+ (figure 8.10 A).Under these conditions, a initial bacterial challenge (Sa(0)< Sa+) triggers immune responses(figure 8.10 B, left) that fail to decease the bacterial load below the threshold value Sa+ (figure8.10 B, right), resulting in a sustained barrier damage elicited by both bacteria (because Sa(t)<
Sa+) and by neutrophils (Nb(t)< Nb+) (figure 8.10 B, center).
8.6 Uncovering the mechanisms that drive the lethal syner-gism that results from co-infection
Having described the different possible qualitative behaviours that the model can display (sec-tion 8.5), we explore in this section how co-infection can drive these qualitative changes in thedynamic behaviour of the host response to a pathogenic challenge.Infection by another pathogen, such as influenza, can drive a infectious process by the commen-sal bacterium Streptococcus pneumoniae by affecting following processes of the host-pathogeninteractions between Streptococcus pneumoniae and the upper airway epithelium:
145

Sa/
g Ug 4g 6g 8g Fggg
5g
Fgg
F5g
Ugg
U5g
g Ug 4g 6g 8g Fggg
Ug
4g
6g
8g
Fgg
FUg
F4g
F6g
F8g
Ugg
Sa/
Nb/
Bacteriam,apical[
Neutrophilsm,basal[
Attractor:mWeakmimmune
,A[mSchematicmrepresentationmofmthemtrajectoriesminmthemphasemplanemprojection
,B[mDynamicsmofmepitheliummfunction
timem,hours[
Nb/
ApicalBasal
Bacteriamload
ApicalBasal
Neutrophils
Imm
une
mres
pons
em,
Na]
mNb
[Fg^
5mce
llsCm
l][
g Ug 4g 6g 8g Fggg
gzU
gz4
gz6
gz8
F
Bar
rier
mfunc
tion
,nor
mal
ize
d[
timem,hours[
Carryingmcapacity
Infe
ctio
nm,
Sam
and
mSb
[CF
U×
Fg5 Cm
l][
timem,hours[
Nominalmbarriermfunction
Figure 8.9: Sustained infection that fails to induce efficient immune responses When theglobal attractor of the system satisfies Sass > Sa+ and Nbss < Nb+ [A], then the immune re-sponses induced by a pathogen challenge [B], left do not suffice to clear the pathogen loadbelow the threshold concentration Sa+ ([B], right, leading to a sustained infection [B], right
and a constant damage to the barrier induced by TLR-mediated immune responses [B], center.These results were obtained by simulating model 8.1 with the nominal parameter set given in ta-ble 8.1, with a high basal rate of immune cell infiltration (β = 10), a weak pathogen eradicationcapacity φNS = 0.001, and initial conditions Sa(0) = Sa++5, Sb(0) = Na(0) = 0, Nb(0) = 1,and B(0) = 1.
SaF
NbF
Bacteriam]apicald
Neutrophilsm]basald
Attractor
0 20 40 60 80 1000
20
40
60
80
100
120
140
160
180
200
0 20 40 60 80 1000
200
400
600
800
1000
1200
1400
0 20 40 60 80 1000
0z2
0z4
0z6
0z8
1
]BdmDynamicsmofmepitheliummfunction]AdmSchematicmrepresentationmofmthemtrajectoriesminmthemphasemplanemprojection
Nominalmbarriermfunction
SaF
ApicalBasal
Neutrophils
timem]hoursd
Imm
une
mres
pons
em]
NaU
mNb
[105 mc
ells
/ml]d
Infe
ctio
nm]
Sam
and
mSb
[CF
U×
105 /m
l]d
Bar
rier
m]n
orm
aliz
edd
timem]hoursdtimem]hoursd
ApicalBasal
Bacteriamload
NbF
Figure 8.10: Total loss of homeostasis is characterized by high infiltration of immune cells,loss of barrier function, and sustained infection When the global attractor of the systemis such that Sass > Sa+ and Nbss > Nb+ ([A]), immune responses elicited by a pathogenicchallenge remain high ([B], left), leading to a sustained barrier damage ([B], center) that isfurther accentuated by the high pathogen load ([B], left) that cannot be decreased by the highbut inefficient immune responses.These results were obtained by simulating model 8.1 with the nominal parameter set givenin table 8.1, with a weak pathogen eradication capacity (φNS = 0.005), high TLR-mediatedimmune responses (θSanrNv = 100000), a low threshold of neutrophil-induced barrier damage(kMN = 4.5) and a low basal rate of neutrophil infiltration (β = 1). The initial conditions areSa(0) = Sa++5, Sb(0) = Na(0) = 0, Nb(0) = 1, and B(0) = 1.
• Increase in the bacterial carrying capacity µs [69],
• increase in the epithelial permeability to both neutrophils and pathogens (φnt and κsi)
146

[69],
• increased load of resident neutrophils β [288, 69, 244], and
• desensitization of T LR receptor [78].
In the following, we will explore the effect of changing each of these model parameters onthe qualitative dynamical behaviour of the system.
8.6.1 Increase in the carrying capacity leads high invasion of bacteria,but no associated barrier damage
The exposure of the airway epithelium to a first pathogen can result in a significant increase inthe carrying capacity of Streptococcus pneumoniae as a result of the tissue-damaging immuneresponses that lead to an accumulation of debris [69].This increase in the bacterial carrying capacity as a result of tissue-damaging immune responseshas been modelled in [101, 91, 94, 104]. These models, however, do not explicitly consider theepithelial barrier function. Hence, they cannot be used to assess the potential impact of aincreased carrying capacity on the epithelial permeability barrier function and on the resultingrate of bacterial invasion.Numerical simulations of our model (figure 8.11) suggest that a increased carrying capacity µs
results in a significant increase in the concentration of infiltrated bacteria Sb, but, interestingly,does not trigger a significant increase in the steady state concentrations of Sass nor Nbss. Thus,µs does not seem to affect the position of the homeostatic global attractor of the system (givenby Sass < Sa+ and Nbss < Nb+, figure 8.11 A). In fact, increase in the carrying capacity µs
seems to affect only the magnitude of the transient increase in immune responses (figure 8.11 B,left), barrier function (figure 8.11 B, center) and apical pathogen load (figure 8.11 B, right). Theamount of bacteria that infiltrated to the bloodstream, however, suffers a considerable increases(figure 8.11 B, right, red dotted line).It is interesting to note that only the basal concentration of bacteria seems to be affected by aincrease in the carrying capacity. This suggests that the immune responses efficiently eradicatethe increased concentration of apically located bacteria resulting from a increased carryingcapacity, but fail to control the invading pathogen. Likely, this behaviour can be attributed tothe fact that, in our model, neutrophil transmigration form the basal to the apical side of theepithelial monolayer is Sa dependent. Hence, increased bacterial load on the apical side of theepithelium can be compensated by a increasing transmigration of neutrophils. In contrast, theconcentration of basal neutrophils that can eradicate the infiltrated bacteria (Sb) is not directlyaffected by the levels of Sb, resulting in a high concentration of basal bacteria that cannot becompensated by the neutrophils.
147

These results could have important clinical consequences, since they suggest that a high rateof bacterial invasion that can eventually lead to sepsis can occur even if the epithelium remainsintact, and the apical concentrations of bacteria (commonly measured in experimental settings,in the BALF) and the concentrations of immune cell infiltrates are low.
Sa6
Nb6
Bacteria12apical.
Neutrophils12basal.
2A.1Schematic1representation1of1the1trajectories1in1the1phase1plane1projection
2B.1Dynamics1of1epithelium1function
time12hours.
Nb6
ApicalBasal
Bacteria1loadApicalBasal
Neutrophils
Imm
une
1res
pons
e12
Na8
1Nb
[×U5 1c
ells
Fml].
Bar
rier1
func
tion
2nor
mal
ize
d.
time12hours.
Sa6
High1carrying1capacity
time12hours.
Nominal1barrier1function
U 5U ×UU ×5U LUUU
UCL
UC4
UC6
UC8
×
U 5U ×UU ×5U LUUU
5
×U
×5
LU
L5
wU
w5
4U
U 5U ×UU ×5U LUUU
5U
×UU
×5U
LUU
L5U
Infe
ctio
n12
Sa1
and
1Sb
[CF
U×
×U5 Fm
l].
Carrying1capacity
Low1carrying1capacity
Figure 8.11: Increase in the carrying capacity leads high invasion of bacteria, but no asso-ciated barrier damage A increased carrying capacity µs, resulting from a first infectious event,does not affect the relative position of the global attractor of the system in the Sa×Nb phaseplane projection [A]. It increases the amplitude of the transient induction of immune responses([B], left) and leads to a transient reduction in barrier function ([B], center). Importantly, itsignificantly affects the steady state concentrations of infiltrated bacteria ([B], left, red dotted
line).These results were obtained by simulating the continuous system of equations 8.1 with thenominal parameters given in table 8.1, except for kMN = 18,µs = 50 (homeostasis, black trajec-tories) or µs = 250 (sepsis, red trajectories). The initial conditions are given by Sa(0)= Sa++5,Sb(0) = Na(0) = 0, Nb(0) = 60, and B(0) = 1.
8.6.2 Decreased permeability barrier function leads to aseptic loss of home-ostasis
A first infectious event can lead to epithelium-damaging inflammation, resulting in a decreasedpermeability barrier function of the epithelial monolayer to both immune cells and pathogens[69].In our model, increased permeability of the epithelial monolayer can be represented by simul-taneously increasing the rates of neutrophil transmigration (φnt) and of bacterial invasion (κsi).As seen in figure 8.12, increased epithelial permeability can drive the system from a homeo-static state to an aseptic loss of homeostasis, characterized by a high degree of infiltration ofimmune cells to the apical side of the epithelial monolayer (figure 8.12 B, left) that results inpersistent barrier damage by these neutrophils (figure 8.12 B, center). The bacterial load, how-ever, is kept low by the increased immune responses, both in the basal and in the apical side ofthe epithelial monolayer (figure 8.12 B, right).
148

To our knowledge, this form of loss of epithelial homeostasis, driven by changes in the per-meability barrier function that result from a host response to a first pathogen, has not beenaddressed previously. This is because none of the existing mathematical models of the host-pathogen interactions between Streptococcus pneumoniae and the upper airway epithelium con-siders the simultaneous movement of immune cells and pathogens across the epithelial mono-layer that is responsible for the dynamic behaviour observed in figure 8.12.Our results suggest that strengthening the epithelial barrier after a first infectious event, forexample, by pharmacological increase in the concentration of calcium [289] or growth factors[290] on the basal side of the epithelial monolayer, can prevent a complete loss of barrier func-tion that results from the increased amount transmigrating neutrophils and that leads to a highinvasion of bacteria (Sb).
Per
mea
bilit
y
Control
Highpermeability
SaU
NbU
Bacteria]apicalz
Neutrophilsd]basalz
]AzdSchematicdrepresentationdofdthedtrajectoriesdindthedphasedplanedprojection
]BzdDynamicsdofdepitheliumdfunction
timed]hoursz
NbU ApicalBasal
Bacteriadload
ApicalBasal
Neutrophils
Imm
une
dres
pons
ed]
Na×
dNb
[.85 dc
ells
6ml]z
Bar
rierd
func
tion
]nor
mal
ize
dz
timed]hoursz
SaU
Carryingdcapacity
timed]hoursz
Nominaldbarrierdfunction
Infe
cti
on
d]S
ada
nd
dSb
[CF
U×
.85 6m
l]z
8 58 .88 .58 288 2588
28
48
68
88
.88
.28
8 58 .88 .58 288 2588
842
844
846
848
.
8 58 .88 .58 288 2588
5
.8
.5
28
25
Control
Highpermeability
Control
Highpermeability
Figure 8.12: Decreased permeability barrier function lead to an aseptic loss of homeostasisDecreased permeability barrier function shifts the global attractor of the system from a home-ostatic position on the Sa×Nb phase plane projection to a value such that Nb > Nb+ [A],resulting in a increased concentration of basal neutrophils ([B], left) that drive a persistent bar-rier damage ([B], center) but clear the invading pathogen ([B], right).These results were obtained by simulating the continuous system of equations 8.1 with thenominal parameters given in table 8.1, except for µs = 100 and the tuning parameters θnt = 14(control, black trajectories) or θnt = 140 (decreased permeability barrier function, red trajec-tories), and κsi = 0.05 (control, black trajectories) or κsi = 0.5 (decreased permeability bar-rier function, red trajectories), and initial conditions Sa(0) = Sa+ + 5, Sb(0) = Na(0) = 0,Nb(0) = 1, and B(0) = 1.
8.6.3 Increased levels of resident neutrophils leads to aseptic loss of ep-ithelial homeostasis
The host response the epithelium to a first infectious event results in a net increase in the totalamount of neutrophils, resulting from the immune cell infiltration that was triggered by the firstpathogen and persists even after the clearance of the infection [288, 69, 244].In our model, increasing the amount of resident immune cells by increasing the basal rate of
149

neutrophil recruitment β increases the steady state concentration of basal neutophils, such thatNbss > Nb+ (figure 8.13 A).This increased neutrophil load (figure 8.13 B, left) leads to an aseptic loss of homeostasis, char-acterized by persistent barrier damage (figure 8.13 B, center) and clearance of the bacterial load(figure 8.13 B, right), both triggered by the high neutrophil load.These results are consistent with experimental observations, in which a high load of residentimmune cells is associated to acute injury to the epithelial tissue [30, 31, 244]. They are consis-tent with the ”aseptic death” proposed in other models of infection (eg. [102, 103]), althoughthese models do not consider the epithelial damage that results from the persistent inflamma-tion.Besides co-infection, patients with a decreased amount of neutrophils (termed neutropenia)as a result from HIV infection or chemeotherapy also have a high risk of developing severepneumonia [21]. This suggests that the effect of neutrophil numbers on the host response to apathogen is non-monotonic: Both low and high concentrations of resident neutrophils, causedby neutropenia [21] or co-infection (figure 8.13), respectively, are associated to loss of ep-ithelial homeostasis. This implies that the treatment for patients suffering from alterations intheir neutrophil levels that result from co-infection must be carefully dosed, to avoid unwantedside-effects resulting from a excessive modulation of neutrophil concentrations.
Res
iden
t[neu
trop
hil[l
oad
Sa2
Nb2
Bacteria[FapicalU
Neutrophils[FbasalU
FAU[Schematic[representation[of[the[trajectories[in[the[phase[plane[projection
FBU[Dynamics[of[epithelium[function
time[FhoursU
Nb2
ApicalBasal
Neutrophils
Imm
une
[res
pons
e[F
Na4
[Nb
[1.5 [c
ells
zml]U
high[load[of[resident[neutrophils
Control
ApicalBasal
Bacteria[load
time[FhoursU
Sa2
Carrying[capacity
Infe
ctio
n[F
Sa[
and
[Sb
[CF
U×
1.5 zm
l]U
. 2. 4. 6. 8. 1...
2.
4.
6.
8.
1..
12.
14.
16.
18.
2..
Bar
rier[
func
tion
Fnor
mal
ize
dU
time[FhoursU
Nominal[barrier[function
. 2. 4. 6. 8. 1...
.82
.84
.86
.88
1
high[load[of[resident[neutrophils
Control
. 2. 4. 6. 8. 1...
2.
4.
6.
8.
1..
12.
high[load[of[resident[neutrophils
Control
Figure 8.13: Increased load of resident neutrophils results in loss of epidermal homeostasisIncreased levels of resident immune cells resulting from co-infection leads to an aseptic loss ofhomeostasis, characterized by a high immune cell infiltration that persistently decreases barrierfunction ([B], center) and decreases the pathogen load ([B], right).These results were obtained by simulating the continuous system of equations 8.1 with thenominal parameters given in table 8.1, except for the the basal rates of neutrophil infiltration,corresponding to β = 1 (control, black) and β = 10 (high load of resident neutrophils, red) andthe initial conditions Sa(0) = Sa++5, Sb(0) = Na(0) = 0, Nb(0) = 1, and B(0) = 1.
150

8.6.4 Desensitization of the TLR receptor leads to sepsis
It has been reported that co-infection with influenza can lead to the de-sensitization of TLR-mediated immune responses [78].To explore the effects of virus-mediated TLR desensitization, we considered a extreme case ofTLR desensitization, corresponding to a TLR mutant, by setting F(Sa) = 0 ∀ Sa in our model(equations 8.1).As seen in figure 8.14, simulations of the TLR mutant result in sepsis without associated barrierdamage. Complete desensitization of the TLR shifts the threshold of apical bacterial concen-trations required to induce significant TLR activity Sa+→ ∞ (figure 8.14 A). As a result, noimmune responses can be triggered (figure 8.14 B, left), and the barrier remains intact (figure8.14 B, center), but the levels of pathogen load are significantly increased (figure 8.14 B, right).These simulation results agree with the observation that patients with polymorphisms in TLRreceptor tend to develop more severe forms of infections, often resulting in sepsis [46].Our results are also consistent with the modelling results obtained in [93]. In their mathematicalmodel, the authors also considered the reduction in the TLR-mediated neutrophil recruitmentrate as a consequence of co-infection, and identified this mechanisms as key determinant of thelethal synergism between two pathogens.
Attractor:)No)exit)to)this)state
TLR8Cmediated)immune)responses
TLR8C.C
Sa]Sa]
Nb]
Bacteria)1apical0
Neutrophils)1basal0
1A0)Schematic)representation)of)the)trajectories)in)the)phase)plane)projection
1B0)Dynamics)of)epithelium)function
time)1hours0
Nb]
ApicalBasal
Bacteria)loadApicalBasal
Neutrophils
Imm
une
)res
pons
e)1
Naz
)Nb
[64U )c
ells
.ml]0
Bar
rier)
func
tion
1nor
mal
ize
d0
time)1hours0
Carrying)capacity
time)1hours0
Nominal)barrier)function
4 U4 644 6U4 844 8U44
4g8
4gF
4g×
4g8
6
4 U4 644 6U4 844 8U44
U
64
6U
84
8U
34
4 U4 644 6U4 844 8U44
84
F4
×4
84
644
684
6F4
6×4
684
844In
fec
tio
n)1
Sa
)an
d)S
b
[CF
U×
64U .m
l]0
Figure 8.14: Desensitization of the TLR receptor leads to sepsis Complete desensitizationof the TLR, corresponding to a TLR mutant (T LR2−/−), shifts the threshold of apical bacterialconcentrations required to induce significant TLR activity Sa+ → ∞ [A]. Under these condi-tions (T LR2−/−), no immune responses can be triggered upon TLR stimulation ([B], left). Thebarrier remains intact, since also Sa− dependent barrier damage is TLR mediated ([B], center),but the levels of pathogen load remain elevated ([B], right).These results were obtained by simulating the continuous system of equations 8.1 with the nom-inal parameters given in table 8.1, except for β = 1. The initial conditions are Sa(0) = Sa++5,Sb(0) = Na(0) = 0, Nb(0) = 1, and B(0) = 1. The TLR mutant is simulated by settingF(Sa) = 0 ∀ Sa(t).
151

8.7 Conclusions
In this chapter, we proposed a data-driven mathematical model of the host-pathogen interac-tions between Streptococcus pneumoniae and the upper airway epithelium. All the regulatoryinteractions and parameter values were carefully chosen, based on quantitative and dynamicexperimental data (detailed in section 8.3 and appendix B, respectively).Our model builds on previous mathematical models of the host response to Streptococcus pneu-
moniae [94, 92, 93] and considers, for the first time, the dual role of the epithelial monolayerin mediating the host response to a pathogenic challenge. On one hand, a intact epitheliumprevents the invasion of bacteria to the bloodstream, but on the other, it hinders the neutrophiltransmigration that is required for bacterial clearance. Further, barrier function is impaired byneutrophil transmigration. We believe that it is important to explicitly consider the interplaybetween epithelial barrier function and immune responses, since a major part of the pathologyof infection is attributed to the damage to the epithelium that is inflicted by excessive immuneresponses [31, 30].By considering this dual effects of both barrier function and immune responses, our modelanalysis strongly suggests that balance between the two protective properties of the epithe-lial tissue, namely the immune responses and the barrier function, is necessary to maintainepithelial homeostasis. Increased permeability of the epithelial monolayer (figure 8.12) andincreased (figure 8.13) or decreased (figure 8.14) immune responses can result in a loss of ep-ithelial homeostasis.We used our model to explore the different mechanisms that are responsible for the onset of in-fection that results from the synergy between Streptococcus pneumoniae and another pathogen[69]. This co-infection is responsible for the vast majority of the severe cases of infection byStreptococcus pneumoniae [21, 69], but the exact mechanisms of the lethal synergism remainelusive.With our model, we were able to map different effects of viral infection to qualitatively differ-ent ways of loss of homeostasis. For example, our findings suggest that decreased permeabilitybarrier function, resulting from the tissue-damaging immune response to a previous infectious,leads to an aseptic loss of homeostasis, characterized by a high load of immune cell infiltration,barrier damage, but clearance of the pathogen (figure 8.12). In contrast, our model suggeststhat desensitization of TLR receptors resulting from a previous infectious event leads to sepsis,but without the associated barrier damage (figure 8.14).Together, these findings have important clinical consequences in terms of devising optimalpatient-specific treatment strategies that minimize the use of antibiotics [23], since they sug-gest that only a fraction of patients might benefit from antibiotics treatment, while others mightrequire a pharmacological enhancement of the airway epithelium function. They correspond to
152

the patients in which the first infectious event increased the bacterial carrying capacity (figure8.11) or desensitized the TLR receptor (figure 8.14), and those in which the first infectiousevent lead to a decreased permeability barrier function (figure 8.12) or a increased load of resi-dent neutrophils (figure 8.13), respectively.Our proposed modelling framework, that considers the interplay between immune responsesand epithelial barrier function, uncovered the mechanisms that drive infection by other pathogensthat attack epithelial tissues. Considering the dual role of the epithelial barrier in mediating in-fection could be particularly relevant for understanding the strongly convoluted host-pathogeninteractions between virus and epithelial tissues. Epithelial tissues prevent severe infection byhindering the passage of virus into the bloodstream [5], but also act as a substrate for viralreplication [106], and immune cells must attack the (infected) epithelial (and immune) cells tocounteract the viral load [244]. The mathematical modelling approach proposed in this chapterconsiders the dual role of the barrier and the immune responses in mediating the pathogen load,and could therefore help to elucidate the mechanisms that result in viral infection.
8.8 Future work
In collaboration with Mr George Buckle (MRes is Molecular and Cellular Biosciences, ImperialCollege London) and Dr Thomas B Clarke (Faculty of Medicine, Imperial College London),we will continue the analysis of the host-pathogen interactions between Streptococcus pneu-
moniae and the upper airway epithelium discussed in this chapter.First, we will conduct a more rigorous exploration of the qualitative changes of the modelbehaviours that are triggered by the different effects of co-infection on the host response toStreptococcus pneumoniae. We will do this by bifurcation analysis, which will allow us toidentify the critical threshold values of the parameters that are affected by the first infectiousevent at which a qualitative change in the dynamic behaviour occurs. By extensive explorationof the parameter space, we will assess how these bifurcation diagrams are affected by differentchoices in the parameter values.We will also compare our model predictions to other in vivo datasets, both from the literature(for example, [273]) and done by our experimental collaborators.We will also assess the effects of assuming that the switch-like barrier damage elicited byneutrophils and bacteria is described by a bistable dose-response curve (described in section3.2.1), rather than by the memory-less Hill function F(X(t)) in equations 8.1. A bistable dose-response relation between LPS (a bacterial PAMP) and active TLR4 pathway has been previ-ously described [194]. It is relevant to consider this bistability, because thus far, our modelcannot account for the long term clearance of bacteria induced by TLR signalling (see section8.5.2). However, assuming that TLR activation is bistable could account for a long term clear-
153

ance of the infection by the TLR-dependent host responses, similarly to the PAR2 mediatedimmune responses explored in chapter 4.Also, we could expand our current mathematical model to account for the long term conse-quences of a low level infection, by adding a ”persistence” motif (discussed in section 3.4)that stores the history of the infectious events and describes the probability of infiltration of aparticularly pathogenic bacterial strain into the bloodstream.
154

Chapter 9
Concluding remarks
In this thesis, we developed a mathematical modelling framework to describe and analyse thereaction networks controlling epithelial function. Using this framework, we proposed math-ematical models of the reaction networks that underlie the homeostasis of the epidermis andthe airway epithelium, respectively. We used the resulting mathematical models to analyse thepathogenic mechanisms that are responsible for the development of AD and of infection byStreptococcus pneumoniae.By focusing on understanding the mechanisms that trigger the loss of epithelial homeostasis,our theoretical analysis sheds light on the early events in the pathogenesis of AD and infection,respectively. Also, our model analysis uncovered several different potential mechanisms thatcan lead to the loss of epithelial homeostasis, corresponding to patient-specific triggers of thedisease. Further, we used the mathematical model of AD to explore different treatment strate-gies that can potentially cure or at least prevent the onset of severe forms of AD.Together, the findings contribute to the understanding of the mechanisms that cause diseasesassociated to the loss of epithelial homeostasis. This knowledge is fundamental to devise newtreatment strategies that can prevent and cure these socially relevant diseases.
The modelling framework proposed in this thesis was originally developed to formally repre-sent the regulatory networks controlling epithelial homeostasis (described in chapter 2). How-ever, in chapter 8 we successfully applied this framework to for the representation and analysisof a different epithelial system -the host-pathogen interactions between Streptococcus pneumo-
niae and the upper airway epithelium that underlie pneumococcal infection, proving that theapplicability of our framework is not restricted to a particular epithelial tissue.The common feature that characterizes the regulatory networks that underlie the functioningof both the epidermis and the airway epithelium is the interplay between the permeability bar-rier function and the immune responses. Aberrant interactions between these two protectiveproperties of the epithelium underlie many other diseases associated to the loss of epithelial
155

function, including lung infection by the fungus Aspergilus fumigatus [4], viral infection ofthe cervix [5], Crohn’s disease [1], asthma [10, 11], allergic rhinitis [12], and different typesof cancer [14, 15]. Thus, we are convinced that mathematical modelling framework proposedin this thesis can be used to analyse many other diseases that result from the loss of epithelialhomeostasis.
Two key features of our proposed approach are the multi-scale and modular representationof the regulatory networks that control epithelial homeostasis.With the multi-scale approach, we were able to represent the dynamic interplay between bio-
chemical and cellular level processes that underlie the gradual loss of epithelial homeosta-sis. The interplay between a cell and its micro-environment is responsible for slow pheno-type changes that characterize developmental and pathogenic processes. While the micro-environment is sensed by the biochemical signal processing machinery in the individual cells,the collective responses of the individual cells to the micro-environment drive tissue-levelchanges that, in turn, affect the micro-environment. Thus, our framework, based on the inter-play between slowly changing micro-environments and quickly responding biochemical net-works, could be adapted to model many other developmental and pathogenic processes thatunderlie phenotype transitions.In terms of the modular representation, we were able to identify three qualitative input-output
behaviours that control epithelial function: (1) A switch-like induction of cytokine release, (2)Self-recovery dynamics of epithelial permeability barrier components, and (3) Persistent dy-namics of immune cells that are induced by a biochemical mediator (cytokine).Having identified mechanisms that can cause these individual qualitative behaviours (corre-sponding to particular feedback control structures), we could abstract the description of theunderlying network motif into simpler, phenomenological representations.This qualitative approach allows us to suggest a core control structure that is responsible forthe regulation of epithelial homeostasis [52]. It consists of the multi-scale regulatory networkstructure that is formed by the interplay between cytokine release, epithelial permeability andimmune cells, and corresponds to a mesoscopic ”template model” [291] to which mechanisticand quantitative detail can be added a posteriori.The network motifs described in this thesis (switch-like dose response, self recovery and home-ostasis) are not specific for the regulatory modules controlling epithelial homeostasis. For ex-ample, switch-like dose response behaviour has been observed in signalling networks involvingcaspases [292, 247] and mitogen-activated kinases [293, 205], and is thought to underlie em-bryonic differentiation programs [294]. Self-recovery dynamical behaviour characterizes thepheromone response pathway in S. cerevisiae [215, 216], the BMP4 signalling pathway in X
laevis [217], and the hyperosmotic stress response in yeast [218, 219]. A persistent behaviour
156

plays a key role in determining the specificity in the gene expression controlled by the masterregulator NFκB [232]. Thus, we believe that many other physiological processes can be repre-sented by a combination of these regulatory modules, using the proposed multi-scale modellingframework.
There exist a overwhelming amount of experimental and clinical data describing biologicalprocesses that are believed to play important roles in pathological and developmental processes.However, most of these data characterize individual components of the reaction networks thatunderlie the healthy and pathological physiology. In many cases, however, a healthy or a dis-ease phenotype results from the interplay between several biochemical, cellular and tissue levelprocesses.To uncover how normal developmental and aberrant pathological processes emerge from in-teractions between individual regulatory components, it is necessary to analyse the underlyingreaction networks from a systems-level perspective.This requires theoretical frameworks to integrate, organize and analyse the scattered clinicaland experimental data.The mathematical modelling framework proposed in this thesis provides such a theoreticalframework. With it, we could uncover the mechanisms that underlie epithelial homeostasis.Due to its generality, it can be used to analyse many other relevant developmental processesunderlying healthy and pathologic physiology.
157

Appendix A
Mathematical representation of reactionnetworks
This brief appendix gives an overview of the methodology by which we construct a mathemat-
ical model (based on systems of ODE) to represent the reaction networks of biochemical and
cellular interactions analysed in this thesis.
To construct a mathematical model that represents the reaction network, each of the regulatoryinteractions must be translated into a mathematical expression -particularly, a rate. Collectively,these rates form a system of differential equations that describe the inter-dependent dynamicsof the different components of the reaction network.Here, we use ordinary differential equations (ODEs) to describe the dynamics of the system ina deterministic and continuous manner. Translating a reaction network into a system of ODEis a standard methodology in systems biology that has been discussed widely, for example in[295, 296, 297, 298]. Below, we give a brief description of this methodology. For details,please refer to the above mentioned publications. Particularly, we use the law of mass action
to describe (most of) the rates of the system. We assume that the rate of change in the concen-tration of species X is proportional to the concentration of precursors Xpre, the effectors E andthe kinetic rate constants ki, thus for instance, a production reaction of X is represented by theterm dX
dt = XprekprodEprod; degradation, by dXdt =−XkdegEdeg, reversible dimerization of A and
B, by dABdt = [A][B]kdimEdim− [AB]kdisEdis. Effectors are distinguished from precursors in that
their concentrations are not affected by the reaction they catalyse.Negative regulation is often represented in a phenomenological way, by multiplying the rateon which the repressor is acting by a function that decreases monotonically with the concen-tration of the repressor. It would also be possible to derive this sort of functions from basicbiochemistry, by explicitly representing, with law of mass action, the mechanism by whichthe repressor exerts its action (depending on how the repressor acts: for instance, trapping theeffector molecule). However, for convenience (less parameters and equations) this level of
158

mechanistic detail is omitted.One of the main advantages of mathematical description of a reaction network is that all thereactions that affect X can be represented and studied simultaneously (this is why it is calleda systems biology approach). Thus, if for example, X is being produced, degraded and also itforms a heterodimer with another molecule Y (reaction network depicted in figure A.1), thenits full dynamics are described by simply adding up the individual reactions explained above.In this particular example, this procedure would retrieve the expression that describes X :
dXdt
= XprekprodEprod−X(t)kdegEdeg−X(t)Y (t)kdimEdim +XY (t)kdisEdis. (A.1)
The dynamics of X given by equation A.1 depend on constant parameters, such as kdeg, kdim
and kdis, but also on other, time varying variables, such as Y (t) and XY (t). Collectively, theset of coupled equations that describe all the inter-dependent variables of the system form thesystem of differential equations describing the reaction network.Once the reaction network has been represented by a system of ODEs, the resulting mathe-matical model can be analysed by numerical or analytical methods. For example, to analysethe dynamic evolution of the system, the system of ODE is integrated over the range of timeof interest. In this thesis, numerical integration of ODEs is done using Matlab R2012a.To understand the dose response behaviour, a steady state analysis is performed. For this, weuse Maple 16 (analytical calculation of steady states and stability of non-linear systems ofODEs), Matlab R2012a (numerical calculation of steady states), Oscill8 (found underhttp://oscill8.sourceforge.net/, used for bifurcation analysis).
159

Xpre X
Y
XY
Eprod
Edis
Edeg
Edim
Figure A.1: Example reaction network. The reaction network is given by the interactionsbetween the time-varying biochemical species X , Y and the heterodimer XY (shown in greycircles). The reactions of production of X from a (constant, in a blue oval) precursor Xpre,degradation of X and reversible formation of the heterodimer XY are catalysed by Eprod , Edeg,and Edis and Edim (red squares), respectively.
160

Appendix B
Parameter estimation of the mathematicalmodel describing the host-pathogeninteractions between airway epitheliumand Streptococcus pneumoniae
This appendix describes the procedure used for deriving the parameter values of the mathe-
matical model of the host-pathogen interactions between airway epithelium and Streptococcus
pneumoniae given in equations 8.1 (described in chapter 8), from experimental in vitro data
that we gathered from the literature. The resulting parameter set is summarized in table 8.1.
The parameters of the model 8.1 can be divided into following categories:
• System-independent parameters quantify the rates that are specific to a particular species.They correspond to natural (intrinsic) birth and death rates of barrier, pathogens and neu-trophils that are measured by transwell experiments (barrier) and by tracking the popu-lation sizes of bacteria and neutrophils (figure B.1 I). They can be modelled by a one-dimensional linear ODE that be solved analytically. Hence, it is possible to derive analgebraic expression for these parameters as a function of the experimental values.
• System-dependent parameters (in vitro) characterize the interplay between subsets ofthe components of the system. They correspond to modulations of productions and degra-dations of one species by another, for example, bacterial killing by neutrophils. Experi-mentally, they are assessed by quantifying the barrier function and population sizes in co-cultures between neutrophils, bacteria and epithelial cells in a monolayer (figure B.1 II).We estimate these parameters by optimization, which involves the comparison of simu-lations from the corresponding system of equations 8.1 to experimental data.
161

• In vivo parameters quantify the rate of neutrophil recruitment from the blood stream,and are indirectly measured in in vivo experimental settings by quantification of neu-trophil concentrations upon a bacterial challenge (figure B.1 III). These parameters areroughly estimated by comparing simulations of the full system of equations 8.1 to in vivo
data, using the previously estimated in vitro parameters. Congruence between the modelsimulations using the estimated parameters from in vitro data and the in vivo data, shownin figure 8.4 is considered as a validation to our parameter estimation protocol.
Individual parameter calculations are detailed in the following subsections. All the parame-ter optimizations were done with Matlab R2012a, using the built in function fminsearch,using as a cost function the squared error between the simulations (given a parameter set) andthe experimental data.
Barrier production rate (κbp)
The barrier production rate κbp is assessed experimentally by following the dynamics of theTEER (given in units of electrical resistance per tissue area, i.e. in Ω
cm2 ) of an epithelial mono-layer (represented in figure B.1 Ii) upon a perturbation [28, 283] and for intestinal epithelium[87].Neither neutrophils nor bacteria are present in these experimental settings. This correspondsto assuming that Na(t) = Nb(t) = Sa(t) = Sb(t) = 0, which simplifies model 8.1 to B(t) =
κbp(1−B(t)) with B(0) = B0, which has the analytic solution:
B(t) = 1+ e−κbp t (B0−1) . (B.1)
Given a experimental measurement at time texp and a initial condition B0, κbp can be ex-pressed analytically as:
κbp =− ln
(−1+Bexp(texp)
B0−1
)texp
. (B.2)
This expression (B.2) accepts only one data point, and retrieves one estimate for κbp thatis used as a initial guess a optimization of equation B.1 using the experimental data from [87](figure 5a), which measures the recovery of an epithelial monolayer (T84, intestinal epithelium)upon perturbation with cytokines. The data-points correspond to Bexp =[400, 750, 1100, 1400,1500, 1400, 1200] (in Ω
cm2 ) at measured at times [70/60, 2, 4, 6, 8, 1, 0, 20] (in hours), whichwe normalized to its maximum value Bexp = 1500 to obtain a dimensionless quantity. Thisretrieved a value of κbp = 0.451
h .Using the same method but other experimental data, derived from airway epithelium, resultedin values for κbp that were one order of magnitude below (κbp = 0.07 [28]) or above (κbp = 1.05
162

[283]). The results of the optimization for the three datasets are shown in figure B.2. From thesevalues, we chose the intermediate value κbp = 0.45, estimated from the data in [87], becauseit corresponds roughly to the average of the three values of κbp obtained by using the threedifferent datasets.
Bacterial proliferation rate (κs) and carrying capacity (µs)
Bacterial proliferation rate is assessed experimentally by following bacterial cell cultures overtime (figure B.1 Iii). In these experiments, no neutrophils nor epithelial cells are present. Thiscondition can be reflected in the model 8.1 by assuming that Na(t) = Nb(t) = B(t) = κbp = 0,resulting in the system of equations B.3:
Sa(t) = Sa(t)κs
(1− Sa(t)
µS
)−Sa(t)κsi, (B.3a)
Sb(t) = Sb(t)κs
(1− Sb(t)
µS
)+Sa(t)κsi. (B.3b)
(B.3c)
Defining S(t) = Sa(t)+Sb(t), and given that S(t) = ˙(Sa(t)+Sb(t)) = Sa(t)+ Sb(t), then:
S(t) = Sa(t)κs
(1− Sa(t)
µS
)+Sb(t)κs
(1− Sb(t)
µS
). (B.4)
Assuming that Sa(0) = Sb(0), since there is no barrier separating Sa and Sb, equation B.4can be simplified to:
S(t) = S(t)κs
(1− S(t)
µS
). (B.5)
Equation B.5 can be further simplified for bacterial concentrations such that S(t) << µs.In this case, equation B.5 can be represented by the exponential growth model S(t) = S(t)κs
that can be solved analytically (S(t) = S(0)exp(tκs)). From this analytic expression, κs can bedirectly calculated:
κs ∼log(S(texp)
S(0) )
texp. (B.6)
We used expression B.6 and the experimental data from [279], corresponding to growthcurves of Streptococcus pneumoniae in the low nutrient medium MLM that resembles the in
vivo conditions of the epithelium. The two data points used to calculate κs from equation B.6were texp = 2.5h, S(0) = 0.1 given in units of Optical Density of the bacterial colony at 450
163

nm (OD450nm), and S(texp) = 0.32 OD450nm. Note that for the calculation of κs from equationB.6 requires the dimensionless ratio between S(texp) and S(0). The resulting value κs = .451
h isgiven in table 8.1.Following the same procedure but different datasets [278, 277] lead to slightly higher κs values(κs = 0.92 [277] and κs = 1.1 [278]. The resulting fit is shown in figure B.3. We chose thevalue derived from the data in [279], because the growth experiments were done in conditionsthat resemble the in vivo environment of the epithelium.
A maximal value for the carrying capacity µs was read out directly from the data in [277](figures 2A and 4A, representing growth curves of Streptococcus pneumoniae in a glucose andlactose medium), by assuming that µs corresponds to the maximal concentration of bacteria,measured as Samax = 0.55 OD600. To convert the units of OD600 to [CFU×105
ml ], we use therelation from [299]: 2×10⁸CFU
50µl ∼ 0.63OD, which results in a value of µs = 3.5×10⁴[CFU×105
ml ].Growth curves measured by our experimental collaborator Dr Tom Clarke (Imperial CollegeLondon) retrieved a estimate for µs = .5× 104[CFU×105
ml ] (personal communication), which isone order of magnitude lower than the value for µs obtained from [277]. Given that bothvalues for µs were estimated from ideal in vitro conditions, they both correspond to an over-estimation of the in vivo conditions of our model. Therefore, we chose the lower value of µs =
.5×104[CFU×105
ml ] (Dr Tom Clarke, personal communication) given in table 8.1 as a referencevalue.
Neutrophil death rate (κnd)
The half life of neutrophils is commonly estimated by labelling neutrophils (for example, witha radioactive tracer) and following their fluorecence over time [282]. Assuming that neutrophilhalf lives are not affected by barrier and bacteria, their dynamics in the epithelium can beapproximated by N(t) = −κndN(t), where N(t) = Na(t)+Nb(t) corresponds to the total pop-ulation of neutrophils in the epithelium. The ODE N(t) has a analytic solution N(t), whichcan be solved analytically to express κnd as a function of a experimentally determined initialneutrophil concentration Nexp(0), and the elapsed time texp and the neutrophil concentration attexp, as follows:
κnd =− ln(
Nexp(texp)
Nexp(0)
)texp−1. (B.7)
Most of the datasets describing the effect of neutrophils on barrier or bacteria are derivedfrom in vitro experiments that involve human neutrophils (for example, [72, 88, 89, 86, 275, 71,300]). Thus, we estimated the neutrophil death rate using the data describing human neutrophilhalf lives in [282]. Substituting the average of the human neutrophil half lives (correspondingto the time texp at which N(texp) = 0.5N(0)) given in table 2 (control) of [282] (texp = 8.3375h)
164

in equation B.7, we obtain the nominal neutrophil death rate of κnd = 0.08 given in table 8.1.The resulting N(t) simulations and the data-point from [282] are shown in figure B.4.
Switch-like activation of TLR pathway by bacteria (km and nH)
The switch-like dose-response relation between the steady-state TLR pathway activity F(Sa(t))
and the concentration of apical bacteria Sa(t) can be experimentally assessed in two ways.Directly, by measuring the output of TLR pathway activity (for example, in levels of NFκBactivation) in response to a bacteria-derived ligand (like peptidoglycan) [285], or indirectly, bymeasuring the dose-dependent effects of TLR pathway activity (eg decreased barrier function[85]).In the model, the activation of TLR pathway by bacteria is described by the Hill functionF(Sa(t)) =
Sa(t)nH
Sa(t)nH+knHm
, where km is the concentration of Sa(t) at half maximal TLR activation,and nH is the Hill-coefficient that quantifies the steepness of the switch. Assuming very highvalues for nH (nH → ∞) results in a perfect switch, where only values for Sa(t) that are abovethreshold result in significant TLR activity (see section 3.2.6).In [285] (figure 3A), direct relation between concentrations of bacterial ligand (correspond-ing to [0, .125, .25, .50] µg
ml of peptidoglican) and TLR activity (given by [1,1.25,1.6,2.3]-foldexpression of NFκB activity, measured in a reporter gene). Only the highest peptidoglycanconcentrations (.50 µg
ml ) trigger a statistically significant increase in TLR activity. Slightly lowerconcentrations of peptidoglycan (.25 µg
ml ) trigger a small but not significant increase in TLR ac-tivity. We assume that, roughly, km corresponds to this value. To convert this concentration toour units CFU × 105/ml, we follow [301], 1µg of peptidoglycan corresponds to 5× 10⁷CFU
of Streptococcus pneumoniae. This results in the value of km = 120[CFU×105
ml ] given in table8.1.This estimation is consistent with the dataset from [85] (figure 1A), that relates concentra-tions of bacteria to barrier function. In this dataset, only concentrations of bacteria above150[CFU×105
ml ] result in barrier damage. Similarly, the data from [38] (figure 5A) state that aconcentration of bacteria of 500[CFU×105
ml ] (well above the km threshold) induces barrier dam-age. These qualitative results are shown in figure B.5.A estimate of the Hill coefficient nH was obtained by fitting the Hill equation F(Sa(t)) to theabove mentioned data from [285]. The optimization resulted in a value for nH = 5.75 given intable 8.1.The resulting parametrized Hill equation and the data points from [285] are shown in figureB.6.
165

Neutrophil bacteria interactions: Neutrophil induced death of bacteria (φNS)
The neutrophil-induced death of bacteria is assessed experimentally by a killing assay, in whichthe size of bacteria populations in a co-culture with neutrophils is assessed over time (figureB.1 IIii) [88, 89].The measurements correspond to the fraction of bacteria present in the co-culture after texp
units of time, in respect to the amount of bacteria present at texp when no neutrophils are ap-plied [88, 89].These experimental conditions, which involve no epithelial cells nor infiltration from neu-trophils from the blood, can be mimicked by the mathematical model by setting B(t)= θSanrNv=β= κbp = 0 in equations 8.1. Further, because there is no barrier, there is no distinction betweenapical and basal populations of bacteria and neutrophils. We reflect this condition in the modelby defining S(t) = Sa(t)+ Sb(t) and N(t) = Na(t)+Nb(t), and assuming that Sa(0) = Sb(0)and Na(0) = Nb(0). These assumption leads to the system of equations B.8:
dS(t)dt
= S(t)κs
(1− S(t)
µS
)−φNSN(t)S(t), (B.8a)
dN(t)dt
=−κNdN(t). (B.8b)
Equation B.8b is a uncoupled, first order linear ODE, hence, the system of equations B.8can be simplified to equation B.9:
dS(t)dt
= S(t)κs
(1− S(t)
µS
)−φNSN(0)e−κNdtS(t). (B.9)
To compare the model simulations with the experimental conditions in [88] and [89], wedefine S0(t) as the control bacterial population (grown in the absence of neutrophils), and SE(t)
as the population of bacteria that is grown in a co-culture with neutrophils (equations B.10).Then, the measured fraction of bacteria that survived neutrophil exposure corresponds to SM =SES0
, where:
dS0(t)dt
= S0(t)κs
(1− S0(t)
µS
), (B.10a)
dSE(t)dt
= SE(t)κs
(1− SE(t)
µS
)− N(0)e−κNdt︸ ︷︷ ︸
Analytic solution N(t)
φNSSE(t). (B.10b)
Further, assuming that S(t)<< µS, i.e. the bacteria population is in the linear growth phase,
166

leads to the expression for ˙SM given in equation B.11:
dSM(t)dt
=ddt
SE(t)S0(t)
=S0(t)SE(t)−SE(t)S0(t)
S0(t)2 (B.11a)
=1
S0(t)2
S0(t)SE(t)(κSd−N(0)e−κNdt
φNS)︸ ︷︷ ︸
SE as in eq.B.10b
−SE(t) κSdS0(t)︸ ︷︷ ︸S0 as in eq.B.10a
(B.11b)
=−SM(t)N(0)e−κNdtφNS. (B.11c)
Equation B.11c is a first order ODE and hence has the analytic solution B.12:
SM(t) = SM(0)e−N(0)φNS
κNd eN(0)φNS e−κNd t
κNd . (B.12)
From equation B.12, neutrophil- induced death of bacteria φNS can be expressed analyti-cally as a function of the initial fraction of surviving bacteria SE(0), the initial concentration ofapplied neutrophils Nexp(0), the time of exposure to neutrophils texp and the fraction of surviv-ing bacteria after this exposure time (SE(texp)) (equation B.13):
φNS =−log(
SM(texp)SM(0)
)Nexp(0)
(1
κNd− e−κNdtexp
κNd
) . (B.13)
Substituting the data from [89] (figure 1B, killing assay between human neutrophils andStreptococcus pneumoniae; texp = 0.74h, SE(0)= 1, SE(texp)= .25, and Nexp(0)= 1000[cells]×10−5T−1) in equation B.13 gives the nominal value φNS = .0019[T 105×cells
ml ]−1 given in table8.1. Following the same technique but using a different dataset [88] retrieved an almost iden-tical value (φNS = .00185). The data-points of [89] and [88], as well as the simulations ofequation B.12 with the calculated values of φNS, are shown in B.7.
Rates of barrier damage by bacteria (θSabd and λSabp)
The damaging effects of Streptococcus pneumoniae on the epithelial tissue are experimentallyassessed by dynamically measuring the permeability barrier function of a epithelial monolayer(corresponding to TEER) to which bacteria are added (see figure B.1IIi) [85, 68]. These ex-periments are carried out in the absence of neutrophils, and hence, can be described by settingNa(t) = Nb(t) = β = θSanrNv = 0 our model (system of equations 8.1), resulting in the simpli-
167

fied system of equations describing the interactions between bacteria and barrier B.14:
dSa(t)dt
=
[κS
(1− Sa(t)
µS
)− κsi
εSB(t)+1
]Sa(t), (B.14a)
dSb(t)dt
= Sb(t)κS
(1− Sb(t)
µS
)+
κsi
εSB(t)+1Sa(t), (B.14b)
dB(t)dt
=κbp(1−B(t))
1+λSabpF(Sa(t))−θSabdF(Sa(t))B(t), (B.14c)
F(Sa(t)) =Sa(t)nH
Sa(t)nH +KnHM
. (B.14d)
Recall that barrier damage by bacteria occurs via the switch-like activation of TLR sig-nalling cascades. Thus, if the apical bacterial concentration is very high, then TLR signallingis activated to its maximum level for the whole duration of the experiment. If these conditionsare met, then equations B.14 can be simplified by setting Sa(t) = Sahigh, where Sahigh is a ar-bitrary, constant and, importantly, above-threshold (km) concentration of apical bacteria. Thissimplification results in equation B.15.
dB(t)dt
=κbp(1−B(t))
1+λSabpSahigh −θSabdSahighB(t). (B.15)
In [85] (figure 1a), the dynamics of the barrier function of a primary culture of humannasopharyngeal epithelium and of Streptococcus pneumoniae are tracked over time. We usethe last three time-points for barrier function ([150, 60, 40] TEER (Ωcm2), normalized to themean barrier value of the untreated control), measured at times [0, 6, 13] h. The bacterialconcentrations Sa(t) are [100, 199, 316] (last two values well above threshold). We optimizedB.15 to these experimental data to obtain the values for TLR-dependent barrier degradationθSabd = 0.8T−1 and inhibition of barrier production λSabp = 0.18 (dimensionless) shown intable 8.1.The resulting dynamics for B(t), described by B.15 and parametrized by the obtained values forθSabd and λSabp predict the independent dataset described in [68]. The results of the parameteroptimization (with data from [85]) and validation (with data from [68]) are shown in figure B.8.
Invasion of bacteria through barrier (κSi and εS)
The rate of invasion of bacteria through barrier is estimated experimentally by tracking thepopulations of bacteria on the basal and on the apical side of an epithelial monolayer over time(figure B.1IIi) [270]. These experimental conditions do not involve neutrophils, and can hencebe approximated by equation B.14. Further, if the apical bacterial concentrations are high, then
168

the Hill function describing the activation of TLR signalling by bacteria can be approximatedby setting F(Sa(t))∼ Fmax.We use data from [270] (fig. 5b), which measure the percentage of infiltration of Strepto-
coccus pneumoniae through a monolayer of airway epithelial cells (A549). In their experi-ments, the initial concentration of apically located bacteria is Sa(0) = 50000[CFU×105
ml ], corre-sponding to a value well above threshold km = 120[CFU×105
ml (table 8.1). Thus, the assumptionF(Sa(t)) ∼ Fmax is reasonable. The measured [270] percentage of bacterial invasion is [0, 3,12, 20, 25, 30, 35, 38, 45, 50, 50] at time-points [0, 1, 2, 3, 4, 5, 6, 7, 8, 9, 10] (in h).We used these data-points and equation B.14 (with F(Sa(t))∼ Fmax) to estimate the rate of in-vasion of bacteria though the monolayer (κSi), as well as the rate of inhibition of the infiltrationby the barrier (εS) by optimization. The resulting values are κSi = 0.05T−1 and εS = 1, shownin table 8.1. The fit of the resulting simulations for Sb(t)
Sa(t)+Sb(t) (obtained by integrating equationB.14) to the data from [270] is shown in figure B.9 .
Neutrophil barrier interactions (1): Switch like damage of barrier by neutrophils (pa-rameters kmn, nhN and φnbBd)
Experimentally, the damaging effect of neutrophils on barrier function is commonly assessedby measuring the permeability barrier function of a inverted epithelial monolayer to whichneutrophils are added on the basal side (figure B.1 IIiii). The apical chamber of the transwelldevice (below the inverted monolayer) also contains PAMPs that trigger the transmigration ofthe neutrophils [86, 87, 30].In the mathematical model, these PAMPs can be represented by S(t) with dS(t)
dt =κsi
εSB(t)+1,
corresponding to the concentration of a biochemical molecule that is affected only by the in-filtration through the barrier. In these in vitro experiments, no neutrophil infiltration occurs,corresponding to setting β = θSanrNv = 0 in the system of equations 8.1. Together, settingSa(t) = S(t) and β = θSanrNv = 0 in the system of equations 8.1 results in the simplified systemof equations B.16:
dNb(t)dt
=−[
θnt
εNB(t)+1ˆSa(t)+κNd
]Nb(t), (B.16a)
dB(t)dt
= κbp(1−B(t))− φNbbdNb(t)nH
Nb(t)nH +KnHMN
B(t), (B.16b)
dS(t)dt
=κsi
εSB(t)+1. (B.16c)
To obtain estimates for the parameters that quantify the switch-like dose-response relation
169

between the applied neutrophils and the resulting barrier damage (the concentration of neu-trophils at half maximal barrier damage kmn, the hill coefficient nhN quantifying the sharpnessof the switch, and the maximal strength of Nb induced barrier degradation φnbBd), we usedexperimental values from [86] (figure 4). These were obtained from transwell experiments,using a inverted monolayer (intestinal epithelium, T84), a fMLP gradient (corresponding to thePAMP) and varying concentrations of neutrophils. The experimental dose-response curve wasobtained by measuring the concentrations of basal neutrophils and the barrier function texp = 1h
post- treatment. The resulting data are Nbexp = [0.01, 1, 10, 100] cells×105/ml and Bexp =[1,0.95, 0.6, 0.1500].We simulated these dose-response curves by numerically integrating equations B.16 for texp =
1h and collecting the final values for B and Nb. This allowed us to estimate, by optimization,the parameter values kmn = 9 [cells×105
ml ], nhN = 5 and φnbBd = 3.2 shown in table 8.1, using thedata from [86] and equations B.16.Dose-response simulations of neutrophil concentrations vs barrier damage, using the result-ing parametrized model (equations B.16), can reproduce two independent data-sets reported in[275] (damage of airway epithelium by human neutrophils) and in [71, 87] (damage of intesti-nal epithelium by human neutrophils). Results from the parameter optimization and validationare shown in figure B.10.The resulting, parametrized dose-response relation between basal neutrophils and the rate ofbarrier damage, given by the scaled Hill function φnbBdF(Nb), is shown in figure B.11.
Neutrophil barrier interactions (2): Infiltration of neutrophils through barrier (θnt andεn)
Empirically, the rate of neutrophil transmigration through the barrier is assessed in a similar ex-perimental setting as described above, by following the dynamics of apical neutrophils Na(t)
that have migrated from the basal side of a inverted epithelial monolayer in response to a gra-dient of PAMPs [71, 300] .Mathematically, these experimental conditions can be represented as before (system of equa-tions B.16), and adding a explicit description of Na(t) dynamics, given by
dNa(t)dt
=θnt
εNB(t)+1Sa(t)−κNdNa(t). (B.17)
The data from [71] (figure 2b) shows the percentage of applied neutrophils that have trans-migrated from the basal to the apical side of the epithelial monolayer (Naexp =[0, 2.5, 30, 50,70], in %, at times texp =[0, 0.5, 1, 1.5, 2], in hours), given a initial concentration of appliedbasal neutrophils Nbexp(0) = 50[cells×105
ml ].Using these data and our simplified model (equations B.16, with B.17), we obtained the opti-
170

mized parameter values θnt = 14 [CFU×10−5
T ] and εn = 81, shown in table 8.1.The parametrized model accurately predicts the independent experimental data-set of [300].The results of the parameter optimization and the model predictions are shown in figure B.12.
171

(I).System.-.independent.parameters
(II).System.-.dependent.parameters:.Sub-systems
(III).In.vivo.parameters
Experimental.data.for.parameter.deduction
Transwell
Epithelial.monolayer Bacterial.culture.(S..pneumoniae)
Transwell.with.inverted.monolayer
Lanelled.neutrophils
Bloodstream
(i).Barrier.function (ii).Pathogen.load (iii).Neutrophils
(i).Barrier-Pathogen (ii).Pathogen-Neutrophil (iii).Neutrophil-Barrier
apical
basal
apical
basal
Figure B.1: Experimental techniques leading to quantitative dynamic experimental dataused for the parameter estimation and validation of the mathematical model of the host-pathogen interactions between the airway epithelium and Streptococcus pneumoniae. (I)
System - independent parameters quantify the rates that are specific to a particular species.(i) Barrier function of a given epithelial monolayer is assessed by transwell experiments thatmeasure the electrical resistance between apical and basal chamber. (ii) Pathogen and (iii)neutrophil growth and death rates are quantified by tracking the changes of population sizesover time. (II) System -dependent parameters that characterize interactions between a sub-set
of model species (i) The interplay between barrier function and pathogen load is assessed bytranswell experiments, which are initialized by placing a population of pathogens in the apicalchamber of the transwell device. Remaining apical and invading basal pathogen load, as well asbarrier function, are then quantified over time. (ii) The interplay between pathogens and neu-trophils is characterized by following the population size of these two species in a co-culture.(iii) The interplay between neutrophil and barrier is quantified by transwell experiments whichare initialized by placing neutrophils in the basal side of a inverted monolayer, and tracking theremaining basal and transmigrated apical neutrophils, as well as the barrier function, over time.(II) In vivo parameters are calculated by inoculating a population of pathogens (bacterial chal-lenge) into the nares of a mouse. Apically located pathogens and neutrophils are estimated byquantification of Broncheoalveolar lavage fluid (BALF). In vivo estimation of barrier functionis not commonly performed.
172

0 5 10 150
0.2
0.4
0.6
0.8
1
time (h)B(t)
Coyne2002 (HAE)optimized kbp=0.069081
Heijink2012 (10HBE)optimized kbp=1.0462
Nusrat 1997 (T84)optimized kbp=0.42568
Figure B.2: Data-points and model fit for the calculation of the barrier production rate κbp.Data points were derived from airway [28] [283] and intestinal [87] epithelial monolayers.
0 2 4 6 8 10 120
0.5
1
1.5
2
2.5
3
3.5 x 10⁴
time (h)
S(t
)
µsµs
ks=1.1513 LiKorotky2008
ks=0.9242 Burnaugh2008
ks=0.46526 Hathaway2012
Figure B.3: Data-points and model fit for the calculation of the bacterial growth rate κs andcarrying capacity µs, using equation B.6 and data from [277], [279] and [278].
0 5 10 15 200.1
0.2
0.3
0.4
0.5
0.6
0.7
0.8
0.9
1
time (h)
N(t
) (pr
opor
tion
of a
live)
calculated kN=0.083136
Tak 2013 (Human neutrophils)
Figure B.4: Data-point and model fit for the calculation of the neutrophil death rate κnd, usingequation B.7 and data from [282].
173
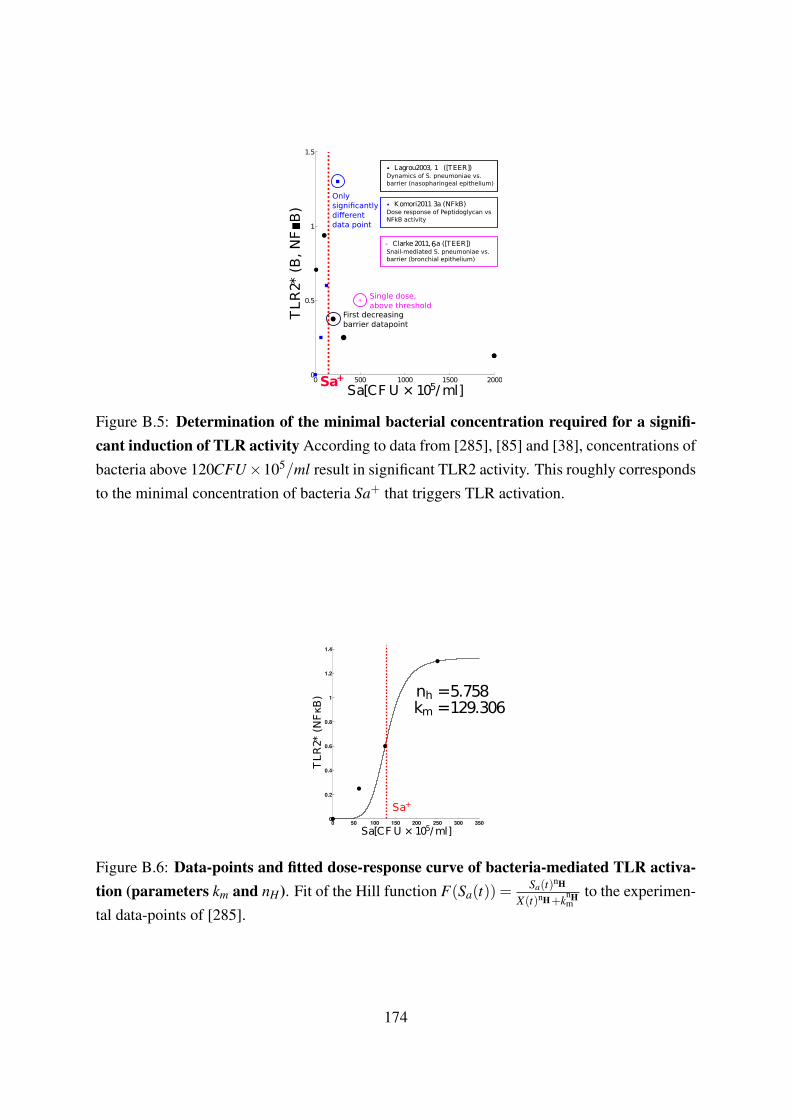
0 500 1000 1500 20000
0.5
1
1.5
Sa+Sa[CF U × 105/ ml]
TLR
2*(B
,N
FB
)
Lagrou2003, 1 ([TEER])Dynamics of S. pneumoniae vs. barrier (nasopharingeal epithelium)
Dose response of Peptidoglycan vs NFkB activity
Komori2011 3a (NFkB)
Clarke2011, a ([TEER])Snail-mediated S. pneumoniae vs. barrier (bronchial epithelium)
6
Single dose, above threshold
Only significantly different data point
First decreasing barrier datapoint
Figure B.5: Determination of the minimal bacterial concentration required for a signifi-cant induction of TLR activity According to data from [285], [85] and [38], concentrations ofbacteria above 120CFU×105/ml result in significant TLR2 activity. This roughly correspondsto the minimal concentration of bacteria Sa+ that triggers TLR activation.
0 50 100 150 200 250 300 3500
0.2
0.4
0.6
0.8
1
1.2
1.4
Sa+
Sa[CF U ×105/ml]
TLR2*
(NFκB
) nh =5.758km =129.306
Figure B.6: Data-points and fitted dose-response curve of bacteria-mediated TLR activa-tion (parameters km and nH). Fit of the Hill function F(Sa(t)) =
Sa(t)nH
X(t)nH+knHm
to the experimen-tal data-points of [285].
174

0 0.5 1 1.50
0.2
0.4
0.6
0.8
1
time (h)
S(t)
φNS =0.0019066Dick2008
φNS =0.0018471Standish
Figure B.7: Data-points and model fit for the calculation of the neutrophil-induced deathof bacteria (φNS) The parameter φNS was calculated using the equations B.13 and B.11, aswell as the data from [88] and [89]. Note the almost perfect agreement between the obtainedparameter values.
18 20 22 24 26 28 300
0.2
0.4
0.6
0.8
1
time in h
B(t)
Barrier damageby bacteria
Data (Lagrou 2003, f g. 1a)
Optimized: θSaHigh =0.79767, λSaHigh =0.15838
Prediction: Beisswenger, 2007 (fig.7b)
Figure B.8: Data-points, model fit and validation for the calculation of the parametersquantifying barrier damage by bacteria (θSabd and λSabp) The TLR-dependent barrier degra-dation θSabd = 0.8T−1 and inhibition of barrier production λSabp = 0.18 (dimensionless) wereestimated by fitting equation B.15 to data from [85] (fig. 1a). The resulting parametrizedequation agrees well with the independent experimental data from [68].
175

0 2 4 6 8 100
10
20
30
40
50
60
time [h]
%infltrated
bacteria[
Sb
Sb+Sa(t)]
Data (Attali2008, Fig 5b)
Optimized: κsi =0.047326, ǫs =1.0824
Figure B.9: Estimation of parameters that quantify the rate of invasion of bacteria throughbarrier (κSi and εS)
0 20 40 60 80 1000
0.1
0.2
0.3
0.4
0.5
0.6
0.7
0.8
0.9
1
Nb(0)[cells×105/ml]
B−B(texp)
Data (Nash1987, f g.4, texp = 1h)Fit (Nash1987)Data (Zemans2011, f g.1a, texp = 1.5h)Pediction (Zemans2011)Data (Nusrat 1997 Fig.5a, texp = 1.1667 or 1.8333h)Prediction (Nusrat 1997)Data (Parkos 1992 Fig.2, texp =1.25)Prediction (Parkos 1992)
Figure B.10: Estimation and validation of parameters quantifying the switch-like damageof barrier by neutrophils. To obtain the values quantifying the switch-like damage of barrierby neutrophils (the concentration of neutrophils at half maximal barrier damage kmn, the Hillcoefficient nhN quantifying the sharpness of the switch, and the maximal strength of Nb inducedbarrier degradation φnbBd), we used data from [86] representing dose-response behaviours ofNb(0) vs B(texp) and in silico simulations of the system of equations B.16 from t = 0 to texp
for different initial conditions Nb(0). The resulting parametrized model agrees with other,independent datasets [275, 71, 87].
176

0 5 10 15 20 25 300
0.5
1
1.5
2
2.5
3
3.5
Nb+ K MN
φnbB
Nb(0)[cells×105/ml]
Bdegradationrate
Figure B.11: Switch-like dose response behaviour of barrier damage by basal neutrophils,given by the parametrized and scaled Hill function φnbBdF(Nb).
0 2 4 6 8 100
10
20
30
40
50
60
70
80
%ofmigratedNa
Na(t)
Nb(0)
time [h]
Chin 2008, f g.2b (inverted T84,i
Tamang2012,(A549, Calu-3, H292)prediction
fit)
Figure B.12: Model fit, model prediction and data-points showing the transmigration ofneutrophils across a epithelial monolayer, parametrized by θnt and εn. The parametersθnt and εn, quantifying the rate of transmigration of neutrophils through a epithelial mono-layer, were calculated by fitting equations equations B.16, with B.17 to the experimental datafrom [71] (figure 2b). The resulting parametrized model accurately reproduces the independentdataset from [300].
177

Bibliography
[1] Amanda M Marchiando, W Vallen Graham, and Jerrold R Turner. Epithelial barriers inhomeostasis and disease. Annual review of pathology, 5:119–44, January 2010.
[2] Ehrhardt Proksch, Johanna M. Brandner, and Jens-Michael Jensen. The skin: an indis-pensable barrier. Experimental Dermatology, 17(12):1063–1072, December 2008.
[3] David Verhoeven, Monica Nesselbush, and Michael E Pichichero. Lower nasopharyn-geal epithelial cell repair and diminished innate inflammation responses contribute to theonset of acute otitis media in otitis-prone children. Medical microbiology and immunol-
ogy, 202(4):295–302, August 2013.
[4] Elena Svirshchevskaya, Dmitrii Zubkov, Isabelle Mouyna, and Nadia Berkova. InnateImmunity and the Role of Epithelial Barrier During Aspergillus fumigatus Infection.Current immunology reviews, 8(3):254–261, August 2012.
[5] Ann M Carias, Scott McCoombe, Michael McRaven, Meegan Anderson, Nicole Gal-loway, Nathan Vandergrift, Angela J Fought, John Lurain, Maurice Duplantis, Ronald SVeazey, and Thomas J Hope. Defining the interaction of HIV-1 with the mucosal barriersof the female reproductive tract. Journal of virology, 87:11388–400, 2013.
[6] Laura Y McGirt and Lisa a Beck. Innate immune defects in atopic dermatitis. The
Journal of Allergy and Clinical Immunology, 118(1):202–8, July 2006.
[7] Peter M Elias and Matthias Schmuth. Abnormal Skin Barrier in the Etiopathogenesis ofAtopic Dermatitis. Current Allergy and Asthma Reports, 9:265–272, 2009.
[8] Peter M Elias and Martin Steinhoff. "Outside-to-inside" (and now back to "outside")pathogenic mechanisms in atopic dermatitis. Journal of Investigative Dermatology,128(5):1067–70, May 2008.
[9] Stephen J Galli, Mindy Tsai, and Adrian M Piliponsky. The development of allergicinflammation. Nature, 454(7203):445–54, July 2008.
178
[10] Martijn C Nawijn, Tillie L Hackett, Dirkje S Postma, Antoon J M van Oosterhout, andIrene H Heijink. E-cadherin: gatekeeper of airway mucosa and allergic sensitization.Trends in immunology, 32(6):248–55, June 2011.
[11] William Cookson. The immunogenetics of asthma and eczema: a new focus on theepithelium. Nature Reviews Immunology, 4(12):978–88, December 2004.
[12] Alexander N Greiner, Peter W Hellings, Guiseppina Rotiroti, and Glenis K Scadding.Allergic rhinitis. Lancet, 378(9809):2112–22, December 2011.
[13] Anna De Benedetto, Akiharu Kubo, and Lisa a Beck. Skin barrier disruption: a re-quirement for allergen sensitization? Journal of Investigative Dermatology, 132(3 Pt2):949–63, March 2012.
[14] Robert F Schwabe and Christian Jobin. The microbiome and cancer. Nature reviews.
Cancer, 13(11):800–12, 2013.
[15] Eran Elinav, Roni Nowarski, Christoph a Thaiss, Bo Hu, Chengcheng Jin, and Richard aFlavell. Inflammation-induced cancer: crosstalk between tumours, immune cells andmicroorganisms. Nature reviews. Cancer, 13(11):759–71, November 2013.
[16] Ruby Pawankar. Allergic diseases and asthma: a global public health concern and a callto action. The World Allergy Organization journal, 7(1):12, 2014.
[17] Lionel Fry. An atlas of atopic eczema. Parthenon, 2003.
[18] B Ehlken, M Möhrenschlager, B Kugland, K Berger, K Quednau, and Johannes Ring.[Cost-of-illness study in patients suffering from atopic eczema in Germany]. Der Hau-
tarzt; Zeitschrift für Dermatologie, Venerologie, und verwandte Gebiete, 56(12):1144–51, December 2005.
[19] N Wadonda-Kabondo, J A C Sterne, J Golding, C T C Kennedy, C B Archer, M G SDunnill, T H E Alspac, and Study Team. Epidemiology and Health Services Research Aprospective study of the prevalence and incidence of atopic dermatitis in children aged 0âAS 42 months. British Journal of Dermatology, 149:1023–1028, 2003.
[20] Edith N Nnoruka and Clin Derm Lond. Tropical medicine rounds Current epidemiologyof atopic dermatitis in south-eastern Nigeria. pages 739–744, 2004.
[21] World Health Organization. Measuring impact of Streptococcus pneumoniae andHaemophilus influenzae type b conjugate vaccination. Technical report, 2012.
179

[22] Farin Kamangar, Graça M. Dores, and William F. Anderson. Patterns of cancer inci-dence, mortality, and prevalence across five continents: Defining priorities to reducecancer disparities in different geographic regions of the world. Journal of Clinical On-
cology, 24(14):2137–2150, 2006.
[23] World Health Organization. Antimicrobial resistance: Fact sheet Number 194, 2014.
[24] Johannes Ring, a Alomar, T Bieber, Mette Deleuran, a Fink-Wagner, C Gelmetti,U Gieler, J Lipozencic, Thomas a Luger, a P Oranje, T Schäfer, T Schwennesen, S Sei-denari, D Simon, Sonja Ständer, G Stingl, S Szalai, J C Szepietowski, Alain Taïeb,Thomas Werfel, a. Wollenberg, and U Darsow. Guidelines for treatment of atopic eczema(atopic dermatitis) part I. Journal of the European Academy of Dermatology and Venere-
ology, 26(8):1045–60, August 2012.
[25] Alain Taïeb, Julien Seneschal, and M Djavad Mossalayi. Biologics in atopic dermatitis.Journal der Deutschen Dermatologischen Gesellschaft = Journal of the German Society
of Dermatology : JDDG, 10(Band 10):174–8, 2012.
[26] Jarin Chun and Alice S Prince. TLR2-induced calpain cleavage of epithelial junctionalproteins facilitates leukocyte transmigration. Cell host & microbe, 5(1):47–58, January2009.
[27] Akiharu Kubo, Keisuke Nagao, and Masayuki Amagai. Epidermal barrier dysfunctionand cutaneous sensitization in atopic diseases. The Journal of Clinical Investigation,122(2), 2012.
[28] Carolyn B Coyne, Miriam K Vanhook, Todd M Gambling, L Johnny, Richard C Boucher,Larry G Johnson, Chapel Hill, and North Carolina. Regulation of Airway Tight Junctionsby Proinflammatory Cytokines. Molecular Biology of the Cell, 13(September):3218–3234, 2002.
[29] François-Xavier Bernard, Franck Morel, Magalie Camus, Nathalie Pedretti, ChristineBarrault, Julien Garnier, and Jean-Claude Lecron. Keratinocytes under Fire of Proin-flammatory Cytokines: Bona Fide Innate Immune Cells Involved in the Physiopathologyof Chronic Atopic Dermatitis and Psoriasis. Journal of allergy, 2012:718725, January2012.
[30] Rachel L Zemans, Sean P Colgan, and Gregory P Downey. Transepithelial migrationof neutrophils: mechanisms and implications for acute lung injury. American journal of
respiratory cell and molecular biology, 40(5):519–35, May 2009.
180

[31] Alex C Chin and Charles A Parkos. Pathobiology of neutrophil transepithelial migration:implications in mediating epithelial injury. Annual Review of Pathology, 2:111–143,2007.
[32] Ryan F L O’Shaughnessy, Ishaan Choudhary, and John I Harper. Interleukin-1 alphablockade prevents hyperkeratosis in an in vitro model of lamellar ichthyosis. Human
molecular genetics, 19(13):2594–605, July 2010.
[33] Peter M Elias. Stratum corneum defensive functions: an integrated view. Journal of
Investigative Dermatology, 125(2):183–200, August 2005.
[34] Karin M Aberg, Mao-Qiang Man, Richard L Gallo, Tomas Ganz, Debra Crumrine, Bar-bara E Brown, Eung-Ho Choi, Dong-Kun Kim, Jens M Schröder, Kenneth R Feingold,and Peter M Elias. Co-regulation and interdependence of the mammalian epidermal per-meability and antimicrobial barriers. Journal of Investigative Dermatology, 128(4):917–25, April 2008.
[35] Nicolas Cenac, Alex C Chin, Rafael Garcia-Villar, Christel Salvador-Cartier, LaurentFerrier, Nathalie Vergnolle, André G Buret, Jean Fioramonti, and Lionel Bueno. PAR2activation alters colonic paracellular permeability in mice via IFN-gamma-dependentand -independent pathways. The Journal of physiology, 558(Pt 3):913–25, August 2004.
[36] Jacob P. Thyssen and Sanja Kezic. Causes of epidermal filaggrin reduction and their rolein the pathogenesis of atopic dermatitis. Journal of Allergy and Clinical Immunology,134(4):792–799, 2014.
[37] I-Hsin Kuo, Amanda Carpenter-Mendini, Takeshi Yoshida, Laura Y McGirt, Andrei IIvanov, Kathleen C Barnes, Richard L Gallo, Andrew W Borkowski, Kenshi Yamasaki,Donald Y Leung, Steve N Georas, Anna De Benedetto, and Lisa a Beck. Activationof Epidermal Toll-Like Receptor 2 Enhances Tight Junction Function: Implications forAtopic Dermatitis and Skin Barrier Repair. The Journal of investigative dermatology,pages 1–11, December 2012.
[38] Thomas B Clarke, Nicholas Francella, Alyssa Huegel, and Jeffrey N Weiser. Invasivebacterial pathogens exploit TLR-mediated downregulation of tight junction componentsto facilitate translocation across the epithelium. Cell host & microbe, 9(5):404–14, May2011.
[39] Hamida Hammad and Bart N Lambrecht. Dendritic cells and epithelial cells: linkinginnate and adaptive immunity in asthma. Nature Reviews Immunology, 8(3):193–204,March 2008.
181

[40] Michael J Cork, Darren a Robinson, Yiannis Vasilopoulos, Adam Ferguson, ManarMoustafa, Alice L Macgowan, Gordon W Duff, Simon J Ward, and Rachid Tazi-Ahnini. New perspectives on epidermal barrier dysfunction in atopic dermatitis: gene-environment interactions. The Journal of Allergy and Clinical Immunology, 118(1):3–21; quiz 22–3, July 2006.
[41] Judith G M Bergboer, Patrick L J M Zeeuwen, and Joost Schalkwijk. Genetics of pso-riasis: evidence for epistatic interaction between skin barrier abnormalities and immunedeviation. Journal of Investigative Dermatology, 132(10):2320–1, October 2012.
[42] Donata Vercelli. Discovering susceptibility genes for asthma and allergy. Nature reviews.
Immunology, 8(3):169–82, March 2008.
[43] Gráinne M O’Regan, Aileen Sandilands, W H Irwin McLean, and Alan D Irvine. Filag-grin in atopic dermatitis. The Journal of Allergy and Clinical Immunology, 122(4):689–93, October 2008.
[44] S Chavanas, C Bodemer, A Rochat, D Hamel-Teillac, M Ali, Alan D Irvine, J L Bonafé,J Wilkinson, Alain Taïeb, Yann Barrandon, John I Harper, Y de Prost, and A Hovnanian.Mutations in SPINK5, encoding a serine protease inhibitor, cause Netherton syndrome.Nature Genetics, 25(2):141–2, June 2000.
[45] Magali Savignac, Anissa Edir, Marina Simon, and Alain Hovnanian. Darier disease : adisease model of impaired calcium homeostasis in the skin. Biochimica et biophysica
acta, 1813(5):1111–7, May 2011.
[46] Irit Nachtigall, Andrey Tamarkin, Sascha Tafelski, Andreas Weimann, Andreas Roth-bart, Susanne Heim, Klaus D Wernecke, and Claudia Spies. Polymorphisms of thetoll-like receptor 2 and 4 genes are associated with faster progression and a more severecourse of sepsis in critically ill patients. The Journal of international medical research,42(1):93–110, March 2014.
[47] Barbara S Baker. The role of microorganisms in atopic dermatitis. Clinical and experi-
mental immunology, 144(1):1–9, April 2006.
[48] Marsha Wills-karp, Joanna Santeliz, and Christopher L Karp. revisiting the hygienehypothesis. Nature Reviews Immunology, 1(October):69–75, 2001.
[49] Daniel H Kaplan, Botond Z Igyártó, and Anthony a Gaspari. Early immune events inthe induction of allergic contact dermatitis. Nature reviews. Immunology, 12(2):114–24,February 2012.
182

[50] Peter M Elias and Joan S. Wakefield. Therapeutic implications of a barrier-based patho-genesis of atopic dermatitis. Clinical Reviews in Allergy and Immunology, 41(3):282–295, 2011.
[51] Iu Lazebnik. Can a biologist fix a radio, or what I learned while studying apoptosis.Biochemistry, 12(12):166–71, January 2003.
[52] Olaf Wolkenhauer and Sara Green. The search for organizing principles as a cure againstreductionism in systems medicine. The FEBS journal, 280(23):5938–48, December2013.
[53] Yoram Vodovotz, Gary An, and Ioannis P Androulakis. A Systems Engineering Per-spective on Homeostasis and Disease. Frontiers in bioengineering and biotechnology,1(September):6, 2013.
[54] Mark D. a. van Logtestijn, Elisa Domínguez-Hüttinger, Georgios N. Stamatas, andReiko J. Tanaka. Resistance to Water Diffusion in the Stratum Corneum Is Depth-Dependent. Plos One, 10:e0117292, 2015.
[55] Shinji Nakaoka and Kazuyuki Aihara. Stochastic simulation of structured skin cell pop-ulation dynamics. Journal of mathematical biology, pages 1–7, December 2012.
[56] Niels Grabe and Karsten Neuber. A multicellular systems biology model predictsepidermal morphology, kinetics and Ca2+ flow. Bioinformatics (Oxford, England),21(17):3541–7, September 2005.
[57] Thomas Sütterlin, Simone Huber, Hartmut Dickhaus, and Niels Grabe. Modeling multi-cellular behavior in epidermal tissue homeostasis via finite state machines in multi-agentsystems. Bioinformatics (Oxford, England), 25(16):2057–63, August 2009.
[58] Thomas Sütterlin, Christoph Kolb, Hartmut Dickhaus, Dirk Jäger, and Niels Grabe.Bridging the scales: semantic integration of quantitative SBML in graphical multi-cellular models and simulations with EPISIM and COPASI. Bioinformatics (Oxford,
England), 29(2):223–9, January 2013.
[59] Paul a Orlando, Joel S Brown, Robert a Gatenby, and Anna R Guliano. The ecologyof human papillomavirus-induced epithelial lesions and the role of somatic evolution intheir progression. The Journal of infectious diseases, 208(3):394–402, August 2013.
[60] I M M van Leeuwen, H M Byrne, O E Jensen, and J R King. Crypt dynamics andcolorectal cancer: advances in mathematical modelling. Cell proliferation, 39(3):157–81, June 2006.
183

[61] Philip J Murray, Jun-Won Kang, Gary R Mirams, Sung-Young Shin, Helen M Byrne,Philip K Maini, and Kwang-Hyun Cho. Modelling spatially regulated beta-catenin dy-namics and invasion in intestinal crypts. Biophysical journal, 99(3):716–25, August2010.
[62] Tao Zheng, Jinho Yu, Min Hee Oh, and Zhou Zhu. The atopic march: progressionfrom atopic dermatitis to allergic rhinitis and asthma. Allergy, asthma & immunology
research, 3(2):67–73, April 2011.
[63] Ting Seng Tang, Thomas Bieber, and Hywel C Williams. Are the concepts of inductionof remission and treatment of subclinical inflammation in atopic dermatitis clinicallyuseful ? Journal of Allergy and Clinical Immunology, pages 1–12, 2012.
[64] S G Danby, J Chittock, K Brown, L H Albenali, and M J Cork. The effect of tacrolimuscompared to betamethasone valerate on the skin barrier in volunteers with quiescentatopic dermatitis. The British journal of dermatology, 170:914–921, 2014.
[65] Stefanie Schoepe, Heike Schäcke, Ekkehard May, and Khusru Asadullah. Glucocorti-coid therapy-induced skin atrophy. Experimental Dermatology, 15(5):406–420, 2006.
[66] David a. Norris. Mechanisms of action of topical therapies and the rationale for combi-nation therapy. Journal of the American Academy of Dermatology, 53:17–25, 2005.
[67] Peter M Elias. The skin barrier as an innate immune element. Seminars in Im-
munopathology, 29(1):3–14, March 2007.
[68] Christoph Beisswenger, Carolyn B Coyne, Mikhail Shchepetov, and Jeffrey N Weiser.Role of p38 MAP kinase and transforming growth factor-beta signaling in transepithe-lial migration of invasive bacterial pathogens. The Journal of biological chemistry,282(39):28700–8, September 2007.
[69] Jonathan a McCullers. The co-pathogenesis of influenza viruses with bacteria in thelung. Nature reviews. Microbiology, 12(4):252–62, 2014.
[70] Anna De Benedetto, Ritesh Agnihothri, Laura Y McGirt, Lora G Bankova, and Lisa aBeck. Atopic dermatitis: a disease caused by innate immune defects? The Journal of
Investigative Dermatology, 129(1):14–30, January 2009.
[71] Alex C Chin, Winston Y Lee, Asma Nusrat, Nathalie Vergnolle, and Charles a Parkos.Neutrophil-mediated activation of epithelial protease-activated receptors-1 and -2 regu-lates barrier function and transepithelial migration. Journal of immunology (Baltimore,
Md. : 1950), 181(8):5702–10, October 2008.
184

[72] Charles A Parkos, S P Colgan, C Delp, M a Arnaout, and James L Madara. Neutrophilmigration across a cultured epithelial monolayer elicits a biphasic resistance responserepresenting sequential effects on transcellular and paracellular pathways. The Journal
of cell biology, 117(4):757–64, May 1992.
[73] Padraic G Fallon, Takashi Sasaki, Aileen Sandilands, Linda E Campbell, Sean P Saun-ders, Niamh E Mangan, John J Callanan, Hiroshi Kawasaki, Aiko Shiohama, AkiharuKubo, John P Sundberg, Richard B Presland, Philip Fleckman, Nobuyoshi Shimizu, JunKudoh, Alan D Irvine, Masayuki Amagai, and W H Irwin McLean. A homozygousframeshift mutation in the mouse Flg gene facilitates enhanced percutaneous allergenpriming. Nature Genetics, 41(5):602–8, May 2009.
[74] Alain Hovnanian. Netherton syndrome: skin inflammation and allergy by loss of pro-tease inhibition. Cell and tissue research, 351(2):289–300, February 2013.
[75] D Roedl, C Traidl-Hoffmann, Johannes Ring, H Behrendt, and M Braun-Falco. Serineprotease inhibitor lymphoepithelial Kazal type-related inhibitor tends to be decreased inatopic dermatitis. Journal of the European Academy of Dermatology and Venereology,23(11):1263–6, November 2009.
[76] Nahoko Komatsu, Kiyofumi Saijoh, Cynthia Kuk, Amber C Liu, Saba Khan, FumiakiShirasaki, Kazuhiko Takehara, and Eleftherios P Diamandis. Human tissue kallikreinexpression in the stratum corneum and serum of atopic dermatitis patients. Experimental
Dermatology, 16:513–519, 2007.
[77] T Terui, T Hirao, Y Sato, T Uesugi, M Honda, M Iguchi, N Matsumura, K Kudoh,S Aiba, and H Tagami. An increased ratio of interleukin-1 receptor antagonist tointerleukin-1alpha in inflammatory skin diseases. Experimental dermatology, 7(6):327–34, December 1998.
[78] Arnaud Didierlaurent, John Goulding, Seema Patel, Robert Snelgrove, Lionel Low, Ma-gali Bebien, Toby Lawrence, Leonie S van Rijt, Bart N Lambrecht, Jean-Claude Sirard,and Tracy Hussell. Sustained desensitization to bacterial Toll-like receptor ligands af-ter resolution of respiratory influenza infection. The Journal of experimental medicine,205(2):323–329, 2008.
[79] Charles N. Ellis, Lynn a. Drake, Mary M. Prendergast, William Abramovits, Mark Bo-guniewicz, C. Ralph Daniel, Mark Lebwohl, Seth R. Stevens, Diane L. Whitaker-Worth,J. Wang Cheng, and Kuo B. Tong. Cost of atopic dermatitis and eczema in the UnitedStates. Journal of the American Academy of Dermatology, 46:361–370, 2002.
185

[80] Anthony J Mancini, Kellee Kaulback, and Sarah L Chamlin. The socioeconomic impactof atopic dermatitis in the United States: a systematic review. Pediatric dermatology,25(1):1–6, 2008.
[81] Donald Y M Leung, Mark Boguniewicz, Michael D Howell, Ichiro Nomura, andQutayba A Hamid. Science in Medicine: New insights into atopic dermatitis. The
Journal of Clinical Investigation, 113:651–657, 2004.
[82] Donald Y M Leung and Emma Guttman-yassky. Deciphering the complexities of atopicdermatitis : Shifting paradigms in treatment approaches. Journal of Allergy and Clinical
Immunology, 134(4):769–779, 2015.
[83] Reiko J Tanaka and Masahiro Ono. Skin Disease Modeling from a Mathematical Per-spective. Journal of Investigative Dermatology, 133(6):1472–1478, 2013.
[84] Reiko J Tanaka, Masahiro Ono, and Heather a Harrington. Skin barrier homeostasisin atopic dermatitis: feedback regulation of kallikrein activity. PloS one, 6(5):e19895,January 2011.
[85] K Lagrou, W E Peetermans, J Verhaegen, M Jorissen, and J Van Eldere. Disruptionof nasopharyngeal epithelium by pneumococci is density-linked. European journal of
clinical investigation, 33(4):340–5, April 2003.
[86] Shirin Nash, Joan Stafford, and James L Madara. Effects of Polymorphonuclear Leuko-cyte Transmigration of Cultured Intestinal Epithelial Monolayers. The Journal of Clini-
cal Investigation, 80(October):1104–1113, 1987.
[87] Asma Nusrat, Charles A Parkos, T W Liang, D K Carnes, and James L Madara. Neu-trophil migration across model intestinal epithelia: monolayer disruption and subsequentevents in epithelial repair. Gastroenterology, 113(5):1489–500, November 1997.
[88] Emily Patricia Dick, Lynne Rebecca Prince, and Ian Sabroe. Ex vivo-expanded bonemarrow CD34+ derived neutrophils have limited bactericidal ability. Stem cells (Dayton,
Ohio), 26(10):2552–63, October 2008.
[89] Alistair J Standish and Jeffrey N Weiser. Human neutrophils kill Streptococcus pneumo-niae via serine proteases. Journal of immunology (Baltimore, Md. : 1950), 183(4):2602–9, August 2009.
[90] Arturo Casadevall and Liise-anne Pirofski. The damage-response framework of micro-bial pathogenesis. Nature reviews. Microbiology, 1(1):17–24, October 2003.
186

[91] Amber M Smith, Jonathan a McCullers, and Frederick R Adler. Mathematical modelof a three-stage innate immune response to a pneumococcal lung infection. Journal of
theoretical biology, 276(1):106–16, May 2011.
[92] Sourya Shrestha, Betsy Foxman, Suzanne Dawid, Allison E Aiello, Brian M Davis,Joshua Berus, and Pejman Rohani. Time and dose-dependent risk of pneumococcalpneumonia following influenza : a model for within-host interaction between influenzaand Streptococcus pneumoniae. Interface Focus, 10:20130233, 2013.
[93] Ericka Mochan, David Swigon, Bard Ermentrout, Sarah Lukens, and Gilles Clermont.A mathematical model of intrahost pneumococcal pneumonia infection dynamics inmurine strains. Journal of Theoretical Biology, 353:44–54, 2014.
[94] Amber M Smith, Frederick R Adler, Ruy M Ribeiro, Ryan N Gutenkunst, Julie LMcAuley, Jonathan a McCullers, and Alan S Perelson. Kinetics of coinfection with in-fluenza A virus and Streptococcus pneumoniae. PLoS pathogens, 9(3):e1003238, March2013.
[95] Samir Mitragotri, Yuri G Anissimov, Annette L Bunge, H Frederick Frasch, Richard HGuy, Jonathan Hadgraft, Gerald B Kasting, Majella E Lane, and Michael S Roberts.Mathematical models of skin permeability: an overview. International journal of phar-
maceutics, 418(1):115–29, October 2011.
[96] Sophie C Weatherhead, Peter M Farr, David Jamieson, Jennifer S Hallinan, James JLloyd, Anil Wipat, and Nick J Reynolds. Keratinocyte Apoptosis in Epidermal Remod-eling and Clearance of Psoriasis Induced by UV Radiation. Journal of Investigative
Dermatology, 131(9):1916–1926, 2011.
[97] Niels Grabe and Karsten Neuber. Simulating psoriasis by altering transit amplifyingcells. Bioinformatics, 23(11):1309–1312, 2007.
[98] Anna Ougrinovskaia, Rosemary S Thompson, and Mary R Myerscough. An ODE modelof early stages of atherosclerosis: mechanisms of the inflammatory response. Bulletin of
mathematical biology, 72(6):1534–61, August 2010.
[99] Najl V Valeyev, Christian Hundhausen, Yoshinori Umezawa, Nikolay V Kotov, GarethWilliams, Alex Clop, Crysanthi Ainali, Christos Ouzounis, Sophia Tsoka, and Frank ONestle. A systems model for immune cell interactions unravels the mechanism of inflam-mation in human skin. PLoS computational biology, 6(12):e1001024, January 2010.
[100] Lisa J W Hite, Ynte H S Chukken, Belgin D Ogan, Laura G Reen, Mike J C Happell, andGraham F M Edley. Modelling the dynamics of intramammary E . coli infections in dairy
187

cows : understanding mechanisms that distinguish transient from persistent infections.Veterinary Research, 41(13), 2010.
[101] Denise E Kirschner and M J Blaser. The dynamics of Helicobacter pylori infection ofthe human stomach. Journal of theoretical biology, 176(2):281–90, September 1995.
[102] Angela Reynolds, Jonathan Rubin, Gilles Clermont, Judy Day, Yoram Vodovotz, andG Bard Ermentrout. A reduced mathematical model of the acute inflammatory response:I. Derivation of model and analysis of anti-inflammation. Journal of theoretical biology,242(1):220–36, September 2006.
[103] Rukmini Kumar, Gilles Clermont, Yoram Vodovotz, and Carson C Chow. The dynamicsof acute inflammation. Journal of theoretical biology, 230:145–155, 2004.
[104] Baris Hancioglu, David Swigon, and Gilles Clermont. A dynamical model of human im-mune response to influenza A virus infection. Journal of theoretical biology, 246(1):70–86, May 2007.
[105] Hongyu Miao, Joseph a Hollenbaugh, Martin S Zand, Jeanne Holden-Wiltse, Tim RMosmann, Alan S Perelson, Hulin Wu, and David J Topham. Quantifying the earlyimmune response and adaptive immune response kinetics in mice infected with influenzaA virus. Journal of virology, 84(13):6687–98, July 2010.
[106] Giao T Huynh and Frederick R Adler. Alternating host cell tropism shapes the persis-tence, evolution and coexistence of epstein-barr virus infections in human. Bulletin of
mathematical biology, 73(8):1754–73, August 2011.
[107] Richard Howey, Melvyn Quan, Nicholas J Savill, Louise Matthews, Sø ren Alexander-sen, and Mark Woolhouse. Effect of the initial dose of foot-and-mouth disease virus onthe early viral dynamics within pigs. Journal of the Royal Society, Interface / the Royal
Society, 6(39):835–47, October 2009.
[108] Katherine Wendelsdorf, Josep Bassaganya-Riera, Raquel Hontecillas, and Stephen Eu-bank. Model of colonic inflammation: immune modulatory mechanisms in inflammatorybowel disease. Journal of theoretical biology, 264(4):1225–39, June 2010.
[109] Wing-Cheong Lo, Edward W Martin, Charles L Hitchcock, and Avner Friedman. Mathe-matical model of colitis-associated colon cancer. Journal of theoretical biology, 317:20–9, January 2013.
188

[110] Carla a Borgoño, Iacovos P Michael, Nahoko Komatsu, Arumugam Jayakumar, RaviKapadia, Gary L Clayman, Georgia Sotiropoulou, and Eleftherios P Diamandis. A po-tential role for multiple tissue kallikrein serine proteases in epidermal desquamation.The Journal of Biological Chemistry, 282(6):3640–52, February 2007.
[111] Anaïs Briot, Céline Deraison, Matthieu Lacroix, Chrystelle Bonnart, Aurélie Robin,Céline Besson, Pierre Dubus, and Alain Hovnanian. Kallikrein 5 induces atopicdermatitis-like lesions through PAR2-mediated thymic stromal lymphopoietin expres-sion in Netherton syndrome. The Journal of experimental medicine, 206(5):1135–47,May 2009.
[112] Jörg Buddenkotte, Christopher Stroh, Ingo H Engels, Corinna Moormann, Victoria MShpacovitch, Stephan Seeliger, Nathalie Vergnolle, Dietmar Vestweber, Thomas a Luger,Klaus Schulze-Osthoff, and Martin Steinhoff. Agonists of proteinase-activated receptor-2 stimulate upregulation of intercellular cell adhesion molecule-1 in primary human ker-atinocytes via activation of NF-kappa B. The Journal of Investigative Dermatology,124(1):38–45, January 2005.
[113] Jean-Pierre Hachem, Debra Crumrine, Joachim W Fluhr, Barbara E Brown, Kenneth RFeingold, and Peter M Elias. pH directly regulates epidermal permeability barrier home-ostasis, and stratum corneum integrity/cohesion. The Journal of Investigative Dermatol-
ogy, 121(2):345–53, August 2003.
[114] Henrik Dommisch, Whasun O Chung, Maryam G Rohani, David Williams, Minnie Ran-garajan, Mike a Curtis, and Beverly a Dale. Protease-activated receptor 2 mediates hu-man beta-defensin 2 and CC chemokine ligand 20 mRNA expression in response to pro-teases secreted by Porphyromonas gingivalis. Infection and immunity, 75(9):4326–33,September 2007.
[115] Georgia Sotiropoulou, Georgios Pampalakis, and Eleftherios P Diamandis. Functionalroles of human kallikrein-related peptidases. The Journal of biological chemistry,284(48):32989–94, November 2009.
[116] Toby Lawrence. Inflammation and cancer: a failure of resolution? Trends in pharmaco-
logical sciences, 28(4):162–5, April 2007.
[117] Eleonora Candi, Rainer Schmidt, and Gerry Melino. The cornified envelope: a model ofcell death in the skin. Nature reviews. Molecular cell biology, 6(4):328–40, April 2005.
[118] Kathi C. Madison. Barrier Function of the Skin: âAŸâAŸLa Raison dâAZEtreâAZâAZof the Epidermis. Journal of Investigative Dermatology, 121:231–241, 2003.
189

[119] Jean-Pierre Hachem, Evi Houben, Debra Crumrine, Mao-Quiang Man, Nanna YSchurer, Truus Roelandt, Eung-Ho Choi, Yoshikazu Uchida, Barbara E Brown, Ken-neth R Feingold, and Peter M Elias. Serine protease signaling of epidermal permeabilitybarrier homeostasis. Journal of Investigative Dermatology, 126(9):2074–86, September2006.
[120] I-Hsin Kuo, Takeshi Yoshida, Anna De Benedetto, and Lisa a Beck. The cutaneousinnate immune response in patients with atopic dermatitis. The Journal of Allergy and
Clinical Immunology, 131(2):266–78, February 2013.
[121] Hannah J Gould and Brian J Sutton. IgE in allergy and asthma today. Nature reviews.
Immunology, 8(3):205–17, March 2008.
[122] Ehsan Aliahmadi, Robert Gramlich, Andreas Grützkau, Manuel Hitzler, MelanieKrüger, Ria Baumgrass, Maximilian Schreiner, Burghardt Wittig, Reinhard Wanner, andMatthias Peiser. TLR2-activated human langerhans cells promote Th17 polarization viaIL-1beta, TGF-beta and IL-23. European journal of immunology, 39(5):1221–30, May2009.
[123] Lennart Hansson, Assar Bäckman, Annelii Ny, Michael Edlund, Elisabeth Ekholm, Bar-bro Ekstrand Hammarström, Jan Törnell, Pia Wallbrandt, Hå kan Wennbo, and Torb-jörn Egelrud. Epidermal overexpression of stratum corneum chymotryptic enzyme inmice: a model for chronic itchy dermatitis. The Journal of Investigative Dermatology,118(3):444–9, March 2002.
[124] Michael J Cork, Simon G Danby, Yiannis Vasilopoulos, Jonathan Hadgraft, Majella ELane, Manar Moustafa, Richard H Guy, Alice L Macgowan, Rachid Tazi-Ahnini, and Si-mon J Ward. Epidermal barrier dysfunction in atopic dermatitis. Journal of Investigative
Dermatology, 129(8):1892–908, August 2009.
[125] Maeve a McAleer and Alan D Irvine. The multifunctional role of filaggrin in allergicskin disease. The Journal of Allergy and Clinical Immunology, 131(2):280–91, February2013.
[126] Sara J Brown, Karin Kroboth, Aileen Sandilands, Linda E Campbell, Elizabeth Pohler,Sanja Kezic, Heather J Cordell, W H Irwin McLean, and Alan D Irvine. Intragenic copynumber variation within filaggrin contributes to the risk of atopic dermatitis with a dose-dependent effect. The Journal of Investigative Dermatology, 132(1):98–104, January2012.
190

[127] Colin N a Palmer, Alan D Irvine, Ana Terron-Kwiatkowski, Yiwei Zhao, Haihui Liao,Simon P Lee, David R Goudie, Aileen Sandilands, Linda E Campbell, Frances J DSmith, Gráinne M O’Regan, Rosemarie M Watson, Jo E Cecil, Sherri J Bale, John GCompton, John J DiGiovanna, Philip Fleckman, Sue Lewis-Jones, Gehan Arseculeratne,Ann Sergeant, Colin S Munro, Brahim El Houate, Ken McElreavey, Liselotte B Halk-jaer, Hans Bisgaard, Somnath Mukhopadhyay, and W H Irwin McLean. Common loss-of-function variants of the epidermal barrier protein filaggrin are a major predisposingfactor for atopic dermatitis. Nature genetics, 38(4):441–6, April 2006.
[128] Maria Brattsand, Kristina Stefansson, Christine Lundh, Ylva Haasum, and TorbjörnEgelrud. A proteolytic cascade of kallikreins in the stratum corneum. The Journal
of Investigative Dermatology, 124(1):198–203, January 2005.
[129] Heidi H Kong, Julia Oh, Clay Deming, Sean Conlan, Elizabeth a Grice, Melony Beatson,Effie Nomicos, Eric Polley, Hirsh D Komarow, Nisc Comparative Sequence Program,Patrick R Murray, Maria L Turner, and Julia a Segre. Temporal shifts in the skin micro-biome associated with atopic dermatitis disease flares and treatment. Genome research,pages 850–859, February 2012.
[130] Sang Eun Lee, Ji-Min Kim, Se Kyoo Jeong, Jeong Eun Jeon, Hyun-Ju Yoon, Min-KyungJeong, and Seung Hun Lee. Protease-activated receptor-2 mediates the expression ofinflammatory cytokines, antimicrobial peptides, and matrix metalloproteinases in ker-atinocytes in response to Propionibacterium acnes. Archives of dermatological research,302(10):745–56, December 2010.
[131] Ikue Nemoto-Hasebe, Masashi Akiyama, Toshifumi Nomura, Aileen Sandilands,W H Irwin McLean, and Hiroshi Shimizu. Clinical severity correlates with impairedbarrier in filaggrin-related eczema. Journal of Investigative Dermatology, 129(3):682–689, 2009.
[132] Tiffany C Scharschmidt, Mao-Qiang Man, Yutaka Hatano, Debra Crumrine, RoshanGunathilake, John P Sundberg, Kathleen a Silva, Theodora M Mauro, Melanie Hupe,Soyun Cho, Yan Wu, Anna Celli, Matthias Schmuth, Kenneth R Feingold, and Peter MElias. Filaggrin deficiency confers a paracellular barrier abnormality that reduces in-flammatory thresholds to irritants and haptens. The Journal of Allergy and Clinical
Immunology, 124(3):496–506, 506.e1–6, September 2009.
[133] Kevin O Kisich, Charles W Carspecken, Stephanie Fiéve, Mark Boguniewicz, and Don-ald Y M Leung. Defective killing of Staphylococcus aureus in atopic dermatitis is asso-
191

ciated with reduced mobilization of human beta-defensin-3. The Journal of Allergy and
Clinical Immunology, 122(1):62–8, July 2008.
[134] Emma Guttman-Yassky, Mayte Suárez-Fariñas, Andrea Chiricozzi, Kristine E Nograles,Avner Shemer, Judilyn Fuentes-Duculan, Irma Cardinale, Peng Lin, Reuven Bergman,Anne M Bowcock, and James G Krueger. Broad defects in epidermal cornificationin atopic dermatitis identified through genomic analysis. The Journal of Allergy and
Clinical Immunology, 124(6):1235–1244.e58, December 2009.
[135] Mayte Suárez-Fariñas, Suzanne J Tintle, Avner Shemer, Andrea Chiricozzi, Kristine ENograles, Irma Cardinale, Shenghui Duan, Anne M Bowcock, James G Krueger, andEmma Guttman-Yassky. Nonlesional atopic dermatitis skin is characterized by broadterminal differentiation defects and variable immune abnormalities. The Journal of Al-
lergy and Clinical Immunology, 127(4):954–64.e1–4, April 2011.
[136] Aileen Sandilands, Calum Sutherland, Alan D Irvine, and W H Irwin McLean. Filaggrinin the frontline: role in skin barrier function and disease. Journal of cell science, 122(Pt9):1285–94, May 2009.
[137] Kristine E Nograles, L C Zaba, Emma Guttman-Yassky, Judilyn Fuentes-Duculan,Mayte Suárez-Fariñas, I Cardinale, a Khatcherian, J Gonzalez, K C Pierson, T R White,C Pensabene, I Coats, I Novitskaya, M a Lowes, and James G Krueger. Th17 cytokinesinterleukin (IL)-17 and IL-22 modulate distinct inflammatory and keratinocyte-responsepathways. The British journal of dermatology, 159(5):1092–102, November 2008.
[138] Michael D Howell, Byung Eui Kim, Peisong Gao, Audrey V Grant, Mark Boguniewicz,Anna Debenedetto, Lynda Schneider, Lisa a Beck, Kathleen C Barnes, and Donald Y MLeung. Cytokine modulation of atopic dermatitis filaggrin skin expression. The Journal
of Allergy and Clinical Immunology, 120(1):150–5, July 2007.
[139] Marianne Demerjian, Jean-Pierre Hachem, Erwin Tschachler, Geertrui Denecker, WimDeclercq, Peter Vandenabeele, Theodora M Mauro, Melanie Hupe, Debra Crumrine,Truus Roelandt, Evi Houben, Peter M Elias, and Kenneth R Feingold. Acute modula-tions in permeability barrier function regulate epidermal cornification: role of caspase-14 and the protease-activated receptor type 2. The American Journal of Pathology,172(1):86–97, January 2008.
[140] Peter M Elias, Sung Ku Ahn, Mitsuhiro Denda, Barbara E Brown, Debra Crumrine,Llewellyn K Kimutai, Laszlo Kömüves, Seung Hun Lee, and Kenneth R Feingold. Mod-ulations in epidermal calcium regulate the expression of differentiation-specific markers.Journal of Investigative Dermatology, 119(5):1128–36, November 2002.
192

[141] Peter M Elias, Sung Ku Ahn, BarbaraE Brown, Debra Crumrine, and Kenneth R Fein-gold. Origin of the epidermal calcium gradient: regulation by barrier status and role ofactive vs passive mechanisms. Journal of Investigative Dermatology, 119(6):1269–74,December 2002.
[142] Chia-Ling Tu, Debra Crumrine, Mao-Qiang Man, Wenhan Chang, Hashem Elalieh,Michael You, Peter M Elias, and Daniel D Bikle. Ablation of the calcium-sensing re-ceptor in keratinocytes impairs epidermal differentiation and barrier function. Journal
of Investigative Dermatology, 132(10):2350–9, October 2012.
[143] Frank O Nestle, Paola Di Meglio, Jian-Zhong Qin, and Brian J Nickoloff. Skin immunesentinels in health and disease. Nature reviews. Immunology, 9(10):679–91, October2009.
[144] Georgia Sotiropoulou and Georgios Pampalakis. Kallikrein-related peptidases: bridgesbetween immune functions and extracellular matrix degradation. Biological chemistry,391(4):321–31, April 2010.
[145] Cécile Caubet, Nathalie Jonca, Maria Brattsand, Marina Guerrin, Dominique Bernard,Rainer Schmidt, Torbjörn Egelrud, Michel Simon, and Guy Serre. Degrada-tion of corneodesmosome proteins by two serine proteases of the kallikrein fam-ily, SCTE/KLK5/hK5 and SCCE/KLK7/hK7. Journal of Investigative Dermatology,122(5):1235–1244, 2004.
[146] Jocelyn M. Biagini Myers, Lisa J. Martin, Melinda Butsch Kovacic, Tesfaye B. Mersha,Hua He, Valentina Pilipenko, Mark a. Lindsey, Mark B. Ericksen, David I. Bernstein,Grace K. LeMasters, James E. Lockey, and Gurjit K. Khurana Hershey. Epistasis be-tween serine protease inhibitor Kazal-type 5 (SPINK5) and thymic stromal lymphopoi-etin (TSLP) genes contributes to childhood asthma. Journal of Allergy and Clinical
Immunology, 134(4):891–899.e3, 2014.
[147] Ulrich Auf dem Keller, Anna Prudova, Ulrich Eckhard, Barbara Fingleton, and Christo-pher M Overall. Systems-level analysis of proteolytic events in increased vascu-lar permeability and complement activation in skin inflammation. Science signaling,6(258):rs2, January 2013.
[148] Kenshi Yamasaki, Kimberly Kanada, Daniel T Macleod, Andrew W Borkowski, ShinMorizane, Teruaki Nakatsuji, Anna L Cogen, and Richard L Gallo. TLR2 expres-sion is increased in rosacea and stimulates enhanced serine protease production by ker-atinocytes. Journal of Investigative Dermatology, 131(3):688–97, March 2011.
193

[149] R. Voegeli, A V Rawlings, S. Doppler, and T. Schreier. Increased basal transepider-mal water loss leads to elevation of some but not all stratum corneum serine proteases.International Journal of Cosmetic Science, 30(6):435–42, December 2008.
[150] G Grubauer, Peter M Elias, and Kenneth R Feingold. Transepidermal water loss: the sig-nal for recovery of barrier structure and function. Journal of lipid research, 30(3):323–33, March 1989.
[151] Gopinathan K Menon, Kenneth R Feingold, Arthur H Moser, Barbara E Brown, andPeter M Elias. De novo sterologenesis in the skin. II. Regulation by cutaneous barrierrequirements. Journal of lipid research, 26(5):418–427, 1985.
[152] Catarina Rosado, Pedro Pinto, and Luis Monteiro Rodrigues. Modeling TEWL-desorption curves: a new practical approach for the quantitative in vivo assessment ofskin barrier. Experimental dermatology, 14(5):386–90, May 2005.
[153] Giampiero Pietrocola, Carla Renata Arciola, Simonetta Rindi, Antonella Di Poto, An-tonino Missineo, Lucio Montanaro, and Pietro Speziale. Toll-like receptors (TLRs) ininnate immune defense against Staphylococcus aureus. The International journal of
artificial organs, 34:799–810, 2011.
[154] John E Sims and Dirk E Smith. The IL-1 family: regulators of immunity. Nature Reviews
Immunology, 10(2):89–102, February 2010.
[155] Prasad Rallabhandi, Quan M Nhu, Vladimir Y Toshchakov, Wenji Piao, Andrei EMedvedev, Morley D Hollenberg, Alessio Fasano, and Stefanie N Vogel. Analysis ofproteinase-activated receptor 2 and TLR4 signal transduction: a novel paradigm for re-ceptor cooperativity. The Journal of Biological Chemistry, 283(36):24314–25, Septem-ber 2008.
[156] Stephan Seeliger, Cllaudia K Derian, Nathalie Vergnolle, Nigel W Bunnett, RomanNawroth, Martin Schmelz, Pierre-Yves Von Der Weid, Jörg Buddenkotte, Cord Sun-derkötter, Dieter Metze, Patricia. Andrade-Gordon, Erik Harms, Dietmar Vestweber,Thomas a Luger, and Martin Steinhoff. Proinflammatory role of proteinase-activatedreceptor-2 in humans and mice during cutaneous inflammation in vivo. FASEB journal
: official publication of the Federation of American Societies for Experimental Biology,17(13):1871–85, October 2003.
[157] E R Sharlow, C S Paine, L Babiarz, M Eisinger, S Shapiro, and M Seiberg. The protease-activated receptor-2 upregulates keratinocyte phagocytosis. Journal of Cell Science,113:3093–101, September 2000.
194

[158] Bart N Lambrecht and Hamida Hammad. The role of dendritic and epithelial cells asmaster regulators of allergic airway inflammation. Lancet, 376(9743):835–43, Septem-ber 2010.
[159] Jyoti Das, Chang-hung Chen, Liyan Yang, Lauren Cohn, Prabir Ray, and Anuradha Ray.A critical role for NF- κ B in Gata3 expression and T H 2 differentiation in allergicairway inflammation. Nature, 2(1), 2001.
[160] Julia K Gittler, Avner Shemer, Mayte Suárez-Fariñas, Judilyn Fuentes-Duculan, Kara JGulewicz, Claire Q F Wang, Hiroshi Mitsui, Irma Cardinale, Cristina de Guzman Strong,James G Krueger, and Emma Guttman-Yassky. Progressive activation of T(H)2/T(H)22cytokines and selective epidermal proteins characterizes acute and chronic atopic der-matitis. The Journal of Allergy and Clinical Immunology, 130(6):1344–54, December2012.
[161] Louise Newell, Marta E Polak, Jay Perera, Charlotte Owen, Peter Boyd, ChristopherPickard, Peter H Howarth, Eugene Healy, John W Holloway, Peter S Friedmann, andMichael R Ardern-Jones. Sensitization via healthy skin programs Th2 responses in indi-viduals with atopic dermatitis. Journal of Investigative Dermatology, 133(10):2372–80,2013.
[162] Toshiro Takai and Shigaku Ikeda. Barrier dysfunction caused by environmental proteasesin the pathogenesis of allergic diseases. Allergology international : official journal of
the Japanese Society of Allergology, 60(1):25–35, March 2011.
[163] Hans Törmä, Magnus Lindberg, and Berit Berne. Skin barrier disruption by sodiumlauryl sulfate-exposure alters the expressions of involucrin, transglutaminase 1, profilag-grin, and kallikreins during the repair phase in human skin in vivo. Journal of Investiga-
tive Dermatology, 128(5):1212–9, May 2008.
[164] Shin Morizane, Kenshi Yamasaki, Filamer D Kabigting, and Richard L Gallo. Kallikreinexpression and cathelicidin processing are independently controlled in keratinocytesby calcium, vitamin D(3), and retinoic acid. Journal of Investigative Dermatology,130(5):1297–306, May 2010.
[165] Paola Fortugno, Alberto Bresciani, Chantal Paolini, Chiara Pazzagli, May El Hachem,Marina D’Alessio, and Giovanna Zambruno. Proteolytic activation cascade of theNetherton syndrome-defective protein, LEKTI, in the epidermis: implications for skinhomeostasis. Journal of Investigative Dermatology, 131(11):2223–32, November 2011.
195

[166] Céline Deraison, Chrystelle Bonnart, Frederic Lopez, Celine Besson, Ross Robinson,Arumugam Jayakumar, Fredrik Wagberg, Maria Brattsand, Jean-Pierre Hachem, GöranLeonardsson, and Alain Hovnanian. LEKTI Fragments Specifically Inhibit KLK5 ,KLK7 , and KLK14 and Control Desquamation through a pH-dependent Interaction.Molecular Biology of the Cell, 18(September):3607–3619, 2007.
[167] Akemi Ishida-Yamamoto, Satomi Igawa, and Mari Kishibe. Order and disorder in cor-neocyte adhesion. Journal of Dermatology, 38(January):645–654, 2011.
[168] Michelle Janssens, Jeroen van Smeden, Gert S Gooris, Wim Bras, Guiseppe Portale,Peter J Caspers, Rob J Vreeken, Thomas Hankemeier, Sanja Kezic, Ron Wolterbeek,Adriana P Lavrijsen, and Joke a Bouwstra. Increase in short-chain ceramides corre-lates with an altered lipid organization and decreased barrier function in atopic eczemapatients. Journal of lipid research, 53(12):2755–66, December 2012.
[169] Peter M Elias. Epidermal barrier function: intercellular lamellar lipid structures, origin,composition and metabolism. Journal of Controlled Release, 15:199–208, 1991.
[170] Yutaka Hatano, Yasuko Adachi, Peter M Elias, Debra Crumrine, Takashi Sakai, RiekoKurahashi, Kazumoto Katagiri, and Sakuhei Fujiwara. The Th2 cytokine, interleukin-4,abrogates the cohesion of normal stratum corneum in mice: implications for pathogene-sis of atopic dermatitis. Experimental dermatology, 22(1):30–5, January 2013.
[171] Jens-Michael Jensen, Regina Fölster-Holst, Anke Baranowsky, Michael Schunck, Su-pandi Winoto-Morbach, Claudia Neumann, Stefan Schütze, and Ehrhardt Proksch. Im-paired sphingomyelinase activity and epidermal differentiation in atopic dermatitis.Journal of Investigative Dermatology, 122(6):1423–31, June 2004.
[172] H D de Koning, E H van den Bogaard, J G M Bergboer, M Kamsteeg, I M J Jvan Vlijmen-Willems, K Hitomi, J Henry, M I Simon, N Takashita, Akemi Ishida-Yamamoto, Joost Schalkwijk, and P L J M Zeeuwen. Expression profile of cornifiedenvelope structural proteins and keratinocyte differentiation-regulating proteins duringskin barrier repair. The British journal of dermatology, 166(6):1245–54, June 2012.
[173] Piyush Koria, Daniel Brazeau, Keith Kirkwood, Patrick Hayden, Mitchell Klausner, andStelios T Andreadis. Gene expression profile of tissue engineered skin subjected to acutebarrier disruption. Journal of Investigative Dermatology, 121(2):368–82, August 2003.
[174] Gopinathan K Menon, Kenneth R Feingold, and Peter M Elias. Lamellar Body SecretoryResponse to Barrier Disruption. Journal of Investigative Dermatology, 98:279–289,1992.
196
[175] E Proksch, W M Holleran, Gopinathan K Menon, Peter M Elias, and Kenneth R Fein-gold. Barrier function regulates epidermal lipid and DNA synthesis. The British journal
of dermatology, 128(5):473–82, May 1993.
[176] Geertrui Denecker, Petra Ovaere, Peter Vandenabeele, and Wim Declercq. Caspase-14reveals its secrets. The Journal of cell biology, 180(3):451–8, February 2008.
[177] Takeshi Matsui, Kenichi Miyamoto, Akiharu Kubo, Hiroshi Kawasaki, Tamotsu Ebi-hara, Kazuya Hata, Shinya Tanahashi, Shizuko Ichinose, Issei Imoto, Johji Inazawa,Jun Kudoh, and Masayuki Amagai. SASPase regulates stratum corneum hydrationthrough profilaggrin-to-filaggrin processing. EMBO molecular medicine, 3(6):320–33,June 2011.
[178] Chrystelle Bonnart, Céline Deraison, Matthieu Lacroix, Yoshikazu Uchida, CélineBesson, Aurélie Robin, Anaïs Briot, Marie Gonthier, Laurence Lamant, Pierre Dubus,Bernard Monsarrat, and Alain Hovnanian. Elastase 2 is expressed in human and mouseepidermis and impairs skin barrier function in Netherton syndrome through filaggrin andlipid misprocessing. The Journal of Clinical Investigation, 120(3):871–882, 2010.
[179] Peck Y Ong, Takaaki Ohtake, Corinne Brandt, Ian Strickland, Mark Boguniewicz,Tomas Ganz, Richard L Gallo, and Donald Y M Leung. Endogenous antimicrobialpeptides and skin infections in atopic dermatitis. The New England journal of medicine,347(15):1151–60, October 2002.
[180] Volker Brinkmann, Ulrike Reichard, Christian Goosmann, Beatrix Fauler, Yvonne Uh-lemann, David S Weiss, Yvette Weinrauch, and Arturo Zychlinsky. Neutrophil extracel-lular traps kill bacteria. Science (New York, N.Y.), 303(5663):1532–5, March 2004.
[181] Sanja Kezic, Gráinne M O’Regan, René Lutter, Ivone Jakasa, Ellen S Koster, Sean PSaunders, Peter J Caspers, Patrick M J H Kemperman, Gerwin J Puppels, Aileen Sandi-lands, Huijia Chen, Linda E Campbell, Karin Kroboth, Rosemarie M Watson, Padraic GFallon, W H Irwin McLean, and Alan D Irvine. Filaggrin loss-of-function mutations areassociated with enhanced expression of IL-1 cytokines in the stratum corneum of pa-tients with atopic dermatitis and in a murine model of filaggrin deficiency. The Journal
of Allergy and Clinical Immunology, 129(4):1031–9.e1, April 2012.
[182] Cindy M de Jongh, Liubov Khrenova, Sanja Kezic, Thomas Rustemeyer, Maarten MVerberk, and Swen M John. Polymorphisms in the interleukin-1 gene influence thestratum corneum interleukin-1 alpha concentration in uninvolved skin of patients withchronic irritant contact dermatitis. Contact dermatitis, 58(5):263–8, May 2008.
197
[183] Parviz Ahmad-Nejad, Salima Mrabet-Dahbi, Kristine Breuer, Martina Klotz, ThomasWerfel, Udo Herz, Klaus Heeg, Michael Neumaier, and Harald Renz. The toll-likereceptor 2 R753Q polymorphism defines a subgroup of patients with atopic dermatitishaving severe phenotype. The Journal of Allergy and Clinical Immunology, 113(3):565–7, March 2004.
[184] Shizuo Akira and Kiyoshi Takeda. Toll-like receptor signalling. Nature reviews. Im-
munology, 4(7):499–511, July 2004.
[185] E. Vakirlis, E. Lazaridou, T. G. Tzellos, S. Gerou, D. Chatzidimitriou, and D. Ioannides.Investigation of cytokine levels and their association with SCORAD index in adults withacute atopic dermatitis. Journal of the European Academy of Dermatology and Venere-
ology, 25:409–416, 2011.
[186] Haoli Jin, Rui He, Michiko Oyoshi, and Raif S Geha. Animal models of atopic dermati-tis. Journal of Investigative Dermatology, 129(February 2008):31–40, 2009.
[187] Robin E Callard and John I Harper. The skin barrier, atopic dermatitis and allergy: arole for Langerhans cells? Trends in immunology, 28(7):294–8, July 2007.
[188] Jitlada Meephansan, Hidetoshi Tsuda, Mayumi Komine, Shin-Ichi Tominaga, andMamitaro Ohtsuki. Regulation of IL-33 expression by IFN-γ and tumor necrosis factor-α in normal human epidermal keratinocytes. Journal of Investigative Dermatology,132(11):2593–600, November 2012.
[189] William E Paul and Jinfang Zhu. How are T(H)2-type immune responses initiated andamplified? Nature reviews. Immunology, 10(4):225–235, 2010.
[190] W Zheng and R a Flavell. The transcription factor GATA-3 is necessary and sufficientfor Th2 cytokine gene expression in CD4 T cells. Cell, 89:587–596, 1997.
[191] I-Cheng Ho, Tzong-Shyuan Tai, and Sung-Yun Pai. GATA3 and the T-cell lineage:essential functions before and after T-helper-2-cell differentiation. Nature reviews. Im-
munology, 9(feBRuARy):125–135, 2009.
[192] Sun-young Hwang, Kye-yeon Hur, Jeong-Rae Junil Kim, Kwang-hyun Cho, Seung-hwan Kim, and Joo-yeon Yoo. Biphasic RLR âLŠ IFN- β Response Controls the Balancebetween Antiviral Immunity and Cell Damage. The Journal of Immunology, 190:1192–1200, 2013.
[193] Alex K Shalek, Rahul Satija, Xian Adiconis, Rona S Gertner, Jellert T Gaublomme,Raktima Raychowdhury, Schraga Schwartz, Nir Yosef, Christine Malboeuf, Diana Lu,
198

John J Trombetta, Dave Gennert, Andreas Gnirke, Alon Goren, Nir Hacohen, Joshua ZLevin, Hongkun Park, and Aviv Regev. Single-cell transcriptomics reveals bimodalityin expression and splicing in immune cells. Nature, 498(7453):236–40, June 2013.
[194] Myong-Hee Sung, Ning Li, Qizong Lao, Rachel a Gottschalk, Gordon L Hager, and IainD C Fraser. Switching of the Relative Dominance Between Feedback Mechanisms inLipopolysaccharide-Induced NF-κB Signaling. Science signaling, 7(308):ra6, January2014.
[195] Thomas Höfer, Holger Nathansen, Max Löhning, Andreas Radbruch, and Reinhart Hein-rich. GATA-3 transcriptional imprinting in Th2 lymphocytes: a mathematical model.PNAS, 99(14):9364–8, July 2002.
[196] Johannes Müller and Thorsten Tjardes. Modeling the Cytokine Network In Vitro and InVivo. Journal of Theoretical Medicine, 5(2):93–110, 2003.
[197] Panayiotis Christodoulides. Roles of combined positive and negative feedback controlwith time-delay in multi-scale biological control. Early Stage Assessment Report. Tech-nical report, Imperial College London, 2014.
[198] a. Goldbeter and D. E. Koshland. Ultrasensitivity in biochemical systems controlled bycovalent modification. Interplay between zero-order and multistep effects. Journal of
Biological Chemistry, 259:14441–14447, 1984.
[199] Tomasz Lipniacki, Beata Hat, James R Faeder, and William S Hlavacek. Stochas-tic effects and bistability in T cell receptor signaling. Journal of theoretical biology,254(1):110–22, September 2008.
[200] Qiang Zhang, Sudin Bhattacharya, Douglas E Kline, Robert B Crawford, Rory BConolly, Russell S Thomas, Norbert E Kaminski, and Melvin E Andersen. Stochas-tic modeling of B lymphocyte terminal differentiation and its suppression by dioxin.BMC systems biology, 4:40, January 2010.
[201] Jin Nam, Baltazar D Aguda, Bjoern Rath, and Sudha Agarwal. Biomechanical thresh-olds regulate inflammation through the NF-kappaB pathway: experiments and modeling.PloS one, 4(4):e5262, January 2009.
[202] Najaf a Shah and Casim a Sarkar. Robust network topologies for generating switch-likecellular responses. PLoS computational biology, 7(6):e1002085, June 2011.
[203] Abhinav Tiwari, J Christian J Ray, Jatin Narula, and Oleg a Igoshin. Bistable responsesin bacterial genetic networks: designs and dynamical consequences. Mathematical bio-
sciences, 231(1):76–89, May 2011.
199

[204] Gheorghe Craciun, Yangzhong Tang, and Martin Feinberg. Understanding bistability incomplex enzyme-driven reaction networks. PNAS, 103(23):8697–8702, 2006.
[205] J. E. Ferrell Jr. The Biochemical Basis of an All-or-None Cell Fate Switch in XenopusOocytes. Science, 280(5365):895–898, May 1998.
[206] James E Ferrell, Joseph R Pomerening, Sun Young Kim, Nikki B Trunnell, Wen Xiong,Chi-Ying Frederick Huang, and Eric M Machleder. Simple, realistic models of complexbiological processes: positive feedback and bistability in a cell fate switch and a cellcycle oscillator. FEBS letters, 583(24):3999–4005, December 2009.
[207] Madalena Chaves and Jean-Luc Gouzé. Exact control of genetic networks in a qualitativeframework: The bistable switch example. Automatica, 47(6):1105–1112, June 2011.
[208] Diego a Oyarzún, Madalena Chaves, and Marit Hoff-Hoffmeyer-Zlotnik. Multistabil-ity and oscillations in genetic control of metabolism. Journal of theoretical biology,295:139–53, February 2012.
[209] Olaf Wolkenhauer, Mukhtar Ullah, Peter Wellstead, and Kwang-Hyun Cho. The dy-namic systems approach to control and regulation of intracellular networks. FEBS let-
ters, 579(8):1846–53, March 2005.
[210] Jörg Stelling, Uwe Sauer, Zoltan Szallasi, Francis J. Doyle, and John Doyle. Robustnessof cellular functions. Cell, 118:675–685, 2004.
[211] Janeta Nikolovski, Georgios N Stamatas, Nikiforos Kollias, and Benjamin C Wiegand.Barrier function and water-holding and transport properties of infant stratum corneumare different from adult and continue to develop through the first year of life. Journal of
Investigative Dermatology, 128(7):1728–36, July 2008.
[212] Mitsuhiro Denda, Sumiko Denda, Moe Tsutsumi, Makiko Goto, Junichi Kumamoto,Masashi Nakatani, Kentaro Takei, Hiroyuki Kitahata, Satoshi Nakata, Yusuke Sawabu,Yasuaki Kobayashi, and Masaharu Nagayama. Frontiers in epidermal barrier homeosta-sis - an approach to mathematical modelling of epidermal calcium dynamics. Experi-
mental dermatology, 23(18):79–82, December 2013.
[213] a Becskei and L Serrano. Engineering stability in gene networks by autoregulation.Nature, 405(June):590–593, 2000.
[214] Dmitry Nevozhay, Rhys M Adams, Kevin F Murphy, Kresimir Josic, and Gábor Balázsi.Negative autoregulation linearizes the dose-response and suppresses the heterogeneityof gene expression. PNAS, 106(13):5123–5128, 2009.
200

[215] Alejandro Colman-lerner, Andrew Gordon, Eduard Serra, Tina Chin, Orna Resnekov,Drew Endy, C Gustavo Pesce, and Roger Brent. Regulated cell-to-cell variation in acell-fate decision system. Nature, 437(September), 2005.
[216] Richard C Yu, C Gustavo Pesce, Alejandro Colman-lerner, Larry Lok, David Pin-cus, Eduard Serra, Mark Holl, Kirsten Benjamin, Andrew Gordon, and Roger Brent.Negative feedback that improves information transmission in yeast signalling. Nature,456(December):755–761, 2008.
[217] Malte Paulsen, Stefan Legewie, Roland Eils, Emil Karaulanov, and Christof Niehrs.Negative feedback in the bone morphogenetic protein 4 ( BMP4 ) synexpression groupgoverns its dynamic signaling range and canalizes development. PNAS, 4, 2011.
[218] Dale Muzzey, Carlos a. Gómez-Uribe, Jerome T. Mettetal, and Alexander van Oudenaar-den. A Systems-Level Analysis of Perfect Adaptation in Yeast Osmoregulation. Cell,138:160–171, 2009.
[219] Jörg Schaber, Rodrigo Baltanás, Alan Bush, Edda Klipp, and Alejandro Colman-Lerner.Modelling reveals novel roles of two parallel signalling pathways and homeostatic feed-backs in yeast. Molecular systems biology, 8(622):622, 2012.
[220] Diana Clausznitzer, Olga Oleksiuk, Linda Lø vdok, Victor Sourjik, and Robert G. En-dres. Chemotactic response and adaptation dynamics in Escherichia coli. PLoS Compu-
tational Biology, 6(5):1–11, 2010.
[221] Uri Alon, M G Surette, Naama Barkai, and S Leibler. Robustness in bacterial chemo-taxis. Nature, 397(6715):168–71, January 1999.
[222] Alan M Weinstein. Modeling epithelial cell homeostasis: assessing recovery and controlmechanisms. Bulletin of mathematical biology, 66(5):1201–40, September 2004.
[223] T M Yi, Y Huang, M I Simon, and John Doyle. Robust perfect adaptation in bacterialchemotaxis through integral feedback control. PNAS, 97(9):4649–4653, 2000.
[224] Wenzhe Ma, Ala Trusina, Hana El-Samad, Wendell a Lim, and Chao Tang. Defining net-work topologies that can achieve biochemical adaptation. Cell, 138(4):760–73, August2009.
[225] D. R. Hoffman, L. M. Kroll, a. Basehoar, B. Reece, C. T. Cunningham, and D. W.Koenig. Immediate and extended effects of sodium lauryl sulphate exposure on stratumcorneum natural moisturizing factor. International Journal of Cosmetic Science, 36:93–101, 2014.
201

[226] Danuta Gutowska-Owsiak, Anna L Schaupp, Maryam Salimi, Tharini a Selvakumar,Tess McPherson, Stephen Taylor, and Graham S Ogg. IL-17 downregulates filaggrin andaffects keratinocyte expression of genes associated with cellular adhesion. Experimental
dermatology, 21(2):104–10, February 2012.
[227] Malene Hvid, Christian Vestergaard, Kaare Kemp, Gitte B Christensen, Bent Deleuran,and Mette Deleuran. IL-25 in atopic dermatitis: a possible link between inflammationand skin barrier dysfunction? Journal of Investigative Dermatology, 131(1):150–7,January 2011.
[228] Dongsan Kim, Yung-Keun Kwon, and Kwang-Hyun Cho. Coupled positive and negativefeedback circuits form an essential building block of cellular signaling pathways. BioEs-
says : news and reviews in molecular, cellular and developmental biology, 29(1):85–90,January 2007.
[229] Kim Newton and Vishva M Dixit. Signaling in innate immunity and inflammation. Cold
Spring Harbor perspectives in biology, 4(3), March 2012.
[230] N. C J Filewod, Jelena Pistolic, and R. E W Hancock. Low concentrations of LL-37 alter IL-8 production by keratinocytes and bronchial epithelial cells in response toproinflammatory stimuli. FEMS Immunology and Medical Microbiology, 56:233–240,2009.
[231] Zhe Zhang, Thomas B Clarke, and Jeffrey N Weiser. Cellular effectors mediating Th17-dependent clearance of pneumococcal colonization in mice. The Journal of Clinical
Investigation, 119(7):1899–1909, 2009.
[232] Benedicte Mengel, Alexander Hunziker, Lykke Pedersen, Ala Trusina, Mogens HJensen, and Sandeep Krishna. Modeling oscillatory control in NF-κB, p53 and Wntsignaling. Current opinion in genetics & development, 20(6):656–64, December 2010.
[233] D. E. Nelson. Oscillations in NF-ÂaB Signaling Control the Dynamics of Gene Expres-sion. Science, 306(October):704–708, 2004.
[234] Raymond Cheong, Alexander Hoffmann, and Andre Levchenko. Understanding NF-kappaB signaling via mathematical modeling. Molecular systems biology, 4(192):192,January 2008.
[235] Reiko J Tanaka, Masahiro Ono, and Heather a Harrington. Skin barrier homeostasisin atopic dermatitis: feedback regulation of kallikrein activity. PloS one, 6(5):e19895,January 2011.
202

[236] Elisa Domínguez-Hüttinger, Masahiro Ono, Mauricio Barahona, and Reiko J Tanaka.Risk factor-dependent dynamics of atopic dermatitis : modelling multi-scale regulationof epithelium homeostasis. Interface Focus, 3(February):20120090, 2013.
[237] Jerrold R Turner. Intestinal mucosal barrier function in health and disease. Nature
reviews. Immunology, 9(11):799–809, November 2009.
[238] J S Alexander and John W Elrod. Extracellular matrix, junctional integrity and ma-trix metalloproteinase interactions in endothelial permeability regulation. Journal of
anatomy, 200(6):561–74, June 2002.
[239] Johannes Witt, Sandra Barisic, Eva Schumann, Frank Allgöwer, Oliver Sawodny,Thomas Sauter, and Dagmar Kulms. Mechanism of PP2A-mediated IKK beta dephos-phorylation: a systems biological approach. BMC systems biology, 3:71, January 2009.
[240] L Olsen, J a Sherratt, and Philip K Maini. A mathematical model for fibro-proliferativewound healing disorders. Bulletin of mathematical biology, 58(4):787–808, July 1996.
[241] S Mrabet-Dahbi and M Maurer. Does allergy impair innate immunity? Leads and lessonsfrom atopic dermatitis. Allergy, 65(11):1351–6, November 2010.
[242] Kazuyuki Aihara and Hideyuki Suzuki. Theory of hybrid dynamical systems and itsapplications to biological and medical systems. Philosophical transactions. Series A,
Mathematical, physical, and engineering sciences, 368(1930):4893–914, November2010.
[243] B Liu, J Willette-Brown, S Liu, X Chen, S M Fischer, and Yinling Hu. IKKα represses anetwork of inflammation and proliferation pathways and elevates c-Myc antagonists anddifferentiation in a dose-dependent manner in the skin. Cell death and differentiation,18(12):1854–64, December 2011.
[244] Nicole L La Gruta, Katherine Kedzierska, John Stambas, and Peter C Doherty. A ques-tion of self-preservation: immunopathology in influenza virus infection. Immunology
and cell biology, 85(October 2006):85–92, 2007.
[245] Jennifer M Lund, Lianne Hsing, Thuy T Pham, and Alexander Y Rudensky. Coordina-tion of early protective immunity to viral infection by regulatory T cells. Science (New
York, N.Y.), 320(2008):1220–1224, 2008.
[246] Donald Y M Leung. Immunopathology of atopic dermatitis. Springer Seminars in
Immunopahtology, 2:427–440, 1992.
203

[247] Heather A Harrington, Kenneth L Ho, Samik Ghosh, and K C Tung. Construction andanalysis of a modular model of caspase activation in apoptosis. Theoretical biology &
medical modelling, 5:26, January 2008.
[248] Liselotte E Jensen. Targeting the IL-1 family members in skin inflammation. Curr Opin
Investig Drugs, 11(11):1211–1220, 2011.
[249] Ronina a Covar, Robert Strunk, Robert S Zeiger, Laura a Wilson, Andrew H Liu, ScottWeiss, James Tonascia, Joseph D Spahn, and Stanley J Szefler. Predictors of remit-ting, periodic, and persistent childhood asthma. The Journal of Allergy and Clinical
Immunology, 125(2):359–366.e3, February 2010.
[250] Georgios N Stamatas, Charles Zerweck, Gary Grove, and Katharine M Martin. Docu-mentation of impaired epidermal barrier in mild and moderate diaper dermatitis in vivousing noninvasive methods. Pediatric dermatology, 28(2):99–107, 2011.
[251] Thora Pommerencke, Kathi Westphal, Claudia Ernst, Kai Safferling, Hartmut Dickhaus,Thorsten Steinberg, Pascal Tomakidi, and Niels Grabe. Spatial quantification and classi-fication of skin response following perturbation using organotypic skin cultures. Bioin-
formatics (Oxford, England), 26(21):2760–6, November 2010.
[252] Malene Hvid, Claus Johansen, Bent Deleuran, Kaare Kemp, Mette Deleuran, and Chris-tian Vestergaard. Regulation of caspase 14 expression in keratinocytes by inflammatorycytokines–a possible link between reduced skin barrier function and inflammation? Ex-
perimental dermatology, 20(8):633–6, August 2011.
[253] Jennifer Y Zhang, Cheryl L Green, Shiying Tao, and Paul a Khavari. NF-kappaB RelAopposes epidermal proliferation driven by TNFR1 and JNK. Genes & development,18(1):17–22, January 2004.
[254] Sabina a Islam and Andrew D Luster. T cell homing to epithelial barriers in allergicdisease. Nature Medicine, 18(5):705–715, 2012.
[255] Mao-Qiang Man, Yutaka Hatano, Seung Hun Lee, Mona Man, Sandra Chang, Kenneth RFeingold, Donald Y M Leung, Walter Holleran, Yoshikazu Uchida, and Peter M Elias.Characterization of a hapten-induced, murine model with multiple features of atopicdermatitis: structural, immunologic, and biochemical changes following single versusmultiple oxazolone challenges. Journal of Investigative Dermatology, 128(1):79–86,January 2008.
204

[256] Eric L Simpson, Joanne R Chalmers, Jon M Hanifin, Kim S Thomas, Michael J Cork,W H Irwin Mclean, Sara J Brown, Zunqiu Chen, and Simpson E T Al. Emollient en-hancement of the skin barrier from birth offers effective atopic dermatitis prevention.Journal of Allergy and Clinical Immunology, 134(4):818–823, 2014.
[257] Jane Yoo, Miyuki Omori, Dora Gyarmati, Baohua Zhou, Theingi Aye, Avery Brewer,Michael R Comeau, Daniel J Campbell, and Steven F Ziegler. Spontaneous atopic der-matitis in mice expressing an inducible thymic stromal lymphopoietin transgene specif-ically in the skin. The Journal of experimental medicine, 202(4):541–9, August 2005.
[258] Jonathan M. Spergel, Emiko Mizoguchi, Joanne P. Brewer, Thomas R. Martin, Atul K.Bhan, and Raif S. Geha. Epicutaneous sensitization with protein antigen induces local-ized allergic dermatitis and hyperresponsiveness to methacholine after single exposureto aerosolized antigen in mice. Journal of Clinical Investigation, 101:1614–1622, 1998.
[259] Georgios N Stamatas, Janeta Nikolovski, Michael a Luedtke, Nikiforos Kollias, andBenjamin C Wiegand. Infant skin microstructure assessed in vivo differs from adult skinin organization and at the cellular level. Pediatric dermatology, 27(2):125–31, 2010.
[260] Georgios N Stamatas. The Structural and Functional Development of Skin During theFirst Year of Life: Investigations Using Non-invasive Methods. In Miranda A. Farage,Kenneth W. Miller, and Howard I. Maibach, editors, Textbook of Aging Skin, chapter 69:The St, pages 715–724. Springer Berlin Heidelberg, Berlin, Heidelberg, 2010.
[261] Peter J Caspers, G W Lucassen, and G J Puppels. Combined in vivo confocal Ramanspectroscopy and confocal microscopy of human skin. Biophysical journal, 85(1):572–80, July 2003.
[262] Gráinne M O’Regan, Patrick M J H Kemperman, Aileen Sandilands, Huijia Chen,Linda E Campbell, Karin Kroboth, Rosemarie M Watson, Marion Rowland, Gerwin JPuppels, W H Irwin McLean, Peter J Caspers, and Alan D Irvine. Raman profiles of thestratum corneum define 3 filaggrin genotype-determined atopic dermatitis endopheno-types. The Journal of Allergy and Clinical Immunology, 126(3):574–80.e1, September2010.
[263] Nikiforos Kollias and Georgios N Stamatas. Optical non-invasive approaches to diagno-sis of skin diseases. The journal of investigative dermatology. Symposium proceedings /
the Society for Investigative Dermatology, Inc. [and] European Society for Dermatolog-
ical Research, 7(1):64–75, December 2002.
205

[264] Duncan R Hewett, Alison L Simons, Niamh E Mangan, Helen E Jolin, Shelia M Green,Padraic G Fallon, and Andrew N J McKenzie. Lethal, neonatal ichthyosis with increasedproteolytic processing of filaggrin in a mouse model of Netherton syndrome. Human
molecular genetics, 14(2):335–46, January 2005.
[265] Chrystelle Bonnart, Maaike Kreft, Mari Kishibe, Pascal Descargues, Akemi Ishida-yamamoto, Peter M Elias, Yann Barrandon, Giovanna Zambruno, Arnoud Sonnenberg,and Alain Hovnanian. Spink5 -deficient mice mimic Netherton syndrome through degra-dation of desmoglein 1 by epidermal protease hyperactivity. Nature Genetics, 37(1):56–65, 2005.
[266] David H Broide, Toby Lawrence, Taylor Doherty, Jae Youn Cho, Marina Miller, KirstiMcelwain, Shauna Mcelwain, Michael Karin, and Michael Karints. Allergen-InducedPeribronchial Fibrosis and Mucus Production Mediated by IκB Kinase β- DependentGenes in Airway Epithelium. PNAS, 102(49):17723–17728, 2005.
[267] Anna Velcich, WanCai Yang, Joerg Heyer, Alessandra Fragale, Courtney Nicholas,Stephanie Viani, Raju Kucherlapati, Martin Lipkin, Kan Yang, and Leonard Augenlicht.Colorectal cancer in mice genetically deficient in the mucin Muc2. Science (New York,
N.Y.), 295(5560):1726–9, March 2002.
[268] Guy-Bart V Stan, F Belmudes, R Fonteneau, F Zeggwagh, M-a Lefebvre, C Michelet,and D Ernst. Modelling the influence of activation-induced apoptosis of CD4+ andCD8+ T-cells on the immune system response of a HIV-infected patient. IET systems
biology, 2(2):94–102, March 2008.
[269] Bernd Schmeck, Ralph Gross, Phillipe Dje N Guessan, Andreas C Hocke, Sven Ham-merschmidt, Tim J Mitchell, Simone Rosseau, Norbert Suttorp, Stefan Hippenstiel,and Phillipe Dje N ÐL Guessan. Streptococcus pneumoniae- Induced Caspase 6-Dependent Apoptosis in Lung Epithelium Streptococcus pneumoniae- Induced Caspase6-Dependent Apoptosis in Lung Epithelium. Infection and immunity, 72(9):4940–4947,2004.
[270] Cécile Attali, Claire Durmort, Thierry Vernet, and Anne Marie Di Guilmi. The interac-tion of Streptococcus pneumoniae with plasmin mediates transmigration across endothe-lial and epithelial monolayers by intercellular junction cleavage. Infection and immunity,76(11):5350–6, November 2008.
[271] David D Tieu, Robert C Kern, and Robert P Schleimer. Alterations in epithelial barrierfunction and host defense responses in chronic rhinosinusitis. The Journal of Allergy
and Clinical Immunology, 124(1):37–42, July 2009.
206

[272] Marco R. Oggioni, Guido Memmi, Tiziana Maggi, Damiana Chiavolini, Francesco Ian-nelli, and Gianni Pozzi. Pneumococcal zinc metalloproteinase ZmpC cleaves humanmatrix metalloproteinase 9 and is a virulence factor in experimental pneumonia. Molec-
ular Microbiology, 49(3):795–805, January 2004.
[273] Jörg Reutershan, Abdul Basit, Elena V Galkina, and Klaus Ley. Sequential recruit-ment of neutrophils into lung and bronchoalveolar lavage fluid in LPS-induced acutelung injury. American journal of physiology. Lung cellular and molecular physiology,289:L807–L815, 2005.
[274] a Lindén. Role of interleukin-17 and the neutrophil in asthma. International archives of
allergy and immunology, 126(3):179–84, November 2001.
[275] Rachel L Zemans, Natalie Briones, Megan Campbell, Jazalle McClendon, Scott KYoung, Tomoko Suzuki, Ivana V Yang, Stijn De Langhe, Susan D Reynolds, Robert JMason, Michael Kahn, P M Henson, Sean P Colgan, and Gregory P Downey. Neutrophiltransmigration triggers repair of the lung epithelium via beta-catenin signaling. PNAS,108(38):15990–5, September 2011.
[276] Elzbieta Kolaczkowska and Paul Kubes. Neutrophil recruitment and function in healthand inflammation. Nature reviews. Immunology, 13(3):159–75, March 2013.
[277] Amanda M Burnaugh, Laura J Frantz, and Samantha J King. Growth of Streptococ-cus pneumoniae on human glycoconjugates is dependent upon the sequential activity ofbacterial exoglycosidases. Journal of bacteriology, 190(1):221–30, January 2008.
[278] Ha-Sheng Li-Korotky, Juliane M Banks, Chia-Yee Lo, Fan-Rui Zeng, Donna B Stolz,J Douglas Swarts, and William J Doyle. Interaction of pneumococcal phase variationand middle ear pressure/gas composition: an in vitro model of simulated otitis media.Microbial pathogenesis, 45(3):201–6, September 2008.
[279] Lucy J Hathaway, Silvio D Brugger, Brigitte Morand, Mathieu Bangert, Jeannine URotzetter, Christoph Hauser, Werner a Graber, Suzanna Gore, Aras Kadioglu, andKathrin Mühlemann. Capsule type of Streptococcus pneumoniae determines growthphenotype. PLoS pathogens, 8(3):e1002574, January 2012.
[280] Tamene Melkamu, Diane Squillace, Hirohito Kita, and Scott M O’Grady. Regulation ofTLR2 expression and function in human airway epithelial cells. The Journal of mem-
brane biology, 229(2):101–13, May 2009.
[281] Donghong He, Yanlin Su, Peter V Usatyuk, Ernst Wm Spannhake, Paul Kogut, JulianSolway, Viswanathan Natarajan, and Yutong Zhao. Lysophosphatidic acid enhances
207

pulmonary epithelial barrier integrity and protects endotoxin-induced epithelial barrierdisruption and lung injury. The Journal of biological chemistry, 284(36):24123–32,September 2009.
[282] Tamar Tak, Kiki Tesselaar, Janesh Pillay, José a M Borghans, and Leo Koenderman.What’s your age again? Determination of human neutrophil half-lives revisited. Journal
of leukocyte biology, 94(4):595–601, October 2013.
[283] I H Heijink, S M Brandenburg, D S Postma, and Antoon J M van Oosterhout. Cigarettesmoke impairs airway epithelial barrier function and cell-cell contact recovery. The
European respiratory journal, 39(2):419–28, March 2012.
[284] a Nusrat, C a Parkos, T W Liang, D K Carnes, and J L Madara. Neutrophil migra-tion across model intestinal epithelia: monolayer disruption and subsequent events inepithelial repair. Gastroenterology, 113(5):1489–500, November 1997.
[285] Masahiro Komori, Yoshihisa Nakamura, Jesse Ping, Ling Feng, Katsuhiro Toyama,Youngki Kim, Patricia Ferrieri, and Jizhen Lin. Receptor 2 in the Mouse Middle EarEpithelial Cells. Pediatric research, 69(2):101–105, 2011.
[286] Jacques-A Sepulchre, Sylvie Reverchon, and William Nasser. Modeling the onset ofvirulence in a pectinolytic bacterium. Journal of theoretical biology, 244(2):239–57,January 2007.
[287] Victoriya V. Volkova, Zhao Lu, Cristina Lanzas, H. Morgan Scott, and Yrjö T. Gröhn.Modelling dynamics of plasmid-gene mediated antimicrobial resistance in enteric bac-teria using stochastic differential equations. Scientific Reports, 3, August 2013.
[288] Lu Yin, Shuoyu Xu, Jierong Cheng, Dahai Zheng, Gino V Limmon, Nicola H N Leung,Jagath C Rajapakse, Vincent T K Chow, Jianzhu Chen, and Hanry Yu. Spatiotemporalquantification of cell dynamics in the lung following influenza virus infection. Journal
of biomedical optics, 18(4):046001, April 2013.
[289] L Gonzalez-Mariscal, R G Contreras, J J Bolívar, a Ponce, B Chávez De Ramirez, andM Cereijido. Role of calcium in tight junction formation between epithelial cells. The
American journal of physiology, 259:C978–C986, 1990.
[290] D Flores-Benítez, a Ruiz-Cabrera, C Flores-Maldonado, L Shoshani, M Cereijido, andR G Contreras. Control of tight junctional sealing: role of epidermal growth factor.American journal of physiology. Renal physiology, 292:F828–F836, 2007.
208

[291] Eberhard O. Voit. Mesoscopic modeling as a starting point for computational analysesof cystic fibrosis as a systemic disease. Biochimica et Biophysica Acta - Proteins and
Proteomics, 1844(1):258–270, 2014.
[292] Kenneth L Ho and Heather a Harrington. Bistability in apoptosis by receptor clustering.PLoS computational biology, 6(10):e1000956, January 2010.
[293] Nick I Markevich, Jan B Hoek, and Boris N Kholodenko. Signaling switches and bista-bility arising from multisite phosphorylation in protein kinase cascades. The Journal of
cell biology, 164(3):353–9, February 2004.
[294] Vijay Chickarmane, Carl Troein, Ulrike a Nuber, Herbert M Sauro, and Carsten Peter-son. Transcriptional dynamics of the embryonic stem cell switch. PLoS computational
biology, 2(9):e123, September 2006.
[295] Zoltan Szallasi, Vipul Periwal, and Jörg Stelling. System Modeling in Cellular Biology:
From Concepts to Nuts and Bolts. The MIT Press, 2006.
[296] Carlo Cosentino and Declan Bates. Feedback Control in Systems Biology. CRC Press,2012.
[297] Steven Strogatz. Nonlinear dynamics and chaos. 2000.
[298] J D Murray. Mathematical biology. 3 edition, 2003.
[299] Graciela Andonegui, Kim Goring, Dan Liu, Donna-Marie McCafferty, and Brent WWinston. Characterization of S. pneumoniae pneumonia-induced multiple organ dys-function syndrome: an experimental mouse model of gram-positive sepsis. Shock (Au-
gusta, Ga.), 31(4):423–8, April 2009.
[300] David L Tamang, Waheed Pirzai, Gregory P Priebe, David C Traficante, Gerald BPier, John R Falck, Christophe Morisseau, Bruce D Hammock, Beth a McCormick,Karsten Gronert, and Bryan P Hurley. Hepoxilin A(3) facilitates neutrophilic breach oflipoxygenase-expressing airway epithelial barriers. Journal of immunology (Baltimore,
Md. : 1950), 189(10):4960–9, November 2012.
[301] Leonardo H Travassos, Stephen E Girardin, Dana J Philpott, Didier Blanot, Marie-AnneNahori, Catherine Werts, and Ivo G Boneca. Toll-like receptor 2-dependent bacterialsensing does not occur via peptidoglycan recognition. EMBO reports, 5(10):1000–6,October 2004.
209