Mathematical Modeling of the Fluidized Bed Drying of Cubic Materials
6
Research Article Mathematical Modeling of the Fluidized Bed Drying of Cubic Materials The unsteady-state simultaneous heat and mass transfer between gas and potato cubes during the drying process in a batch fluidized bed was described by a math- ematical model. Mass transfer was considered to occur in three dimensions whereas heat transfer between the gas and dried material was assumed to be lumped. It was found that the model could describe the drying process with acceptable accuracy. The moisture profile inside the material at any cross-section and at any time can be predicted by the model. Keywords: Drying, Heat transfer, Mass transfer, Modeling Received: July 02, 2007; revised: August 03, 2007; accepted: August 06, 2007 DOI: 10.1002/ceat.200700247 1 Introduction Digital computers and developed numerical methods are widely used for the purpose of solving heat and mass balance equations in chemical engineering processes. Contemporary research on various processes is mostly directed to modeling and numerical simulation. The results obtained on the basis of reliable mathematical models and numerical analysis enable prediction of the relevant process parameters required for the design of a particular device and optimization of the process itself. A good model (numerical simulation) can successfully substitute lengthy and expensive experimental research. Drying is a complex process due to simultaneous heat and mass transfer. The moisture can be either transported to the surface of the product and then evaporated, or evaporated in- ternally at a liquid-vapor interface and then transported as a vapor to the surface. The transfer of heat depends on the air temperature, relative humidity, air flow rate, exposed area of food material and pressure. The physical nature of the food, including temperature, composition, and in particular, mois- ture content, governs the rate of moisture transfer. The study of the drying behavior of different materials has recently been a subject of interest for various investigators on both theoreti- cal and experimental grounds. Many studies including drying processes have been presented in the literature [1, 2]. Many ex- perimental and theoretical investigations on the convective drying processes of capillary-porous materials in fluidized beds have been carried out in recent years, and several simulation models for natural and forced convection drying systems have been developed [3–6]. The modeling of batch fluidized bed drying of slab shaped potatoes was reported by Revedo et al. [7], Wang and Brennan [8], Senadeera et al. [9] and many others. Maroulis et al. [10] developed a fluidized bed dryer simula- tor based on a mathematical model describing the heat and mass transfer within the dryer. The model incorporated em- pirical equations for the drying constant and the multi-dis- persed particle phase residence time. The experience from the application of the simulator has proven to be important for the flexible operation of existing industrial fluidized bed dryers. Krokida and Kiranoudis [11] developed a mathemati- cal model for fluidized bed dryers. The design procedures aimed at the determination of optimum sizing and operational characteristics were carried out by appropriately optimizing the total annual cost for a given product capacity. Kiranoudis [12] compared design results explicitly by evaluating optimum configurations for a wide range of production capacity values. Once the dryer sizing variables were defined, its operational performance was evaluated by comparing the optimal operat- ing cost versus production capacity for predefined optimal de- sign structures. 2 Mathematical Modeling Air drying of most agro-food products displays no constant rate period and the diffusion inside the particles is well repre- sented by single-phase molecular diffusion. The considered transfer mechanism is moisture diffusion in the solid phase to- ward its external surface, followed by vaporization and convec- tive moisture transfer to the air stream. The three-dimensional unsteady-state equation of conserva- tion of mass in a cube sample can be described by Eq. (1) 1) : © 2007 WILEY-VCH Verlag GmbH & Co. KGaA, Weinheim http://www.cet-journal.com Mohammad Sadegh Hatamipour 1 M. Hadi Jazini 2 1 Chemical Processes Research Department, University of Isfahan, Isfahan, I. R. Iran. 2 Chemical Engineering Department, University of Isfahan, Isfahan, I. R. Iran. – Correspondence: Dr. M. S. Hatamipour ([email protected]), Che- mical Processes Research Department, University of Isfahan, Isfahan, I. R. Iran. – 1) List of symbols at the end of the paper. 1584 Chem. Eng. Technol. 2007, 30, No. 11, 1584–1589
-
Upload
ms-hatamipour -
Category
Documents
-
view
223 -
download
1
Transcript of Mathematical Modeling of the Fluidized Bed Drying of Cubic Materials

Research Article
Mathematical Modeling of the Fluidized BedDrying of Cubic Materials
The unsteady-state simultaneous heat and mass transfer between gas and potatocubes during the drying process in a batch fluidized bed was described by a math-ematical model. Mass transfer was considered to occur in three dimensionswhereas heat transfer between the gas and dried material was assumed to belumped. It was found that the model could describe the drying process withacceptable accuracy. The moisture profile inside the material at any cross-sectionand at any time can be predicted by the model.
Keywords: Drying, Heat transfer, Mass transfer, Modeling
Received: July 02, 2007; revised: August 03, 2007; accepted: August 06, 2007
DOI: 10.1002/ceat.200700247
1 Introduction
Digital computers and developed numerical methods arewidely used for the purpose of solving heat and mass balanceequations in chemical engineering processes. Contemporaryresearch on various processes is mostly directed to modelingand numerical simulation. The results obtained on the basis ofreliable mathematical models and numerical analysis enableprediction of the relevant process parameters required for thedesign of a particular device and optimization of the processitself. A good model (numerical simulation) can successfullysubstitute lengthy and expensive experimental research.
Drying is a complex process due to simultaneous heat andmass transfer. The moisture can be either transported to thesurface of the product and then evaporated, or evaporated in-ternally at a liquid-vapor interface and then transported as avapor to the surface. The transfer of heat depends on the airtemperature, relative humidity, air flow rate, exposed area offood material and pressure. The physical nature of the food,including temperature, composition, and in particular, mois-ture content, governs the rate of moisture transfer. The studyof the drying behavior of different materials has recently beena subject of interest for various investigators on both theoreti-cal and experimental grounds. Many studies including dryingprocesses have been presented in the literature [1, 2]. Many ex-perimental and theoretical investigations on the convectivedrying processes of capillary-porous materials in fluidized bedshave been carried out in recent years, and several simulationmodels for natural and forced convection drying systems havebeen developed [3–6]. The modeling of batch fluidized beddrying of slab shaped potatoes was reported by Revedo et al.
[7], Wang and Brennan [8], Senadeera et al. [9] and manyothers.
Maroulis et al. [10] developed a fluidized bed dryer simula-tor based on a mathematical model describing the heat andmass transfer within the dryer. The model incorporated em-pirical equations for the drying constant and the multi-dis-persed particle phase residence time. The experience from theapplication of the simulator has proven to be important forthe flexible operation of existing industrial fluidized beddryers. Krokida and Kiranoudis [11] developed a mathemati-cal model for fluidized bed dryers. The design proceduresaimed at the determination of optimum sizing and operationalcharacteristics were carried out by appropriately optimizingthe total annual cost for a given product capacity. Kiranoudis[12] compared design results explicitly by evaluating optimumconfigurations for a wide range of production capacity values.Once the dryer sizing variables were defined, its operationalperformance was evaluated by comparing the optimal operat-ing cost versus production capacity for predefined optimal de-sign structures.
2 Mathematical Modeling
Air drying of most agro-food products displays no constantrate period and the diffusion inside the particles is well repre-sented by single-phase molecular diffusion. The consideredtransfer mechanism is moisture diffusion in the solid phase to-ward its external surface, followed by vaporization and convec-tive moisture transfer to the air stream.
The three-dimensional unsteady-state equation of conserva-tion of mass in a cube sample can be described by Eq. (1)1):
© 2007 WILEY-VCH Verlag GmbH & Co. KGaA, Weinheim http://www.cet-journal.com
Mohammad Sadegh
Hatamipour1
M. Hadi Jazini2
1 Chemical Processes ResearchDepartment, University ofIsfahan, Isfahan, I. R. Iran.
2 Chemical EngineeringDepartment, University ofIsfahan, Isfahan, I. R. Iran.
–Correspondence: Dr. M. S. Hatamipour ([email protected]), Che-mical Processes Research Department, University of Isfahan, Isfahan,I. R. Iran.
–1) List of symbols at the end of the paper.
1584 Chem. Eng. Technol. 2007, 30, No. 11, 1584–1589

∂�DqS∂X
∂x�
∂x�
∂�DqS∂X
∂y�
∂y
∂�DqS∂X
∂z�
∂z� ∂�qSX�
∂t(1�
with the following initial and boundary conditions:
I�C � X�x� y� z� 0� � X0
B�C � � Dqs∂X
∂x
� �� ky�X�0� y� z� t� � Xa�
� Dqs∂X
∂x
� �� ky�X�L� y� z� t� � Xa�
� Dqs∂X
∂y
� �� ky�X�x� 0� z� t� � Xa�
� Dqs∂X
∂y
� �� ky�X�x� L� z� t� � Xa�
� Dqs∂X
∂z
� �� ky�X�x� y� 0� t� � Xa�
� Dqs∂X
∂z
� �� ky�X�x� y� L� t� � Xa�
(2)
Since mass transfer resistance is negligible in the gas phasefor fluidized bed systems, the mass transfer coefficient, ky, wasused instead of Ky. The value of Xa can be found by measuringwet and dry bulb temperatures for drying air and by the use ofpsychrometric charts.
The energy balance at the interface of the particle can bewritten as:
Aht�Ta � T� � kdM
dt� d�MCPT�
dt(3)
In order to present a precise model, the variation of all pa-rameters in Eq. (1), with time, temperature and drying prog-ress must be taken into account.
2.1 Determination of Parameters
The moisture diffusivity, D, is a function of temperature andmoisture content. The following correlation was developed fordiffusivity of the moisture in potatoes [13]:
D � 7�18 � 10�5exp�31580
RT
� �exp �0�0025T � 1�22� �X� � (4)
The variation of the apparent density of potatoes during thedrying process can be calculated as follows [5]:
qs = 1202 – 32.9 X – 259 exp(–3.446 X) (5)
The variation of the specific heat of potatoes has been corre-lated by Wang and Brennan [14] as:
Cp = 4.184 · 103 (0.406 + 0.00146T + 0.203X – 0.0249 X2) (6)
The total heat transfer coefficient, ht, to an immersed surfacein a fluidized bed may be calculated from the correlation pre-sented by Youcef-Ali et al. [15] in the following form:
ht �Ka
L�0�37 Re0�6� (7)
For the overall mass transfer coefficient, the following rela-tion between the heat and mass transfer coefficients has beensuggested by Wang and Brennan [14]:
ht
ky� �Cdg
p � XaCwp �
Sc
Pr
� �0�56
(8)
The shrinkage effect of potato particles has been formulatedby the variation of the volume of the drying solid with itsmoisture content as follows [5]:
Vp
Vp0
� 0�0231 � 0�2175X
0�0231 � 0�2175X0for 1�89 ≤ X ≤ 4�5
Vp
Vp0
� 0�1866 � 0�1333X
0�1866 � 0�1333X0for 0 ≤ X ≤ 1�8
Vp
Vp0
� L3
L30
⇒L
L0� Vp
Vp0
� �1
3
(9�
3 Solution of the Model
The heat and mass conservation equations were solved simul-taneously in two cases by discretizing Eqs. (1–3) and takinginto account the variations of D, qs and Cp by use of the appro-priate equations as mentioned above, using a MATLAB pro-gram developed for this purpose. Central differences were usedfor expanding Eqs. (1) and (3). The differences obtained fromEq. (1) provided a tri-diagonal matrix, which could be solvedby an implicit numerical method. Mass transfer equations donot need any stability condition, but the stability condition ofthe heat transfer equation, Eq. (3), determined the minimumvalue for the time increments, as follows:
dt ≥2ms�Cds
p � Cwp�X�
msCwp
dX
dt� Aht
(10)
The computations converged quickly to the final solution.
4 Materials and Procedures
4.1 Materials
Potato cubes were chosen as the drying samples. This vegetablehas a natural moisture content of ca. 75 % and during dryingit maintains its shape, although the size variation due to waterloss cannot be ignored. In order to ensure reproducible results,potatoes were obtained from a single region and kept in a re-frigerator at 4 °C until required. The potatoes were cut into7 and 10 mm cubes and were blanched in boiling water for2 min.
© 2007 WILEY-VCH Verlag GmbH & Co. KGaA, Weinheim http://www.cet-journal.com
Chem. Eng. Technol. 2007, 30, No. 11, 1584–1589 Modeling 1585

4.2 Drying Apparatus
A pilot-scale fluidized bed dryer was set up for performing thedrying experiments. The schematic diagram of the experimen-tal apparatus is given in Fig. 1. The operating variables weredrying air temperature, moisture content, cube sizes, and ve-locity of drying air. Several sets of experiments were carriedout, to show the effect of various parameters on the drying ofcube potatoes, and to validate the models. The operating con-ditions of some experiments are tabulated in Tab. 1. The com-parison of model predictions with experimental data is shownin Fig. 2.
5 Results and Discussion
5.1 Effect of Parameters
In order to determine the effect of various parameters on thedrying of cube potatoes, a computer program was run for dif-
© 2007 WILEY-VCH Verlag GmbH & Co. KGaA, Weinheim http://www.cet-journal.com
Figure 1. Schematic diagram of the experimental setup.
0
0.5
1
1.5
2
2.5
3
3.5
0 10 20 30 40 50 60 70 80 90 100
Time (min)
Mo
istu
re c
on
ten
t (k
g/k
g d
ry s
oli
d)
Eq.1(Air temperature= 50 °C)
Eq.1 (Air temperature= 60 °C)
Eexperimental (Air temperature= 50 °C)
Experimental ( Air temperature=60 °C)
Figure 2. Comparison of model predictions with experimental data.
Table 1. The operating conditions for the drying of potatoes in afluidized bed.
Exp-1 Exp-2 Exp-3 Exp-4
Initial diameter (mm) 7 7 10 10
Initial moisture content(kg/kg dry solid)
3.717 3.717 3.717 3.717
Inlet air temperature (°C) 50 60 60 50
Superficial air velocity (m/s) 3.7 3.7 3.7 3.7
1586 M. S. Hatamipour et al. Chem. Eng. Technol. 2007, 30, No. 11, 1584–1589

ferent conditions. The effects of the various parameters wereinvestigated as follows.
5.1.1 Effect of Air Velocity
There was no effect of air velocity on the drying curve of thepotato cubes. This result shows that the major mass transferresistance is inside the material. This result was also confirmedby previous work by the current authors on the drying of car-rots and green peas [16, 17]. It should be noted that in fluid-ized beds, the allowable range for changing air velocity is from
the minimum fluidization velocity to the carry-over velocity;and this range is not very wide for the drying of low densitymaterials (such as agricultural products).
5.1.2 Effect of Air Temperature
Fig. 3 shows the effect of the drying air temperature on thedrying rate. The rate of drying was increased by increasing theinlet air temperature, as expected.
5.1.3 Effect of Drying Sample Diameter
Fig. 4 shows the effect of the sample diameter on the dryingcurve. It was found that decreasing the diameter of the dryingsample increased its drying rate. In addition, it is clear thatsamples with a smaller diameter approach their final moisturecontent and temperature more rapidly than larger samples.
5.2 Moisture Gradient in Potato Layers
By use of a 3D model, it was possible to predict the moisturecontent in every point in the cube and in every cross-section atany specific time. Some test runs for prediction of the moistureprofile by the model after 3000 s are presented in Figs. 5–7 (inthree different layers) and after 6000 s in Figs. 8 and 9. As wasexpected, the moisture level in the central region of the cubes
© 2007 WILEY-VCH Verlag GmbH & Co. KGaA, Weinheim http://www.cet-journal.com
0
0.02
0.04
0.06
0.08
0.1
0.12
0.14
0.16
0.18
0.2
1 6 11 16 21 26 31 36 41 46 51 56
Time, min
dX
/dt,
kg
/kg
dry
.min T=60 °C
T=50 °C
T=40 °C
Figure 3. Effect of the inlet air temperature on the drying rate ofpotato cubes.
0
0.5
1
1.5
2
2.5
3
4 14 24 34 44 54 64 74 84 94
Time (min)
Mo
istu
re c
on
ten
t (K
g/K
g d
ry s
olid
)
Initial size of the sampel =13mm
Initial size of the sample =10 mm
Initial size of the sample = 7 mm
Figure 4. Effect of the size of the sample on the drying curve of potato cubes.
Chem. Eng. Technol. 2007, 30, No. 11, 1584–1589 Modeling 1587
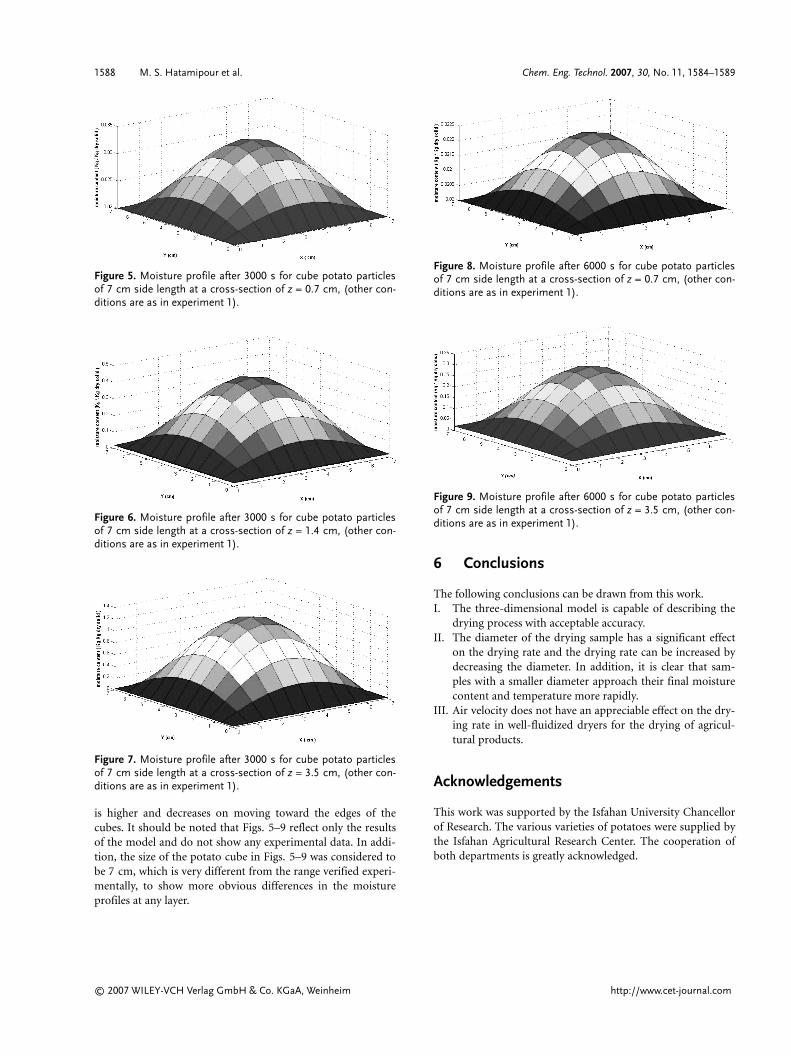
is higher and decreases on moving toward the edges of thecubes. It should be noted that Figs. 5–9 reflect only the resultsof the model and do not show any experimental data. In addi-tion, the size of the potato cube in Figs. 5–9 was considered tobe 7 cm, which is very different from the range verified experi-mentally, to show more obvious differences in the moistureprofiles at any layer.
6 Conclusions
The following conclusions can be drawn from this work.I. The three-dimensional model is capable of describing the
drying process with acceptable accuracy.II. The diameter of the drying sample has a significant effect
on the drying rate and the drying rate can be increased bydecreasing the diameter. In addition, it is clear that sam-ples with a smaller diameter approach their final moisturecontent and temperature more rapidly.
III. Air velocity does not have an appreciable effect on the dry-ing rate in well-fluidized dryers for the drying of agricul-tural products.
Acknowledgements
This work was supported by the Isfahan University Chancellorof Research. The various varieties of potatoes were supplied bythe Isfahan Agricultural Research Center. The cooperation ofboth departments is greatly acknowledged.
© 2007 WILEY-VCH Verlag GmbH & Co. KGaA, Weinheim http://www.cet-journal.com
Figure 5. Moisture profile after 3000 s for cube potato particlesof 7 cm side length at a cross-section of z = 0.7 cm, (other con-ditions are as in experiment 1).
Figure 6. Moisture profile after 3000 s for cube potato particlesof 7 cm side length at a cross-section of z = 1.4 cm, (other con-ditions are as in experiment 1).
Figure 7. Moisture profile after 3000 s for cube potato particlesof 7 cm side length at a cross-section of z = 3.5 cm, (other con-ditions are as in experiment 1).
Figure 8. Moisture profile after 6000 s for cube potato particlesof 7 cm side length at a cross-section of z = 0.7 cm, (other con-ditions are as in experiment 1).
Figure 9. Moisture profile after 6000 s for cube potato particlesof 7 cm side length at a cross-section of z = 3.5 cm, (other con-ditions are as in experiment 1).
1588 M. S. Hatamipour et al. Chem. Eng. Technol. 2007, 30, No. 11, 1584–1589

Symbols used
A [m2] surface area of drying solidCp [J kg–1 K–1] specific heatD [m2 s–1] diffusivityht [W m–2 K–1] total heat transfer coefficientKa [W m–1 s–1] thermal conductivity of drying
airky [kg m–2 s–1] mass transfer coefficientKy [kg m–2 s–1] overall mass transfer coefficientL [m] side length of drying solidL0 [m] initial side length of drying solidM [kg] mass of drying material, (dry
solid + moisture)Ms [kg] mass of dry solidPr [–] Prandtl numberR [J K–1 mol–1] Universal gas constantRe [qg v L lg
–1] Reynolds numberSc [–] Schmidt numbert [s] timeTa [K] air temperatureT [K] drying solid temperaturev [m s–1] superficial air velocityVp [m3] volume of cube potato particleVp0 [m3] initial volume of cube potato
particlex, y, z [m] coordinate of drying substanceX [kg kg–1] moisture content of drying solid,
(dry basis)X0 [kg kg–1] initial moisture content of
drying solid, (dry basis)�X [kg kg–1] average moisture content of
drying solid, (dry basis)qg [g m–3] density of airqs [kg m–3] density of drying materiallg [kg m–1 s–1] viscosity of airk [J kg–1] latent heat of vaporization
Subscripts and superscripts
a airdg dry gasds dry solids solidw water
7 References
[1] I. Dincer, Drying Technol. 1996, 14, 1827.[2] O. Yaldiz, C. Ertekin, Drying Technol. 2001, 19, 583.[3] C. Ratti, A. S. Mujumdar, Sol. Energy 1997, 60, 151.[4] L. M. Diamante, P. A. Munro, Int. J. Food Sci. Technol. 1991,
26, 99.[5] A. H. Pelegrina, G. H. Grapiste, J. Food Eng. 2001, 48 (4),
301.[6] E. Akpinar, A. Midilli, Y. Bicer, Energy Convers. Manage.
2003, 44, 1689.[7] O. Rovedo, C. Suarez, E. Viollaz, J. Food Eng. 1995, 26 (1), 1.[8] N. Wang, J. G. Brennan, J. Food Eng. 1995, 24, 47.[9] W. Senadeera, B. R. Bhandari, G. Young, B. Wijesinghe,
J. Food Eng. 2003, 58, 277.[10] Z. B. Marioulis, C. T. Kiranoudis, D. Marinos-Kouris, J. Food
Eng. 1995, 26, 113.[11] M. K. Krokida, C. T. Kiranoudis, Chem. Eng. J. 2000, 79, 1.[12] C. T. Kiranoudis, Chem. Eng. J. 1998, 69, 27.[13] L. Hassini, S. Azzouz, R. Peczalski, A. Belghith, J. Food Eng.
2007, 79 (1), 47.[14] N. Wang, J. G. Brennan, J. Food Eng. 1993, 19 (3), 303.[15] S. Youcef-Ali et al., J. Food Eng. 2001, 48, 95.[16] M. S. Hatamipour, D. Mowla, Drying Technol. 2003, 21 (1),
83.[17] M. S. Hatamipour, D. Mowla, Food Bioprod. Process. 2006,
84 (C3), 220.
© 2007 WILEY-VCH Verlag GmbH & Co. KGaA, Weinheim http://www.cet-journal.com
Chem. Eng. Technol. 2007, 30, No. 11, 1584–1589 Modeling 1589