Math 1A: Calculus Worksheets 7th edition - Mathematics
82
Math 1A: Calculus Worksheets 7 th Edition Department of Mathematics, University of California at Berkeley
Transcript of Math 1A: Calculus Worksheets 7th edition - Mathematics
Math 1A: Calculus Worksheets7th Edition
Department of Mathematics, University of California at Berkeley
i Math 1A Worksheets, 7th Edition
Preface
This booklet contains the worksheets for Math 1A, U.C. Berkeley’s calculus course.Christine Heitsch, David Kohel, and Julie Mitchell wrote worksheets used for Math 1AM
and 1AW during the Fall 1996 semester. David Jones revised the material for the Fall 1997semesters of Math 1AM and 1AW. The material was further updated by Zeph Grunschlagand Tom Insel, with help from the comments and corrections provided by David Lippel, MaxOks, and Sarah Reznikoff. Tom Insel coordinated the 1998 edition with much assistance andnew material from Cathy Kessel and in consultation with William Stein. Cathy Kessel andMichael Wu have further revised the 1999 and 2000 edition respectively. Michael Hutchingsmade tiny changes in 2012.
In 1997, the engineering applications were written by Reese Jones, Bob Pratt, and Pro-fessors George Johnson and Alan Weinstein, with input from Tom Insel and Dave Jones. In1998, applications authors were Michael Au, Aaron Hershman, Tom Insel, George Johnson,Cathy Kessel, Jason Lee, William Stein, and Alan Weinstein.
About the worksheets
This booklet contains the worksheets that you will be using in the discussion sectionof your course. Each worksheet contains Questions, and most also have Problems and Ad-ditional Problems. The Questions emphasize qualitative issues and answers for them mayvary. The Problems tend to be computationally intensive. The Additional Problems aresometimes more challenging and concern technical details or topics related to the Questionsand Problems.
Some worksheets contain more problems than can be done during one discussion section.Do not despair! You are not intended to do every problem of every worksheet.
Why worksheets?
There are several reasons to use worksheets:
• Communicating to learn. You learn from the explanations and questions of the studentsin your class as well as from lectures. Explaining to others enhances your understandingand allows you to correct misunderstandings.
• Learning to communicate. Research in fields such as engineering and experimentalscience is often done in groups. Research results are often described in talks andlectures. Being able to communicate about science is an important skill in manycareers.
• Learning to work in groups. Industry wants graduates who can communicate and workwith others.
Math 1A Worksheets, 7th Edition ii
Contents
1. Graphing a Journey. . . . . . . . . . . . . . . . . . . . . . . . . . . . . . . . . . . . . . . . . . . . . . . . . . . . . . . . . . . . . . . .1
2. Graphical Problems . . . . . . . . . . . . . . . . . . . . . . . . . . . . . . . . . . . . . . . . . . . . . . . . . . . . . . . . . . . . . . . . 3
3. Tangent Lines and ε–δ Preliminaries . . . . . . . . . . . . . . . . . . . . . . . . . . . . . . . . . . . . . . . . . . . . . . . 5
4. Calculating Limits of Functions . . . . . . . . . . . . . . . . . . . . . . . . . . . . . . . . . . . . . . . . . . . . . . . . . . . 8
5. The Precise Definition of a Limit . . . . . . . . . . . . . . . . . . . . . . . . . . . . . . . . . . . . . . . . . . . . . . . . . 10
6. Continuity . . . . . . . . . . . . . . . . . . . . . . . . . . . . . . . . . . . . . . . . . . . . . . . . . . . . . . . . . . . . . . . . . . . . . . . 13
7. Limits at Infinity and Horizontal Asymptotes . . . . . . . . . . . . . . . . . . . . . . . . . . . . . . . . . . . . 15
8. Derivatives . . . . . . . . . . . . . . . . . . . . . . . . . . . . . . . . . . . . . . . . . . . . . . . . . . . . . . . . . . . . . . . . . . . . . . .17
9. Differentiation . . . . . . . . . . . . . . . . . . . . . . . . . . . . . . . . . . . . . . . . . . . . . . . . . . . . . . . . . . . . . . . . . . . 20
10. The Chain Rule . . . . . . . . . . . . . . . . . . . . . . . . . . . . . . . . . . . . . . . . . . . . . . . . . . . . . . . . . . . . . . . . . .22
11. Implicit Differentiation and Higher Derivatives . . . . . . . . . . . . . . . . . . . . . . . . . . . . . . . . . . . 24
12. Using Differentiation to do Approximations . . . . . . . . . . . . . . . . . . . . . . . . . . . . . . . . . . . . . . 27
13. Exponential Functions . . . . . . . . . . . . . . . . . . . . . . . . . . . . . . . . . . . . . . . . . . . . . . . . . . . . . . . . . . . 29
14. Inverse Functions . . . . . . . . . . . . . . . . . . . . . . . . . . . . . . . . . . . . . . . . . . . . . . . . . . . . . . . . . . . . . . . . 30
15. Logarithmic Functions and their Derivatives . . . . . . . . . . . . . . . . . . . . . . . . . . . . . . . . . . . . . .32
16. Inverse Trigonometric Functions . . . . . . . . . . . . . . . . . . . . . . . . . . . . . . . . . . . . . . . . . . . . . . . . . .34
17. Hyperbolic Functions . . . . . . . . . . . . . . . . . . . . . . . . . . . . . . . . . . . . . . . . . . . . . . . . . . . . . . . . . . . . 36
18. Indeterminate Forms and l’Hospital’s Rule . . . . . . . . . . . . . . . . . . . . . . . . . . . . . . . . . . . . . . . 38
19. Falling Objects and Limits Involving Logarithms and Exponentials . . . . . . . . . . . . . . . 40
20. Maximum and Minimum Values . . . . . . . . . . . . . . . . . . . . . . . . . . . . . . . . . . . . . . . . . . . . . . . . . .43
21. The Mean Value Theorem . . . . . . . . . . . . . . . . . . . . . . . . . . . . . . . . . . . . . . . . . . . . . . . . . . . . . . . .46
22. Monotonicity and Concavity . . . . . . . . . . . . . . . . . . . . . . . . . . . . . . . . . . . . . . . . . . . . . . . . . . . . . 48
23. Applied Optimization . . . . . . . . . . . . . . . . . . . . . . . . . . . . . . . . . . . . . . . . . . . . . . . . . . . . . . . . . . . . . 50
24. Antiderivatives . . . . . . . . . . . . . . . . . . . . . . . . . . . . . . . . . . . . . . . . . . . . . . . . . . . . . . . . . . . . . . . . . . .52
25. Sigma Notation and Mathematical Induction . . . . . . . . . . . . . . . . . . . . . . . . . . . . . . . . . . . . . 54
iii Math 1A Worksheets, 7th Edition
26. Area . . . . . . . . . . . . . . . . . . . . . . . . . . . . . . . . . . . . . . . . . . . . . . . . . . . . . . . . . . . . . . . . . . . . . . . . . . . . . 57
27. The Definite Integral . . . . . . . . . . . . . . . . . . . . . . . . . . . . . . . . . . . . . . . . . . . . . . . . . . . . . . . . . . . . . 60
28. The Fundamental Theorem of Calculus . . . . . . . . . . . . . . . . . . . . . . . . . . . . . . . . . . . . . . . . . . .63
29. The Substitution Rule . . . . . . . . . . . . . . . . . . . . . . . . . . . . . . . . . . . . . . . . . . . . . . . . . . . . . . . . . . . 66
30. The Logarithm Defined as an Integral . . . . . . . . . . . . . . . . . . . . . . . . . . . . . . . . . . . . . . . . . . . . 68
31. Areas Between Curves . . . . . . . . . . . . . . . . . . . . . . . . . . . . . . . . . . . . . . . . . . . . . . . . . . . . . . . . . . . 69
32. Volume . . . . . . . . . . . . . . . . . . . . . . . . . . . . . . . . . . . . . . . . . . . . . . . . . . . . . . . . . . . . . . . . . . . . . . . . . . 72
33. Volumes by Cylindrical Shells . . . . . . . . . . . . . . . . . . . . . . . . . . . . . . . . . . . . . . . . . . . . . . . . . . . . 75
34. Integration and Optimization . . . . . . . . . . . . . . . . . . . . . . . . . . . . . . . . . . . . . . . . . . . . . . . . . . . . 77
1 Math 1A Worksheets, 7th Edition
1. Graphing a Journey
Questions
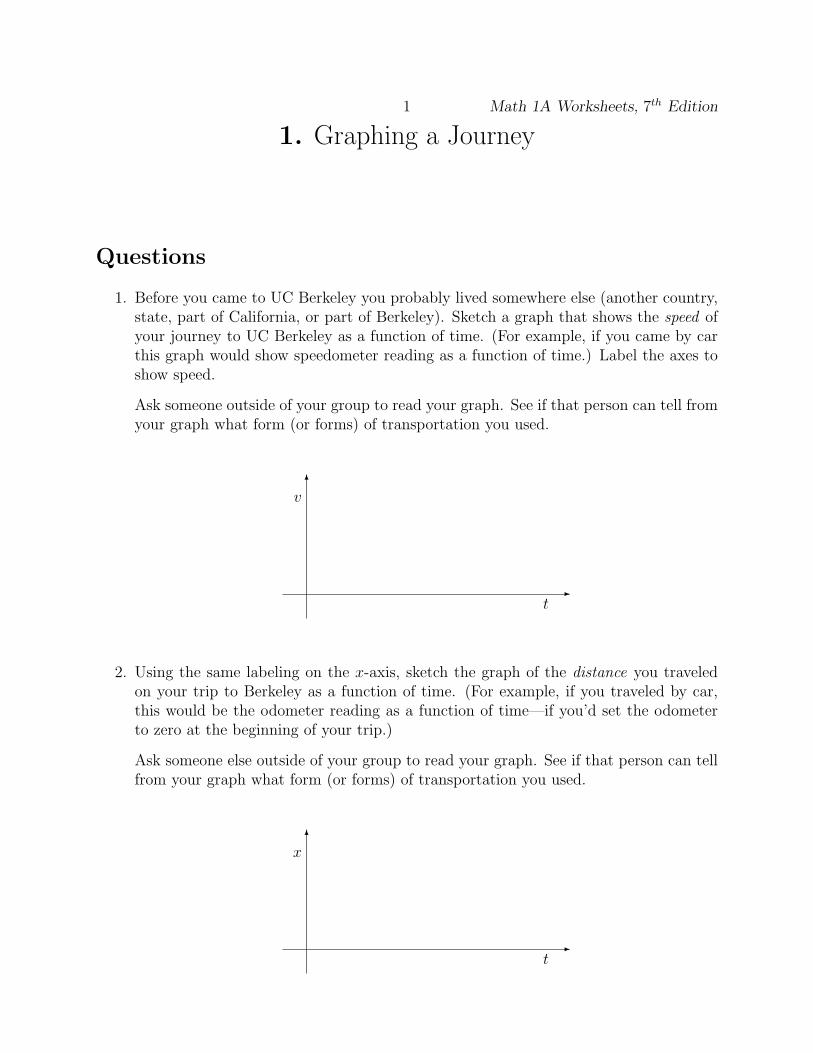
1. Before you came to UC Berkeley you probably lived somewhere else (another country,state, part of California, or part of Berkeley). Sketch a graph that shows the speed ofyour journey to UC Berkeley as a function of time. (For example, if you came by carthis graph would show speedometer reading as a function of time.) Label the axes toshow speed.
Ask someone outside of your group to read your graph. See if that person can tell fromyour graph what form (or forms) of transportation you used.
6v
-t
2. Using the same labeling on the x-axis, sketch the graph of the distance you traveledon your trip to Berkeley as a function of time. (For example, if you traveled by car,this would be the odometer reading as a function of time—if you’d set the odometerto zero at the beginning of your trip.)
Ask someone else outside of your group to read your graph. See if that person can tellfrom your graph what form (or forms) of transportation you used.
6x
-t
Math 1A Worksheets, 7th Edition 2
x
y
p
A
B
C D
L
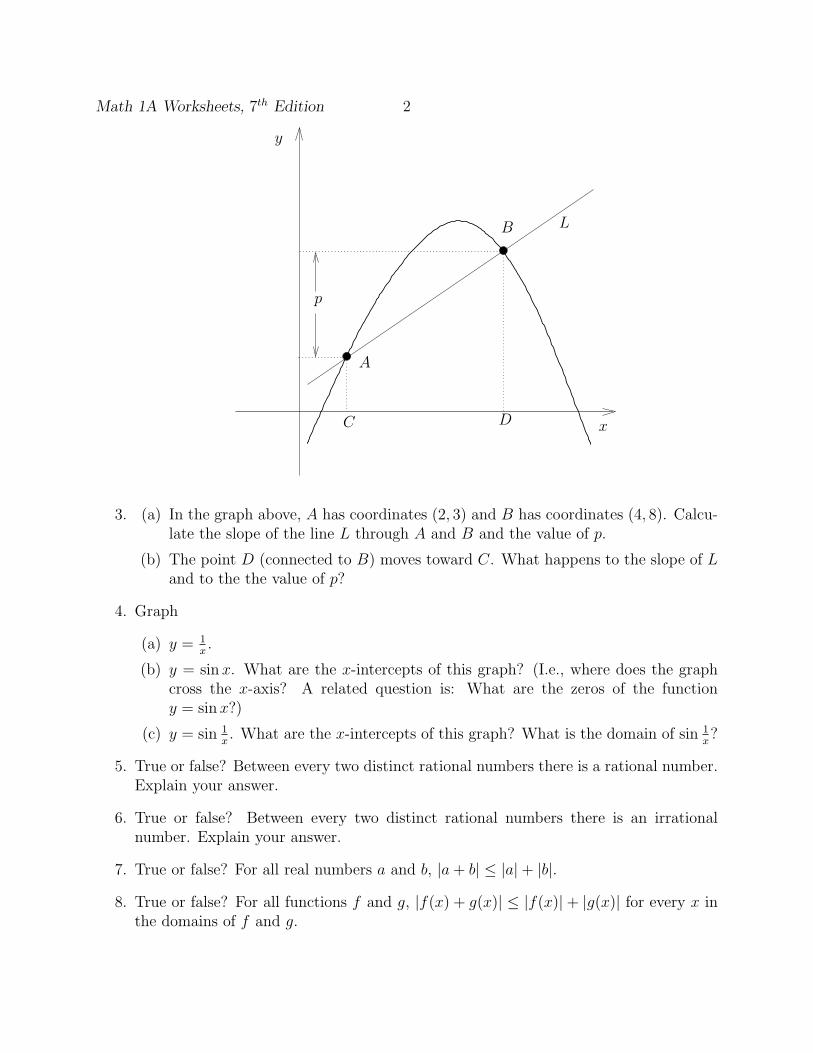
3. (a) In the graph above, A has coordinates (2, 3) and B has coordinates (4, 8). Calcu-late the slope of the line L through A and B and the value of p.
(b) The point D (connected to B) moves toward C. What happens to the slope of Land to the the value of p?
4. Graph
(a) y = 1x.
(b) y = sin x. What are the x-intercepts of this graph? (I.e., where does the graphcross the x-axis? A related question is: What are the zeros of the functiony = sin x?)
(c) y = sin 1x. What are the x-intercepts of this graph? What is the domain of sin 1
x?
5. True or false? Between every two distinct rational numbers there is a rational number.Explain your answer.
6. True or false? Between every two distinct rational numbers there is an irrationalnumber. Explain your answer.
7. True or false? For all real numbers a and b, |a+ b| ≤ |a|+ |b|.
8. True or false? For all functions f and g, |f(x) + g(x)| ≤ |f(x)|+ |g(x)| for every x inthe domains of f and g.
3 Math 1A Worksheets, 7th Edition
2. Graphical Problems
Questions
1. Is there a function all of whose values are equal to each other? If so, graph your answer.If not, explain why.
Problems
1. (a) Find all x such that f(x) ≤ 2 where
f(x) = −x2 + 1 f(x) = (x− 1)2 f(x) = x3
Write your answers in interval notation and draw them on the graphs of thefunctions.
(b) Using the functions in part a, find all x such that |f(x)| ≤ 2. Write your answersin interval notation and draw them on the graphs of the functions.
(c) Can you find upper bounds for the functions in part a? That is, for each functionf is there a number M such that for all x, f(x) ≤ M?
(d) What about lower bounds for the functions in part a? That is, for each f can youfind a number m such that for all x, f(x) ≥ m?
(e) What about finding upper and lower bounds for these functions restricted to theinterval [−1, 1]? That is, for each f can you find numbers M and m such that forall x in [−1, 1], m ≤ f(x) ≤ M?
(f) True or false? If M is an upper bound for the function f and M ′ is an upperbound for the function g, then for all x which are in the domains of both f andg,
|f(x) + g(x)| ≤ M +M ′.
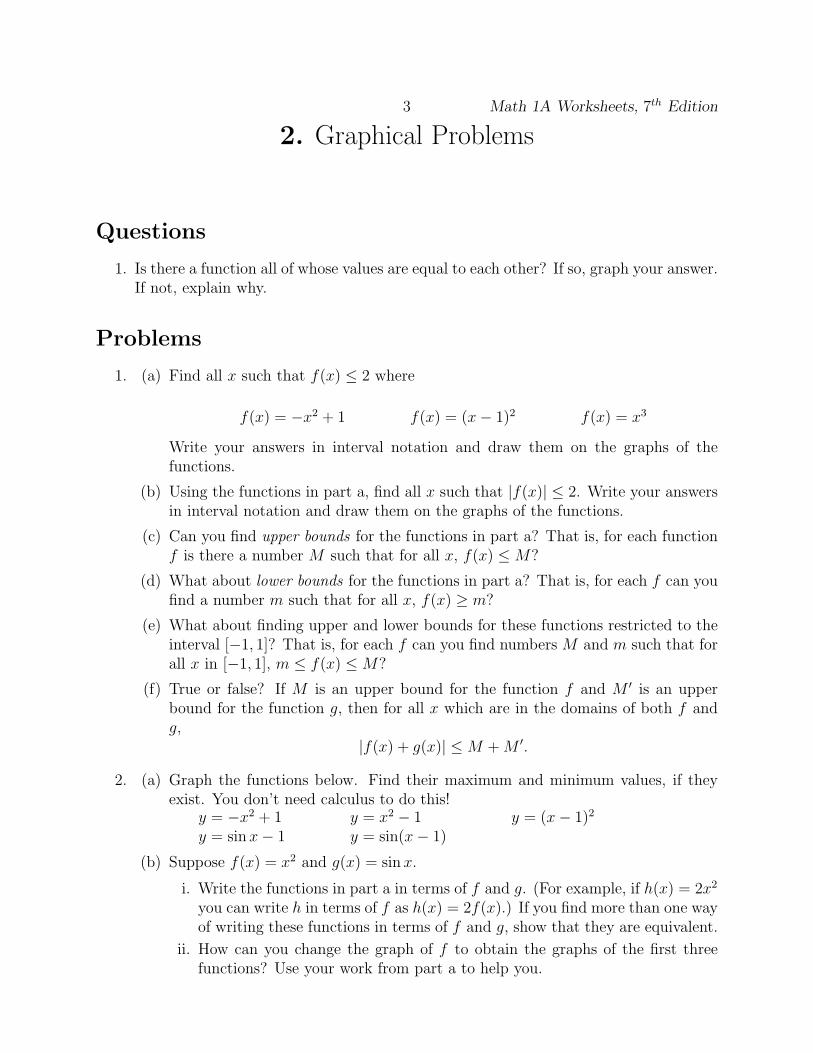
2. (a) Graph the functions below. Find their maximum and minimum values, if theyexist. You don’t need calculus to do this!
y = −x2 + 1 y = x2 − 1 y = (x− 1)2
y = sin x− 1 y = sin(x− 1)
(b) Suppose f(x) = x2 and g(x) = sin x.
i. Write the functions in part a in terms of f and g. (For example, if h(x) = 2x2
you can write h in terms of f as h(x) = 2f(x).) If you find more than one wayof writing these functions in terms of f and g, show that they are equivalent.
ii. How can you change the graph of f to obtain the graphs of the first threefunctions? Use your work from part a to help you.
Math 1A Worksheets, 7th Edition 4
iii. How can you change the graph of g to obtain the graphs of the last twofunctions?
5 Math 1A Worksheets, 7th Edition
3. Tangent Lines and ε–δ Preliminaries
Questions
1. Can the graph of a function have more than one tangent at a given point? If so, graphyour answer. If not, explain why.
2. Is there a function whose graph doesn’t have a tangent at some point? If so, graphyour answer. If not, explain why.
Problems
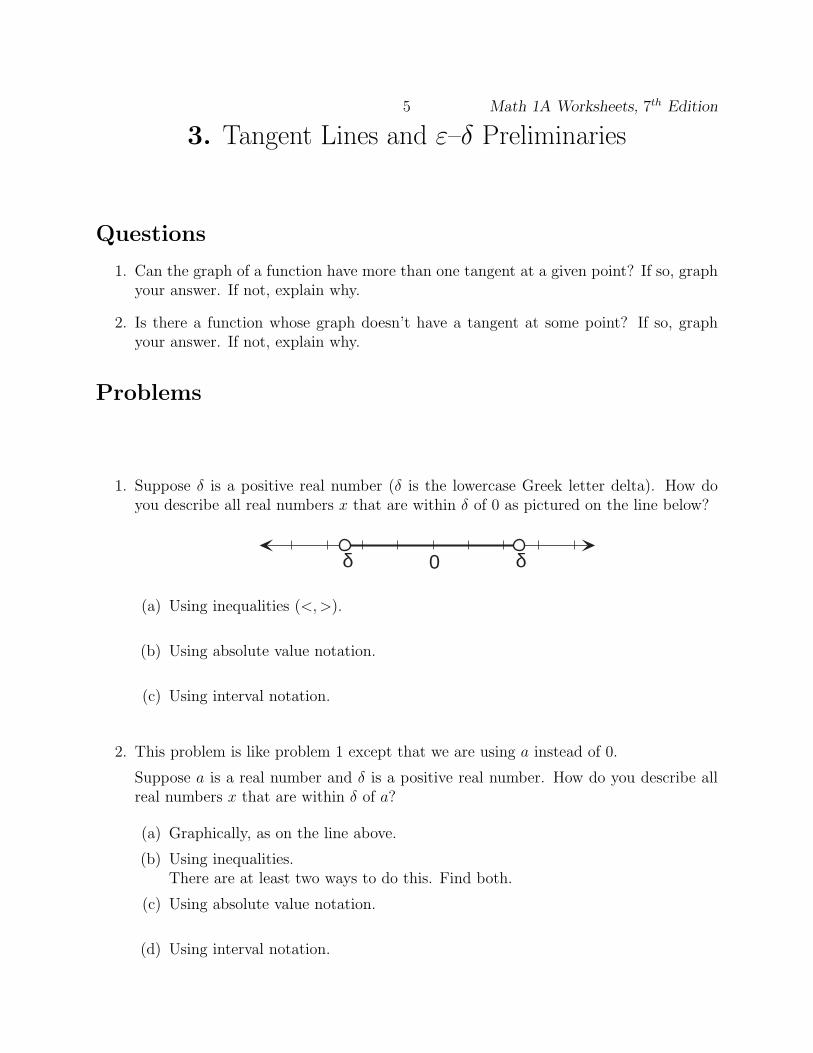
1. Suppose δ is a positive real number (δ is the lowercase Greek letter delta). How doyou describe all real numbers x that are within δ of 0 as pictured on the line below?
δ δ0
(a) Using inequalities (<,>).
(b) Using absolute value notation.
(c) Using interval notation.
2. This problem is like problem 1 except that we are using a instead of 0.
Suppose a is a real number and δ is a positive real number. How do you describe allreal numbers x that are within δ of a?
(a) Graphically, as on the line above.
(b) Using inequalities.There are at least two ways to do this. Find both.
(c) Using absolute value notation.
(d) Using interval notation.
Math 1A Worksheets, 7th Edition 6
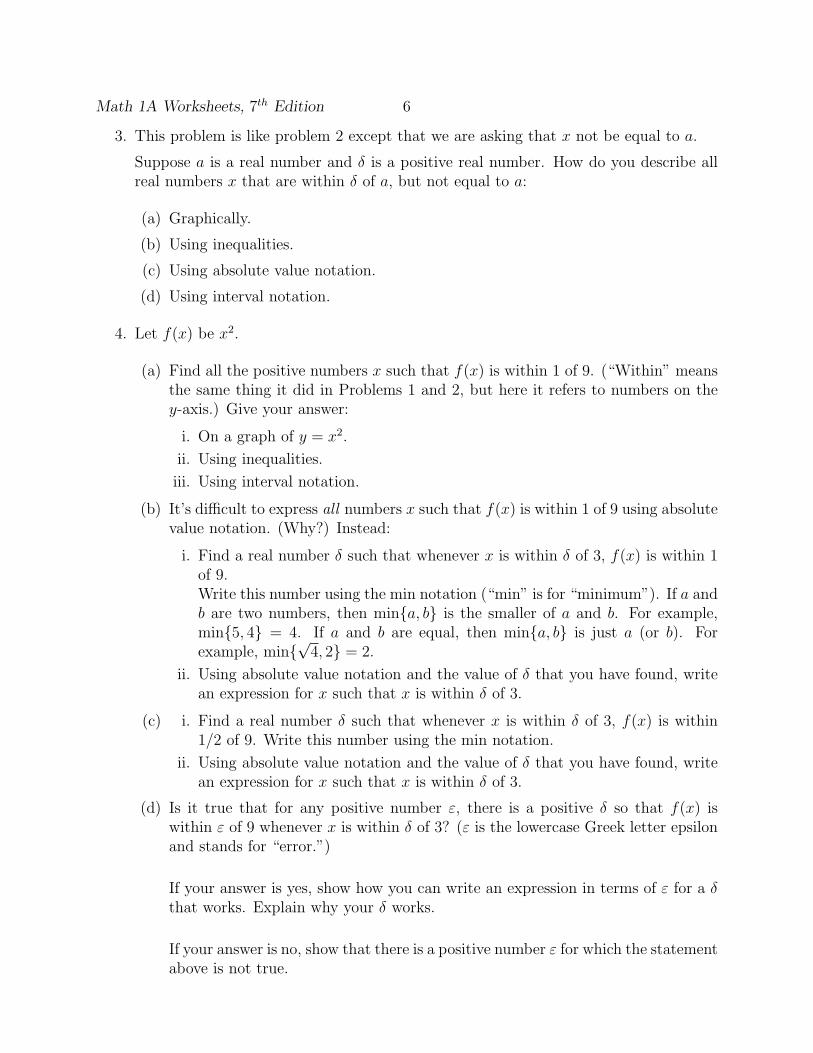
3. This problem is like problem 2 except that we are asking that x not be equal to a.
Suppose a is a real number and δ is a positive real number. How do you describe allreal numbers x that are within δ of a, but not equal to a:
(a) Graphically.
(b) Using inequalities.
(c) Using absolute value notation.
(d) Using interval notation.
4. Let f(x) be x2.
(a) Find all the positive numbers x such that f(x) is within 1 of 9. (“Within” meansthe same thing it did in Problems 1 and 2, but here it refers to numbers on they-axis.) Give your answer:
i. On a graph of y = x2.
ii. Using inequalities.
iii. Using interval notation.
(b) It’s difficult to express all numbers x such that f(x) is within 1 of 9 using absolutevalue notation. (Why?) Instead:
i. Find a real number δ such that whenever x is within δ of 3, f(x) is within 1of 9.Write this number using the min notation (“min” is for “minimum”). If a andb are two numbers, then min{a, b} is the smaller of a and b. For example,min{5, 4} = 4. If a and b are equal, then min{a, b} is just a (or b). Forexample, min{
√4, 2} = 2.
ii. Using absolute value notation and the value of δ that you have found, writean expression for x such that x is within δ of 3.
(c) i. Find a real number δ such that whenever x is within δ of 3, f(x) is within1/2 of 9. Write this number using the min notation.
ii. Using absolute value notation and the value of δ that you have found, writean expression for x such that x is within δ of 3.
(d) Is it true that for any positive number ε, there is a positive δ so that f(x) iswithin ε of 9 whenever x is within δ of 3? (ε is the lowercase Greek letter epsilonand stands for “error.”)
If your answer is yes, show how you can write an expression in terms of ε for a δthat works. Explain why your δ works.
If your answer is no, show that there is a positive number ε for which the statementabove is not true.
7 Math 1A Worksheets, 7th Edition
Additional Problems
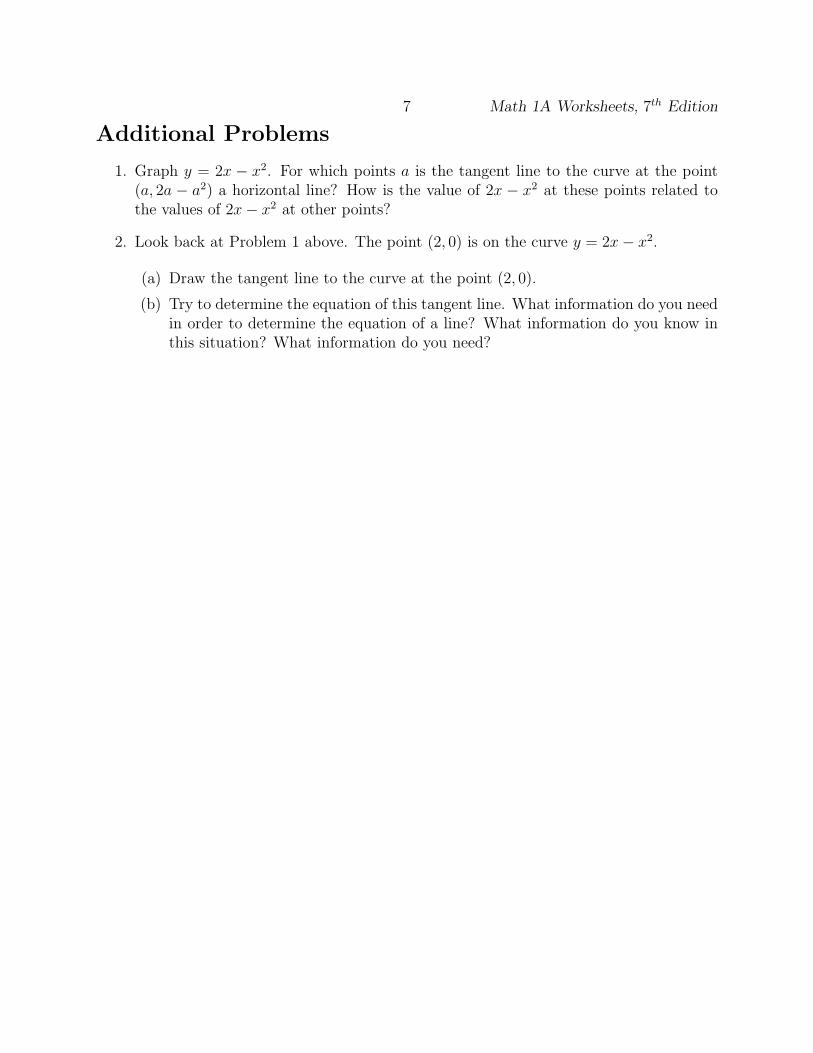
1. Graph y = 2x − x2. For which points a is the tangent line to the curve at the point(a, 2a − a2) a horizontal line? How is the value of 2x − x2 at these points related tothe values of 2x− x2 at other points?
2. Look back at Problem 1 above. The point (2, 0) is on the curve y = 2x− x2.
(a) Draw the tangent line to the curve at the point (2, 0).
(b) Try to determine the equation of this tangent line. What information do you needin order to determine the equation of a line? What information do you know inthis situation? What information do you need?
Math 1A Worksheets, 7th Edition 8
4. Limits of Functions
Questions
1. Suppose f is a function and L and a are real numbers.
(a) Describe what is meant by limx→a f(x) = L as best you can.
(b) Graph a function y = f(x) such that limx→a f(x) = L, and f(a) = L.
(c) Graph a function y = f(x) such that limx→a f(x) = L, but f(a) 6= L.
(d) Graph a function y = f(x) such that limx→a f(x) = L, and f(a) does not exist.
2. Is∞ a number? What does limx→a f(x) = ∞mean? Does limx→a f(x) = ∞mean thatthe limit exists? Graph a function y = f(x) with a point x = a where limx→a f(x) = ∞.Can you write down a formula for such a function?
3. What does the Squeeze Theorem say? Draw a picture illustrating this theorem. Whatconditions do you need to check before applying the Squeeze Theorem?
4. What do we mean by limx→a− f(x) = L? What is meant by limx→a+ f(x) = L? Grapha function y = f(x) and some point x = a where limx→a− f(x) 6= limx→a+ f(x). Findan algebraic expression for such a function.
Problems
1. (a) Is the limit of a sum always the sum of the limits? Give an example wherelimx→a[f(x) + g(x)] exists even though neither limx→a f(x) nor limx→a g(x) exist.
(b) Is the limit of a product always the product of the limits? Give an example wherelimx→a[f(x)g(x)] exists even though neither limx→a f(x) nor limx→a g(x) exist.
2. (a) Find limx→0+(1x− 1
|x|), limx→0−(1x− 1
|x|), and limx→0(1x− 1
|x|), if they exist. Graph
f(x) = ( 1x− 1
|x|) to check your answers. (Hint: What does |x| equal when x < 0?)
(b) Show that limx→0 |x| = 0. Graph g(x) = |x| to check your answer.
(c) Show that limx→0|x|x
does not exist. Graph h(x) = |x|x
to check your answer.
3. For what kinds of functions can one evaluate the limit limx→a f(x) by just plugging inx = a? Give an example of a function f(x) for which the limit limx→a f(x) exists andcan be evaluated, yet for which this substitution doesn’t work.
9 Math 1A Worksheets, 7th Edition
Additional Problems
1. Below are listed three limits and three methods for evaluating limits. Match the bestmethod to each limit and evaluate each limit. (Find the best method if you did nothave a graphing calculator or computer.)
• limx→0
x1000 − 703x506 + πx17 + 480
−372x75 + 39x14 +√7x5 − 24
• graphing
• limx→4
x2 + 2x− 24
x− 4• algebra
• limx→0
x2 sin
(
1
x
)
• direct substitution
Explain why the method you chose is the best of the three possibilities.
2. Using a calculator, try to guess limn→∞ n sin(
πn
)
. (Remember that n is in radians, notdegrees!)
3. Draw a circle of radius 1. Inscribe a regular n-gon inside it. Draw line segments fromthe vertices to the center.
(a) What is the measure of the angles formed around the center of the circle?
(b) What is the area of one triangle? What is the area of the polygon?
(c) Calculate limn→∞ (Area of n-gon). Does this answer make sense intuitively?
Math 1A Worksheets, 7th Edition 10
5. The Precise Definition of a Limit
Questions
1. An important aspect of mathematical statements is the order of the words in thestatement.
(a) “If 4 divides a number, then that number is even.” (“a divides b” means that bis divisible by a.)
(b) “If a number is even, then 4 divides that number.”
Determine if each statement is true or false. If true, explain why. If false, give acounterexample. Why is the order of the two parts in each statement important?
2. Another important concept in mathematical statements is a quantifier : a phrase suchas “for every” or “there exists.” (These are sometimes written ∀ and ∃.)
(a) “Every number is even.”
(b) “There exists a number which is even.”
Determine whether statements a and b are true or false. If true, explain why. Iffalse, give a counterexample.
(c) Now look back at the definition of limx→a f(x) = L. What are the quantifiers?
3. Suppose a, L, ε, and δ are real numbers, and that ε and δ are positive.
(a) What interval is determined by |x−a| < δ? What is the left endpoint? The rightendpoint? The midpoint? Sketch the interval on the x-axis.
(b) Sketch the set given by 0 < |x− a| < δ. How does this set of real numbers differfrom the interval given in part a?
(c) On the y-axis, sketch the interval for |y − L| < ε. What are the endpoints andthe midpoint?
(d) Now sketch the region in the xy-plane determined by |x− a| < δ and |y−L| < ε.
(e) Graph a function f so that |f(x)− L| < ε whenever 0 < |x− a| < δ.
(f) On the same axes and using the same L and a, graph a function g which does notsatisfy the statement |g(x)− L| < ε whenever 0 < |x− a| < δ.
11 Math 1A Worksheets, 7th Edition
Problems
1. (a) In Problem 4d of Worksheet 3 you found the ingredients for a graphically moti-vated ε–δ proof that limx→3 x
2 = 9, i.e. for every ε > 0 there is a δ > 0 such that|x2 − 9| < ε whenever 0 < |x− 3| < δ. Write out that proof.
(b) Example 4 of your textbook gives an algebraically motivated ε–δ proof thatlimx→3 x
2 = 9. Here are some questions about the first part of that example:finding the right δ.
Example 4 starts by stating the result to be proved:For every ε > 0 there is a δ > 0 so that |x2 − 9| < ε whenever 0 < |x− 3| < δand working backward, looking at the statement and finding some of its properties.
i. How can you factor |x2 − 9|?ii. Assuming (as in the statement) that |x − 3| < δ means that the function
y = |x− 3| is bounded on the interval [3− δ, 3 + δ]. What are its upper andlower bounds on that interval?
iii. This also means that the function y = |x + 3| is bounded on the interval[3− δ, 3 + δ]. What are its upper and lower bounds on that interval?
iv. The number δ is supposed to be small, so it’s reasonable to assume thatδ < 1. Given that assumption, what is another upper bound for y = |x + 3|on [3− δ, 3 + δ]?
v. Now, how can you choose δ so that |x2 − 9| < ε?
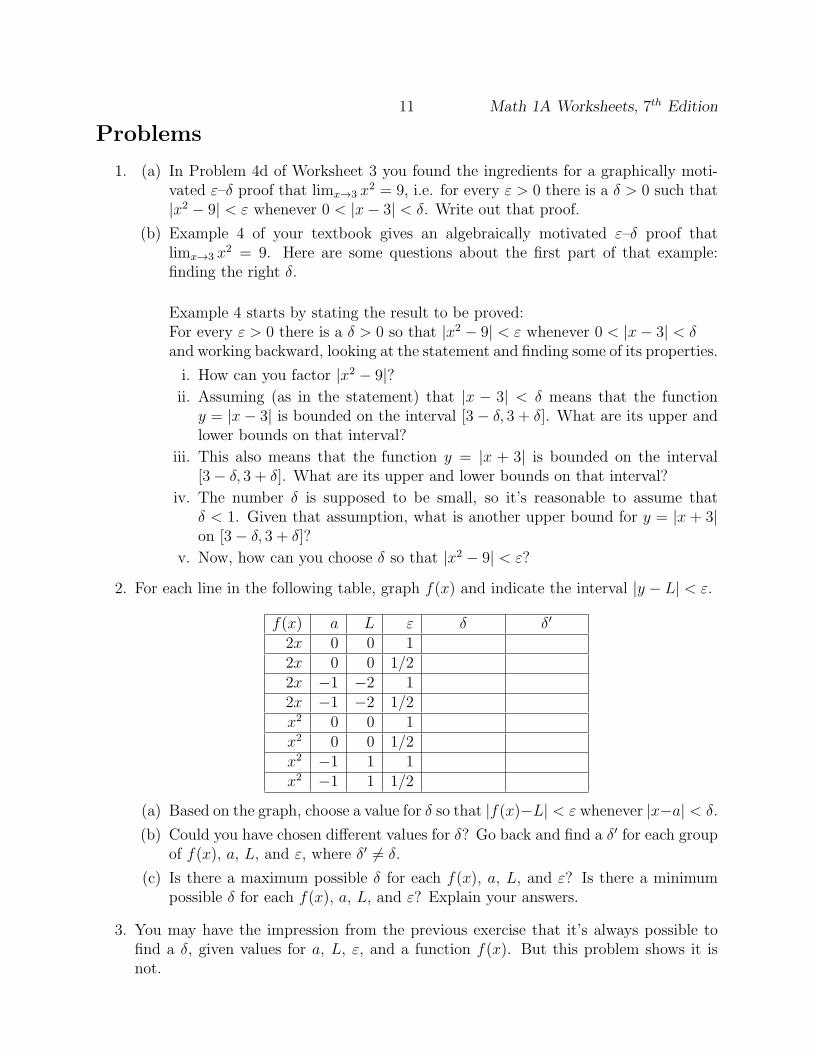
2. For each line in the following table, graph f(x) and indicate the interval |y − L| < ε.
f(x) a L ε δ δ′
2x 0 0 12x 0 0 1/22x −1 −2 12x −1 −2 1/2x2 0 0 1x2 0 0 1/2x2 −1 1 1x2 −1 1 1/2
(a) Based on the graph, choose a value for δ so that |f(x)−L| < ε whenever |x−a| < δ.
(b) Could you have chosen different values for δ? Go back and find a δ′ for each groupof f(x), a, L, and ε, where δ′ 6= δ.
(c) Is there a maximum possible δ for each f(x), a, L, and ε? Is there a minimumpossible δ for each f(x), a, L, and ε? Explain your answers.
3. You may have the impression from the previous exercise that it’s always possible tofind a δ, given values for a, L, ε, and a function f(x). But this problem shows it isnot.
Math 1A Worksheets, 7th Edition 12
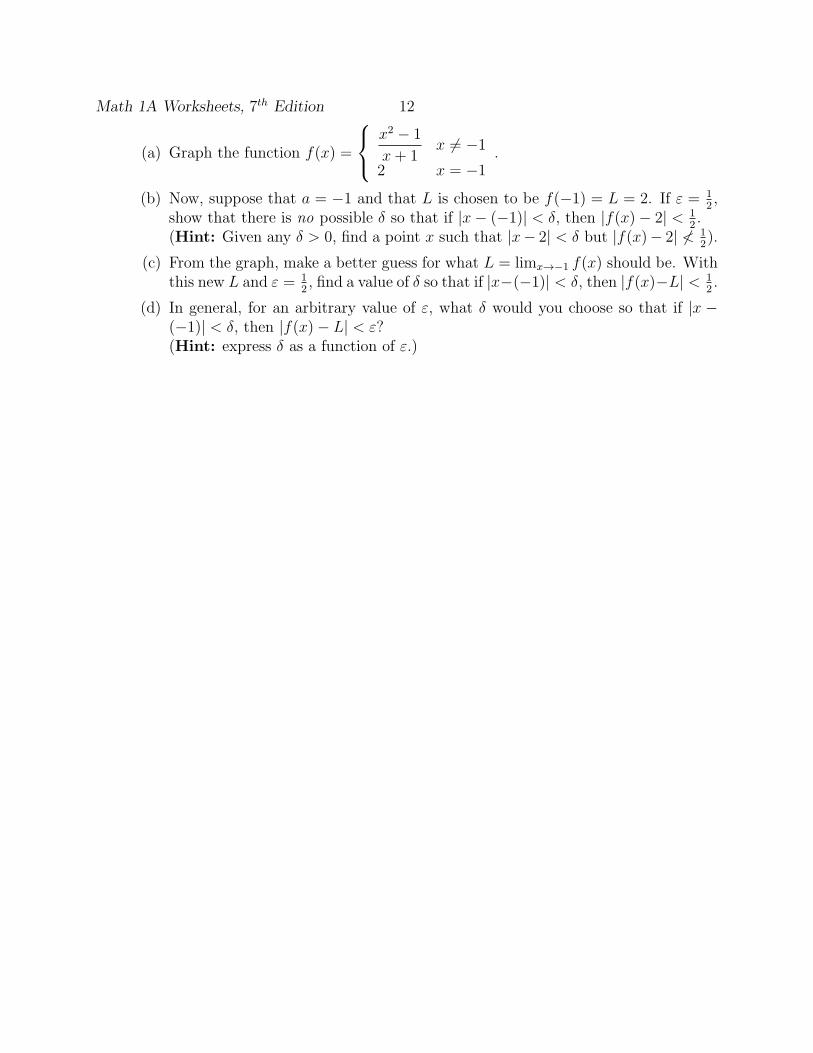
(a) Graph the function f(x) =
x2 − 1
x+ 1x 6= −1
2 x = −1.
(b) Now, suppose that a = −1 and that L is chosen to be f(−1) = L = 2. If ε = 12,
show that there is no possible δ so that if |x− (−1)| < δ, then |f(x)− 2| < 12.
(Hint: Given any δ > 0, find a point x such that |x− 2| < δ but |f(x)− 2| 6< 12).
(c) From the graph, make a better guess for what L = limx→−1 f(x) should be. Withthis new L and ε = 1
2, find a value of δ so that if |x−(−1)| < δ, then |f(x)−L| < 1
2.
(d) In general, for an arbitrary value of ε, what δ would you choose so that if |x −(−1)| < δ, then |f(x)− L| < ε?(Hint: express δ as a function of ε.)
13 Math 1A Worksheets, 7th Edition
6. Continuity
Questions
1. There are at least three different types of discontinuities. Give a graphical example ofeach discontinuity: removable, jump, and infinite.
2. What three properties does a function f(x) need if it’s going to be continuous at apoint a?
3. What does it mean for a function to be continuous on an interval?
4. (a) Continuous functions are quite common. What are two basic types of continuousfunctions?
(b) What operations allow you to build more continuous functions from already-known continuous functions? List as many of the operations as you can.
5. When can you “pull the limit inside a function”? That is, what do you need to knowabout f and g, so that
limx→a
f(g(x)) = f(b) = f(limx→a
g(x))?
Problems
1. Let f(x) =
{
1− x2 if 0 ≤ x ≤ 11 + x
2if 1 < x ≤ 2
(a) Show that f is not continuous on [0, 2].
(b) Show that f does not take on all values between f(0) and f(2), in other wordsthat there’s a number between f(0) and f(2) that is not a value of f on theinterval [0, 2].
2. (a) Show that if f is a continuous function on an interval, then so is |f |.(b) If |f | is continuous, must f be continuous? If so, prove it. If not, find a coun-
terexample.
3. Assume that f(x) and g(x) are continuous at a number a and that c is a constant.
(a) Prove that cf(x) is also continuous at a.
(b) Prove that f(x) · g(x) is also continuous at a.
Math 1A Worksheets, 7th Edition 14
4. (a) What does the Intermediate Value Theorem say? Draw an example illustratingthis theorem. Explain why it makes sense based on what you know about thegraph of a continuous functions.
(b) Does the Intermediate Value Theorem say that there is only one number c in theinterval (a, b) with the property you want – where f(c) = N? Draw a picturewith multiple c’s, if you haven’t done so already.
Additional Problems
1. Give an ε− δ definition of f being continuous at a. There is one that is quite similarto the ε− δ definition of limx→a f(x) = L.
2. (a) Find a function whose domain is all real numbers but which is continuous nowhere.
(b) Find a function whose domain is all real numbers and is continuous at exactlyone point.
3. A fixed point of a function f is a number c in its domain such that f(c) = c. (Thefunction doesn’t move c; it stays fixed.)
(a) Sketch the graph of a continuous function with domain [0, 1] whose range also liesin [0, 1]. Locate a fixed point of f .
(b) Try to draw the graph of a continuous function with domain[0, 1] and range [0, 1]that does not have a fixed point. What is the obstacle?
(c) Use the Intermediate Value Theorem to prove that any continuous function withdomain [0, 1] and range in [0, 1] must have a fixed point.(Hint: Apply the intermediate value theorem to the function g(x) = f(x)− x.)
15 Math 1A Worksheets, 7th Edition
7. Limits at Infinity and Asymptotes
Questions
1. (a) Draw the graphs of three functions with vertical asymptotes at x = a which are asdifferent as possible. Describe these differences using limits, e.g., limx→a+ f(x) =∞, but limx→a+ g(x) = −∞. How many different vertical asymptotes can thegraph of a function have?
(b) Draw three different graphs of functions with horizontal asymptotes that are asdifferent as possible. How many different horizontal asymptotes can the graph ofa function have?
2. Let f , g, h, j, and k be functions. Assume that
i. limx→∞ f(x) = ∞,
ii. limx→∞ g(x) = −∞,
iii. limx→∞ h(x) = c > 0 (where c is a constant),
iv. limx→∞ j(x) = 0,
v. limx→∞ k(x) = 0+.
Have each person in the group explain to the group how to do two of the followingproblems. Simplify all expressions that you can. Indicate which limits you can’tevaluate. Explain your reasoning and explain when you use (i) through (v) above.
(a) limx→∞[f(x) + j(x)] =
(b) limx→∞[g(x) + h(x)] =
(c) limx→∞[f(x) + g(x)] =
(d) limx→∞[f(x)− g(x)] =
(e) limx→∞[h(x)j(x)] =
(f) limx→∞[h(x)g(x)] =
(g) limx→∞[k(x)g(x)] =
(h) limx→∞[f(x)g(x)] =
(i) limx→∞[j(x)/f(x)] =
(j) limx→∞[f(x)/j(x)] =
(k) limx→∞[f(x)/g(x)] =
(l) limx→∞[k(x)/j(x)] =
Math 1A Worksheets, 7th Edition 16
Problems
1. Make a rough sketch of the curve y = xn, where n is an integer, for the following fivecases: (i) n = 0; (ii) n > 0, n odd; (iii) n > 0, n even; (iv) n < 0, n even; and (v)n < 0, n odd. In each case, find the following limits.
(a) limx→0+ xn
(b) limx→0− xn
(c) limx→∞ xn
(d) limx→−∞ xn
2. Let P and Q be polynomials with leading coefficients a and b respectively. Findlimx→∞
P (x)Q(x)
if the degree of P is
(a) less than the degree of Q.
(b) equal to the degree of Q.
(c) greater than the degree of Q.
17 Math 1A Worksheets, 7th Edition
8. Derivatives
Questions
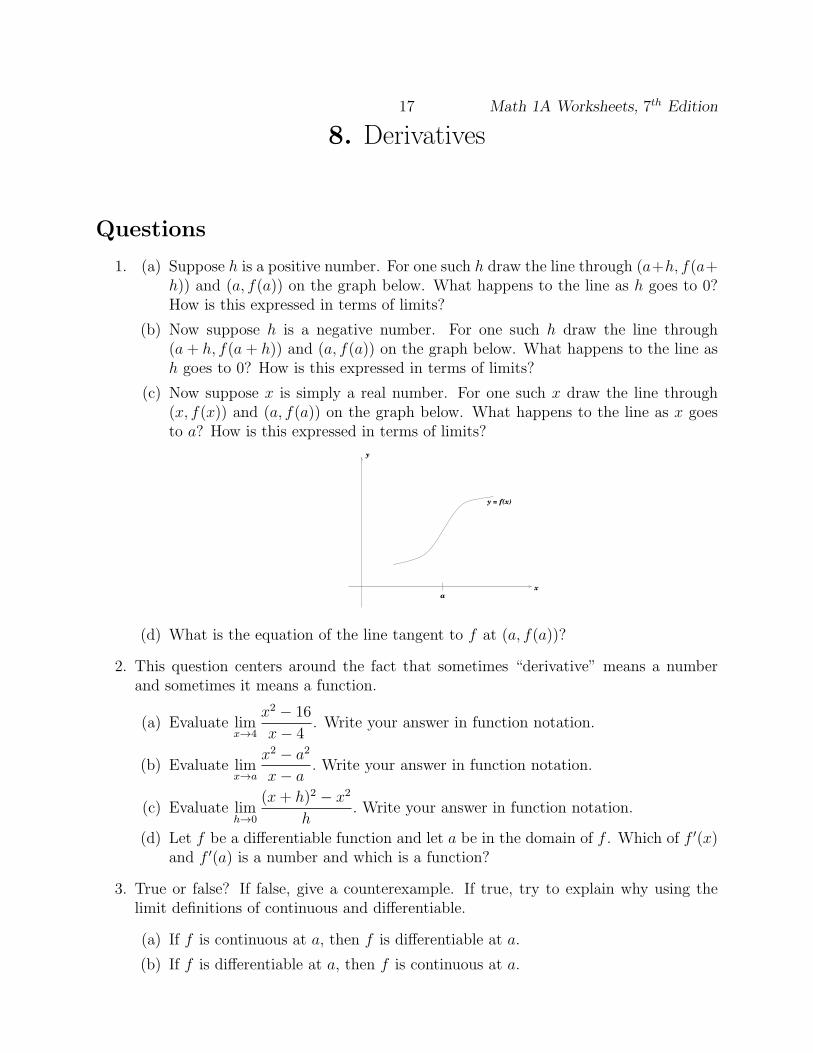
1. (a) Suppose h is a positive number. For one such h draw the line through (a+h, f(a+h)) and (a, f(a)) on the graph below. What happens to the line as h goes to 0?How is this expressed in terms of limits?
(b) Now suppose h is a negative number. For one such h draw the line through(a+ h, f(a+ h)) and (a, f(a)) on the graph below. What happens to the line ash goes to 0? How is this expressed in terms of limits?
(c) Now suppose x is simply a real number. For one such x draw the line through(x, f(x)) and (a, f(a)) on the graph below. What happens to the line as x goesto a? How is this expressed in terms of limits?
y
ax
y = f(x)
(d) What is the equation of the line tangent to f at (a, f(a))?
2. This question centers around the fact that sometimes “derivative” means a numberand sometimes it means a function.
(a) Evaluate limx→4
x2 − 16
x− 4. Write your answer in function notation.
(b) Evaluate limx→a
x2 − a2
x− a. Write your answer in function notation.
(c) Evaluate limh→0
(x+ h)2 − x2
h. Write your answer in function notation.
(d) Let f be a differentiable function and let a be in the domain of f . Which of f ′(x)and f ′(a) is a number and which is a function?
3. True or false? If false, give a counterexample. If true, try to explain why using thelimit definitions of continuous and differentiable.
(a) If f is continuous at a, then f is differentiable at a.
(b) If f is differentiable at a, then f is continuous at a.
Math 1A Worksheets, 7th Edition 18
Problems
1. Let f(t) be the function describing your distance from Berkeley at time t.
(a) In each of these situations, graph y = f ′(t) and y = f(t). When the graphsare positive or negative, increasing or decreasing, explain why they have thesefeatures.
i. You drive quickly to the Bay Bridge, get stuck in traffic on the bridge, anddrive at a medium pace through San Francisco to your destination.
ii. You drive to Emeryville but you have forgotten your books so you driveback to Berkeley, then back through Emeryville and over the bridge to SanFrancisco.
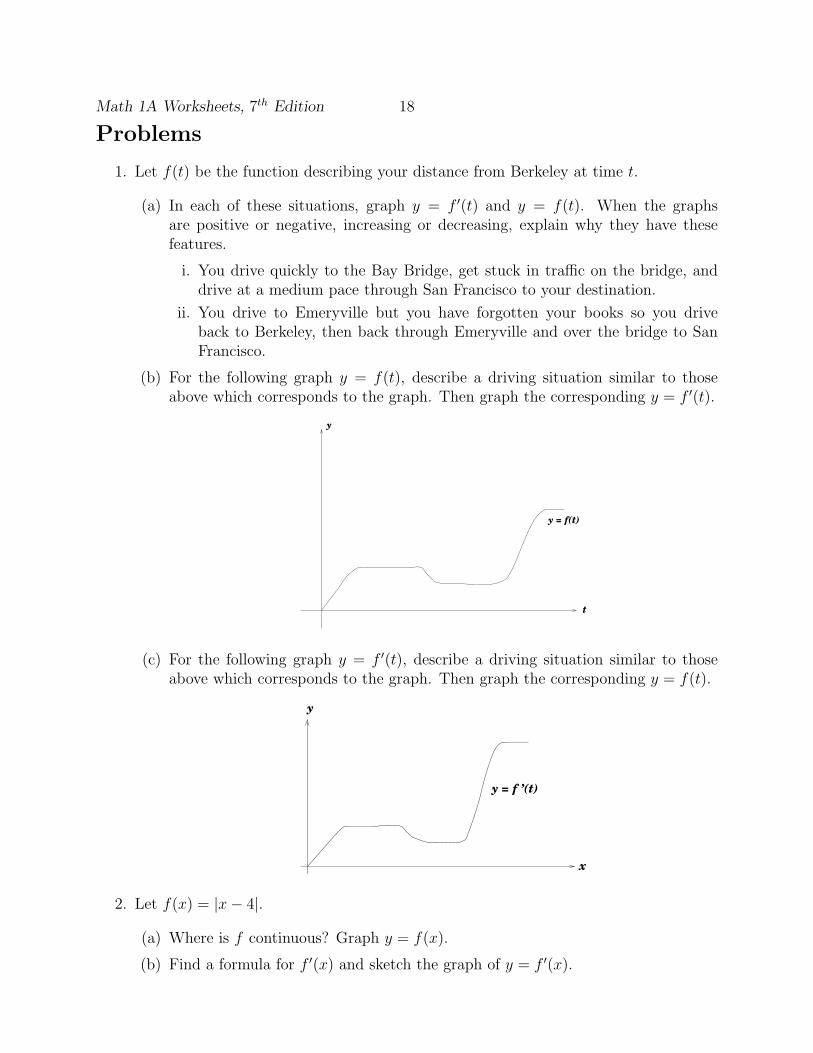
(b) For the following graph y = f(t), describe a driving situation similar to thoseabove which corresponds to the graph. Then graph the corresponding y = f ′(t).
t
y
y = f(t)
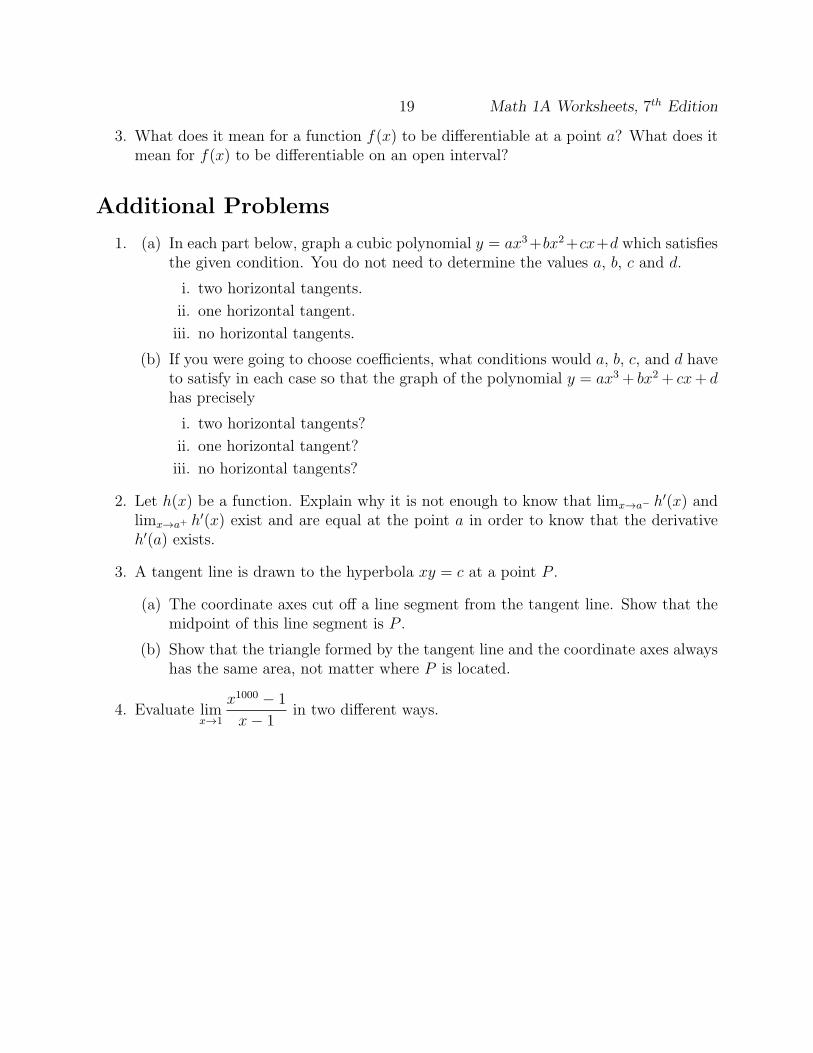
(c) For the following graph y = f ′(t), describe a driving situation similar to thoseabove which corresponds to the graph. Then graph the corresponding y = f(t).
y = f ’(t)
x
y
2. Let f(x) = |x− 4|.
(a) Where is f continuous? Graph y = f(x).
(b) Find a formula for f ′(x) and sketch the graph of y = f ′(x).
19 Math 1A Worksheets, 7th Edition
3. What does it mean for a function f(x) to be differentiable at a point a? What does itmean for f(x) to be differentiable on an open interval?
Additional Problems
1. (a) In each part below, graph a cubic polynomial y = ax3+bx2+cx+d which satisfiesthe given condition. You do not need to determine the values a, b, c and d.
i. two horizontal tangents.
ii. one horizontal tangent.
iii. no horizontal tangents.
(b) If you were going to choose coefficients, what conditions would a, b, c, and d haveto satisfy in each case so that the graph of the polynomial y = ax3 + bx2 + cx+ dhas precisely
i. two horizontal tangents?
ii. one horizontal tangent?
iii. no horizontal tangents?
2. Let h(x) be a function. Explain why it is not enough to know that limx→a− h′(x) andlimx→a+ h′(x) exist and are equal at the point a in order to know that the derivativeh′(a) exists.
3. A tangent line is drawn to the hyperbola xy = c at a point P .
(a) The coordinate axes cut off a line segment from the tangent line. Show that themidpoint of this line segment is P .
(b) Show that the triangle formed by the tangent line and the coordinate axes alwayshas the same area, not matter where P is located.
4. Evaluate limx→1
x1000 − 1
x− 1in two different ways.
Math 1A Worksheets, 7th Edition 20
9. Differentiation
Questions
1. Explain how to use the product rule to find ddx(x2). Now find this derivative using the
limit definition of derivative. Which is easier? Would you rather find ddx(x4) using the
product rule or the definition? Why?
2. Evaluate the following limits. Explain how you derived your answers.
(a) limx→∞
cos
(
1
x
)
(b) limx→∞
(
x− x cos1
x
)
(c) limx→0
sin(sin x)
sin x
(d) limx→0
sin(sin x)
x
Problems
1. The general polynomial of degree n has the form P (x) = anxn+an−1x
n−1+ . . .+a2x2+
a1x1 + a0, where an 6= 0. Find the derivative of P . Which differentiation rules did you
use?
2. Find ddx(x+ 2), d
dx((x+ 2)2) and d
dx((x+ 2)3) by using the product rule. What do you
think ddx((x+ 2)100) would be? How would you calculate this using the power rule?
3. Prove the power rule ddx(xn) = n ·xn−1 when n is a positive integer. First try using the
limx→a definition of derivative. How would the proof work with the limh→0 definitioninstead? How would the proof go using the product rule?
4. (a) Let θ = 2x, then the identity cos 2x = 1−2 sin2 x becomes cos θ = 1−2 sin2(θ/2).Use this fact and limθ→0
sin θθ
= 1 to prove that limθ→0cos θ−1
θ= 0.
(b) Using the limh→0 definition of a derivative and the result from part (a), show thatddx
cos x = − sin x.
(c) Now use the result from part (a), the equation sin2 x+cos2 x = 1 and the productrule to prove that d
dxsin x = cos x.
21 Math 1A Worksheets, 7th Edition
Additional Problems
1. (a) What is the definition of an even function? What is the definition of an oddfunction?
(b) Sketch the graphs of two different even functions and two different odd functions.
(c) Prove that, given it has a derivative, the derivative of an even function is an oddfunction.
(d) Prove that, given it has a derivative, the derivative of an odd function is an evenfunction.
(e) Let g(x) be a differentiable even function. Find g′(0).
2. Make a careful sketch of the graph of the sine function. Draw in the tangent lines atthe points 0, π/6, π/4, π/3, and π/2. Now, using only information from this graph,sketch the graph of the derivative of sine. How does your graph compare to the graphof the function you know is the derivative of sine?
3. Prove the product rule for derivatives. (Hint: Let F (x) = f(x)g(x). Find F ′(x)using the limh→0 definition of a derivative. Adding and subtracting f(x + h)g(x) inthe numerator might help.)
Math 1A Worksheets, 7th Edition 22
10. The Chain Rule
Questions
1. Let f(x) and g(x) be differentiable functions. Decide which of the following statementsare true. When a statement is false, give an example which contradicts the assertion.Then give a correct version of the statement and an example that illustrates it.
(a) The derivative of a product fg is the product of the derivatives f ′g′.
(b) The derivative of a sum f + g is the sum of the derivatives f ′ + g′.
(c) The derivative of a quotient f/g is the quotient of the derivatives f ′/g′.
(d) The derivative of a composition f(g(x)) is the composition of the derivativesf ′(g′(x)).
2. Before attempting to use the chain rule, it is important to understand composition offunctions well. Suppose that k(x) = f(g(h(x))). Fill in the blanks with the appropriatefunctions.
If f(x) = x2, g(x) = sin x, h(x) = cos 4x, then k(x) = .If f(x) = 1/x, g(x) = , h(x) = (12− x2), then k(x) = (12− x2)−2.If f(x) = , g(x) = x, h(x) = , then k(x) = cos(tan x).If f(x) = , g(x) = , h(x) = , then k(x) = [1− (3x− 2)3]4.
3. You’ve learned about composing two functions, e.g., if f(x) = x2 and g(x) = x + 1,then f ◦ g(x) = (x+ 1)2. Decomposing a function reverses this process. For instance,if h(x) = (x+1)2 then f ◦ g(x), where f and g are as above, is called a decompositionof h.
(a) h(x) = (x+ 1)2 can be decomposed in several other ways. Find one.
(b) Can a function always be decomposed in more than one way? For instance, canh(x) = x be decomposed in more than one way? Give an example of a functionthat can’t be decomposed in two ways, or explain why you think that all functionscan be decomposed in more than one way.
4. (a) Consider the function h(x) = (x + 2)100. (See the previous worksheet, problem4.) Find two functions f and g such that h(x) = (f ◦ g)(x).
(b) Find h′(x) using the chain rule.
(c) Explain how the chain rule makes solving this problem much easier.
23 Math 1A Worksheets, 7th Edition
Problems
1. (a) Use the chain rule to find ddx( 1g(x)
).
(b) Use part a, the chain rule, and the product rule to prove the quotient rule.
2. (a) Sketch the graph of the function f(x) = | sin x|.(b) At what points is f not differentiable?
(c) Give a formula for f ′ and sketch its graph. (Hint: |x| =√x2.)
(d) Now do parts (a)–(c) for g(x) = sin |x|.
3. Use the Chain Rule to prove that the derivative of an even function is an odd function,and that the derivative of an odd function is an even function. (This is the sameproblem as Additional Problem 1 on the previous worksheet. Are these statementseasier to prove using the definition of derivative or using the chain rule?)
Additional Problems
1. Use the Chain Rule to show that if θ is measured in degrees, then ddθ(sin θ) = π
180cos θ.
(This gives one reason for the convention that radian measure is always used whendealing with trigonometric functions in calculus; the differentiation formulas would bemuch more complicated otherwise!)
2. (a) If n is a positive integer, prove that ddx(sinn x cosnx) = n sinn−1 x · cos(n+ 1)x.
(b) Find a similar formula for ddx(cosn x cosnx).
3. Prove the chain rule dydx
= dydu
dudx
starting with dydx
= lim∆x→0∆y∆x
.
(a) Case I: dudx
6= 0.
(b) Case II: dudx
= 0, where ∆u = 0 for some values of ∆x and ∆u 6= 0 for othervalues of ∆x. What happens if ∆x → 0 through values such that ∆u 6= 0? Whathappens if instead ∆x → 0 through values such that ∆u = 0?
Math 1A Worksheets, 7th Edition 24
11. Implicit differentiation and higher derivatives
Questions
1. Give an example of y as a function of x, y = f(x). Now give an example of an implicitfunction describing a relation involving x and y, F (x, y) = 0, such as sin x − y3 = 0.Can your implicit function be rewritten in terms of explicit functions? Try to find animplicit function which no one else in your group can rewrite in terms of an explicitfunction.
2. A family of curves is described by a set of functions with one (or more) parameters.For example, the general formula of a circle x2 + y2 = r2 is actually a family of curvesbecause the parameter r is a stand-in for all different possible radii lengths. The goalof this question is to answer part (c) below but parts (a) and (b) are meant to serveas preliminary questions.
(a) How can you tell if two lines are perpendicular? (Give graphical and algebraicanswers.)
(b) What does it mean for two curves to be orthogonal? (Give graphical and algebraicanswers.)
(c) What does it mean for two families of curves to have orthogonal trajectories?(Give graphical and algebraic answers.)
3. Find the derivatives by figuring out a general pattern:
(a) D99 sin x
(b) D100 cos x
(c) D50 cos 2x
(d) D35x sin x
4. What does n! mean?
Problems
1. (a) Show, using implicit differentiation, that the tangent to the ellipsex2
a2+ y2
b2= 1 at the point (x0, y0) is
x0xa2
+ y0yb2
= 1.
(b) Sketch a graph of an ellipse and draw in the tangent lines at the points of inter-section with the coordinate axes.
(c) Do the equations of these lines agree with what you expected from the first part?
25 Math 1A Worksheets, 7th Edition
2. Is the following statement true or false? If it’s true, explain why. If it’s false, give acounterexample and correct the statement.
If P is a polynomial of degree 6, then P (7) = 0.
(Recall that P (7)(x) is the seventh derivative of P .) Once you have a true precedingstatement, come up with a more general statement that is also true.
3. Consider the curve defined implicitly by the equation y3 + xy + x4 = 11. Find d2ydx2 at
the point (1, 2). Find a formula for d2ydx2 in terms of only x and y (that is, without any
dydx’s in it).
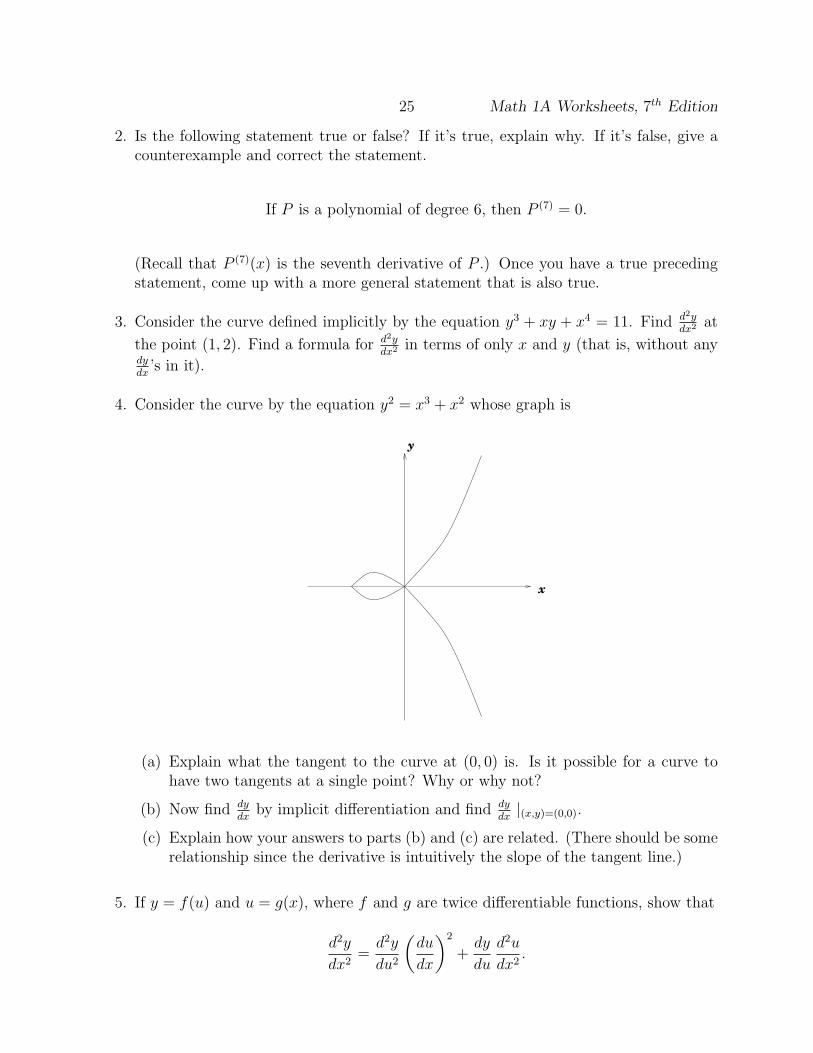
4. Consider the curve by the equation y2 = x3 + x2 whose graph is
x
y
(a) Explain what the tangent to the curve at (0, 0) is. Is it possible for a curve tohave two tangents at a single point? Why or why not?
(b) Now find dydx
by implicit differentiation and find dydx
|(x,y)=(0,0).
(c) Explain how your answers to parts (b) and (c) are related. (There should be somerelationship since the derivative is intuitively the slope of the tangent line.)
5. If y = f(u) and u = g(x), where f and g are twice differentiable functions, show that
d2y
dx2=
d2y
du2
(
du
dx
)2
+dy
du
d2u
dx2.
Math 1A Worksheets, 7th Edition 26
Additional Problems
1. Find a third-degree polynomial Q such that Q(1) = 1, Q′(1) = 3, Q′′(1) = 6, andQ′′′(1) = 12.
2. Use implicit differentiation to prove the binomial theorem. Let f(x) = (1 + x)n. f isobviously a nth degree polynomial, so it must look like f(x) = a0+a1x+a2x
2+a3x3+
. . . + anxn. Now, f(0) = (0 + 1)n = 1 so we know that a0 = 1. Differentiating f tells
us that f ′(x) = n(1 + x)n−1 = a1 + 2a2x + . . . + nanxn−1 and since f ′(0) = n = a1,
we know two coefficients already. Continue this process to find expressions for all thecoefficients.
27 Math 1A Worksheets, 7th Edition
12. Using Differentiation to do Approximations
Questions
1. What is the equation of the tangent line to the curve y = f(x) at (a, f(a))? Nowexpress this equation in terms of differentials.
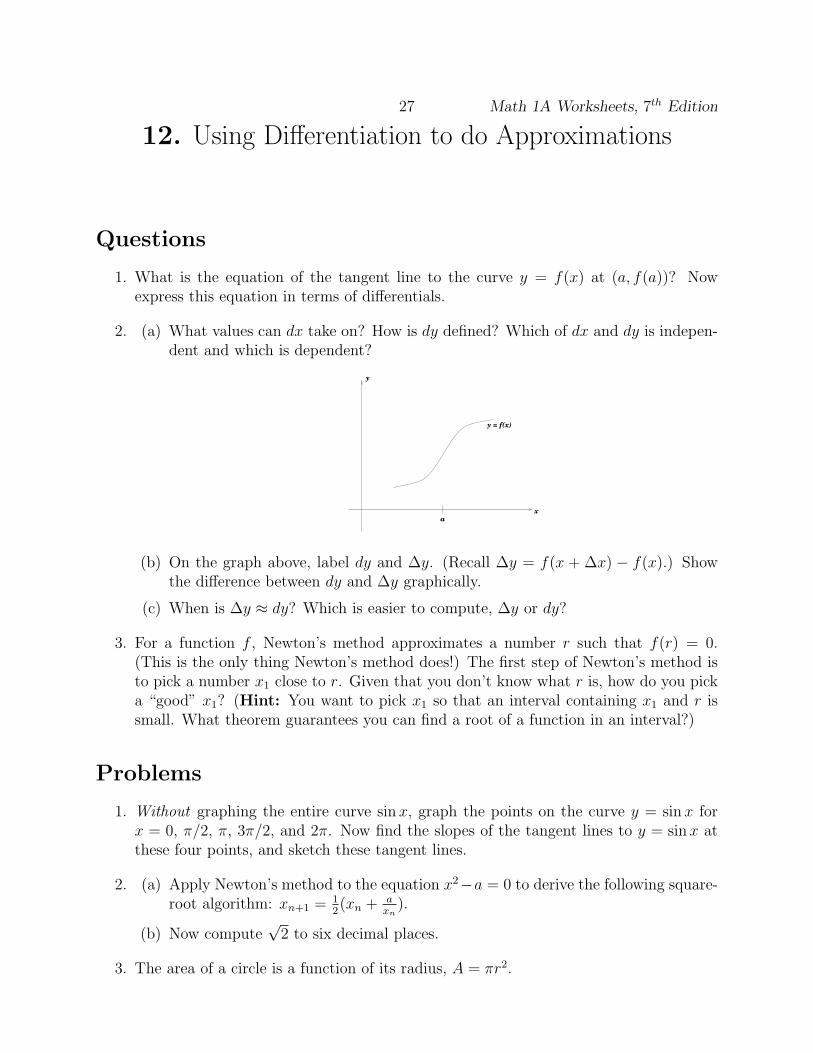
2. (a) What values can dx take on? How is dy defined? Which of dx and dy is indepen-dent and which is dependent?
y
ax
y = f(x)
(b) On the graph above, label dy and ∆y. (Recall ∆y = f(x + ∆x) − f(x).) Showthe difference between dy and ∆y graphically.
(c) When is ∆y ≈ dy? Which is easier to compute, ∆y or dy?
3. For a function f , Newton’s method approximates a number r such that f(r) = 0.(This is the only thing Newton’s method does!) The first step of Newton’s method isto pick a number x1 close to r. Given that you don’t know what r is, how do you picka “good” x1? (Hint: You want to pick x1 so that an interval containing x1 and r issmall. What theorem guarantees you can find a root of a function in an interval?)
Problems
1. Without graphing the entire curve sin x, graph the points on the curve y = sin x forx = 0, π/2, π, 3π/2, and 2π. Now find the slopes of the tangent lines to y = sin x atthese four points, and sketch these tangent lines.
2. (a) Apply Newton’s method to the equation x2−a = 0 to derive the following square-root algorithm: xn+1 =
12(xn +
axn).
(b) Now compute√2 to six decimal places.
3. The area of a circle is a function of its radius, A = πr2.
Math 1A Worksheets, 7th Edition 28
(a) Sketch two circles, one with radius r and the second with radius r + ∆r where∆r is reasonably small.
(b) Express ∆A and dA symbolically.
(c) Shade in the area representing ∆A on your sketch.
(d) Explain why dA is a good approximation to ∆A. (Hint: Recall that the innercircle has circumference 2πr.)
4. Without graphing sin x, sketch the quadratic approximation to f(x) = sin x for thepoints a = π/2 and 3π/2. (To find the quadratic approximation P (x) to the functionf(x) at x = a, start with P (x) = A + B(x − a) + C(x − a)2 where P (a) = f(a),P ′(a) = f ′(a) and P ′′(a) = f ′′(a). You’ll have three equations with the variables A, Band C and you plug them into each other to find P (x).) How much does this quadraticapproximation resemble sin x?
Additional Problems
1. If f(x) =
{ √x if x ≥ 0
−√−x if x < 0
, then the root of f is x = 0. Explain why Newton’s
method fails to find the root no matter what initial approximation x1 6= 0 is used.Illustrate your explanation with a sketch.
2. Prove the following rules for working with differentials, where c is a constant and uand v are functions of x.
(a) dc = 0
(b) d(cu) = cdu
(c) d(u+ v) = du+ dv
(d) d(uv) = udv + vdu
(e) d(uv) = vdu+udv
v2
(f) d(xn) = nxn−1dx
3. How many solutions are there to x = sin x? Explain why your answer is correct.(Hint: It may be helpful to graph y = x and y = sin x on the same graph.)

29 Math 1A Worksheets, 7th Edition
13. Exponential Functions
Questions
1. (a) Let n be a positive integer and a be a real number. Write an expression withoutexponential notation for an. In other words, how do you define an?
(b) Show, by giving counterexamples, that the equations ax+y = ax + ay and (ax)y =a(x
y) do not always hold. What are the correct rules for ax+y and (ax)y?
2. Sketch the graphs of y = 1x, y = 2x, y = 4x, y = (1/2)x, and y = (1/4)x. Are there anypoints that all these graphs have in common? For each graph, find the approximatevalue of the slope of the tangent to the graph through its y-intercept.
3. Graph the exponential function, f(x) = ex. What is the equation of the tangent lineat the y-intercept?
Problems
1. (a) Using the limh→0 definition of a derivative, show that the derivative of an expo-nential function is proportional to the function itself. In other words, show thatif f(x) = ax, then f ′(x) = k · ax = k f(x). What is the value of the constant k foreach function ax?
(b) How is the function f(x) = ex different from other exponential functions? (Hint:
how is the derivative of ex different from 2x or 3x?)
2. Find the hundredth derivative of f(x) = xe−x. (Hint: compute the first few deriva-tives. What is the pattern?)
3. (a) Use the Intermediate Value Theorem to show that there is a root of the equationex + x = 0.
(b) Use Newton’s Method to find that root, correct to six decimal places.
4. Sketch the graphs of the functions x2 and 2x. How many times do the graphs intersect?Find at least one of these points of intersection. Which function is growing the mostquickly? How can you tell?
Additional Problems
1. Evaluate limx→πesinx − 1
x− π.
2. For what value of a are the graphs of y = ax and y = loga x tangent to each other?
Math 1A Worksheets, 7th Edition 30
14. Inverse Functions
Questions
1. A function is “one-to-one” if for any two distinct points x1 6= x2 in the domain,f(x1) 6= f(x2). Give an example of a one-to-one function. Now give an example of afunction which is not one-to-one.
2. Given a graph, how can you tell geometrically if it’s the graph of a function? How canyou tell from the graph of a function whether it’s one-to-one? Sketch some pictures tosupport your answers.
3. To find the inverse of a function f(x): (i) Write down x = f(y); (ii) Solve this equationfor y; (iii) Then f−1(x) = y. We show this for f(x) = 3x+ 4:
x = 3y + 4 = f(y)
3y = x− 4
y =1
3x− 4
3
f−1(x) =1
3x− 4
3
Check by plugging in that f(f−1(x)) = x and f−1(f(x)) = x in the above case. Nowfind g−1(x) when g(x) = x3
2− 5.
4. Suppose f is a function with inverse f−1.
(a) If f−1(x) = y, what is f(y)? What is f(x)?
(b) If f(x) = y, what is f−1(x)? What is f−1(y)?
(c) Match up:
domain of f domain of f−1
range of f range of f−1
Problems
1. (a) If (a, b) is a point on the graph of y = f(x), what point must lie on the graph ofy = f−1(x)?
(b) Graph the function f(x) = x3 and its inverse on the same axes.
(c) Which line do the graph of a function and the graph of its inverse reflect through?(Hint: Turn your paper (or your head) π/4 radians.)

31 Math 1A Worksheets, 7th Edition
(d) What do you know about the points where the graphs of f and f−1 intersect?
2. (a) Why must a function be one-to-one in order to have an inverse? (Hint: Thinkabout how the graphs of f and f−1 are related (Question 4(c)). Also think aboutthe test for a graph to be a function, and the test for a function to be one-to-one(Question 2.))
(b) Often a function is not one-to-one and we use the idea of restricting its domainto make it one-to-one so we can find its inverse.
i. Is sin x one-to-one? Is sin x one-to-one when restricted to the interval [−π/2, π/2]?Explain how to define the well-known function sin−1 x.
ii. Explain how to restrict the domain of f(x) = x2 so we can find that its inverseis g(x) =
√x.
3. (a) Use implicit differentiation, the chain rule and f(f−1(x)) = x to find an expressionfor (f−1(x))′.
(b) Now try using f−1(f(x)) = x and y = f(x) to find the derivative of f−1(y).
(c) Does it matter which equality you use?
4. Suppose that f is a differentiable function, g is the inverse of f , and let G(x) = 1/g(x).If f(3) = 2 and f ′(3) = 1
9, find G′(2).
Additional Problems
1. Try sketching some examples and then explain why:
(a) The inverse of a continuous function is continuous.
(b) Except for points where there are horizontal tangents, the inverse of a differen-tiable function is also differentiable.
2. If f is a one-to-one, twice differentiable function with inverse function g, show thatg′′(x) = − f ′′(g(x))
[f ′(g(x))]3.
3. For which x does f−1(f(x)) = x? For which x does f(f−1(x)) = x? Using f(x) = x2,where x ≥ 0, and the technique of graphical function composition, show that theseequalities work where they are defined.
To find the composition f(g(a)) graphically, first graph both f and g on the same axes.Also draw in the line y = x. Now, starting at the point a on the x-axis, go up untilyou reach the point (a, g(a)). Next go over to the point (g(a), g(a)). From there, findthe point (g(a), f(g(a))). Finally, go back over to (a, f(g(a))).
Try graphical composition for a few points using f(x) = x2, where x ≥ 0, and g = f−1.Where do you usually end up? If you add in a line connecting the points (a, g(a)) and(a, f(g(a)), what shape would you have drawn? What happens if you find (a, g(f(a)))instead?
Math 1A Worksheets, 7th Edition 32
15. Logarithmic Functions and their Derivatives
Questions
1. For which real numbers a is the function f(x) = ax defined for all x?For which a does f(x) = ax have an inverse? Write a sentence explaining what loga xmeans.
2. Write a sentence explaining what ln x means. What is ln e? What is ln 1? If ln x = y,what is ey? For which x is ln(ex) = x? For which x is elnx = x?
3. (a) Graph y = ex and its tangent at the y-intercept. What is the equation of thistangent line?
(b) Graph and describe in words the logarithmic function y = ln x. What is theequation of the tangent line at the x-intercept?
(c) How are the two graphs in parts a and b related?
4. Have each person in your group pick one of the functions below (each person shouldpick a different one). Then sketch the graph of the function.Explain to the group how the graph you’ve drawn is related to the graph of y = ln x.For instance, the graph of y = − ln(x) is the reflection of the graph of y = ln(x) acrossthe x-axis.
(a) y = − ln(x)
(b) y = ln(−x)
(c) y = − ln(−x)
(d) y = ln |x|(e) y = ln(e)
(f) y = ln(x2)
(g) y = ln(1/x)
(h) y = ln(x+ 3)
(i) y = ln |x+ 3|
Problems
1. Let x, y > 0. We can prove that loga(xy) = loga x+ loga y as follows:
i. xy = xy
ii. xy = aloga x · aloga y
33 Math 1A Worksheets, 7th Edition
iii. xy = aloga x+loga y
iv. loga(xy) = loga[
aloga x+loga y]
v. loga(xy) = loga x+ loga y
Explain why each step of the proof above is true. Then write your own proofs forthe other two algebraic properties of logarithms using the corresponding properties ofexponents. Make sure all members of your group understand all proofs completely.
2. Solve the following. (Hint: Remember what the domain of ln x is.)
(a) ln(x− 1)− ln x = 1.
(b) ln(x2 − 2x− 2) ≤ 0.
3. (a) Explain why g(x) = eln g(x) for any function g(x) > 0.
(b) Explain why g(x)h(x) = eh(x)·ln g(x) for any functions g > 0 and h.
4. In general, the four possible combinations of constants and functions as exponents andbases are:
constant base with function base withconstant exponent constant exponent
constant base with function base withfunction exponent function exponent
For each case, differentiate the following functions and explain which rule you used forthe differentiation.
Suppose that a and b are constants with a > 0, and that f(x) and g(x) are functionswith f(x) > 0. Find
(a) ddx(ab)
(b) ddx[f(x)]b
(c) ddx[bg(x)]
(d) ddx[f(x)g(x)]
Additional Problems
1. Without using a calculator, determine which of the numbers log10 99 or log9 82 is larger.
2. Prove that ln x is a differentiable function. (Hint: Use Theorem 7 on page 205.)
3. Use the (ε,N) definitions of limits from Chapter 1 to prove that limx→−∞ ex = 0 andthat limx→∞ ex = ∞.
Math 1A Worksheets, 7th Edition 34
16. Inverse Trigonometric Functions
Questions
1. Explain why sin x does not have an inverse function. Is sin x one-to-one on [0, π/4]?Does sin x obtain all values on [0, π/4]? Why or why not? What is the length of theshortest interval on which sin x obtains all of its values? Is sin x one-to-one on aninterval of this length?
2. Graph y = cos x and y = tan x. Find intervals on which they are one-to-one, but wherethe functions obtain all of their values. How many choices do you have in picking theseintervals? For each function, what is the “standard” choice?
3. (a) Graph the restricted tangent function and its inverse. Describe the graph (inwords). How are the asymptotes of tan x and tan−1(x) related?
(b) Evaluate limx→∞ tan−1(ln x).
4. Graph y = sin−1 x. Now graph y = 1/ sin x. (If you have trouble with this, graphy = sin x first.) Are they equivalent for −1 ≤ x ≤ 1?
Problems
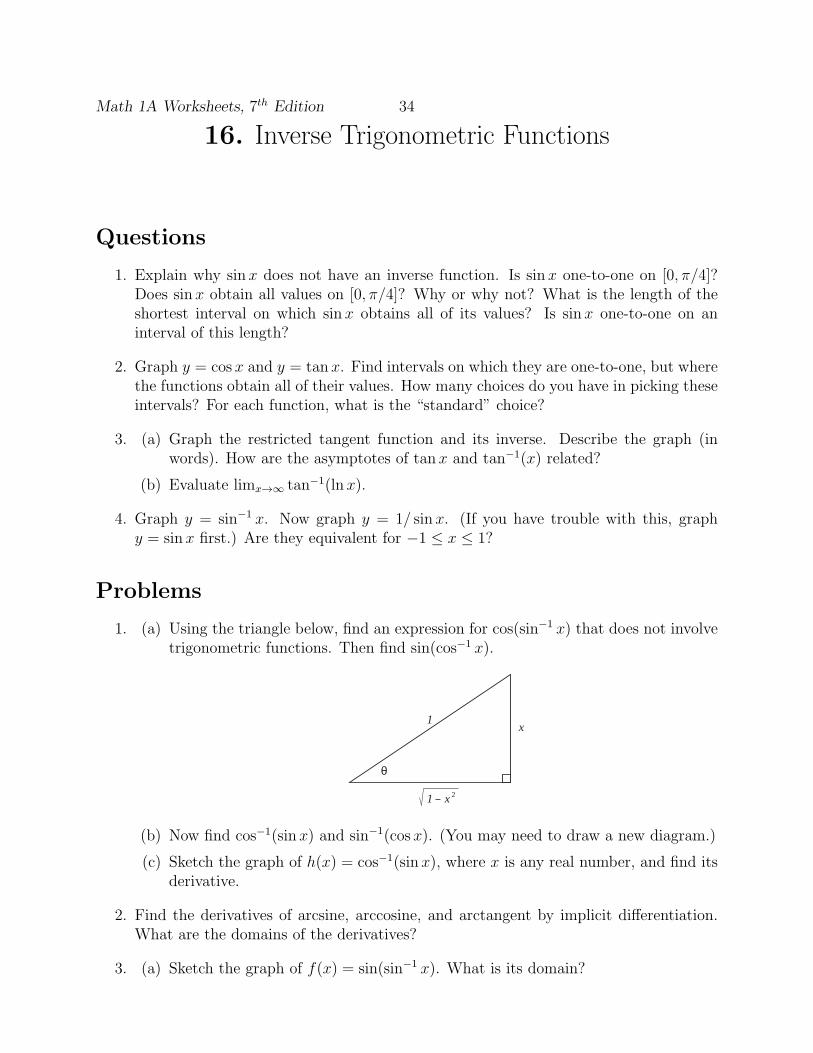
1. (a) Using the triangle below, find an expression for cos(sin−1 x) that does not involvetrigonometric functions. Then find sin(cos−1 x).
θ
1 x 2
x1
(b) Now find cos−1(sin x) and sin−1(cos x). (You may need to draw a new diagram.)
(c) Sketch the graph of h(x) = cos−1(sin x), where x is any real number, and find itsderivative.
2. Find the derivatives of arcsine, arccosine, and arctangent by implicit differentiation.What are the domains of the derivatives?
3. (a) Sketch the graph of f(x) = sin(sin−1 x). What is its domain?
35 Math 1A Worksheets, 7th Edition
(b) Carefully sketch the graph of g(x) = sin−1(sin x), where x is any real number.(Hint: remember that sin−1 x is not an inverse for sin x for all values of x.)
(c) Show that g′(x) =cos x
| cos x| .
Additional Problems
1. (a) Prove that sin−1 x+ cos−1 x = π/2.
(b) Use this fact to calculate the derivative of cos−1 x.
2. Let f(x) = x arctan(1/x) if x 6= 0 and f(0) = 0.
(a) Is f continuous at 0?
(b) Is f differentiable at 0?
3. When xy 6= 1, prove that arctan x+arctan y = arctan x+y1−xy
. Assume that the left hand
side lies between −π/2 and π/2.
Math 1A Worksheets, 7th Edition 36
17. Hyperbolic Functions
Questions
1. Are cosh x and cos x the same function? What is the definition of cosh x? What is thedefinition of cos x?
2. (a) Sketch the graphs of 12ex, −1
2e−x, and sinh x. How are they related? Describe the
graph of sinh x.
(b) Sketch the graphs of 12ex, 1
2e−x, and cosh x. How are they related? Describe the
graph of cosh x.
(c) Sketch and describe the graph of tanh x. How is tanh x related to sinh x andcosh x?
3. Which hyperbolic functions are one-to-one? How is the inverse hyperbolic cosine func-tion defined? Sketch and describe the graphs of sinh−1 x, cosh−1 x, and tanh−1 x.
4. Show that sinh x is an odd function. Show that cosh x is an even function.
Problems
1. (a) Graph sinh x and cosh x on the same axes. Describe three different ways in whichthese two functions are related. (Hint: What happens if you add, subtract,differentiate, . . . )
(b) Prove algebraically that these relationships are correct.
2. Because d2
dx2 (sin x) = − sin x and d2
dx2 (cos x) = − cos x, we say that y = sin x andy = cos x are solutions to the differential equation y′′ = −y.
(a) What differential equation do you think y = cosh x and y = sinh x satisfy?
(b) What is the hundredth derivative of sinh x?
(c) Find the 12345th derivative of cosh x.
3. (a) How do we know that the point P = (cos t, sin t) lies on the unit circle? Draw apicture illustrating this fact. What does t represent on this picture?
(b) On what type of graph does the point Q = (cosh t, sinh t) lie? Why is this true?Draw a picture illustrating this fact. Does t represent an angle in this case? Ifnot, what does t represent?
37 Math 1A Worksheets, 7th Edition
4. (a) Show that cosh−1(x) = ln(x +√x2 − 1). (Hint: There are at least two ways to
do this. One is to start with the defining equation for cosh x. Interchange x andy, and multiply by 2ey. Rearrange to get a quadratic equation in ey. Solve usingthe quadratic formula.)
(b) Calculate the derivative of cosh−1. Check that your answer is correct by implicitlydifferentiating y = cosh−1 x to find dy
dx.
5. (a) Find limx→∞ tanh(ln x).
(b) Show that tanh(ln x) = x2−1x2+1
. Was your answer in part (a) correct?
Additional Problems
1. Show that (cosh x+ sinh x)n = coshnx+ sinhnx, where n is any real number.
2. Show that sin−1(tanh x) = tan−1(sinh x).
3. Write down the hyperbolic angle sum formulas. For example, sinh(x + y) = . . .Explain how they are different from the regular trigonometric angle sum formulas.What is sinh(x− y)? What is cosh(x− y)?
Math 1A Worksheets, 7th Edition 38
18. Indeterminate Forms and l’Hospital’s Rule
Questions
1. It’s very important to know when you can and cannot use a rule like l’Hospital’s.
(a) Evaluate limx→0x
x+1. Did you need to use l’Hospital’s Rule?
(b) What value would you have gotten if you had tried to use l’Hospital’s Rule? Whydoes l’Hospital’s rule not apply in this situation?
(c) What conditions does a limit need to fulfill before you can apply l’Hospital’s Rule?
2. True or false? (When the statement is false, give a counterexample):
(a) L’Hospital’s Rule says that the limit of a quotient is always equal to the limit ofthe quotient of their derivatives.
(b) L’Hospital’s Rule also applies to one-sided limits and for limits at positive ornegative infinity.
(c) In order to be able to apply l’Hospital’s Rule to limx→a+f(x)g(x)
or limx→af(x)g(x)
, g′(a)
and f ′(a) have to exist.
Problems
1. Consider, but don’t evaluate, the following limits.
i. limx→1xs−1xt−1
for the cases s > t, t > s and s = t
ii. limx→∞ xe−x
iii. limx→0+ x1/x2
iv. limx→1+(1x)− ln(x−1)
v. limx→0+ ln(x)e1/x2
vi. limx→∞ x sin( 1x)
vii. limx→∞ ln(x)− x
viii. limx→0tan(x)tanh(x)
ix. limx→0+ [sin(x)]e−1/x2
x. limx→0+1x+ ln(x)
xi. limx→0(1 + ax)1/x
xii. limx→0sx−1tx−1
when s > t > 0, t > s > 0 and s = t > 0
39 Math 1A Worksheets, 7th Edition
(a) From the above list, pick an indeterminate form of the type 0 · ∞. Can youconvert it to the form 0
0or ∞
∞? If so, apply l’Hospital’s rule after the conversionand determine the limit.
(b) Pick an indeterminate form of the type ∞ − ∞ from the above list. Can youconvert it to the form 0
0or ∞
∞? If you can, apply l’Hospital’s rule after theconversion and determine the limit.
(c) Pick an indeterminate form of each of the following types: 00, 0∞ and 1∞. Howwould you convert these types of indeterminate forms into those of type 0
0or ∞
∞?By making the appropriate conversions and using l’Hospital’s rule, determine thelimits.
(d) Pick two more limits from the above list and determine their values.
2. Sketch the graphs of y = ln x and y = x, y = x2, y = x(1/2), y = x(1/3), etc. It’s a factthat the logarithm approaches infinity more slowly than any positive power of x. Usel’Hospital’s Rule to prove this by showing that limx→∞
lnxxp = 0 for any number p > 0.
3. Suppose that f(a) = g(a) = 0, f ′(x) and g′(x) are continuous, and g′(a) 6= 0. Starting
with limx→af ′(x)g′(x)
= f ′(a)g′(a)
and using the limx→a definition of a derivative, show that
l’Hospital’s Rule works. In which step did we use the continuity of f ′(x) and g′(x)?
4. Show that the exponential function approaches infinity faster than any power of x. Todo this, first sketch y = ex, y = x, y = x2 and y = x3 on the same axes. Then, usel’Hospital’s Rule to prove that limx→∞
ex
xn = ∞, where n is any integer. (Hint: useinduction. Start with n = 1, n = 2, n = 3, . . . . Explain as clearly as you can whatthe pattern is.) Another approach to this problem is to use the result from problem 2and think about the inverse functions. If you choose this route, make sure to explainyour reasoning clearly.
Additional Problems
1. (a) Draw a diagram and interpret the quotient f(x+h)−f(x−h)2h
as the slope of a secantline.
(b) If f is differentiable at x, show that limh→0f(x+h)−f(x−h)
2h= f ′(x).
(Hint: try adding and subtracting the same quantity in the numerator.)
(c) Show that it is possible for the limit limh→0f(x+h)−f(x−h)
2h= f ′(x) to exist, but for
f ′(x) not to exist. (Hint: consider f(x) = |x|.)(d) If f ′ is continuous, use l’Hospital’s Rule to show that limh→0
f(x+h)−f(x−h)2h
= f ′(x).
(e) Explain in your own words what conclusion you can draw from parts (b), (c) and(d) above. Why do those three results not contradict each other?
2. If f ′′ is continuous, show that limh→0f(x+h)−2f(x)+f(x−h)
h2 = f ′′(x). Why do you need toknow that the second derivative is continuous?
Math 1A Worksheets, 7th Edition 40
19. Falling Objects and Limits
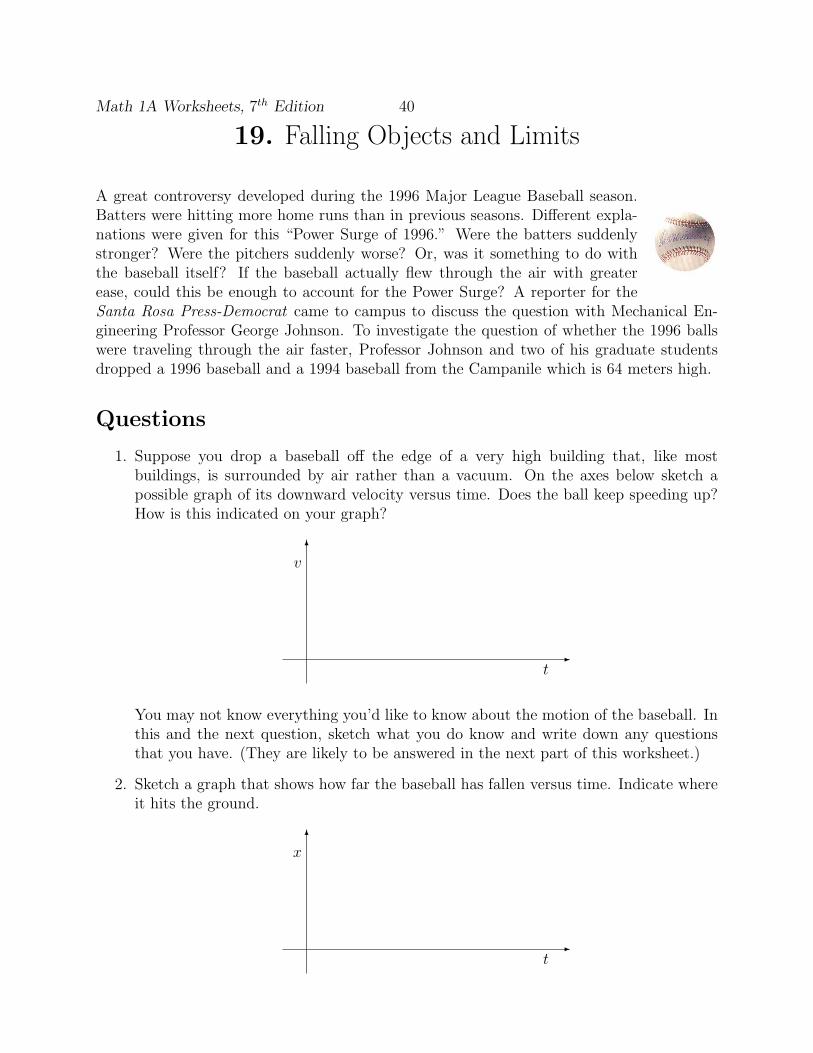
A great controversy developed during the 1996 Major League Baseball season.Batters were hitting more home runs than in previous seasons. Different expla-nations were given for this “Power Surge of 1996.” Were the batters suddenlystronger? Were the pitchers suddenly worse? Or, was it something to do withthe baseball itself? If the baseball actually flew through the air with greaterease, could this be enough to account for the Power Surge? A reporter for theSanta Rosa Press-Democrat came to campus to discuss the question with Mechanical En-gineering Professor George Johnson. To investigate the question of whether the 1996 ballswere traveling through the air faster, Professor Johnson and two of his graduate studentsdropped a 1996 baseball and a 1994 baseball from the Campanile which is 64 meters high.
Questions
1. Suppose you drop a baseball off the edge of a very high building that, like mostbuildings, is surrounded by air rather than a vacuum. On the axes below sketch apossible graph of its downward velocity versus time. Does the ball keep speeding up?How is this indicated on your graph?
6v
-t
You may not know everything you’d like to know about the motion of the baseball. Inthis and the next question, sketch what you do know and write down any questionsthat you have. (They are likely to be answered in the next part of this worksheet.)
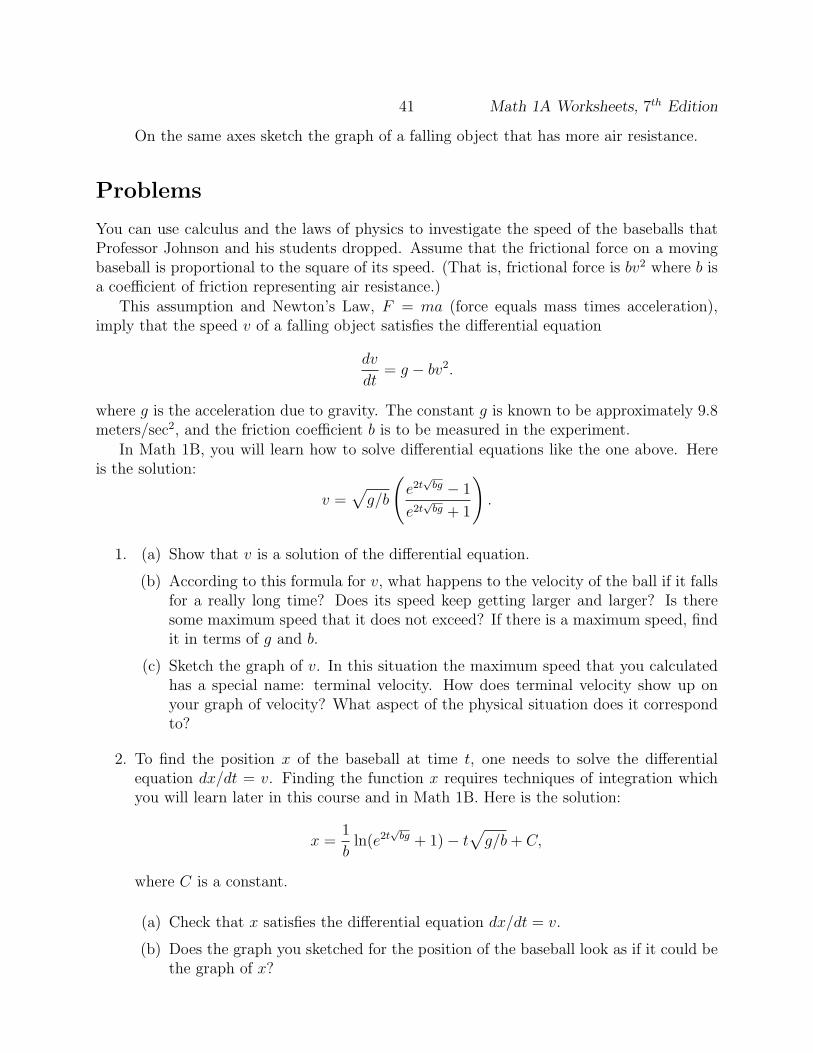
2. Sketch a graph that shows how far the baseball has fallen versus time. Indicate whereit hits the ground.
6x
-t
41 Math 1A Worksheets, 7th Edition
On the same axes sketch the graph of a falling object that has more air resistance.
Problems
You can use calculus and the laws of physics to investigate the speed of the baseballs thatProfessor Johnson and his students dropped. Assume that the frictional force on a movingbaseball is proportional to the square of its speed. (That is, frictional force is bv2 where b isa coefficient of friction representing air resistance.)
This assumption and Newton’s Law, F = ma (force equals mass times acceleration),imply that the speed v of a falling object satisfies the differential equation
dv
dt= g − bv2.
where g is the acceleration due to gravity. The constant g is known to be approximately 9.8meters/sec2, and the friction coefficient b is to be measured in the experiment.
In Math 1B, you will learn how to solve differential equations like the one above. Hereis the solution:
v =√
g/b
(
e2t√bg − 1
e2t√bg + 1
)
.
1. (a) Show that v is a solution of the differential equation.
(b) According to this formula for v, what happens to the velocity of the ball if it fallsfor a really long time? Does its speed keep getting larger and larger? Is theresome maximum speed that it does not exceed? If there is a maximum speed, findit in terms of g and b.
(c) Sketch the graph of v. In this situation the maximum speed that you calculatedhas a special name: terminal velocity. How does terminal velocity show up onyour graph of velocity? What aspect of the physical situation does it correspondto?
2. To find the position x of the baseball at time t, one needs to solve the differentialequation dx/dt = v. Finding the function x requires techniques of integration whichyou will learn later in this course and in Math 1B. Here is the solution:
x =1
bln(e2t
√bg + 1)− t
√
g/b+ C,
where C is a constant.
(a) Check that x satisfies the differential equation dx/dt = v.
(b) Does the graph you sketched for the position of the baseball look as if it could bethe graph of x?
Math 1A Worksheets, 7th Edition 42
(c) Show that x is quite well approximated by the simple expression t√
g/b as t be-comes very large. First do this by “dropping relatively insignificant terms” in theformula for x as a function of t. Next show it by calculating that limt→∞
x(t)
t√
g/b= 1.
(d) In one of Professor Johnson’s experiments, the two balls were dropped simulta-neously from the Campanile. When the 1996 ball reached the ground, the 1994ball was still 1.7 meters away. What does this say about the friction coefficientsb for the two balls?
Reference
Adair, Robert K. The Physics of Baseball. Harper Perennial. 1994.
43 Math 1A Worksheets, 7th Edition
20. Maximum and Minimum Values
Standing at the top of Half Dome in Yosemite or at the bottom of the Grand Canyon, youcan appreciate nature’s spectacular maxima and minima. Although much less dramatic, thegraphs of functions also have their peaks and basins. We can often find these maximum andminimum points using the derivative.
Questions
1. Let A be a function whose domain (input) is points on the UC Berkeley campus andwhose range (output) is the real number of meters that point is above (or below) sealevel.
(a) Assume the campus boundaries are Oxford, Hearst, Bancroft, and Piedmont. Atwhat point on campus does A attain its absolute maximum value?
(b) Where does A attain an absolute minimum?(By expanding the domain and range of A (i.e. to all points on the surface of theearth), one can specify other interesting geographic questions.)
2. (a) When does a function f have an absolute maximum at a point c?
(b) When does a function f have an absolute minimum at a point d?
(c) How many different extreme values can a function f have?
(d) When does a function f have a local maximum at a point c?
(e) When does a function f have a local minimum at a point d?
(f) How many different local maximum or minimum values can a function f have?
Math 1A Worksheets, 7th Edition 44
Problems
1. True or false? (When false, give a counterexample):
(a) If f has a local extremum at c, then c is a critical number of f . [Note: The word“extremum” means the same thing as the phrase “maximum or minimum.”]
(b) If c is a critical number of f , then f has a local extremum at c.
2. What does the Extreme Value Theorem say? Be sure to specify the correct hypothesesand the correct conclusion(s). Sketch a graph illustrating what the Extreme ValueTheorem says.
3. Sketch the graph of each of these functions.Match each function with an appropriate description.Explain why each function does not contradict the Extreme Value Theorem.
f(x) = x3 − 3x2 + 2x, 0 < x < 2 a. continuous function with max./min.
f(x) =
1 if x = 01/x if 0 < x ≤ 1x− 1 if 1 < x ≤ 2
b. function on a closed interval with max./min.
f(x) = x2, 0 < x < 2 c. continuous function with no max./min.
f(x) =
{
x2 if 0 ≤ x < 1x− 1 if 1 ≤ x ≤ 2
d. function on a closed interval with no max./min.
4. (a) What does Fermat’s Theorem say? Be sure to specify the correct hypotheses andthe correct conclusion(s). If a function f does satisfy these hypotheses, what canyou conclude about f? Sketch a graph illustrating what Fermat’s theorem says.
(b) Explain why the functions f(x) = x2/3 and f(x) = x3 do not contradict Fermat’sTheorem.
5. Find the largest and smallest possible values of
(a) sin x− cos x
(b) sin x+ cosx
(c) sin x+ cos2 x
(d) sin2 x+ cos2 x
Additional Problems
1. Prove Fermat’s Theorem for the case when f has a local minimum at c.
45 Math 1A Worksheets, 7th Edition
(a) First, assume that the case when f has a local maximum at c has already beenproved. Show that if f has a maximum value at c, then the function g(x) = −f(x)has a minimum value at c. What can you conclude?
(b) Now try to prove it directly, beginning from f(c) ≤ f(c+h), where h is sufficientlyclose to 0, either positive or negative.
2. Find a function with infinitely many critical points but no local maxima or minima.Even if you can’t find a formula, draw the graph of such a function.
Math 1A Worksheets, 7th Edition 46
21. The Mean Value Theorem
Questions
1. What are the three hypotheses of Rolle’s theorem? If these are all true, what can youconclude? Draw and label a picture to support your statements.
2. Let f(x) = 1 − |x| and consider the interval [−1, 1]. Is there a number c such thatf ′(c) = 0? Why doesn’t Rolle’s Theorem work?
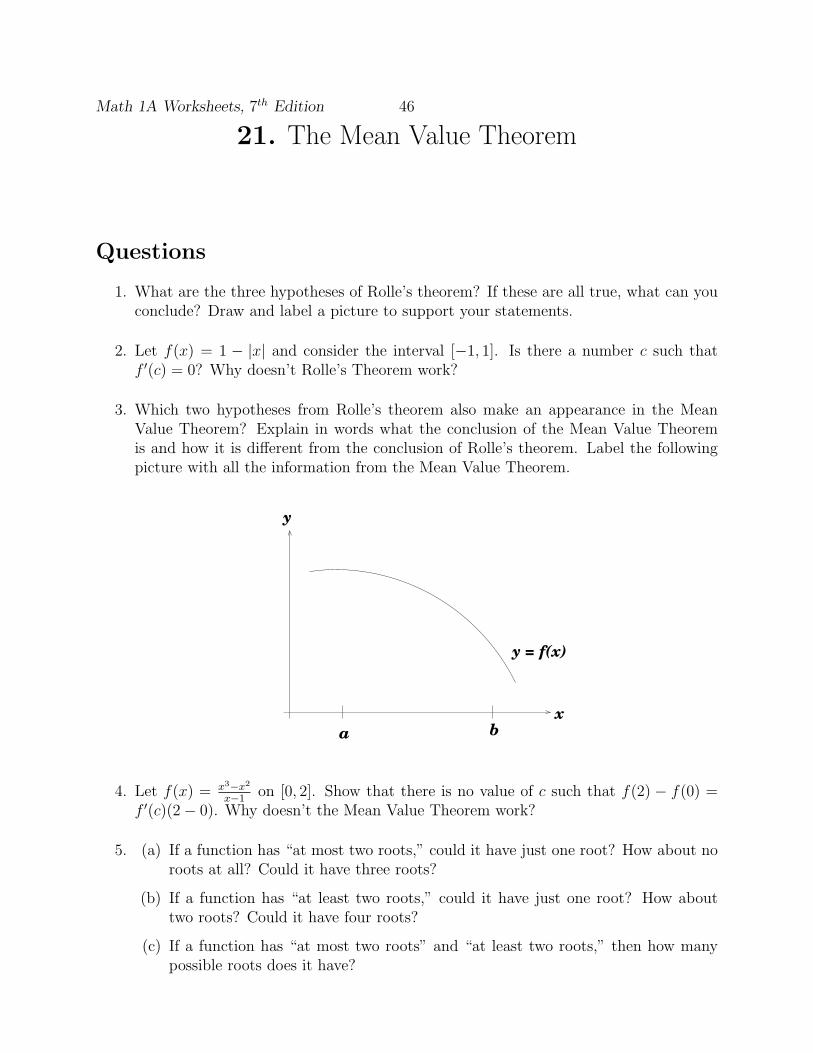
3. Which two hypotheses from Rolle’s theorem also make an appearance in the MeanValue Theorem? Explain in words what the conclusion of the Mean Value Theoremis and how it is different from the conclusion of Rolle’s theorem. Label the followingpicture with all the information from the Mean Value Theorem.
a bx
y
y = f(x)
4. Let f(x) = x3−x2
x−1on [0, 2]. Show that there is no value of c such that f(2) − f(0) =
f ′(c)(2− 0). Why doesn’t the Mean Value Theorem work?
5. (a) If a function has “at most two roots,” could it have just one root? How about noroots at all? Could it have three roots?
(b) If a function has “at least two roots,” could it have just one root? How abouttwo roots? Could it have four roots?
(c) If a function has “at most two roots” and “at least two roots,” then how manypossible roots does it have?
47 Math 1A Worksheets, 7th Edition
Problems
1. (a) Suppose that f and g are continuous on [a, b] and differentiable on (a, b). Supposealso that f(a) = g(a) and f ′(x) < g′(x) for a < x < b. Prove that f(b) < g(b).(Hint: apply the Mean Value Theorem to the function h = f − g.)
(b) Sketch a picture and explain, in terms of the derivative as a rate of change, whythis is so.
2. (a) Show that a polynomial of degree 3 has at most three real roots.
(b) Show that a polynomial of degree n has at most n real roots.(Hint: Use mathematical induction. That is, assume that the statement is truefor a polynomial of degree n− 1 and using that prove it true for a polynomial ofdegree n.)
3. Let f(x) = [x] be the greatest integer function. Sketch the graph of f and use it tofind a formula for f ′(x). Is f(x) a constant function? Why isn’t this a counterexampleto the idea that “if f ′(x) = 0, then f is constant.”
4. Sometimes the Mean Value Theorem can be used to show things that are not obviouslyrelated to the Mean Value Theorem. Show that
√1 + x < 1 + 1
2x if x > 0.
(Hint: let f(x) = 1 + 12x −
√1 + x. What is f(0)? If you assume that there exists a
number b > 0 such that f(b) = 0 also, is there a problem?)
5. (a) Suppose that f is differentiable on R and has two roots. Show that f ′ has atleast one root.
(b) Suppose that f is twice differentiable on R and has three roots. Show that f ′′
has at least one real root.
(c) What is the pattern? Try to express the general statement.
Additional Problems
1. Show that | sin a− sin b| ≤ |a− b| for all a and b.
2. Let f(x) = 1xand g(x) = 1
x− x
|x| . Show that ddx[f(x)−g(x)] = 0 but that f(x)−g(x) 6= c,
where c is a constant. Why isn’t this a counterexample to the idea that “If f ′(x) =g′(x), then f − g is constant.”
3. Prove the Mean Value Theorem.
(Hint: consider the function y = f(x)+ f(b)−f(a)b−a
(x−a). Looking at a sketch illustratingthe Mean Value Theorem, what does this function represent? Can you apply Rolle’sTheorem to it? If so, what can you conclude?)
Math 1A Worksheets, 7th Edition 48
22. Monotonicity and Concavity
Questions
1. (a) Draw the graph of a differentiable function f with domain [1, 5] that is:
i. increasing on [1, 2].
ii. decreasing on [2, 3].
iii. neither increasing nor decreasing on [3, 4].
iv. monotonic on [4, 5].
(b) What can you say about any function that satisfies the conditions in part a?
(c) What are the critical points of your function f? Does it have a local maximum orminimum on (1, 5)? Must any function satisfying the conditions in part a have alocal maximum or minimum on (1, 5)?
2. Sketch four graphs illustrating the four cases covered by the first derivative test. (Hint:
These cases can be described by the notation +/+, +/−, −/+, and −/−.) On eachgraph label the local maximum or local minimum or say that the graph has neither atthe point in question.
3. (a) Explain in your own words, in terms of tangent lines relating to the curve, whatit means for a function to be concave down. Draw a picture illustrating thisdefinition. What’s the easiest way to tell if a twice differentiable function isconcave down on an interval I?
(b) Explain in your own words, in terms of tangent lines relating to the curve, what itmeans for a function to be concave up. Draw a picture illustrating this definition.What’s the easiest way to tell if a twice differentiable function is concave up onan interval I?
(c) Explain in your own word what a point of inflection is. Draw a picture illustratingthis definition. What’s the easiest way to tell if a twice differentiable function hasa point of inflection on an interval I?
4. (a) State the second derivative test for critical points.
(b) Draw two graphs illustrating the two situations to which the second derivativetest applies. On each graph label the local minimum or local maximum.
(c) Give an example of f and c where f(c) is a local maximum and f ′′(c) = 0. Canyou use the second derivative test in this situation?
(d) Give an example of f and c where f(c) is a local minimum and f ′′(c) does notexist. Can you use the second derivative test in this situation?
49 Math 1A Worksheets, 7th Edition
Problems
1. (a) Show that a quadratic polynomial f(x) = ax2 + bx + c, where a, b, and c arereal numbers, always has one critical point and no points of inflection. When isf concave up? When is f concave down?
(b) How can you tell if a quadratic polynomial has two roots? One root? No roots?
(c) Suppose that f has two real roots, r and s. Show that f ′(r) + f ′(s) = 0. Alsoshow that the critical point of f is midway between the two roots.
2. (a) Show that ex ≥ 1 + x for x ≥ 0.
(b) Show that ex ≥ 1 + x+ 12x2 for x ≥ 0.
Additional Problems
1. Suppose that f and g are both concave upwards on (−∞,∞). Under what conditionson f will the composite function h(x) = f(g(x)) be concave upward?
2. Suppose that f and g are increasing functions on an interval I.
(a) Show that f + g is increasing on I.
(b) Suppose also that f and g are positive functions, and show that fg is increasingon I.
(c) Why did you need to know that the functions were positive in the second part?
Math 1A Worksheets, 7th Edition 50
23. Applied Optimization
Making Boxes Efficiently
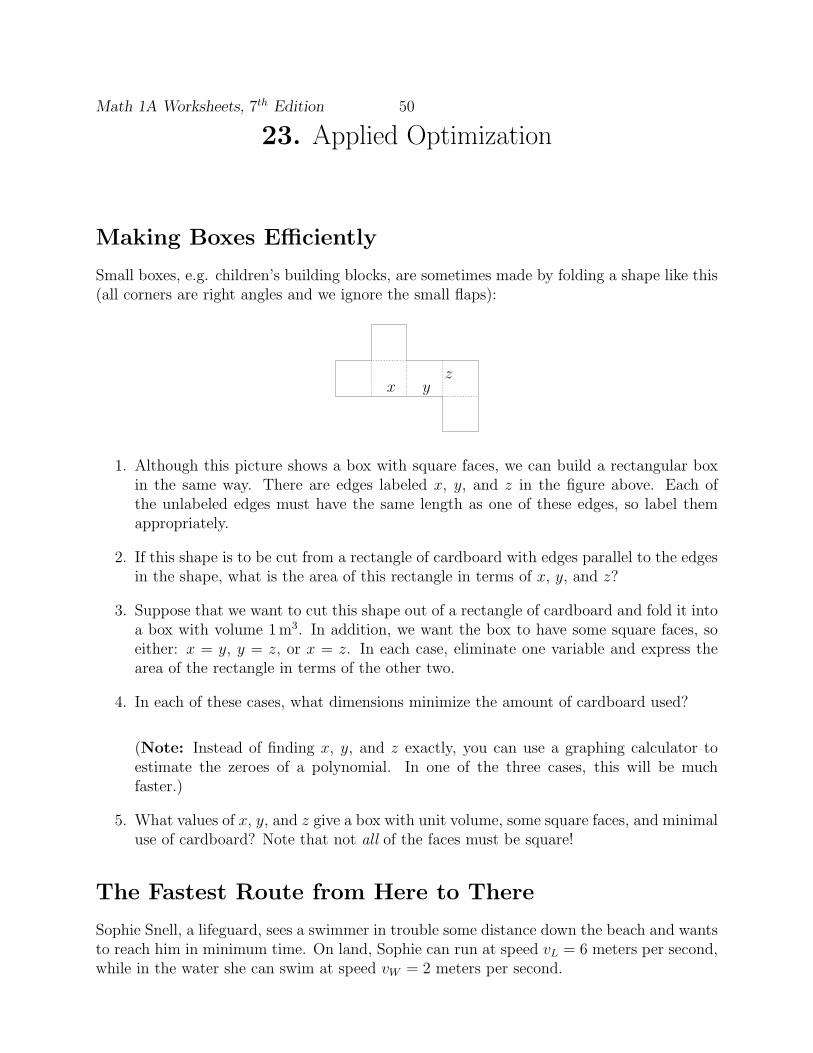
Small boxes, e.g. children’s building blocks, are sometimes made by folding a shape like this(all corners are right angles and we ignore the small flaps):
x yz
1. Although this picture shows a box with square faces, we can build a rectangular boxin the same way. There are edges labeled x, y, and z in the figure above. Each ofthe unlabeled edges must have the same length as one of these edges, so label themappropriately.
2. If this shape is to be cut from a rectangle of cardboard with edges parallel to the edgesin the shape, what is the area of this rectangle in terms of x, y, and z?
3. Suppose that we want to cut this shape out of a rectangle of cardboard and fold it intoa box with volume 1m3. In addition, we want the box to have some square faces, soeither: x = y, y = z, or x = z. In each case, eliminate one variable and express thearea of the rectangle in terms of the other two.
4. In each of these cases, what dimensions minimize the amount of cardboard used?
(Note: Instead of finding x, y, and z exactly, you can use a graphing calculator toestimate the zeroes of a polynomial. In one of the three cases, this will be muchfaster.)
5. What values of x, y, and z give a box with unit volume, some square faces, and minimaluse of cardboard? Note that not all of the faces must be square!
The Fastest Route from Here to There
Sophie Snell, a lifeguard, sees a swimmer in trouble some distance down the beach and wantsto reach him in minimum time. On land, Sophie can run at speed vL = 6 meters per second,while in the water she can swim at speed vW = 2 meters per second.
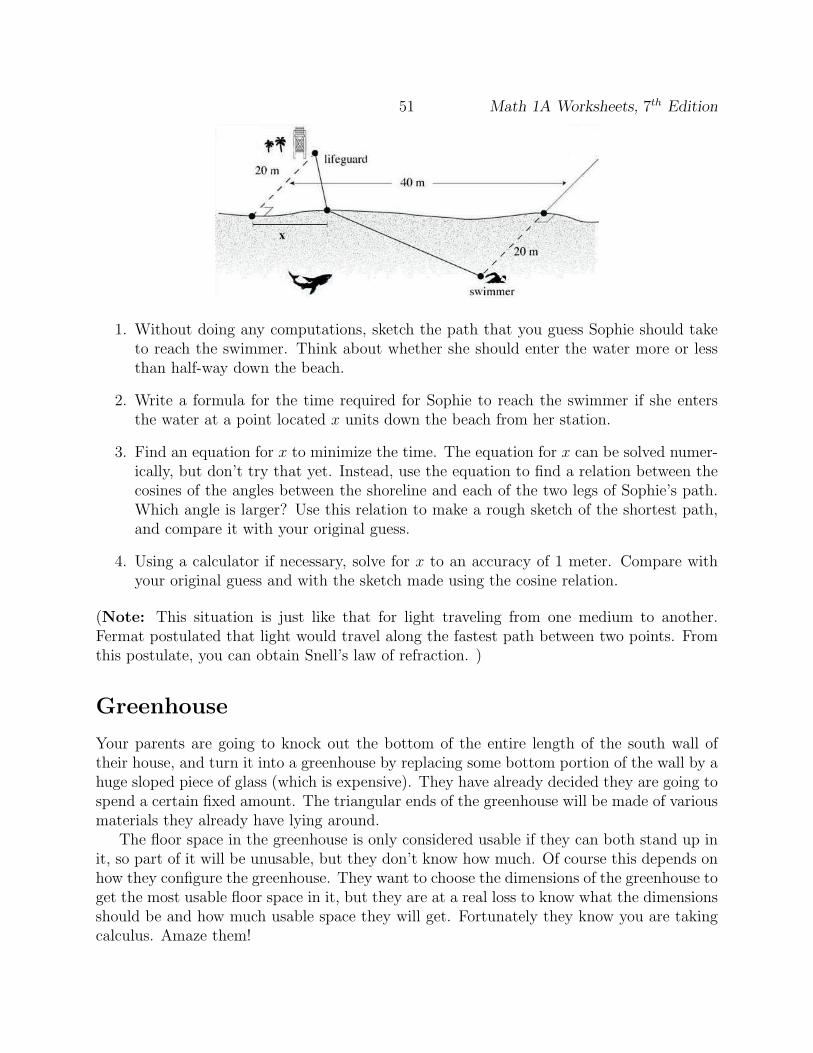
51 Math 1A Worksheets, 7th Edition
1. Without doing any computations, sketch the path that you guess Sophie should taketo reach the swimmer. Think about whether she should enter the water more or lessthan half-way down the beach.
2. Write a formula for the time required for Sophie to reach the swimmer if she entersthe water at a point located x units down the beach from her station.
3. Find an equation for x to minimize the time. The equation for x can be solved numer-ically, but don’t try that yet. Instead, use the equation to find a relation between thecosines of the angles between the shoreline and each of the two legs of Sophie’s path.Which angle is larger? Use this relation to make a rough sketch of the shortest path,and compare it with your original guess.
4. Using a calculator if necessary, solve for x to an accuracy of 1 meter. Compare withyour original guess and with the sketch made using the cosine relation.
(Note: This situation is just like that for light traveling from one medium to another.Fermat postulated that light would travel along the fastest path between two points. Fromthis postulate, you can obtain Snell’s law of refraction. )
Greenhouse
Your parents are going to knock out the bottom of the entire length of the south wall oftheir house, and turn it into a greenhouse by replacing some bottom portion of the wall by ahuge sloped piece of glass (which is expensive). They have already decided they are going tospend a certain fixed amount. The triangular ends of the greenhouse will be made of variousmaterials they already have lying around.
The floor space in the greenhouse is only considered usable if they can both stand up init, so part of it will be unusable, but they don’t know how much. Of course this depends onhow they configure the greenhouse. They want to choose the dimensions of the greenhouse toget the most usable floor space in it, but they are at a real loss to know what the dimensionsshould be and how much usable space they will get. Fortunately they know you are takingcalculus. Amaze them!
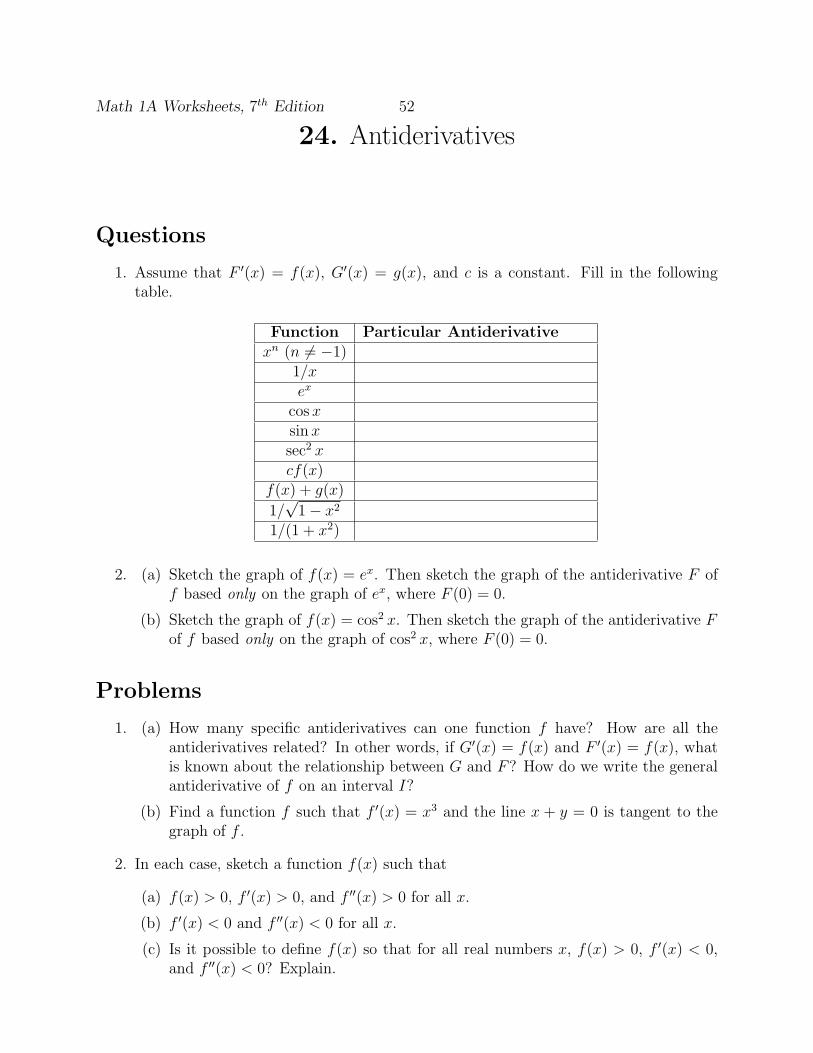
Math 1A Worksheets, 7th Edition 52
24. Antiderivatives
Questions
1. Assume that F ′(x) = f(x), G′(x) = g(x), and c is a constant. Fill in the followingtable.
Function Particular Antiderivative
xn (n 6= −1)1/xex
cosxsin xsec2 xcf(x)
f(x) + g(x)
1/√1− x2
1/(1 + x2)
2. (a) Sketch the graph of f(x) = ex. Then sketch the graph of the antiderivative F off based only on the graph of ex, where F (0) = 0.
(b) Sketch the graph of f(x) = cos2 x. Then sketch the graph of the antiderivative Fof f based only on the graph of cos2 x, where F (0) = 0.
Problems
1. (a) How many specific antiderivatives can one function f have? How are all theantiderivatives related? In other words, if G′(x) = f(x) and F ′(x) = f(x), whatis known about the relationship between G and F? How do we write the generalantiderivative of f on an interval I?
(b) Find a function f such that f ′(x) = x3 and the line x + y = 0 is tangent to thegraph of f .
2. In each case, sketch a function f(x) such that
(a) f(x) > 0, f ′(x) > 0, and f ′′(x) > 0 for all x.
(b) f ′(x) < 0 and f ′′(x) < 0 for all x.
(c) Is it possible to define f(x) so that for all real numbers x, f(x) > 0, f ′(x) < 0,and f ′′(x) < 0? Explain.
53 Math 1A Worksheets, 7th Edition
In each case above, try to find an algebraic expression for a function f which satisfiesthe properties listed.
3. Show that for motion in a straight line with constant acceleration a, initial velocity v0,and initial displacement s0, the displacement after time t is s = 1
2at2 + v0t+ s0.
4. (a) Draw a direction field for the function f(x) = 1/x2 and use it to sketch severalmembers of the family of antiderivatives.
(b) Compute the general antiderivative explicitly and sketch several particular an-tiderivatives. Compare these sketches with your previous one.
5. An object is projected upward with initial velocity v0 meters per second from a points0 meters above the ground. Show that [v(t)]2 = v20 − 19.6[s(t)− s0].
Additional Problems
1. Find all functions f such that f ′′′ = f ′′.
2. Use a direction field to graph the antiderivative that satisfies F (0) = 0.
(a) f(x) = sinxx, 0 < x < 2π
(b) f(x) = x tan x, −π/2 < x < π/2
Math 1A Worksheets, 7th Edition 54
25. Sigma Notation and Mathematical Induction
Questions
1. (a) Write a sentence or two explaining in your own words what∑n
k=1 ak means.
(b) Are∑n
k=1 ak and∑n
j=1 aj the same sums? Explain why or why not.
(c) Suppose that m and n integers such that m ≤ n, and that am, am+1, . . . , an arereal numbers. Write am + am+1 + . . .+ an−1 + an in sigma notation.
(d) In part (c), which letter did you choose for the index of summation? What valuesdoes it take on? Could you have chosen a different letter? Would it have madeany difference? Can you think of a few letters which you should not use?
(e) Write out (but don’t add up):∑4
k=0 1 + 2k
2. Express in sigma notation
(a) a5 + a6 + a7 + . . .+ a10
(b) 3− 5 + 7− 9 + 11− 13
(c) 1/4− 1/6 + 1/8− 1/10 + 1/12− 1/14
(d) 3 + 9 + 27 + 81
(e) 1 + 4 + 27 + 256
3. Assume that c is a constant and that m and n are positive integers. Fill in each blankwith the correct formula.
(a) c∑n
i=m ai =∑n
i=m
(b)∑n
i=m ai +∑n
j=m bj =∑n
k=m
(c)∑n
i=1 ai −∑n
i=1 bi+1 =∑n
i=1
(d)∑n
i=1 ai +∑n
i=0 bi = (∑n
i=1 ) +
Problems
1. (a) Express the sum of the first n even integers in sigma notation.
(b) Express the sum of the first n odd integers in sigma notation.
2. Assume that r 6= 1 and prove the formula for the sum of a finite geometric series asfollows:
55 Math 1A Worksheets, 7th Edition
(a) Write the expressiona+ ar + ar2 + ...+ arn−1
in sigma notation.
(b) Prove that the above sum equals a(rn−1)r−1
.(Hint: There are two approaches. One is to use induction. The other is tomultiply the expression by r − 1 and figure out which terms cancel.)
3. (a) Express the sum 1/2 + 1/6 + 1/12 + 1/20 in sigma notation. What is its value?
(b) Suppose the sum in part (a) is∑4
k=1 ak. What does ak equal? Using this sameformula for ak, use mathematical induction to prove as follows that
∑nk=1 ak =
nn+1
.
i. Check that∑1
k=1 ak =1
1+1.
ii. Assume that∑n−1
k=1 ak =n−1
(n−1)+1.
iii. Using the assumption in part (ii), prove that∑n
k=1 ak =n
n+1.
4. Prove that∑n
i=1 i3 = [n(n+1)
2]2 as follows:
(a) First, evaluate∑n
i=1[(1 + i)4 − i4] as a telescoping sum, and use the summationrules for 1, i, and i2 to find the value of
∑ni=1 i
3.
(b) Now prove the equality using induction.
5. Evaluate∑n
i=1[∑n
j=1(i+ j)].
6. Using induction, prove the generalized triangle inequality |∑ni=1 ai| ≤
∑ni=1 |ai|.
Additional Problems
1. (a) Use the formulas for sin(x+ y) and sin(x− y) to show that
2 sin1
2x cos ix = sin
(
i+1
2
)
x− sin
(
i− 1
2
)
x
for any integer i.
(b) Use this identity and telescoping sums to prove the formula
n∑
i=1
cos ix =sin(n+ 1
2)x− sin 1
2x
2 sin 12x
where x is not an integer multiple of 2π. Deduce that
n∑
i=1
cos ix =sin 1
2nx cos 1
2(n+ 1)x
sin 12x
Math 1A Worksheets, 7th Edition 56
2. Use the method of the previous problem to prove the formula
n∑
i=1
sin ix =sin 1
2nx sin 1
2(n+ 1)x
sin 12x
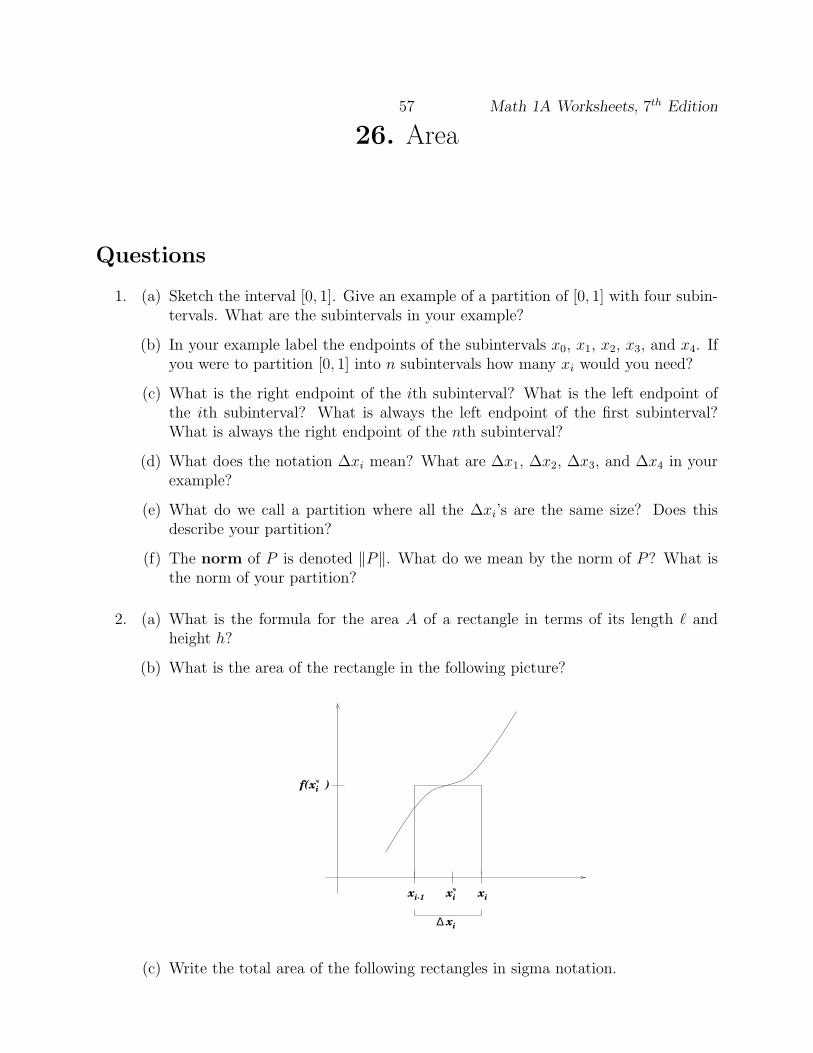
57 Math 1A Worksheets, 7th Edition
26. Area
Questions
1. (a) Sketch the interval [0, 1]. Give an example of a partition of [0, 1] with four subin-tervals. What are the subintervals in your example?
(b) In your example label the endpoints of the subintervals x0, x1, x2, x3, and x4. Ifyou were to partition [0, 1] into n subintervals how many xi would you need?
(c) What is the right endpoint of the ith subinterval? What is the left endpoint ofthe ith subinterval? What is always the left endpoint of the first subinterval?What is always the right endpoint of the nth subinterval?
(d) What does the notation ∆xi mean? What are ∆x1, ∆x2, ∆x3, and ∆x4 in yourexample?
(e) What do we call a partition where all the ∆xi’s are the same size? Does thisdescribe your partition?
(f) The norm of P is denoted ‖P‖. What do we mean by the norm of P? What isthe norm of your partition?
2. (a) What is the formula for the area A of a rectangle in terms of its length ℓ andheight h?
(b) What is the area of the rectangle in the following picture?
*xi
*xif( )
x x
x∆
i
i
i-1
(c) Write the total area of the following rectangles in sigma notation.
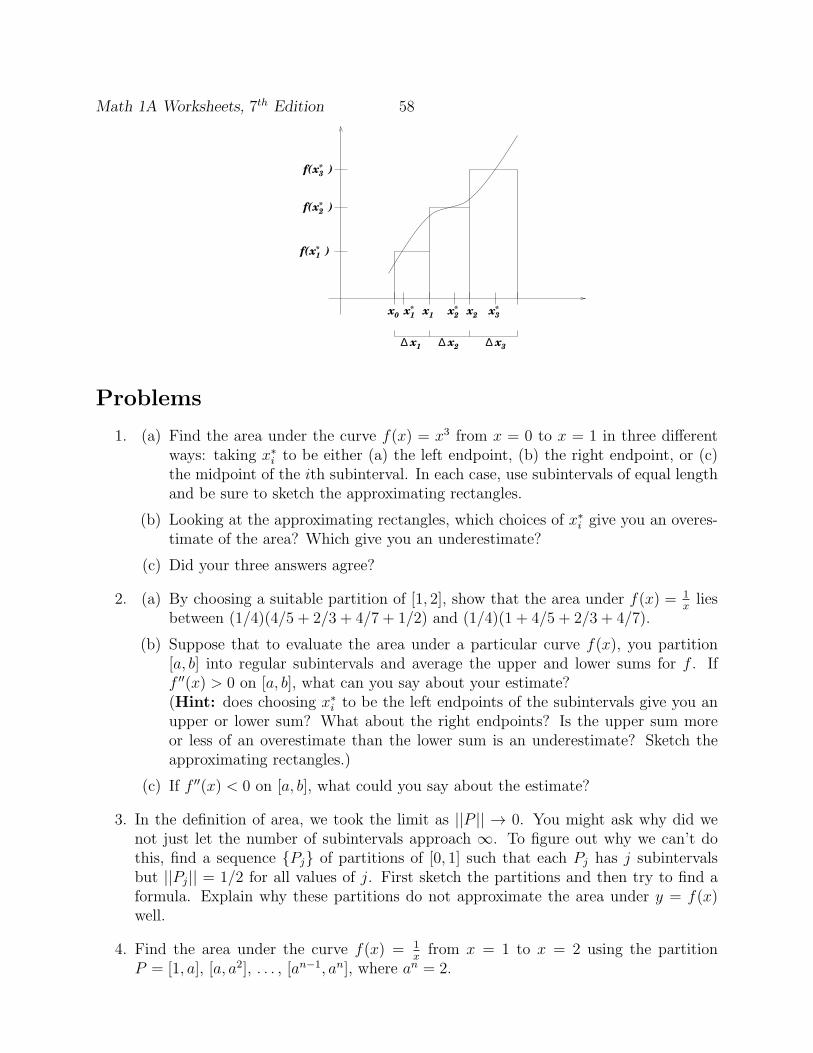
Math 1A Worksheets, 7th Edition 58
*
x2x1*x2
x1 x3
*x1*x3
*x1
*x3
∆
f( )x
x
2
2
x0
∆ ∆
f( )
f( )
Problems
1. (a) Find the area under the curve f(x) = x3 from x = 0 to x = 1 in three differentways: taking x∗
i to be either (a) the left endpoint, (b) the right endpoint, or (c)the midpoint of the ith subinterval. In each case, use subintervals of equal lengthand be sure to sketch the approximating rectangles.
(b) Looking at the approximating rectangles, which choices of x∗i give you an overes-
timate of the area? Which give you an underestimate?
(c) Did your three answers agree?
2. (a) By choosing a suitable partition of [1, 2], show that the area under f(x) = 1xlies
between (1/4)(4/5 + 2/3 + 4/7 + 1/2) and (1/4)(1 + 4/5 + 2/3 + 4/7).
(b) Suppose that to evaluate the area under a particular curve f(x), you partition[a, b] into regular subintervals and average the upper and lower sums for f . Iff ′′(x) > 0 on [a, b], what can you say about your estimate?(Hint: does choosing x∗
i to be the left endpoints of the subintervals give you anupper or lower sum? What about the right endpoints? Is the upper sum moreor less of an overestimate than the lower sum is an underestimate? Sketch theapproximating rectangles.)
(c) If f ′′(x) < 0 on [a, b], what could you say about the estimate?
3. In the definition of area, we took the limit as ||P || → 0. You might ask why did wenot just let the number of subintervals approach ∞. To figure out why we can’t dothis, find a sequence {Pj} of partitions of [0, 1] such that each Pj has j subintervalsbut ||Pj|| = 1/2 for all values of j. First sketch the partitions and then try to find aformula. Explain why these partitions do not approximate the area under y = f(x)well.
4. Find the area under the curve f(x) = 1xfrom x = 1 to x = 2 using the partition
P = [1, a], [a, a2], . . . , [an−1, an], where an = 2.
59 Math 1A Worksheets, 7th Edition
(a) Does ‖P‖ → 0? (Hint: is a the same for each n?)
(b) Find upper and lower bounds for the area under the curve. Sketch the approxi-mating rectangles.
(c) Show that n(a− 1) → ln 2 as n → ∞.
(d) What is the area under the curve?
(e) Why do you think that you weren’t asked to find the area in the interval [0, 1]?
Additional Problems
1. Give the ε− δ statement of the fact that the area under a curve can be approximatedby a sum of areas of rectangles to within an arbitrary degree of accuracy by taking thenorm of the partition sufficiently small.
2. (a) Let An be the area of a polygon with n equal sides inscribed in a circle with radiusr. By dividing the polygon into n congruent triangles with central angle 2π/n,show that An = 1
2nr2 sin(2π/n).
(b) Show that limn→∞ An = πr2. (Hint: recall that limθ→0sin θθ
= 1.)
3. Find the area under the curve y = sin x from 0 to π.(Hint: use equal subintervals, right endpoints, and the last problem from the previous
worksheet which said that∑n
i=1 sin ix =sin 1
2nx sin 1
2(n+1)x
sin 1
2x
where x is not an integer
multiple of 2π.)
Math 1A Worksheets, 7th Edition 60
27. The Definite Integral
Questions
1. What sort of functions are guaranteed to be integrable? What does it mean for afunction to be integrable?
2. Does∫ b
af(x) dx depend on x? What is x (number, function, etc.)? What is the integral
sign? The integrand? The lower limit of integration? The upper limit of integration?Does dx mean anything?
3. (a) When f(x) ≥ 0 and a < b, what is the interpretation of∫ b
af(x) dx? Sketch a
picture illustrating this interpretation.
(b) When a > b, what does∫ b
af(x) dx mean? If a = b, what does
∫ a
af(x) dx equal?
4. Sketch f(x) = x3. Write∫ 1
−2x3 dx as a difference of areas.
5. (a) Draw an example of a function f(x) that is bounded on an interval [a, b]. Indicateupper and lower bounds.
(b) Draw an example of a function f(x) that is unbounded on an interval [a, b].
(c) True or false? If true, explain why. If false, give a counterexample:
i. If f is bounded on [a, b], then f is integrable on [a, b].
ii. If f is integrable on [a, b], then f is bounded on [a, b].
iii. If f is not bounded on [a, b], then f is not integrable on [a, b].
iv. If f is not integrable on [a, b], then f is not bounded on [a, b].
(d) What two pairs of the previous four statements actually mean the same thing?
6. (a) If f is integrable, as long as ‖P‖ → 0, does it matter what sort of partition or x∗i
are chosen?
(b) If you just want an approximation to∫ b
af(x) dx, which rule could you use? In
that case, what is meant by ∆x and x̄i?
Problems
1. Suppose that f is integrable and let P be a regular partition of [a, b] into n subintervals.
(a) Express the following in terms of a, b, n, and i:
i. ∆xi for i = 1 to n.
ii. ‖P‖
61 Math 1A Worksheets, 7th Edition
iii. x0, x1, xi, and xn.
(b) If x∗i is chosen to be the right endpoint, then x∗
i =?
(c) As n → ∞, what happens to ‖P‖?Starting from
∫ b
af(x) dx = lim‖P‖→0
∑ni=1 f(x
∗i )∆xi use the previous expressions
to find a simpler formula for calculating integrals.
2. Express the following limits as definite integrals.
(a) limn→∞
2
n
n∑
i=1
[
3(1 +2i
n)− 6
]
.
(b) limn→∞
√1 +
√2 +
√3 + . . .+
√n
n3/2.
3. Show geometrically and explain why:
(a) If f(x) is an even function, then∫ a
−af(x)dx = 2
∫ a
0f(x) dx.
(b) If f(x) is an odd function, then∫ a
−af(x)dx = 0.
4. Let f(x) =
{
1x
if 0 < x ≤ 10 if x = 0
(a) Show that f is not continuous on [0, 1].
(b) Show that f is unbounded on [0, 1].
(c) Show that∫ 1
0f(x) dx does not exist, that f is not integrable on [0, 1].
(Hint: show that the first term in the Riemann sum, f(x∗i )∆xi can be made
arbitrarily large.)
Additional Problems
1. Give the (ε, δ) statement of the fact that a definite integral can be approximated towithin any desired degree of accuracy by a Riemann sum.
2. Evaluate∫ 1
0ex dx.
(Hint: use the fact that ex is continuous, and so therefore integrable. How does thishelp you? Recall the sum of a geometric series, and l’Hospital’s Rule.)
3. Assume that the following integrals exist and that a ≤ b.
(a) Prove that if f(x) ≥ 0 for a ≤ x ≤ b, the∫ b
af(x) dx ≥ 0.
(b) Show that if f(x) ≥ g(x) for a ≤ x ≤ b, then∫ b
af(x) dx ≥
∫ b
ag(x) dx.
(c) Prove that ifm ≤ f(x) ≤ M for a ≤ x ≤ b, thenm(b−a) ≤∫ b
af(x) dx ≤ M(b−a).
(d) Show that∣
∣
∣
∫ b
af(x) dx
∣
∣
∣≤∫ b
a|f(x)| dx.
Math 1A Worksheets, 7th Edition 62
4. (a) Suppose that we defined∫ b
af(x) dx = limn→∞
∑ni=1 f(a+ i b−a
n) b−a
n.
Let f(x) =
{
1 x irrational0 x rational.
Calculate∫ 1
0f(x) dx and
∫
√2√2+1
f(x) dx using the above “definition”. Geomet-rically, you would expect both integrals to be the same; the way that f(x) isdefined the interval [0, 1] shouldn’t “look” any different from [
√2 + 1,
√2]. Were
the integrals the same? Why is this definition of a definite integral not as goodas the more general one?
(b) Let f(x) =
{
1 x irrational0 x rational
Show that f is bounded but not integrable on [a, b].(Hint: show that, no matter how small ‖P‖ is, some Riemann sums are 0 whereasothers are equal to b− a.)
63 Math 1A Worksheets, 7th Edition
28. The Fundamental Theorem of Calculus
Questions
1. Make triples by choosing an appropriate term from each column:
definite integral function∫ b
af(x) dx
indefinite integral number∫
f(x) dx
2. Suppose that f is continuous on [a, b] and define g(x) =∫ x
af(t) dt.
(a) What does the Fundamental Theorem of Calculus say about g(x)? What sort ofproperties does g have?
(b) Let a = 1, b = 2, and f(t) = 1/t. Sketch a picture of g(x).
3. (a) Suppose that f is continuous on [a, b], then the Fundamental Theorem of Calculus
tells us that∫ b
af(x) dx = F (b)− F (a), where F is an antiderivative of f .
i. What does it mean for F to be an antiderivative of f?
ii. Let g(x) =∫ x
af(t) dt. Is g′ = f?
iii. What is F − g?
(b) Give an example of F , a, and b where∫ b
aF ′(x) dx 6= F (a)−F (b). Why didn’t the
Fundamental Theorem of Calculus apply to this case?(Hint: what happens if you try to integrate f(x) = 1
x2 over an interval containing0?)
4. Find the following. Once you have finished, compare answers to make sure that allmembers of the group agree.
(a)∫
xn dx = (n 6= −1)
(b)∫
1xdx =
(c)∫
ex dx =
(d)∫
ax dx =
(e)∫
sin x dx =
(f)∫
cos x dx =
(g)∫
sec2 x dx =
(h)∫
csc2 x dx =
(i)∫
sec x tan x dx =
Math 1A Worksheets, 7th Edition 64
(j)∫
csc x cot x dx =
(k)∫
1x2+1
dx =
(l)∫
1√1−x2
dx =
Problems
1. (a) Explain what ddx
∫ x
af(t) dt = f(x) means in words.
(b) Explain what∫ b
aF ′(x) dx = F (b)− F (a) means in words.
(c) What do these two statements say about the relationship between integration anddifferentiation?
2. Suppose that a particle is moving in a straight line with position function s(t), velocityfunction v(t), and acceleration function a(t).
(a) What is the difference between speed and velocity?
(b) Explain how “displacement” differs from “distance traveled.”
(c) Use the Fundamental Theorem of Calculus to express both displacement anddistance traveled as functions of velocity.
(d) Explain how both displacement and distance traveled can be interpreted in termsof areas under a velocity curve. Illustrate this with a picture.
(e) What direction is the particle traveling when v ≥ 0? When v ≤ 0?
3. Let g(x) =∫ x
−1|t| dt.
(a) Find g(x) for −1 < x < 0 and 0 < x < 1.
(b) Plot g(x) for −1 < x < 1.
(c) Find g′(x) and g′(0).
(d) Does g′′(0) exist?
4. Show that∫
x2 sin x dx = −x2 cos x+ 2∫
x cos x dx.(Hint: Differentiate both sides.)
5. (a) Show that 1 ≤√1 + x3 ≤ 1 + x3 for x ≥ 0.
(b) Show that 1 ≤∫ 1
0
√1 + x3 dx ≤ 1.25.
6. (a) Find dydx
if y =∫ x2
cosxcos(u2) du.
(b) If f is continuous, and g and h are differentiable functions, find a formula forddx
∫ h(x)
g(x)f(t) dt.
65 Math 1A Worksheets, 7th Edition
Additional Problems
1. If w′(t) is the rate of growth of a child in pounds per year, what does∫ 10
5w′(t) dt
represent?
2. Find a function f such that f(1) = 0 and f ′(x) = 2x/x.
Math 1A Worksheets, 7th Edition 66
29. The Substitution Rule
Questions
1. If F ′ = f , show that∫
f(g(x))g′(x) dx = F (g(x)) + C by differentiating both sides.
2. Applying the substitution rule involves guessing an appropriate substitution. Oftenthere is more than one substitution that will work! Find two different possible substi-tutions for
∫ √5x+ 2 dx and integrate to show that both substitutions give you the
same answer.
3. Evaluate the following definite integrals (if they exist) by making a substitution of theform u = a function of x. Make sure to write down explicitly what u and du are equalto in terms of x.
(a)∫ a
0x√a2 − x2 dx
(b)∫ a
0x√x2 + a2 dx, where a > 0
(c)∫ a
−ax√x2 + a2 dx
4. Evaluate∫
ex+1ex
dx and∫
ex
ex+1dx.
Problems
1. Use the Fundamental Theorem of Calculus to prove∫ b
af(g(x)) g′(x) dx =
∫ g(b)
g(a)f(u) du,
where g′ is continuous on [a, b] and f is continuous on the range of g. (Hint: UsingF ′ = f , show that both sides of the equality are equal to a common middle.)
2. Evaluate∫ 2
−2(x+3)
√4− x2 dx. (Hint: remember that integrals can be interpreted in
terms of area.)
3. Assume that f is continuous on [−a, a] where a > 0, and prove that:
(a) If f is an even function, then∫ a
−af(x) dx = 2
∫ a
0f(x) dx.
(b) If f is an odd function, then∫ a
−af(x) dx = 0.
(c) Sketch graphs which illustrate both of these points.
4. (a) If f is continuous on R, prove by making a substitution that∫ b
af(−x) dx =
∫ −a
−bf(x) dx. For the case where f(x) ≥ 0, draw a diagram to interpret this
equation geometrically as an equality of areas.
(b) If f is continuous on R, prove that∫ b
af(x + c) dx =
∫ b+c
a+cf(x) dx. For the case
where f(x) ≥ 0, draw a diagram to interpret this equation geometrically as an-other equality of areas.
67 Math 1A Worksheets, 7th Edition
Additional Problems
1. Evaluate∫
xe−x2
dx. Can you evaluate∫
e−x2
dx?
2. (a) Evaluate∫
(x3 + 1)−1/2 x5 dx.
(b) If a and b are positive numbers, show that∫ 1
0xa(1 − x)b dx =
∫ 1
0xb(1− x)a dx.
3. Evaluate the integral∫ π
0x sinx
1+cos2 xdx.
(Hint: use the substitution u = π−x to show that∫ π
0xf(sin x) dx = π
2
∫ π
0f(sin x) dx.)
Math 1A Worksheets, 7th Edition 68
30. The Logarithm defined as an Integral
Questions
1. Sketch the graphs of 1xand ln x, both for x > 0.
(a) How are the graphs related to one another?
(b) Why is ln 1 = 0? Use the definition of ln x.
(c) If 0 < x < 1, why is ln x < 0?
(d) Why is ddx
ln x = 1x?
2. (a) What condition must a function satisfy in order to have an inverse?
(b) How do you know that ln x has an inverse function (based only on the integraldefinition of ln x)?
(c) If exp(x) is defined to be the inverse of ln x, what is exp(0)? What is exp(1)?
(d) Sketch the graph of exp(x) based on the fact that it is the inverse of ln x.
3. Write ax in terms of ln x and ex.
Problems
1. (a) Use the Intermediate Value Theorem to show that there is a solution to theequation ln x = 1.
(b) Use the Mean Value Theorem to show that this solution is unique.
(c) This solution has a name. What is it?
2. Prove the laws of exponents for ex (i.e. ex+y = . . . and (ex)y = . . .) using the laws oflogarithms for ln x.
Additional Problems
1. Show geometrically that 12<∫ 2
1dtt
< 1. Remember that ln(an) = n ln a and that(ln x)′ > 0. Argue that if x > 2n, then ln x > n ln 2 > n
2. What does this tell you
about ln x as x → ∞?
2. Show geometrically that if x < 2−n, then ln x < −n ln 2. Use this fact to show thatln x → −∞ as x → 0+.
3. Use the integral definition of ln(ab) to show that ln(ab) = ln a+ ln b.(Hint: how does the substitution u = t/a help you?)
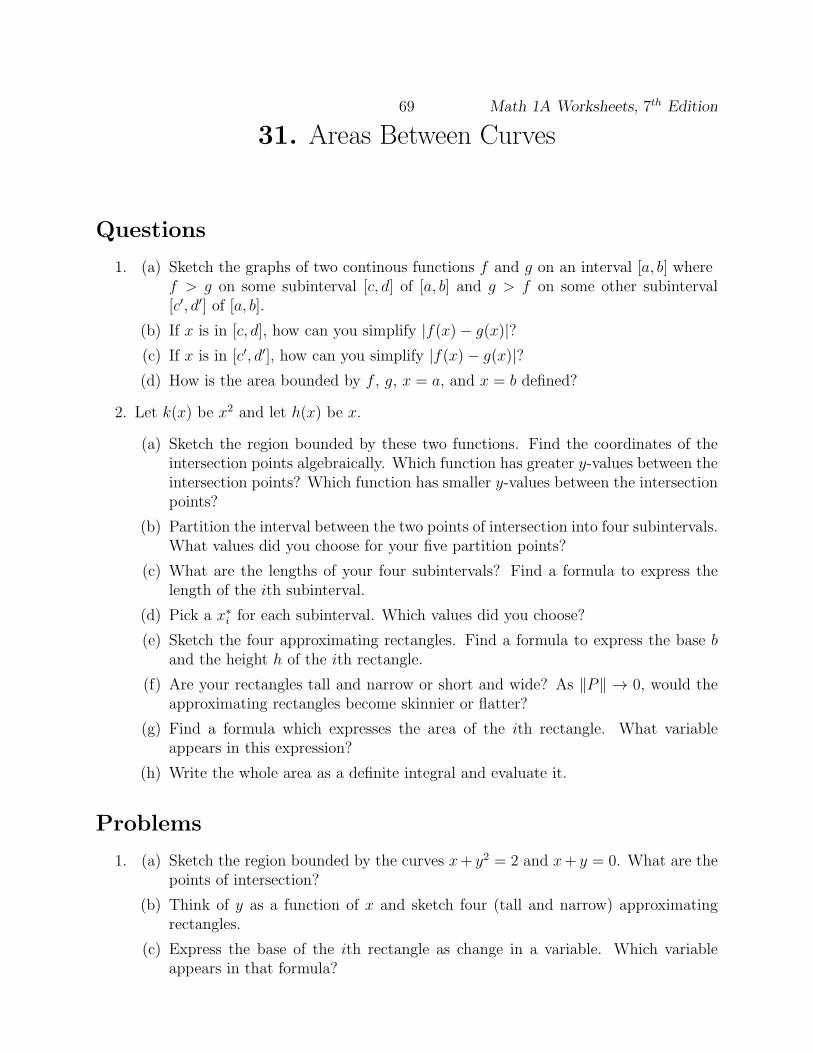
69 Math 1A Worksheets, 7th Edition
31. Areas Between Curves
Questions
1. (a) Sketch the graphs of two continous functions f and g on an interval [a, b] wheref > g on some subinterval [c, d] of [a, b] and g > f on some other subinterval[c′, d′] of [a, b].
(b) If x is in [c, d], how can you simplify |f(x)− g(x)|?(c) If x is in [c′, d′], how can you simplify |f(x)− g(x)|?(d) How is the area bounded by f , g, x = a, and x = b defined?
2. Let k(x) be x2 and let h(x) be x.
(a) Sketch the region bounded by these two functions. Find the coordinates of theintersection points algebraically. Which function has greater y-values between theintersection points? Which function has smaller y-values between the intersectionpoints?
(b) Partition the interval between the two points of intersection into four subintervals.What values did you choose for your five partition points?
(c) What are the lengths of your four subintervals? Find a formula to express thelength of the ith subinterval.
(d) Pick a x∗i for each subinterval. Which values did you choose?
(e) Sketch the four approximating rectangles. Find a formula to express the base band the height h of the ith rectangle.
(f) Are your rectangles tall and narrow or short and wide? As ‖P‖ → 0, would theapproximating rectangles become skinnier or flatter?
(g) Find a formula which expresses the area of the ith rectangle. What variableappears in this expression?
(h) Write the whole area as a definite integral and evaluate it.
Problems
1. (a) Sketch the region bounded by the curves x+ y2 = 2 and x+ y = 0. What are thepoints of intersection?
(b) Think of y as a function of x and sketch four (tall and narrow) approximatingrectangles.
(c) Express the base of the ith rectangle as change in a variable. Which variableappears in that formula?
Math 1A Worksheets, 7th Edition 70
(d) Find a formula for the height of the rectangles to the left of the line x = 1. Finda formula for the height of the rectangles to the right of the line x = 1. Whichvariable appears in both of these formulas?
(e) Can you use just one formula for the height of the ith approximating rectangle?Why or why not?
(f) Write down formulas for the area of the ith approximating rectangle, includingthe intervals on which such formulas are valid.
(g) Express the area of the whole region as a sum of two definite integrals. Evaluatethe integrals to find a numerical value for the area.
2. (a) Again sketch the region bounded by the curves x + y2 = 2 and x + y = 0. Thistime, though, think of x as a function of y. Which function is further to the right?This function has greater x-values. Which function is further to the left? Thisfunction has lesser x-values.
(b) What interval will your partition to get the approximating rectangles? Expressthe length of the ith subinterval as a change in a variable. What variable shouldyou use? (Hint: When y was a function of x, we partitioned an interval alongthe x-axis. Now, though, y is our independent variable and x is our dependent
variable!)
(c) Sketch four (shorter and wider) approximating rectangles. As ‖P‖ → 0, will theserectangles get skinnier or flatter?
(d) The height of the ith rectangle is the same as the length of theith subinterval. Now express the width of the ith rectangle. What variableshould you use? (Hint: the width is a difference of x-values corresponding to y∗i .Subtract the greater x-value from the lesser.)
(e) Express the area as another definite integral. Is this a simpler expression than theone from the previous problem? Evaluate the integral to find a numerical valuefor the area. Did you get the same answer as before? (You should!)
3. (a) Find a number a such that the line x = a bisects the area under the curvey = 1/x2, 1 ≤ x ≤ 4.
(b) Find a number b such that the line y = b also bisects the same area.
4. Suppose that 0 < c < π/2. For what values of c is the area of the region enclosed bythe curves y = cos x, y = cos(x− c), and x = 0 equal to the area of the region enclosedby the curves y = cos(x− c), x = π, and y = 0?
Additional Problems
1. (a) Find the area of the region above the x-axis bounded by y = 1/√x, x = 1, and
x = b where b > 1. Your answer will depend on b. What happens as b → ∞?
(b) Repeat the first part using the curve y = 1/x2.
71 Math 1A Worksheets, 7th Edition
(c) What would happen as b → ∞ if you used the curve y = 1/xp instead, where pwas a fixed number greater than 1?
(d) What would happen as b → ∞ if p were a fixed number less than 1?
2. Sketch a rectangle with sides parallel to the coordinate axes that has one vertex at theorigin and the diagonally opposite vertex on the curve y = axn at x = b. a, n, and bare all assumed to be positive values. Show that the fraction of the rectangle’s areabelow the curve depends on n, but not on a or b.
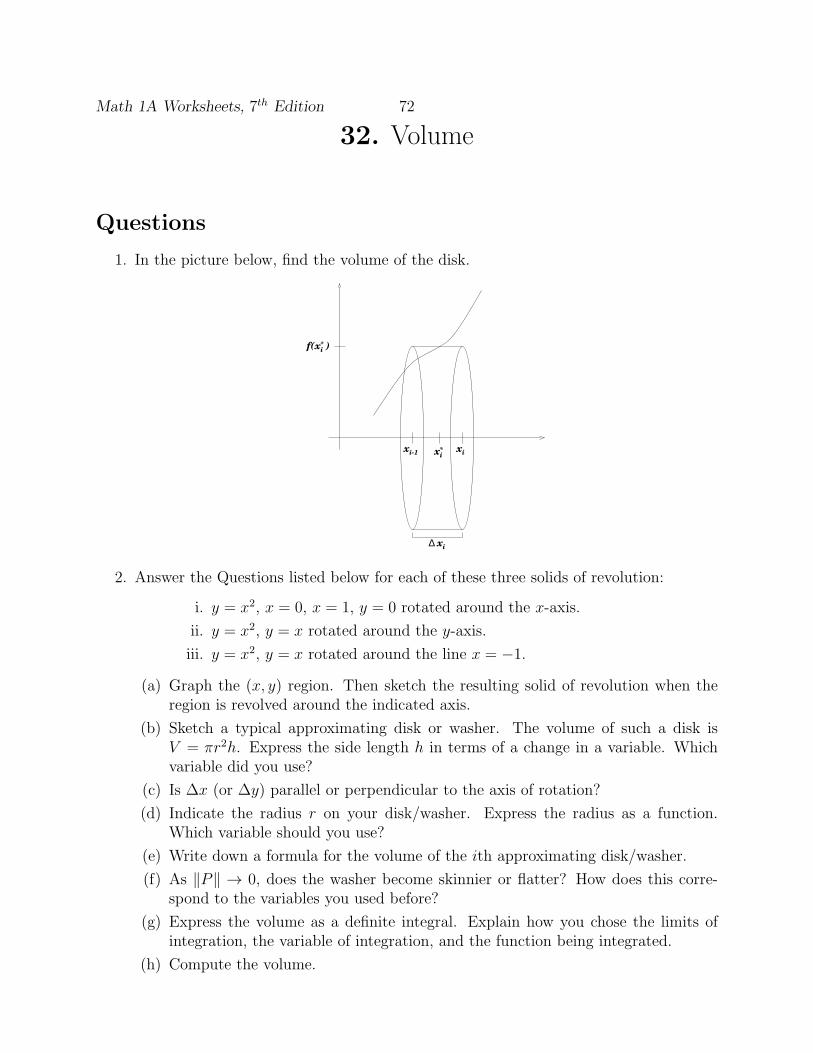
Math 1A Worksheets, 7th Edition 72
32. Volume
Questions
1. In the picture below, find the volume of the disk.
xi-1 xi*xi
*xi
xi
f( )
∆
2. Answer the Questions listed below for each of these three solids of revolution:
i. y = x2, x = 0, x = 1, y = 0 rotated around the x-axis.
ii. y = x2, y = x rotated around the y-axis.
iii. y = x2, y = x rotated around the line x = −1.
(a) Graph the (x, y) region. Then sketch the resulting solid of revolution when theregion is revolved around the indicated axis.
(b) Sketch a typical approximating disk or washer. The volume of such a disk isV = πr2h. Express the side length h in terms of a change in a variable. Whichvariable did you use?
(c) Is ∆x (or ∆y) parallel or perpendicular to the axis of rotation?
(d) Indicate the radius r on your disk/washer. Express the radius as a function.Which variable should you use?
(e) Write down a formula for the volume of the ith approximating disk/washer.
(f) As ‖P‖ → 0, does the washer become skinnier or flatter? How does this corre-spond to the variables you used before?
(g) Express the volume as a definite integral. Explain how you chose the limits ofintegration, the variable of integration, and the function being integrated.
(h) Compute the volume.
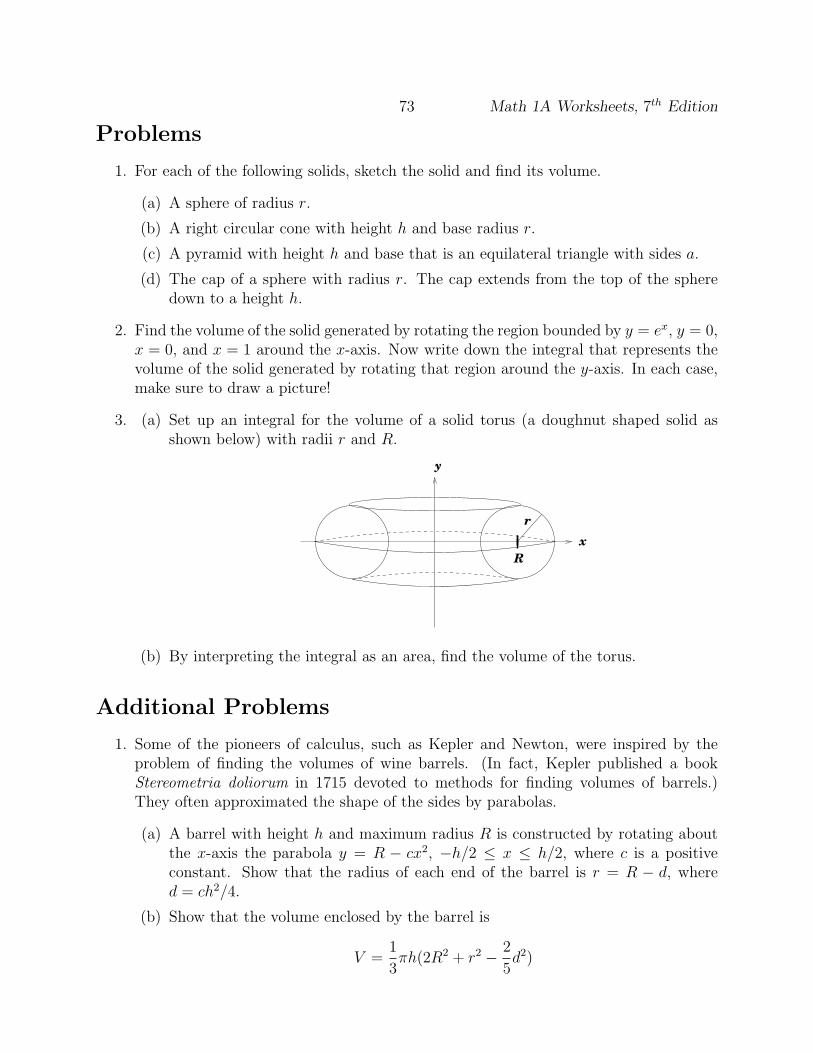
73 Math 1A Worksheets, 7th Edition
Problems
1. For each of the following solids, sketch the solid and find its volume.
(a) A sphere of radius r.
(b) A right circular cone with height h and base radius r.
(c) A pyramid with height h and base that is an equilateral triangle with sides a.
(d) The cap of a sphere with radius r. The cap extends from the top of the spheredown to a height h.
2. Find the volume of the solid generated by rotating the region bounded by y = ex, y = 0,x = 0, and x = 1 around the x-axis. Now write down the integral that represents thevolume of the solid generated by rotating that region around the y-axis. In each case,make sure to draw a picture!
3. (a) Set up an integral for the volume of a solid torus (a doughnut shaped solid asshown below) with radii r and R.
R
r
y
x
(b) By interpreting the integral as an area, find the volume of the torus.
Additional Problems
1. Some of the pioneers of calculus, such as Kepler and Newton, were inspired by theproblem of finding the volumes of wine barrels. (In fact, Kepler published a bookStereometria doliorum in 1715 devoted to methods for finding volumes of barrels.)They often approximated the shape of the sides by parabolas.
(a) A barrel with height h and maximum radius R is constructed by rotating aboutthe x-axis the parabola y = R − cx2, −h/2 ≤ x ≤ h/2, where c is a positiveconstant. Show that the radius of each end of the barrel is r = R − d, whered = ch2/4.
(b) Show that the volume enclosed by the barrel is
V =1
3πh(2R2 + r2 − 2
5d2)
Math 1A Worksheets, 7th Edition 74
2. Water in an open bowl evaporates as a rate proportional to the area of the surface ofthe water. (This means that the rate of decrease of the volume is proportional to thearea of the surface.) Show that the depth of the water decreases at a constant rate,regardless of the shape of the bowl.
3. Evaluate the integral in the second part of Problem 2.
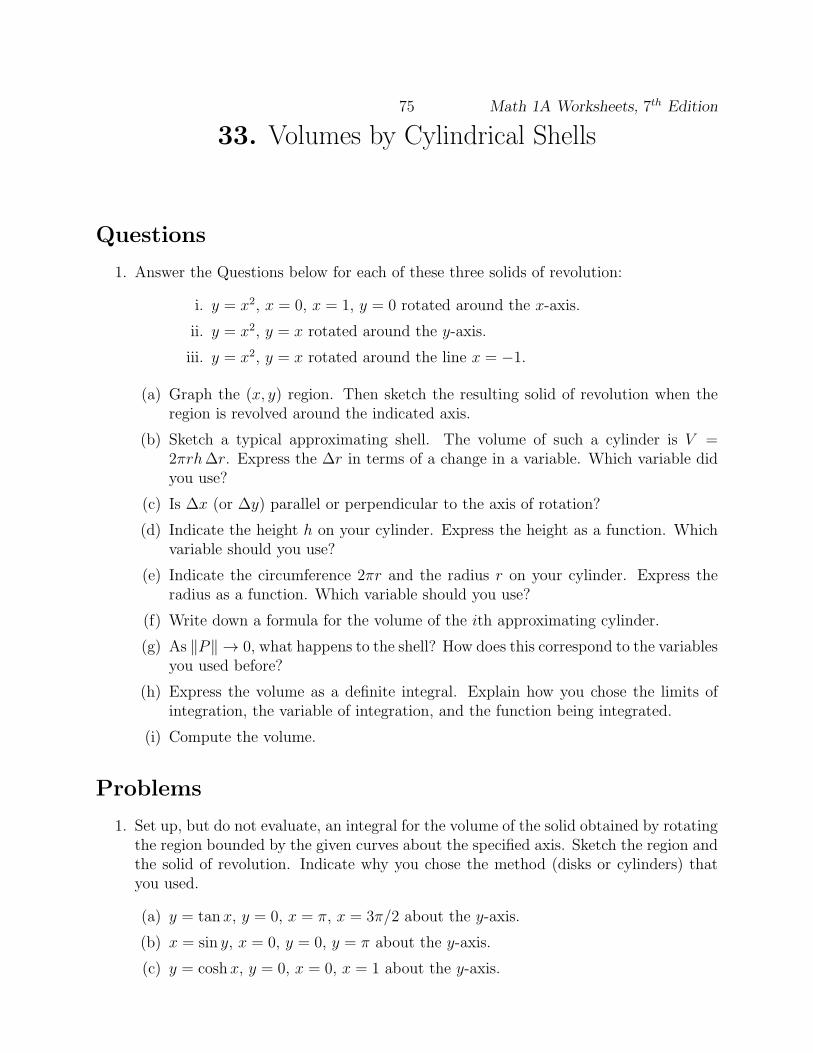
75 Math 1A Worksheets, 7th Edition
33. Volumes by Cylindrical Shells
Questions
1. Answer the Questions below for each of these three solids of revolution:
i. y = x2, x = 0, x = 1, y = 0 rotated around the x-axis.
ii. y = x2, y = x rotated around the y-axis.
iii. y = x2, y = x rotated around the line x = −1.
(a) Graph the (x, y) region. Then sketch the resulting solid of revolution when theregion is revolved around the indicated axis.
(b) Sketch a typical approximating shell. The volume of such a cylinder is V =2πrh∆r. Express the ∆r in terms of a change in a variable. Which variable didyou use?
(c) Is ∆x (or ∆y) parallel or perpendicular to the axis of rotation?
(d) Indicate the height h on your cylinder. Express the height as a function. Whichvariable should you use?
(e) Indicate the circumference 2πr and the radius r on your cylinder. Express theradius as a function. Which variable should you use?
(f) Write down a formula for the volume of the ith approximating cylinder.
(g) As ‖P‖ → 0, what happens to the shell? How does this correspond to the variablesyou used before?
(h) Express the volume as a definite integral. Explain how you chose the limits ofintegration, the variable of integration, and the function being integrated.
(i) Compute the volume.
Problems
1. Set up, but do not evaluate, an integral for the volume of the solid obtained by rotatingthe region bounded by the given curves about the specified axis. Sketch the region andthe solid of revolution. Indicate why you chose the method (disks or cylinders) thatyou used.
(a) y = tan x, y = 0, x = π, x = 3π/2 about the y-axis.
(b) x = sin y, x = 0, y = 0, y = π about the y-axis.
(c) y = cosh x, y = 0, x = 0, x = 1 about the y-axis.
Math 1A Worksheets, 7th Edition 76
(d) y = ln x, y = 0, x = 1, x = 10 about the x-axis.
(e) y = ex, x = 0, y = e2 about the x-axis.
2. Find the volumes of the described solids using the method of cylindrical shells. (Hint:
always begin by sketching a picture.)
(a) A sphere of radius r.
(b) A right circular cone with height h and base radius r.
3. Using the cylindrical method, set up the integral representing the volume of the solidgenerated by rotating the region bounded by y = ex, y = 0, x = 0, and x = 1 aroundthe y-axis. Now set up the integral representing the volume obtained by rotating thatregion around the x-axis. In each case, make sure to draw a picture!
Additional Problems
1. The formula V =∫ b
a2πf(x) dx is valid only if b > a ≥ 0. Show that if a < b ≤ 0, then
V = −∫ b
a2πf(x) dx.
2. Find a formula for the volume of a solid obtained when the region under the graph off from a to b is rotated about the vertical line x = c in the cases where (i) c ≤ a < band (ii) a < b ≤ c.
Review 77 Math 1A Worksheets, 7th Edition
34. Integration and Optimization
Production Cycles
A factory produces P flat panel displays per day at a cost ofC dollars per display. Unfortunately, the demand for thesedisplays is D < P per day, and the cost of holding a display ininventory is H dollars per day. Because of this holding cost,it doesn’t make sense to run the factory continuously, sincethis would lead to a large, and costly, excess of displays. It ismore cost effective to run the factory for N days, then stopproduction for M days until all of the displays are purchased.When production resumes for the next cycle, of period T =N + M, a start-up cost S dollars must be paid. (Note thatwe are considering the process to be essentially continuous, sothat N , M and T need not be integers.)
(a) The number of displays W (t) in the warehouse (in in-ventory) at any time t is given by
W (t) = (P −D)t, 0 ≤ t ≤ NW (t) = (P −D)N −D(t−N), N ≤ t ≤ T
Sketch the inventory W (t) over a full production cycle (0 ≤ t ≤ T ). Be able to explain whyW (t) has this form.
(b) Show that the production time N and the total period T are related by the equationNP = TD. What is NP?
(c) The total inventory cost I(T ) over a production cycle is given as
I(T ) = H
∫ T
0
W (s)ds.
Evaluate this integral [hint: try doing it geometrically] to show that
I(T ) =1
2HDT 2(1−D/P ).
(d) The total number of displays produced during a production cycle is NP = TD, sothat the total cost Z of this production is the sum of three terms: the start up cost, theproduction cost, and the inventory cost
Z = S + CDT +1
2HDT 2(1−D/P )
Math 1A Worksheets, 7th Edition 78 Review
Use this to obtain an equation in terms of the time T for the overall cost per display. Thisoverall cost per display is greater than the production cost per display, C, due to the startup and inventory costs.
(e) Find the value of T which will minimize the overall cost per display. Find thenumerical value of T for the conditions given in the following table.
Variable Significance Value
P Production Rate in Units per Day 1000C Production Cost per Unit $250D Demand in Units per Day 200H Holding Cost per Unit per Day $1.00S Start up Cost $8,000
(f) For the optimal value of T , find the contributions to the overall cost per display ofthe three elements of the production cycle: start up, production, and inventory. What isinteresting about this result? Could you have predicted it without using calculus?
(g) What production schedule should you use if the start up cost could be reduced tozero?