
Maternal Mortality AGOS September 2017 - agosonline.org · Pregnancy related mortality US 2011-13...
54
Maternal Mortality AGOS September 2017 Michael F. Greene M.D.
Transcript of Maternal Mortality AGOS September 2017 - agosonline.org · Pregnancy related mortality US 2011-13...

Maternal MortalityAGOS September 2017
Michael F. Greene M.D.

Michael F. Greene M.D.
Disclosures; I receive payments for services rendered from:
• Massachusetts General Physicians’ Organization.
• New England Journal of Medicine.
• UpToDate.
• Elsevier.

New York Times Sunday July 29, 2017

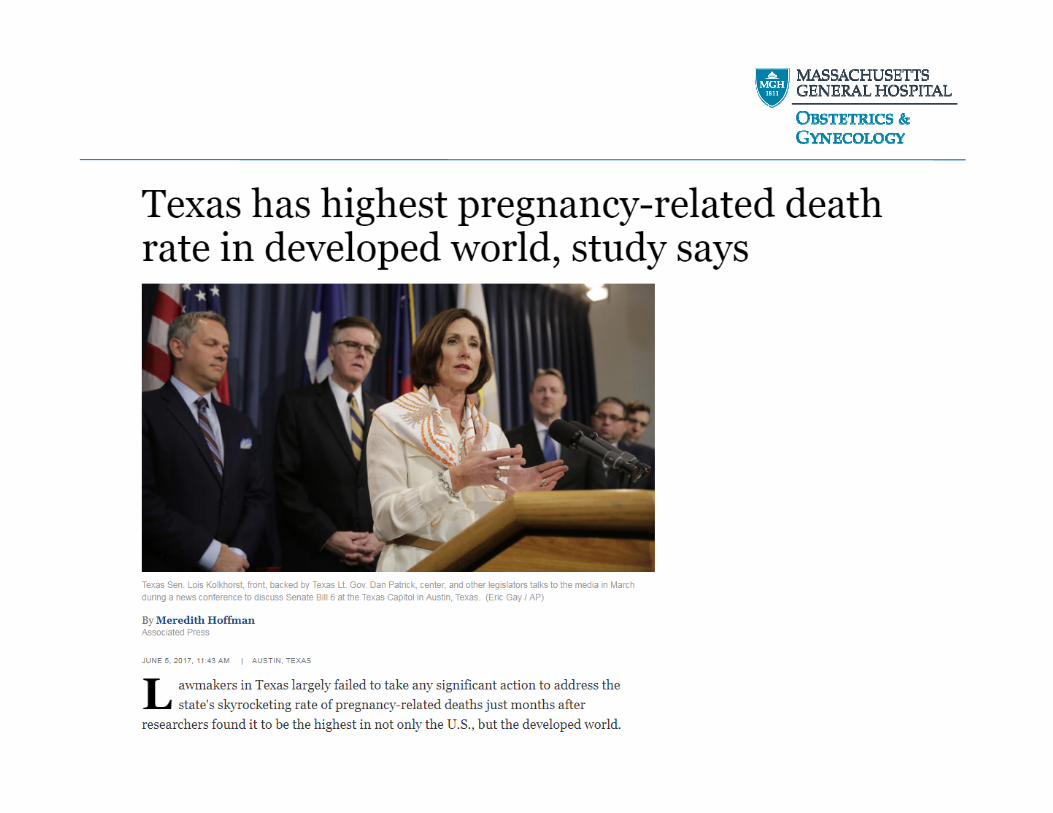
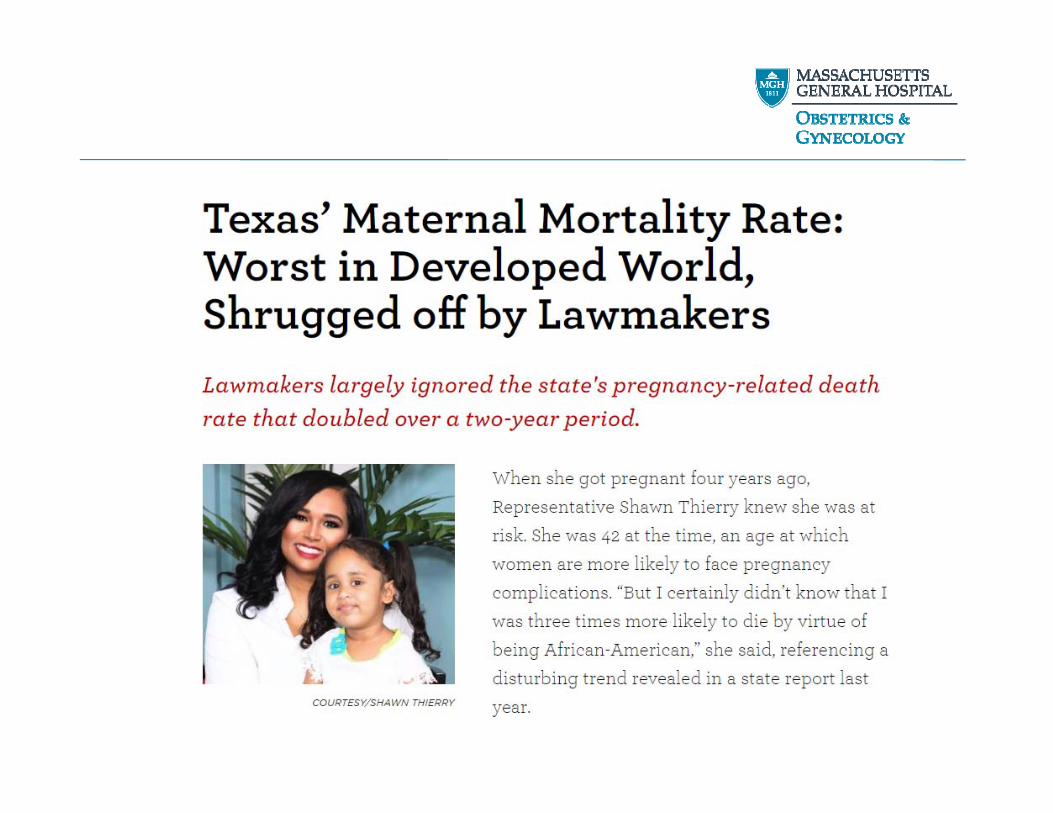
Boston Globe Sunday July 29, 2017

Boston Globe Sunday July 29, 2017

Boston Globe Sunday July 29, 2017
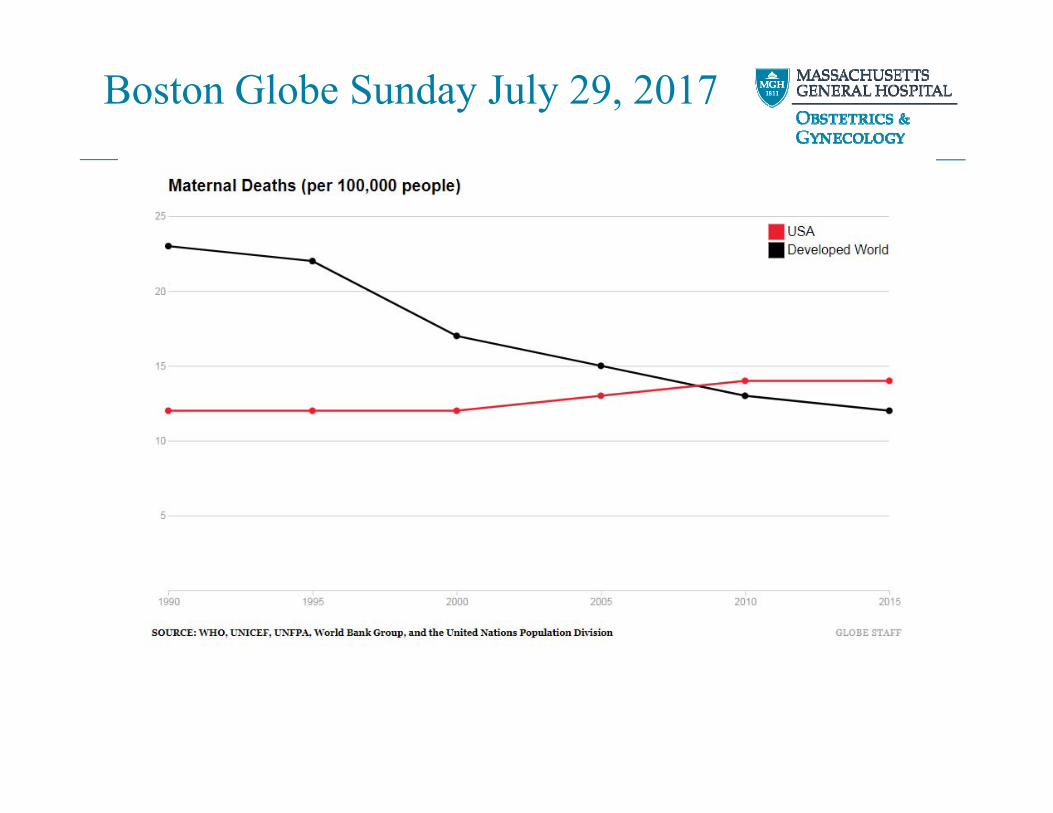
Boston Globe Sunday July 29, 2017


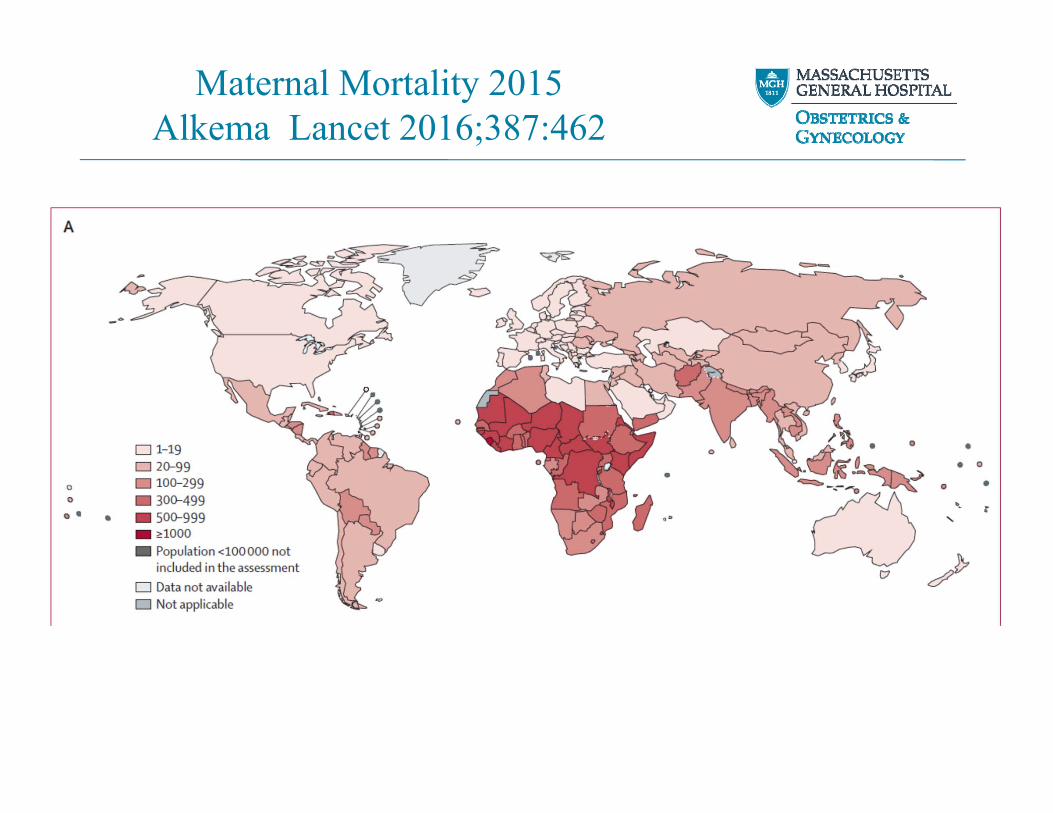
Maternal Mortality 2015Alkema Lancet 2016;387:462

Maternal Mortality Ratio per 100,000The Guardian Newspaper London 2010

MacDorman Obstet Gynecol2016(Sep);128:447
• 2003 Revision US Death Certificate by NCHS added check box:
– Was the woman pregnant at time of death?
– Was the woman pregnant within 42 days?
– Was the woman pregnant within 43 days to 1 year?
– Unknown if pregnant in past year.
• Adoption of new form by states uneven; NCHS has no enforcement mechanism
• Adoption varied from prompt 2003 (California) to not yet by end of December 2014 (Alabama)

MacDorman Obstet Gynecol2016(Sep);128:447

MacDorman Obstet Gynecol2016(Sep);128:447
Maternal Mortality Ratio

MacDorman Obstet Gynecol2016(Sep);128:447
Maternal Mortality Ratio Texas

MacDorman Obstet Gynecol2016(Sep);128:447
0
5
10
15
20
25
2000 2001 2002 2003 2004 2005 2006 2007 2008 2009 2010 2011 2012 2013 2014
Best Adjusted Estimate US Maternal Mortality Ratio

Pregnancy related mortality US 2011-13Creanga Obstet Gynecol 2017 (Aug);130:366
• A pregnancy-related death is defined as the death of a woman during or within 1 year of pregnancy that was caused by a pregnancy complication, a chain of events initiated by pregnancy, or the aggravation of an unrelated condition by the physiologic effects of pregnancy.
• Deaths attributable to a medical condition exacerbated by but not unique to pregnancy are not considered pregnancy-related if the temporal association between the pregnant status and death is known solely from a pregnancy checkbox stating “pregnant within a year”; if the checkbox states “pregnant within 42 days” or “pregnant within 90 days,” the death may be considered pregnancy-related or not depending on the cause of death and the pathophysiologic relationship between the cause and pregnancy.

Maternal age and risk of mortality by raceCreanga Obstet Gynecol 2017 (Aug);130:366

Causes of maternal mortality by yearCreanga Obstet Gynecol 2017 (Aug);130:366
1.66
1.83
1.965.16
0.080.72
0.77
0.970.42
0.39

Creanga Obstet Gynecol 2017 (Aug);130:366

Pregnancy related mortality US 2011-13Creanga Obstet Gynecol 2017 (Aug);130:366
• 2,009 deaths met criteria for 2011-2013
• MMR for 3 years 17.0/100,000: stable over 3 years
• MMR 43.5 / 100,000 for non-Hispanic Blacks vs 12.7 / 100,000 for non-Hispanic Whites. Ratio 3.4 : 1
• Women ≥ 35 yoa were 14.7% of all births but 30.9% of deaths
• Current standard WHO definition is death during pregnancy or within 42 days of delivery. Among the 1,743 women in CDC study cohort for whom time between delivery and death was known, 1,514 (86.9%) would have met WHO criteria.

Pregnancy related mortality US 2011-13Creanga Obstet Gynecol 2017 (Aug);130:366
• 54.1% of all deaths were due to:– 15.5% Cardiovascular Conditions– 14.5% Other Non-cardiovascular– 12.7% Infection– 11.4% Hemorrhage

Pregnancy related mortality US 2011-13Creanga Obstet Gynecol 2017 (Aug);130:366
• “Even if the Pregnancy Mortality Surveillance System is the most comprehensive source of national maternal mortality data and its 10-category cause-of-death system is more granular than International Classification of Diseases, 10th Revision codes, it contains limited information for understanding modifiable contributors to pregnancy-related mortality.”

Clark Obstet Gynecol 2017(July);130:198

First Births to Older WomenNCHS Data Brief 2014(May);No 152

Mean Age US Mothers 2000-2014NCHS Data Brief 2016(Jan);No. 232

Global Burden of Disease: ObesityNEJM 2017(6Jul);377:13
2015 Prevalence BMI > 30

Adult Obesity Prevalence Maps CDC

Adult Obesity Prevalence Maps CDC

Campbell Mat Morbidity & Risk of DeathObstet Gynecol 2013;122:627
Mat Age Deaths Survivors Rate/100,000
<20 4 75,988 5
20-35 80 747,402 11
>35 48 202,381 24
Liveborn singletons ≥ 22 wksNew York City 1995-2003

Campbell Mat Morbidity & Risk of DeathObstet Gynecol 2013;122:627
Rate % Death/100K aOR (95% CI)
cHTN & PEor E 0.6 238 8.7 (4.6-16)
cHTN 1.8 122 7.7 (4.7-12)
PE or E 4.1 95 8.1 (5.5-12)

Campbell Mat Morbidity & Risk of DeathObstet Gynecol 2013;122:627
Rate % Death/100K aOR (95% CI)
Pre Gest DM 0.7 67 3.3 (1.3-8)
Wt > 250lb 1.1 42 2.9 (1.1-8)
cLung Dz 1.5 37 NS
cCVD 0.8 34 NS

Physiology of Peripartum CardiomyopathyPatten Nature 2012(17May);485:333
“The data indicate that PPCM is caused by a ‘two-hit’ combination of, first, systemic anti-angiogenic signals during late pregnancy and, second, a host susceptibility marked by insufficient local pro-angiogenic defences in the heart. The first hit explains why PPCM is a disease of the late gestational period, which is precisely when circulating anti-angiogenicfactors such as sFLT1 peak in pregnancy.”

Bello Prevalence of preeclampsia in PPCMJACC 2013(Oct);62(18):1715
Prevalence ofPreeclampsia
22%
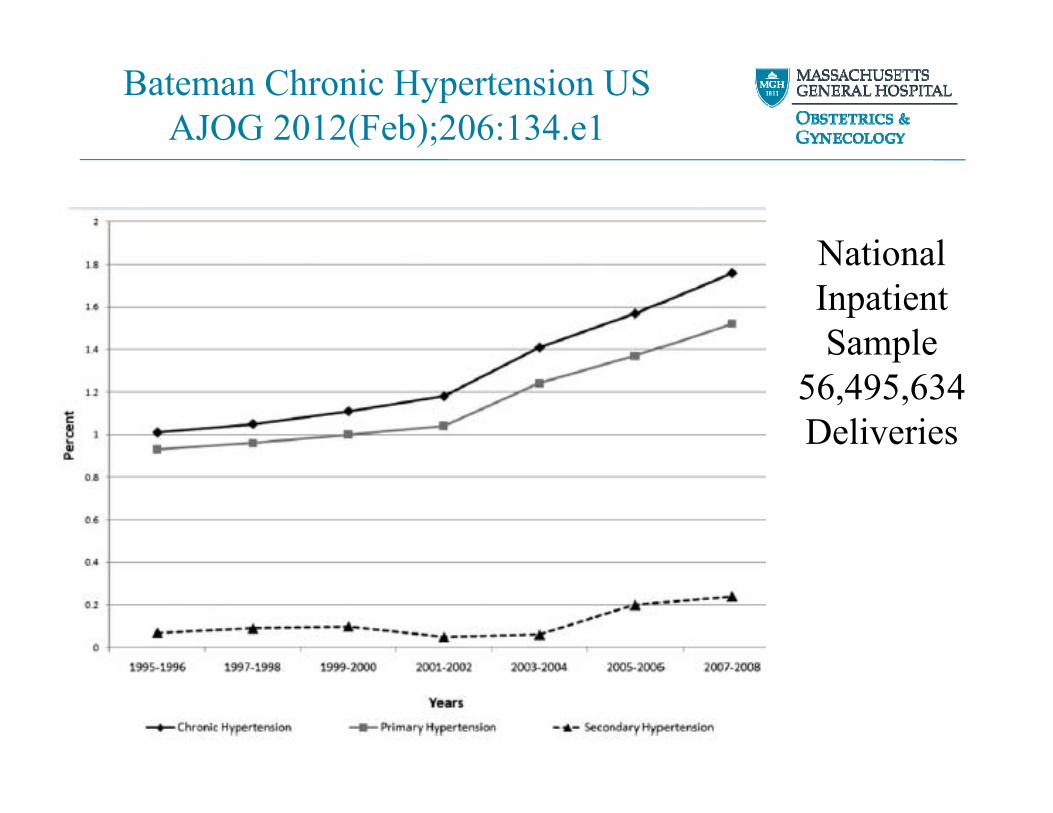
Bateman Chronic Hypertension USAJOG 2012(Feb);206:134.e1
NationalInpatientSample
56,495,634Deliveries

Grotegut Change in prevalence PPCMBJOG 2014;121:1368
• 7,000,000-8,000,000 Hospital admissions per year
• 1,000 US Hospitals from up to 44 states• Queried for diagnosis Peri-Partum
Cardiomyopathy• Women with cHTN RR PPCM 13.2 (12.5-13.7)• Absolute risk PPCM 4.1/1,000

Grotegut Change in prevalence PPCMBJOG 2014;121:1368

Grotegut Change in prevalence PPCMBJOG 2014;121:1368

NICU Admissions Neonatal Abstinence SyndromeTolia NEJM 2015;372:2118

Hepatitis C among pregnant womenPatrick MMWR 2017(12May);v66no18:470
• From 2009 – 2014, US HCV rates rose 89% from 1.8 to 3.4/1,000 (p<0.001)
• Marked regional variation– Highest state W. Virginia 22.6/1,000– Campbell County TN 78/1,000

Hepatitis C among pregnant womenPatrick MMWR 2017(12May);v66no18:470

Declining Access to OB ServicesHuang Health Affairs 2017(Sep);36:1663

Declining Access to OB ServicesHuang Health Affairs 2017(Sep);36:1663

Declining Access to OB ServicesHuang Health Affairs 2017(Sep);36:1663
Associations with having no OB Service in County
County level characteristic Change p
↑ # Women 15-44 yoa ↓ 0.01
≤ 90 Annual births ↑ 0.05
↑ # Ob/Gyn / 10,000 W 15-44 ↓ 0.01
↑ # Family Med MD / 10,000 W 15-44 ↓ 0.01

Declining Access to OB ServicesHuang Health Affairs 2017(Sep);36:1663
Associations with having no OB service in County
County level characteristic Change p
↑ % Non-Hispanic Black ↑↑ 0.001
↑ % Hispanic ↓ 0.001
↑ Medicaid eligibility threshold ↓ 0.001

Conclusions 1
• Is the US Maternal Mortality Rate rising, or are we just now reaching a closer approximation to what it has actually been in recent years?
• We will never be confident that we are succeeding in our efforts to reduce maternal mortality until we have universal definitions for maternal mortality among all jurisdictions that remain stable over time. The CDC and NCHS need more than a “bully pulpit”.
• Given the limitations of administrative data to describe the root causes of maternal mortalities, there should be maternal mortality review committees in all jurisdictions that review all maternal mortalities to identify and address potentially contributory remediable deficiencies in quality of care, especially at the health care system level.

Conclusions 2
• Major disparities in quality and access to care currently exist in our country, which make a major contribution to our current Maternal Mortality Ratio.
• The Maternal Mortality Ratio has been, and should continue to be, used as an important measure by which countries and societies are judged for providing humane and equitable care for their all of their citizens.
• Although we cannot solve the problem of overall weak performance on this measure by ourselves as a profession, as the professionals in our society most knowledgeable about the immediate causes and potential remediation of maternal mortality, society will and should look to us for leadership in reducing our national Maternal Mortality Ratio.

Predictions
• Current demographic trends putting upward pressure on our Maternal Mortality Ratio will continue for the foreseeable future.
• We will not solve our problem(s) with more and lengthier check lists.
• We will not break into the world’s top ten nations with the lowest Maternal Mortality Ratios until we have a functioning universal healthcare system that eliminates the disparities in quality and access to care that currently exist in our country, and brings the highest available quality of care to all of our citizens.


