Material Vision - Summer 2007 - PerkinElmer · resolution and scanning ... MATERIAL VISION In the...
15
Fiber Optic Filters For narrow band optical filters the LAMBDA 1050 can provide the necessary wavelength separation needed to ensure quality or detect areas of im- provement. Architectural Glass Coatings and Com- pounds As more architectural glass is being coated or made with laminated ma- terials, the need for an instrument that can meas- ure varying and innovative new compounds is be- coming more important. The LAMDBA UV/Vis/NIR systems are known for data integrity, sampling flexibility and ease of use. Trendsetting features in- clude snap-in modules, innovative accessories and intuitive software im- proving efficiencies, ver- satility and productivity. Delivering reliable data on the most demanding appli- cations has seen ad- vances in testing capabili- ties, whether it is measur- ing the absolute reflec- tance of coatings at vari- ous angles with our LAMBDA® 950 or analyz- ing highly absorbing liq- uids with the LAMBDA 850. The new LAMBDA 1050 redefines the range of capabilities by providing a better level of sensitivity, resolution and scanning speed in the NIR range. This opens up a whole new world of quality con- trol, product improvement and discovery for indus- tries and applications. Examples include: High Absorbing Glass From cockpit and automo- tive windshields to laser protection shields to safety eyewear and head- gear. Studies can look deeper, at far higher reso- lutions. Optical Coatings Optical companies have more flexibility when measuring coatings in the NIR range in order to im- prove the quality of their products. Vol. 2 2008 MATERIAL VISION In the Next Edition • Reflectance • FT-IR UATR • TGA Inside this issue: UV/Vis/NIR Focuses on Environmental Change Check out the Webcast links, workshop and events 1 UV/Vis Sampling of Optical Filters 2 High Absorbance Scanning using UV/Vis 4 FT-IR Transmission Sampling—Part 2 6 DSC Sampling Techniques 8 Industrial Update 12 Service Corner - Spectroscopy 13 Service Corner - Thermal Analysis 13 UV/Vis/NIR Focuses on Environmental Change Dear Customer, Thank you for your continued interest in Material Vision. We are pleased to welcome you to the latest edition where topics related to UV/Vis, FT-IR/Raman and Thermal Analysis are discussed under the following three themes - Sampling Techniques, Operating Variables and Evaluations. Examples are given highlighting guidelines on how to get the best results from your systems. Case Studies If you have an interesting case study and would like to share it with others we would be happy to feature it.
Transcript of Material Vision - Summer 2007 - PerkinElmer · resolution and scanning ... MATERIAL VISION In the...
Fiber Optic Filters
For narrow band optical filters the LAMBDA 1050 can provide the necessary wavelength separation needed to ensure quality or detect areas of im-provement.
Architectural Glass Coatings and Com-pounds
As more architectural glass is being coated or made with laminated ma-terials, the need for an instrument that can meas-ure varying and innovative new compounds is be-coming more important.
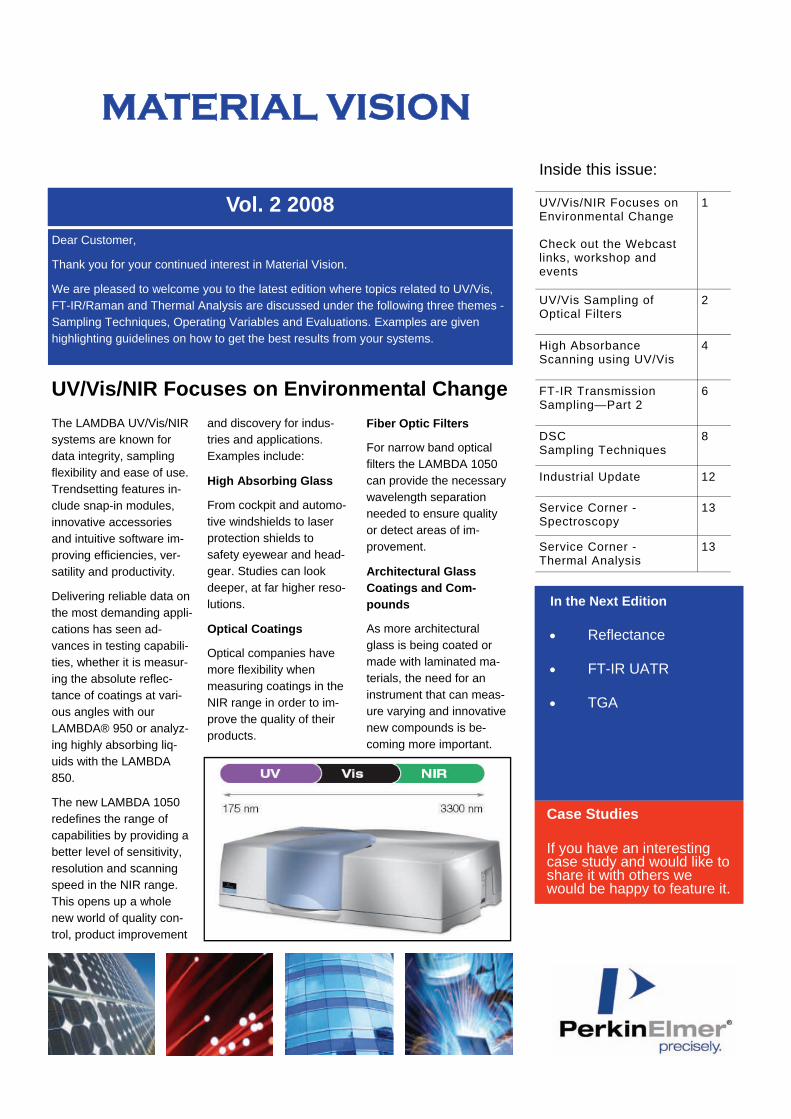
The LAMDBA UV/Vis/NIR systems are known for data integrity, sampling flexibility and ease of use. Trendsetting features in-clude snap-in modules, innovative accessories and intuitive software im-proving efficiencies, ver-satility and productivity.
Delivering reliable data on the most demanding appli-cations has seen ad-vances in testing capabili-ties, whether it is measur-ing the absolute reflec-tance of coatings at vari-ous angles with our LAMBDA® 950 or analyz-ing highly absorbing liq-uids with the LAMBDA 850.
The new LAMBDA 1050 redefines the range of capabilities by providing a better level of sensitivity, resolution and scanning speed in the NIR range. This opens up a whole new world of quality con-trol, product improvement
and discovery for indus-tries and applications. Examples include:
High Absorbing Glass
From cockpit and automo-tive windshields to laser protection shields to safety eyewear and head-gear. Studies can look deeper, at far higher reso-lutions.
Optical Coatings
Optical companies have more flexibility when measuring coatings in the NIR range in order to im-prove the quality of their products.
Vol. 2 2008
MATERIAL VISION
In the Next Edition
• Reflectance
• FT-IR UATR
• TGA
Inside this issue:
UV/Vis/NIR Focuses on Environmental Change Check out the Webcast links, workshop and events
1
UV/Vis Sampling of Optical Filters
2
High Absorbance Scanning using UV/Vis
4
FT-IR Transmission Sampling—Part 2
6
DSC Sampling Techniques
8
Industrial Update 12
Service Corner -Spectroscopy
13
Service Corner - Thermal Analysis
13
UV/Vis/NIR Focuses on Environmental Change
Dear Customer,
Thank you for your continued interest in Material Vision.
We are pleased to welcome you to the latest edition where topics related to UV/Vis, FT-IR/Raman and Thermal Analysis are discussed under the following three themes - Sampling Techniques, Operating Variables and Evaluations. Examples are given highlighting guidelines on how to get the best results from your systems.
Case Studies
If you have an interesting case study and would like to share it with others we would be happy to feature it.

2
UV/Vis Sampling Techniques
Transmission mode
Angle of incidence
Polarization effects
Three detector systems
Resolution
Slit resolution
The most common meas-urement for optical filter quality testing is done in transmission mode with the results typically dis-played in %T. The meas-urement may be per-formed at any angle of incidence required by the filter design. The angle of incidence light used can range from normal to greater than 60˚ with 45˚ being one of the most common requirements.
When measurements are to be performed at angles other than normal, typi-cally considered to be between 5˚- 8˚, polariza-tion affects need to be considered.
Modern high performance spectrophotometers use reflective gratings to dis-perse the source energy into specific wavelengths. This process will create strongly polarized light which will be used for
sample analysis.
To achieve the truest re-sults a depolarizer should be used at angles higher than 8˚ to measure a sam-ple under random polari-zation conditions. If spe-cific angles of polarization are required by the analy-sis, a polarizer will allow the specific angle of po-larization to be measured. This could range from S to P polarization or any an-gle between.
UV/Vis Sampling of Optical Filters
Operating Variables across the entire wave-length range of the instru-ment, 175-3300 nm.
In determining the best method for the analysis of a specific filter several factors need to be consid-ered. The design specifi-cation will provide the majority of the information necessary for a spectro-scopic analysis.
Wavelength range, band-pass, transmission and out of band blocking will all be defined and need to be taken into considera-tion.
Measuring a laser band-
pass filter with a center wavelength of 1064 nm and a bandpass of 1 nm is a common requirement. A filter of this type will re-quire slit resolution of 0.25 nm to achieve sufficient resolution to determine its characteristics.
The LAMBDA 1050 using an InGaAs detector in the NIR region allows both high resolution and wider photodynamic range im-proving both signal-to-noise and speed of analy-sis over a conventional PbS detector. A typical setup display is shown below.
Optical filters have many functions, including color correction, used to im-prove color balance in many optical systems, to neutral density filters that produce specific reduction in the level of transmitted light.
Thin film filters used in laser based systems have more demanding require-ments typically requiring very narrow bandpass and very high out-of-band blocking.
The LAMBDA® 1050 utilizes three detectors for optimum energy detection

www.perkinelmer.com 3
UV/Vis Operating Variables:
Baseline
Signal to Noise Ratio
NIR detectors
Fast scanning speeds
the same filter measured on a typical spectropho-tometer using a PbS (Lead Sulfide) detector in the NIR region. Poor sig-nal-to-noise is due to low sensitivity of the detector at very high resolution.
The addition of an InGaAs NIR detector allows meas-urements at high resolu-tion in the NIR region with excellent signal-to-noise performance. In addition measurements in the sub
With the proper selection of operating parameters completed and baseline data acquired, sample measurement can now be performed.
The first figure below shows the typical re-sponse of a laser line fil-ter. Excellent signal-to-noise is seen in the spec-tra even at very high reso-lution.
The bottom figure shows
nanometer range are now possible using fixed reso-lution due to the increase in sensitivity at fast scan-ning speeds.
For full details of the LAMBDA 1050 UV/Vis/NIR spectrophotometer, a Technical Specifications sheet is available on re-quest.
Evaluations
4
In materials research there is sometimes a need to scan high absorbance samples such as laser protection lenses, optical filters, and polarization materials. Such sample types often need to be measured across the whole UV, Vis, and NIR ranges of the electromag-netic spectrum.
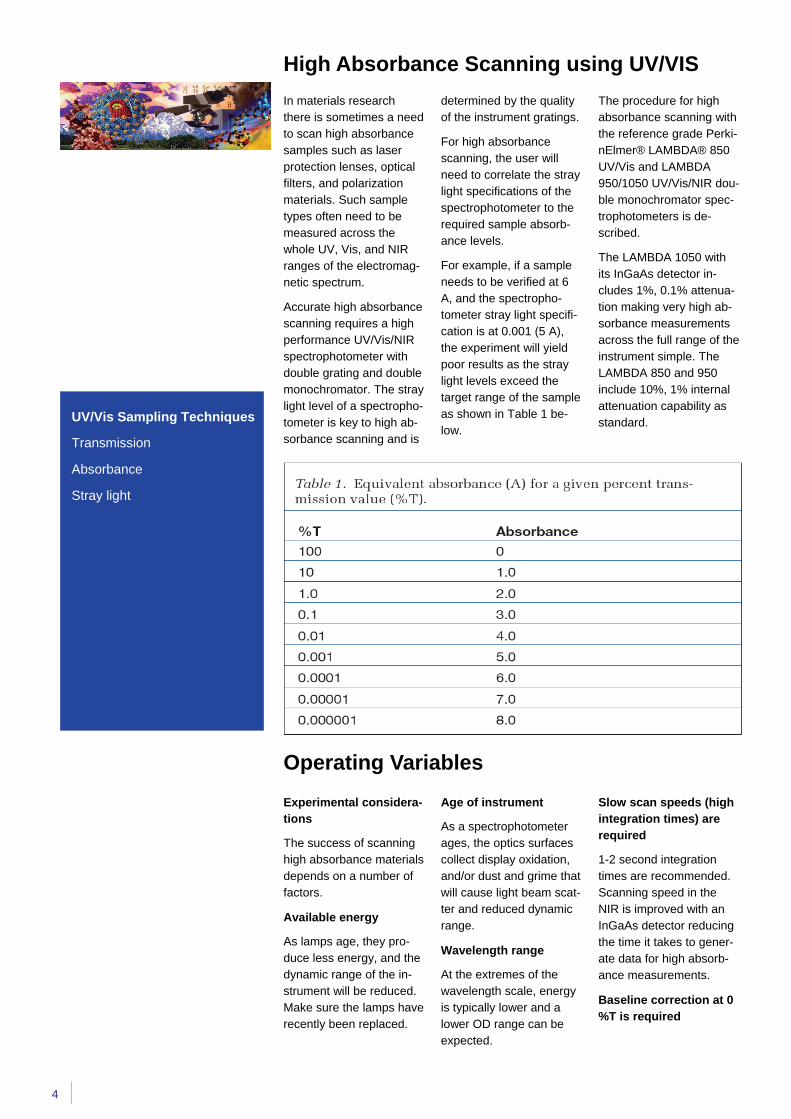
Accurate high absorbance scanning requires a high performance UV/Vis/NIR spectrophotometer with double grating and double monochromator. The stray light level of a spectropho-tometer is key to high ab-sorbance scanning and is
determined by the quality of the instrument gratings.
For high absorbance scanning, the user will need to correlate the stray light specifications of the spectrophotometer to the required sample absorb-ance levels.
For example, if a sample needs to be verified at 6 A, and the spectropho-tometer stray light specifi-cation is at 0.001 (5 A), the experiment will yield poor results as the stray light levels exceed the target range of the sample as shown in Table 1 be-low.
The procedure for high absorbance scanning with the reference grade Perki-nElmer® LAMBDA® 850 UV/Vis and LAMBDA 950/1050 UV/Vis/NIR dou-ble monochromator spec-trophotometers is de-scribed.
The LAMBDA 1050 with its InGaAs detector in-cludes 1%, 0.1% attenua-tion making very high ab-sorbance measurements across the full range of the instrument simple. The LAMBDA 850 and 950 include 10%, 1% internal attenuation capability as standard.
High Absorbance Scanning using UV/VIS
Operating Variables Age of instrument
As a spectrophotometer ages, the optics surfaces collect display oxidation, and/or dust and grime that will cause light beam scat-ter and reduced dynamic range.
Wavelength range
At the extremes of the wavelength scale, energy is typically lower and a lower OD range can be expected.
Slow scan speeds (high integration times) are required
1-2 second integration times are recommended. Scanning speed in the NIR is improved with an InGaAs detector reducing the time it takes to gener-ate data for high absorb-ance measurements.
Baseline correction at 0 %T is required
Experimental considera-tions
The success of scanning high absorbance materials depends on a number of factors.
Available energy
As lamps age, they pro-duce less energy, and the dynamic range of the in-strument will be reduced. Make sure the lamps have recently been replaced.
UV/Vis Sampling Techniques
Transmission
Absorbance
Stray light

www.perkinelmer.com 5
The addition of an InGaAs detector in the NIR region will greatly improve the measurement of high ab-sorbance materials and will allow less demanding samples to be scanned at much higher speeds with better signal to noise per-formance.
Pitfalls to watch for
If the sample is not reach-ing the optical density expected, consider a num-ber of factors:
Measuring absorbance between 6A and 8A de-mands a clear sample. The smallest haze or scat-ter present in the sample will degrade the optical density.
Ideally, the sample should have perfectly parallel surfaces. If a sample has some curvature, position it at its flattest spot.
The figure below high-lights the benefit of using reference beam attenua-tion. Didymium filters of increasing absorbance were measured, with and without reference beam attenuation. With attenua-tion, the peak at 525 nm can be accurately quanti-fied. Otherwise, noise is observed in this range.
The LAMBDA 1050 with its improved performance in the NIR range can pro-vide high absorbance NIR measurements not possi-ble with a conventional Lead Sulfide (PbS) detec-tor alone. Typically a spectrophotometer equipped with just a PbS detector scanning at very long integration times on the order of 6-10 seconds per data point can achieve approximately 6A in the NIR range.
Any beam displacement on the detector can cause the optical density to be degraded. If possible, do not measure at the edges of the sample, where beam aberrations can occur.
Increasing the level of reference attenuation does not increase optical density of a sample.
Increasing reference at-tenuation lowers the noise level and increases preci-sion of the measurement. It is, however, possible to over-attenuate the refer-ence beam energy and prevent enough light to calculate a reference sig-nal. Generally, it is not recommended to exceed a total attenuation of 4 A, but where circumstances require, the results should be carefully validated.
Evaluations
UV/Vis Operating Variables:
Available energy
Age of instrument
Wavelength range
Slow scan speeds
Baseline correction
Wider bandpasses
Reference beam attenuation
measurement.
Supplemental reference beam attenuation may be required
Attaining absorbance lev-els in excess of 8 A may require additional mag-netic screens.
The standard instrument detector is required
For high absorbance measurements, the optical
Use of wider band-passes is recommended
Allowing the highest en-ergy throughput for a given measurement is always best practice. However, using higher resolution for a measure-ment than the sample type or specification required only adds to the time nec-essary to generate data with no value added to the
detector unit of the basic spectrophotometer is rec-ommended in most cases.
Reference beam at-tenuation
For high absorbance measurements, reference beam attenuation is al-most always needed. Ad-ditional attenuation screens can be added if a particular response is needed.
6
FT-IR Sampling Techniques
Solid Analysis
Liquid Analysis
Gas Analysis
Pathlength
Detection Limits
When using FT-IR the single most important pa-rameter is understanding the nature of your sample.
FT-IR sampling is based on whether your samples are:
• Solid, liquid or gas
• Film or Powder
• Major or minor components
• Size and thickness
• Contaminates
• Amount of samples
Transmission Cells
Solid Samples
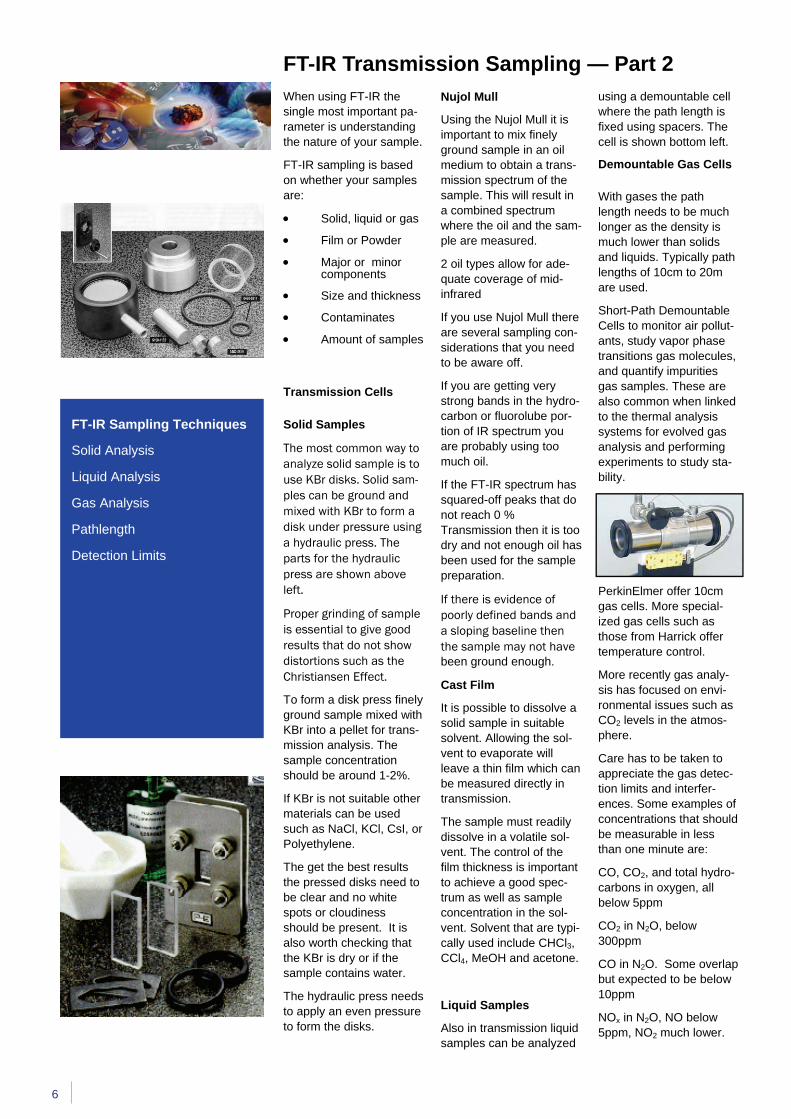
The most common way to analyze solid sample is to use KBr disks. Solid sam-ples can be ground and mixed with KBr to form a disk under pressure using a hydraulic press. The parts for the hydraulic press are shown above left.
Proper grinding of sample is essential to give good results that do not show distortions such as the Christiansen Effect.
To form a disk press finely ground sample mixed with KBr into a pellet for trans-mission analysis. The sample concentration should be around 1-2%.
If KBr is not suitable other materials can be used such as NaCl, KCl, CsI, or Polyethylene.
The get the best results the pressed disks need to be clear and no white spots or cloudiness should be present. It is also worth checking that the KBr is dry or if the sample contains water.
The hydraulic press needs to apply an even pressure to form the disks.
Nujol Mull
Using the Nujol Mull it is important to mix finely ground sample in an oil medium to obtain a trans-mission spectrum of the sample. This will result in a combined spectrum where the oil and the sam-ple are measured.
2 oil types allow for ade-quate coverage of mid-infrared
If you use Nujol Mull there are several sampling con-siderations that you need to be aware off.
If you are getting very strong bands in the hydro-carbon or fluorolube por-tion of IR spectrum you are probably using too much oil.
If the FT-IR spectrum has squared-off peaks that do not reach 0 %Transmission then it is too dry and not enough oil has been used for the sample preparation.
If there is evidence of poorly defined bands and a sloping baseline then the sample may not have been ground enough.
Cast Film
It is possible to dissolve a solid sample in suitable solvent. Allowing the sol-vent to evaporate will leave a thin film which can be measured directly in transmission.
The sample must readily dissolve in a volatile sol-vent. The control of the film thickness is important to achieve a good spec-trum as well as sample concentration in the sol-vent. Solvent that are typi-cally used include CHCl3, CCl4, MeOH and acetone.
Liquid Samples
Also in transmission liquid samples can be analyzed
using a demountable cell where the path length is fixed using spacers. The cell is shown bottom left.
Demountable Gas Cells
With gases the path length needs to be much longer as the density is much lower than solids and liquids. Typically path lengths of 10cm to 20m are used.
Short-Path Demountable Cells to monitor air pollut-ants, study vapor phase transitions gas molecules, and quantify impurities gas samples. These are also common when linked to the thermal analysis systems for evolved gas analysis and performing experiments to study sta-bility.
PerkinElmer offer 10cm gas cells. More special-ized gas cells such as those from Harrick offer temperature control.
More recently gas analy-sis has focused on envi-ronmental issues such as CO2 levels in the atmos-phere.
Care has to be taken to appreciate the gas detec-tion limits and interfer-ences. Some examples of concentrations that should be measurable in less than one minute are:
CO, CO2, and total hydro-carbons in oxygen, all below 5ppm
CO2 in N2O, below 300ppm
CO in N2O. Some overlap but expected to be below 10ppm
NOx in N2O, NO below 5ppm, NO2 much lower.
FT-IR Transmission Sampling — Part 2
The transmission spec-trum can be analyzed in several ways.
Peaks
The first is to process the data and highlight all peaks. In the setup the peak threshold can be selected for detection lim-its.
Compare
This function can be used to review the data against know standards. The cor-relation highlights how close the match is to the standard material.
Curve Interpretation
The process of interactive interpretation gives users an indication of the possi-ble molecular structures from the information pre-sent and absent on the spectra. Using this infor-mation along with further details on absorption bands and complimentary analytical techniques helps to characterize the material in full.
Transmission Evaluations
Transmission Operating Variables
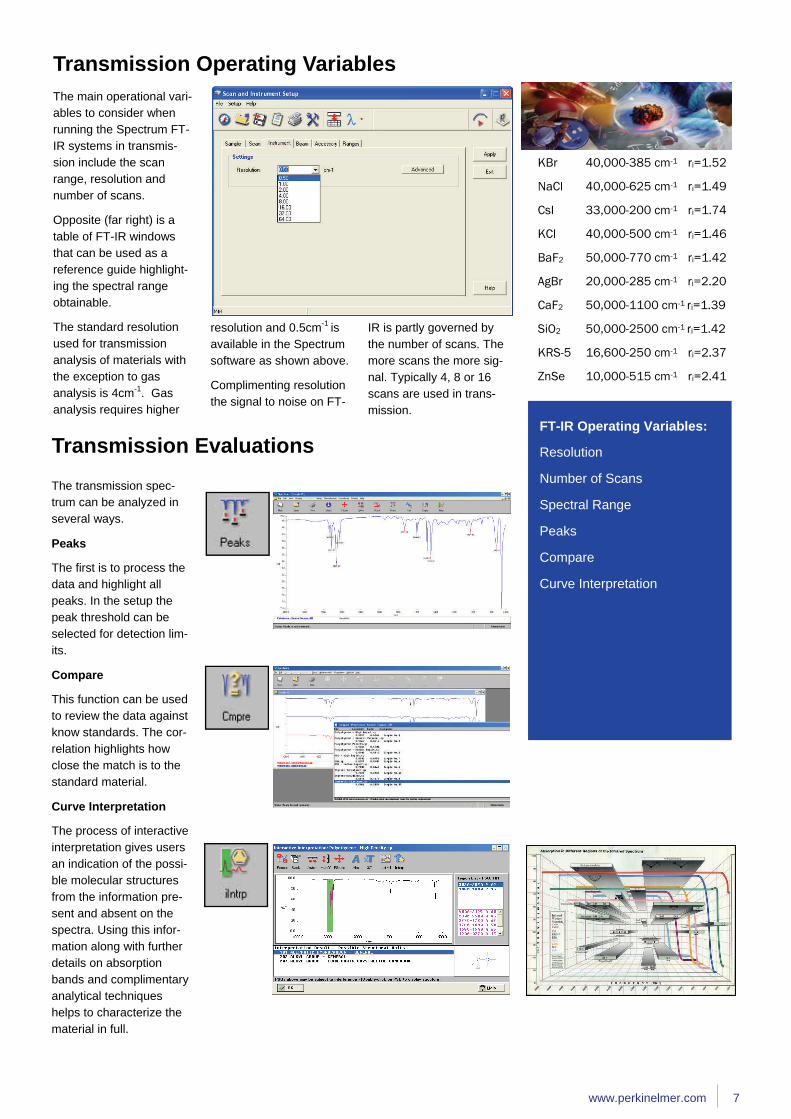
resolution and 0.5cm-1 is available in the Spectrum software as shown above.
Complimenting resolution the signal to noise on FT-
IR is partly governed by the number of scans. The more scans the more sig-nal. Typically 4, 8 or 16 scans are used in trans-mission.
The main operational vari-ables to consider when running the Spectrum FT-IR systems in transmis-sion include the scan range, resolution and number of scans.
Opposite (far right) is a table of FT-IR windows that can be used as a reference guide highlight-ing the spectral range obtainable.
The standard resolution used for transmission analysis of materials with the exception to gas analysis is 4cm-1. Gas analysis requires higher
www.perkinelmer.com 7
FT-IR Operating Variables:
Resolution
Number of Scans
Spectral Range
Peaks
Compare
Curve Interpretation
KBr 40,000-385 cm-1 ri=1.52
NaCl 40,000-625 cm-1 ri=1.49
CsI 33,000-200 cm-1 ri=1.74
KCl 40,000-500 cm-1 ri=1.46
BaF2 50,000-770 cm-1 ri=1.42
AgBr 20,000-285 cm-1 ri=2.20
CaF2 50,000-1100 cm-1 ri=1.39
SiO2 50,000-2500 cm-1 ri=1.42
KRS-5 16,600-250 cm-1 ri=2.37
ZnSe 10,000-515 cm-1 ri=2.41
8
DSC Sampling Techniques
Good sample contact
Reduce thermal gradients
Sample density
Minimum sample mass
Atmosphere
Crucible Selection
There are many consid-eration that have to be made before running a DSC experiment. With the correct sample prepara-tion and careful selection of operating variables good results can be ob-tained.
With DSC the main objec-tive should always be to obtain the best possible contact between the sam-ple and the base of the pan. This will reduce ther-mal gradients which are observed more in heat flux systems compared to that of power compensation.
The results obtained should be well defined sharp peaks. This will help increase the reproducibil-ity of the test as well as help with the interpretation of close or even overlap-ping peaks.
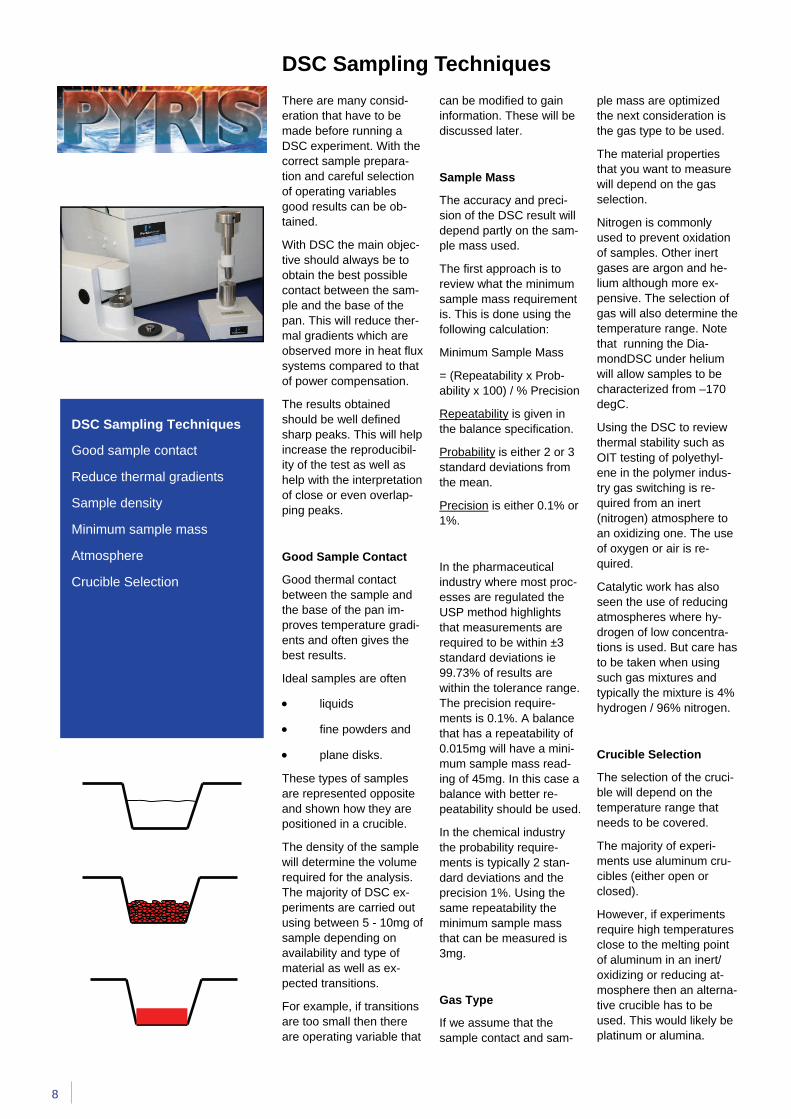
Good Sample Contact
Good thermal contact between the sample and the base of the pan im-proves temperature gradi-ents and often gives the best results.
Ideal samples are often
• liquids
• fine powders and
• plane disks.
These types of samples are represented opposite and shown how they are positioned in a crucible.
The density of the sample will determine the volume required for the analysis. The majority of DSC ex-periments are carried out using between 5 - 10mg of sample depending on availability and type of material as well as ex-pected transitions.
For example, if transitions are too small then there are operating variable that
can be modified to gain information. These will be discussed later.
Sample Mass
The accuracy and preci-sion of the DSC result will depend partly on the sam-ple mass used.
The first approach is to review what the minimum sample mass requirement is. This is done using the following calculation:
Minimum Sample Mass
= (Repeatability x Prob-ability x 100) / % Precision
Repeatability is given in the balance specification.
Probability is either 2 or 3 standard deviations from the mean.
Precision is either 0.1% or 1%.
In the pharmaceutical industry where most proc-esses are regulated the USP method highlights that measurements are required to be within ±3 standard deviations ie 99.73% of results are within the tolerance range. The precision require-ments is 0.1%. A balance that has a repeatability of 0.015mg will have a mini-mum sample mass read-ing of 45mg. In this case a balance with better re-peatability should be used.
In the chemical industry the probability require-ments is typically 2 stan-dard deviations and the precision 1%. Using the same repeatability the minimum sample mass that can be measured is 3mg.
Gas Type
If we assume that the sample contact and sam-
ple mass are optimized the next consideration is the gas type to be used.
The material properties that you want to measure will depend on the gas selection.
Nitrogen is commonly used to prevent oxidation of samples. Other inert gases are argon and he-lium although more ex-pensive. The selection of gas will also determine the temperature range. Note that running the Dia-mondDSC under helium will allow samples to be characterized from –170 degC.
Using the DSC to review thermal stability such as OIT testing of polyethyl-ene in the polymer indus-try gas switching is re-quired from an inert (nitrogen) atmosphere to an oxidizing one. The use of oxygen or air is re-quired.
Catalytic work has also seen the use of reducing atmospheres where hy-drogen of low concentra-tions is used. But care has to be taken when using such gas mixtures and typically the mixture is 4% hydrogen / 96% nitrogen.
Crucible Selection
The selection of the cruci-ble will depend on the temperature range that needs to be covered.
The majority of experi-ments use aluminum cru-cibles (either open or closed).
However, if experiments require high temperatures close to the melting point of aluminum in an inert/oxidizing or reducing at-mosphere then an alterna-tive crucible has to be used. This would likely be platinum or alumina.
DSC Sampling Techniques
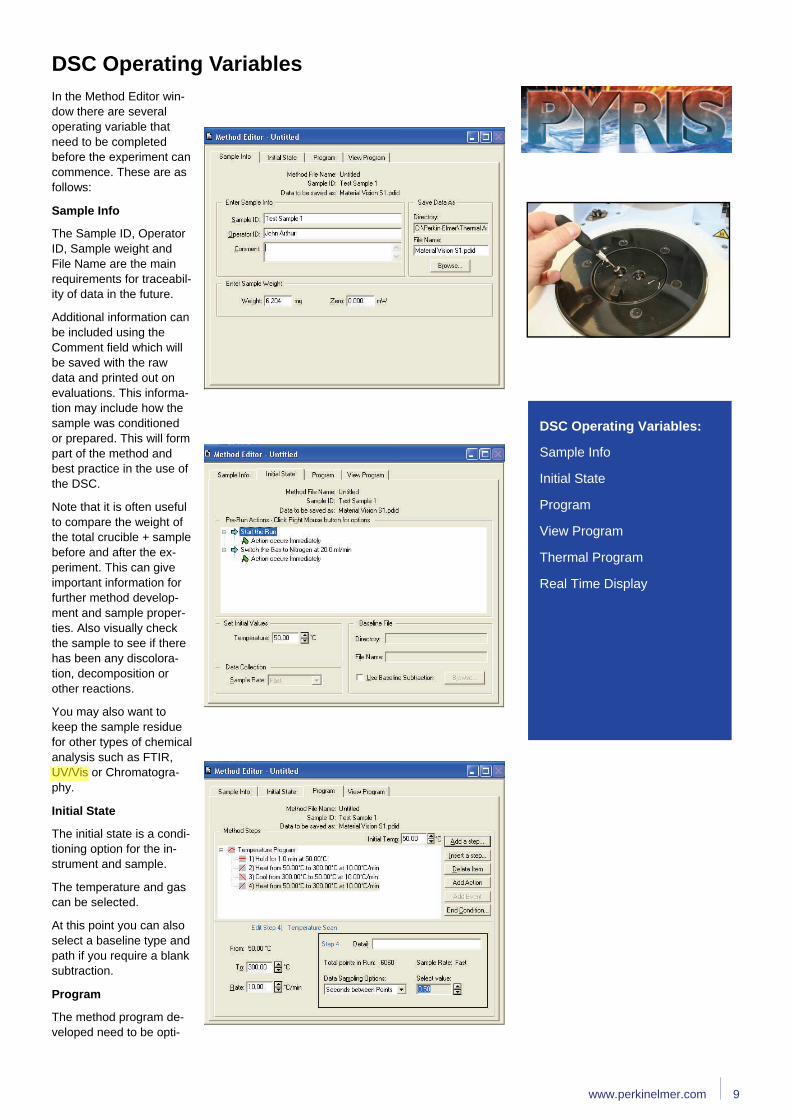
DSC Operating Variables In the Method Editor win-dow there are several operating variable that need to be completed before the experiment can commence. These are as follows:
Sample Info
The Sample ID, Operator ID, Sample weight and File Name are the main requirements for traceabil-ity of data in the future.
Additional information can be included using the Comment field which will be saved with the raw data and printed out on evaluations. This informa-tion may include how the sample was conditioned or prepared. This will form part of the method and best practice in the use of the DSC.
Note that it is often useful to compare the weight of the total crucible + sample before and after the ex-periment. This can give important information for further method develop-ment and sample proper-ties. Also visually check the sample to see if there has been any discolora-tion, decomposition or other reactions.
You may also want to keep the sample residue for other types of chemical analysis such as FTIR, UV/Vis or Chromatogra-phy.
Initial State
The initial state is a condi-tioning option for the in-strument and sample.
The temperature and gas can be selected.
At this point you can also select a baseline type and path if you require a blank subtraction.
Program
The method program de-veloped need to be opti-
DSC Operating Variables:
Sample Info
Initial State
Program
View Program
Thermal Program
Real Time Display
www.perkinelmer.com 9
rothweem
Highlight
mized to produce the best possible data.
The main factors that need to be considered include:
• Type of sample—organic or inorganic
• Temperature Range
• Gases
• Sample Mass
• Heating Rate or Iso-thermal investigations
• Thermal history - cyclic experiments
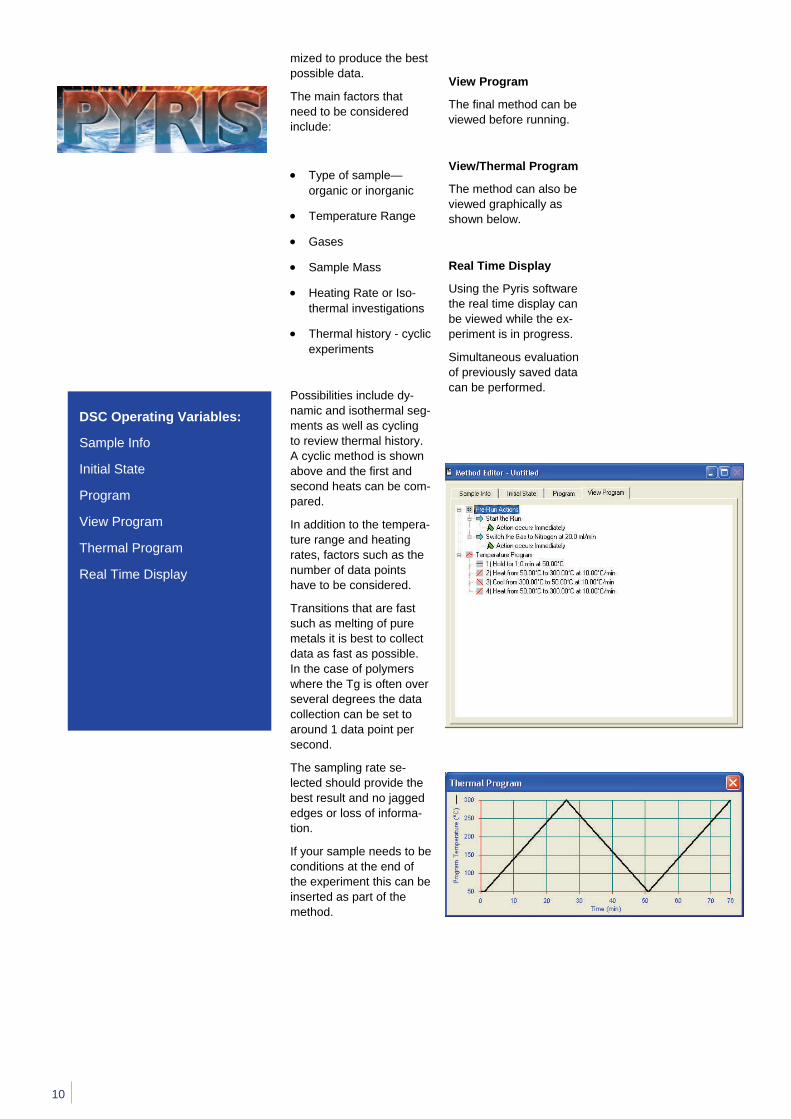
Possibilities include dy-namic and isothermal seg-ments as well as cycling to review thermal history. A cyclic method is shown above and the first and second heats can be com-pared.
In addition to the tempera-ture range and heating rates, factors such as the number of data points have to be considered.
Transitions that are fast such as melting of pure metals it is best to collect data as fast as possible. In the case of polymers where the Tg is often over several degrees the data collection can be set to around 1 data point per second.
The sampling rate se-lected should provide the best result and no jagged edges or loss of informa-tion.
If your sample needs to be conditions at the end of the experiment this can be inserted as part of the method.
View Program
The final method can be viewed before running.
View/Thermal Program
The method can also be viewed graphically as shown below.
Real Time Display
Using the Pyris software the real time display can be viewed while the ex-periment is in progress.
Simultaneous evaluation of previously saved data can be performed.
10
DSC Operating Variables:
Sample Info
Initial State
Program
View Program
Thermal Program
Real Time Display
www.perkinelmer.com 11
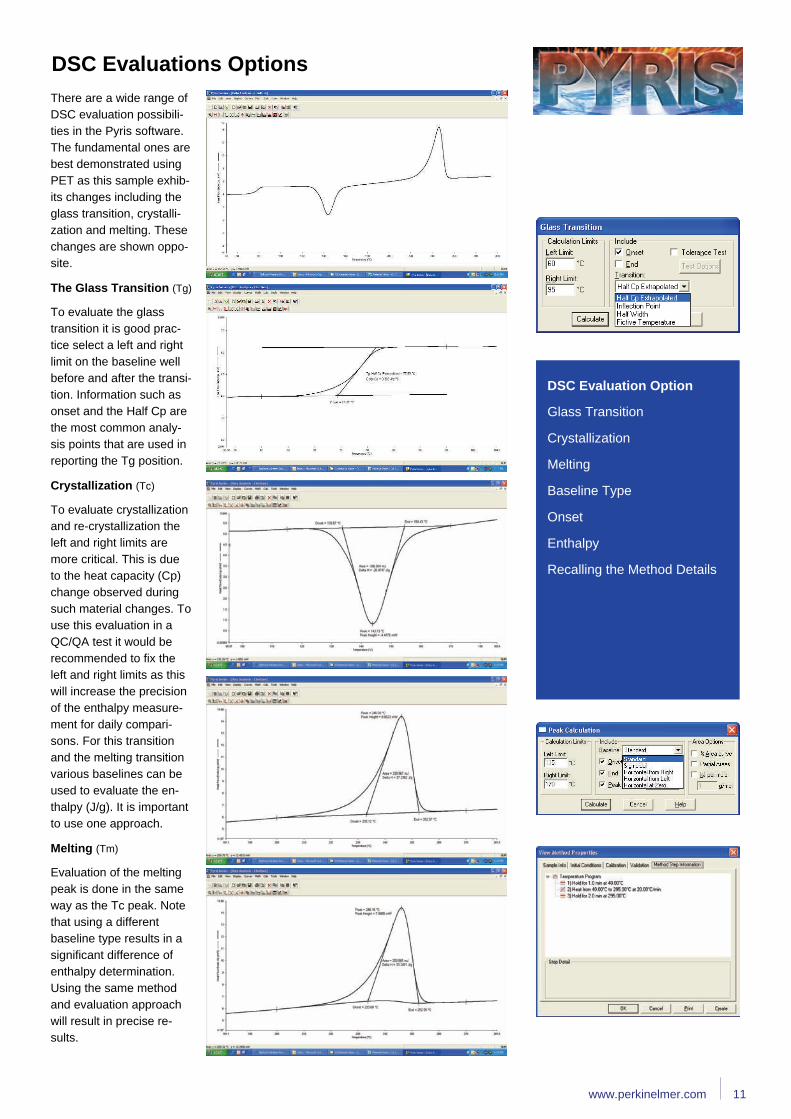
There are a wide range of DSC evaluation possibili-ties in the Pyris software. The fundamental ones are best demonstrated using PET as this sample exhib-its changes including the glass transition, crystalli-zation and melting. These changes are shown oppo-site.
The Glass Transition (Tg)
To evaluate the glass transition it is good prac-tice select a left and right limit on the baseline well before and after the transi-tion. Information such as onset and the Half Cp are the most common analy-sis points that are used in reporting the Tg position.
Crystallization (Tc)
To evaluate crystallization and re-crystallization the left and right limits are more critical. This is due to the heat capacity (Cp) change observed during such material changes. To use this evaluation in a QC/QA test it would be recommended to fix the left and right limits as this will increase the precision of the enthalpy measure-ment for daily compari-sons. For this transition and the melting transition various baselines can be used to evaluate the en-thalpy (J/g). It is important to use one approach.
Melting (Tm)
Evaluation of the melting peak is done in the same way as the Tc peak. Note that using a different baseline type results in a significant difference of enthalpy determination. Using the same method and evaluation approach will result in precise re-sults.
DSC Evaluations Options
DSC Evaluation Option
Glass Transition
Crystallization
Melting
Baseline Type
Onset
Enthalpy
Recalling the Method Details
12
Recent publications
To access all of our technical resources, visit the PerkinElmer web site at the fol-lowing address:
http://las.perkinelmer.com/TechnicalSupport/default.htm
Industrial Update
Industrial Update
Recent publications
Application Notes
Reviews

sation if a cryostat, intra-cooler or liquid nitrogen is attached. In addition, it also helps to protect the micro-balance on the TGA and STA from evolved gases that otherwise would condense out.
Some applications also require the use of oxygen for testing the stability of polyolefin's. An application note is available describ-
With all thermal analysis systems we highly recom-mend the use of flowing gas.
The majority of systems (DSC, TGA, STA and TMA) are setup with a dry nitrogen gas as an inert atmosphere as a continual purge. This helps to pro-tect the system from evolved gas during de-composition and conden-
ing the OIT measurement technique on request.
Other gases eg reducing atmosphere 4%hydrogen / 96% nitrogen can be used to study material proper-ties. Advice can be given gas types and flow rates.
The use of drying columns and suitable pressures are needed to achieve good results.
Service Corner - Thermal Analysis
Service Corner - Spectroscopy
monitor function of the Spectrum software the energy levels can be com-pared to previous levels.
For the Spectrum 100 the energy levels should be in the range:
Transmission 4000-7000
UATR 500-800
Using the microscope will result in 80% of normal instrument levels with 100 micron apertures in trans-mission and half that in reflection.
If you require further infor-mation please feel free to contact our service de-partment.
UV/Vis/NIR
Reference materials are available for the calibra-tion verification of UV/Vis and UV/Vis/NIR Spec-trometers. These help provide laboratory manag-ers with the evidence they need to pass the strictest quality audit.
A comprehensive range of certified traceable filters and sealed cuvettes allow users to generate simple protocols to verify ordinate and abscissa accuracy and stray light radiation,
Also available are diffuse reflectance standard with reflectance factors ranging from 2% to 99%.
FT-IR and FT-NIR
Desiccant
Current users of the FT-IR and FT-NIR systems should change the desic-cant every 6 months. This protects the optics and windows from atmos-pheric moisture.
Power On
It is also recommended that the instrument is left on so that the electronics remain warm.
Energy Levels
To obtain the best results from your FT-IR and FT-NIR periodic checks on the energy levels should be performed. Using the
www.perkinelmer.com 13
Service Corner
FT-IR/FT-NIR maintenance
Energy levels
Thermal analysis gases
OIT testing
rothweem
Highlight
FT-IR / FT-NIR
UV/Vis/NIR
HyperDSC
Webcast Links
PerkinElmer, Inc. 940 Winter Street Waltham, MA 02451 USA Phone: (800) 762-4000 or (+1) 203-925-4602 www.perkinelmer.com For a complete listing of our global offices, visit www.perkinelmer.com/lasoffices ©2008 PerkinElmer, Inc. All rights reserved. The PerkinElmer logo and design are registered trademarks of PerkinElmer, Inc. Pyris and Spectrum are trademarks and LAMBDA and PerkinElmer are registered trademarks of PerkinElmer, Inc. or its subsidiaries, in the United States and other countries. All other trademarks not owned by PerkinElmer, Inc. or its subsidiaries that are depicted herein are the property of their respective owners. PerkinElmer reserves the right to change this document at any time without notice and disclaims liability for editorial, pictorial or typographical errors. 008175_01

Technical Resources
http://las.perkinelmer.com/TechnicalSupport/default.htm5/13/2008 3:52:01 PM


![Elaboracion material-didactico-vision-mundial[1]](https://static.fdocuments.net/doc/165x107/558ba9e5d8b42a38568b45e2/elaboracion-material-didactico-vision-mundial1.jpg)